Black/African American vs Chilean Poverty

COMPARE

Black/African American
Race
Ancestry
AfghanAfricanAlaska NativeAlaskan AthabascanAlbanianAleutAlsatianAmericanApacheArabArapahoArgentineanArmenianAssyrian/Chaldean/SyriacAustralianAustrianBahamianBangladeshiBarbadianBasqueBelgianBelizeanBermudanBhutaneseBlackfeetBolivianBrazilianBritishBritish West IndianBulgarianBurmeseCajunCambodianCanadianCape VerdeanCarpatho RusynCelticCentral AmericanCentral American IndianCherokeeCheyenneChickasawChineseChippewaChoctawColombianColvilleComancheCosta RicanCreeCreekCroatianCrowCubanCypriotCzechCzechoslovakianDanishDelawareDominicanDutchDutch West IndianEastern EuropeanEcuadorianEgyptianEnglishEstonianEthiopianEuropeanFijianFilipinoFinnishFrenchFrench American IndianFrench CanadianGermanGerman RussianGhanaianGreekGuamanian/ChamorroGuatemalanGuyaneseHaitianHmongHonduranHopiHoumaHungarianIcelanderIndian (Asian)IndonesianInupiatIranianIraqiIrishIroquoisIsraeliItalianJamaicanJapaneseJordanianKenyanKiowaKoreanLaotianLatvianLebaneseLiberianLithuanianLumbeeLuxembourgerMacedonianMalaysianMalteseMarshalleseMenomineeMexicanMexican American IndianMongolianMoroccanNative HawaiianNavajoNepaleseNew ZealanderNicaraguanNigerianNorthern EuropeanNorwegianOkinawanOsageOttawaPaiutePakistaniPalestinianPanamanianParaguayanPennsylvania GermanPeruvianPimaPolishPortuguesePotawatomiPuebloPuerto RicanPuget Sound SalishRomanianRussianSalvadoranSamoanScandinavianScotch-IrishScottishSeminoleSenegaleseSerbianShoshoneSierra LeoneanSiouxSlavicSlovakSloveneSomaliSouth AfricanSouth AmericanSouth American IndianSoviet UnionSpaniardSpanishSpanish AmericanSpanish American IndianSri LankanSubsaharan AfricanSudaneseSwedishSwissSyrianTaiwaneseThaiTlingit-HaidaTohono O'OdhamTonganTrinidadian and TobagonianTsimshianTurkishU.S. Virgin IslanderUgandanUkrainianUruguayanUteVenezuelanVietnameseWelshWest IndianYakamaYaquiYugoslavianYumanYup'ikZimbabwean
Immigration
NonimmigrantsImmigrantsAfghanistanAfricaAlbaniaArgentinaArmeniaAsiaAustraliaAustriaBahamasBangladeshBarbadosBelarusBelgiumBelizeBoliviaBosnia and HerzegovinaBrazilBulgariaBurma/MyanmarCabo VerdeCambodiaCameroonCanadaCaribbeanCentral AmericaChileChinaColombiaCongoCosta RicaCroatiaCubaCzechoslovakiaDenmarkDominicaDominican RepublicEastern AfricaEastern AsiaEastern EuropeEcuadorEgyptEl SalvadorEnglandEritreaEthiopiaEuropeFijiFranceGermanyGhanaGreeceGrenadaGuatemalaGuyanaHaitiHondurasHong KongHungaryIndiaIndonesiaIranIraqIrelandIsraelItalyJamaicaJapanJordanKazakhstanKenyaKoreaKuwaitLaosLatin AmericaLatviaLebanonLiberiaLithuaniaMalaysiaMexicoMicronesiaMiddle AfricaMoldovaMoroccoNepalNetherlandsNicaraguaNigeriaNorth AmericaNorth MacedoniaNorthern AfricaNorthern EuropeNorwayOceaniaPakistanPanamaPeruPhilippinesPolandPortugalRomaniaRussiaSaudi ArabiaScotlandSenegalSerbiaSierra LeoneSingaporeSomaliaSouth AfricaSouth AmericaSouth Central AsiaSouth Eastern AsiaSouthern EuropeSpainSri LankaSt. Vincent and the GrenadinesSudanSwedenSwitzerlandSyriaTaiwanThailandTrinidad and TobagoTurkeyUgandaUkraineUruguayUzbekistanVenezuelaVietnamWest IndiesWestern AfricaWestern AsiaWestern EuropeYemenZaireZimbabweAzores
Chilean
Race
Ancestry
AfghanAfricanAlaska NativeAlaskan AthabascanAlbanianAleutAlsatianAmericanApacheArabArapahoArgentineanArmenianAssyrian/Chaldean/SyriacAustralianAustrianBahamianBangladeshiBarbadianBasqueBelgianBelizeanBermudanBhutaneseBlackfeetBolivianBrazilianBritishBritish West IndianBulgarianBurmeseCajunCambodianCanadianCape VerdeanCarpatho RusynCelticCentral AmericanCentral American IndianCherokeeCheyenneChickasawChileanChineseChippewaChoctawColombianColvilleComancheCosta RicanCreeCreekCroatianCrowCubanCypriotCzechCzechoslovakianDanishDelawareDominicanDutchDutch West IndianEastern EuropeanEcuadorianEgyptianEnglishEstonianEthiopianEuropeanFijianFilipinoFinnishFrenchFrench American IndianFrench CanadianGermanGerman RussianGhanaianGreekGuamanian/ChamorroGuatemalanGuyaneseHaitianHmongHonduranHopiHoumaHungarianIcelanderIndian (Asian)IndonesianInupiatIranianIraqiIrishIroquoisIsraeliItalianJamaicanJapaneseJordanianKenyanKiowaKoreanLaotianLatvianLebaneseLiberianLithuanianLumbeeLuxembourgerMacedonianMalaysianMalteseMarshalleseMenomineeMexicanMexican American IndianMongolianMoroccanNative HawaiianNavajoNepaleseNew ZealanderNicaraguanNigerianNorthern EuropeanNorwegianOkinawanOsageOttawaPaiutePakistaniPalestinianPanamanianParaguayanPennsylvania GermanPeruvianPimaPolishPortuguesePotawatomiPuebloPuerto RicanPuget Sound SalishRomanianRussianSalvadoranSamoanScandinavianScotch-IrishScottishSeminoleSenegaleseSerbianShoshoneSierra LeoneanSiouxSlavicSlovakSloveneSomaliSouth AfricanSouth AmericanSouth American IndianSoviet UnionSpaniardSpanishSpanish AmericanSpanish American IndianSri LankanSubsaharan AfricanSudaneseSwedishSwissSyrianTaiwaneseThaiTlingit-HaidaTohono O'OdhamTonganTrinidadian and TobagonianTsimshianTurkishU.S. Virgin IslanderUgandanUkrainianUruguayanUteVenezuelanVietnameseWelshWest IndianYakamaYaquiYugoslavianYumanYup'ikZimbabwean
Immigration
NonimmigrantsImmigrantsAfghanistanAfricaAlbaniaArgentinaArmeniaAsiaAustraliaAustriaBahamasBangladeshBarbadosBelarusBelgiumBelizeBoliviaBosnia and HerzegovinaBrazilBulgariaBurma/MyanmarCabo VerdeCambodiaCameroonCanadaCaribbeanCentral AmericaChileChinaColombiaCongoCosta RicaCroatiaCubaCzechoslovakiaDenmarkDominicaDominican RepublicEastern AfricaEastern AsiaEastern EuropeEcuadorEgyptEl SalvadorEnglandEritreaEthiopiaEuropeFijiFranceGermanyGhanaGreeceGrenadaGuatemalaGuyanaHaitiHondurasHong KongHungaryIndiaIndonesiaIranIraqIrelandIsraelItalyJamaicaJapanJordanKazakhstanKenyaKoreaKuwaitLaosLatin AmericaLatviaLebanonLiberiaLithuaniaMalaysiaMexicoMicronesiaMiddle AfricaMoldovaMoroccoNepalNetherlandsNicaraguaNigeriaNorth AmericaNorth MacedoniaNorthern AfricaNorthern EuropeNorwayOceaniaPakistanPanamaPeruPhilippinesPolandPortugalRomaniaRussiaSaudi ArabiaScotlandSenegalSerbiaSierra LeoneSingaporeSomaliaSouth AfricaSouth AmericaSouth Central AsiaSouth Eastern AsiaSouthern EuropeSpainSri LankaSt. Vincent and the GrenadinesSudanSwedenSwitzerlandSyriaTaiwanThailandTrinidad and TobagoTurkeyUgandaUkraineUruguayUzbekistanVenezuelaVietnamWest IndiesWestern AfricaWestern AsiaWestern EuropeYemenZaireZimbabweAzores
Poverty
Income
Poverty
Unemployment
Labor Participation
Family Structure
Vehicle Availability
Education Level
Disability

Poverty Comparison

Blacks/African Americans

Chileans

Tragic
Excellent
17.3%
POVERTY
0.0/ 100
METRIC RATING
329th/ 347
METRIC RANK
11.8%
POVERTY
84.2/ 100
METRIC RATING
136th/ 347
METRIC RANK

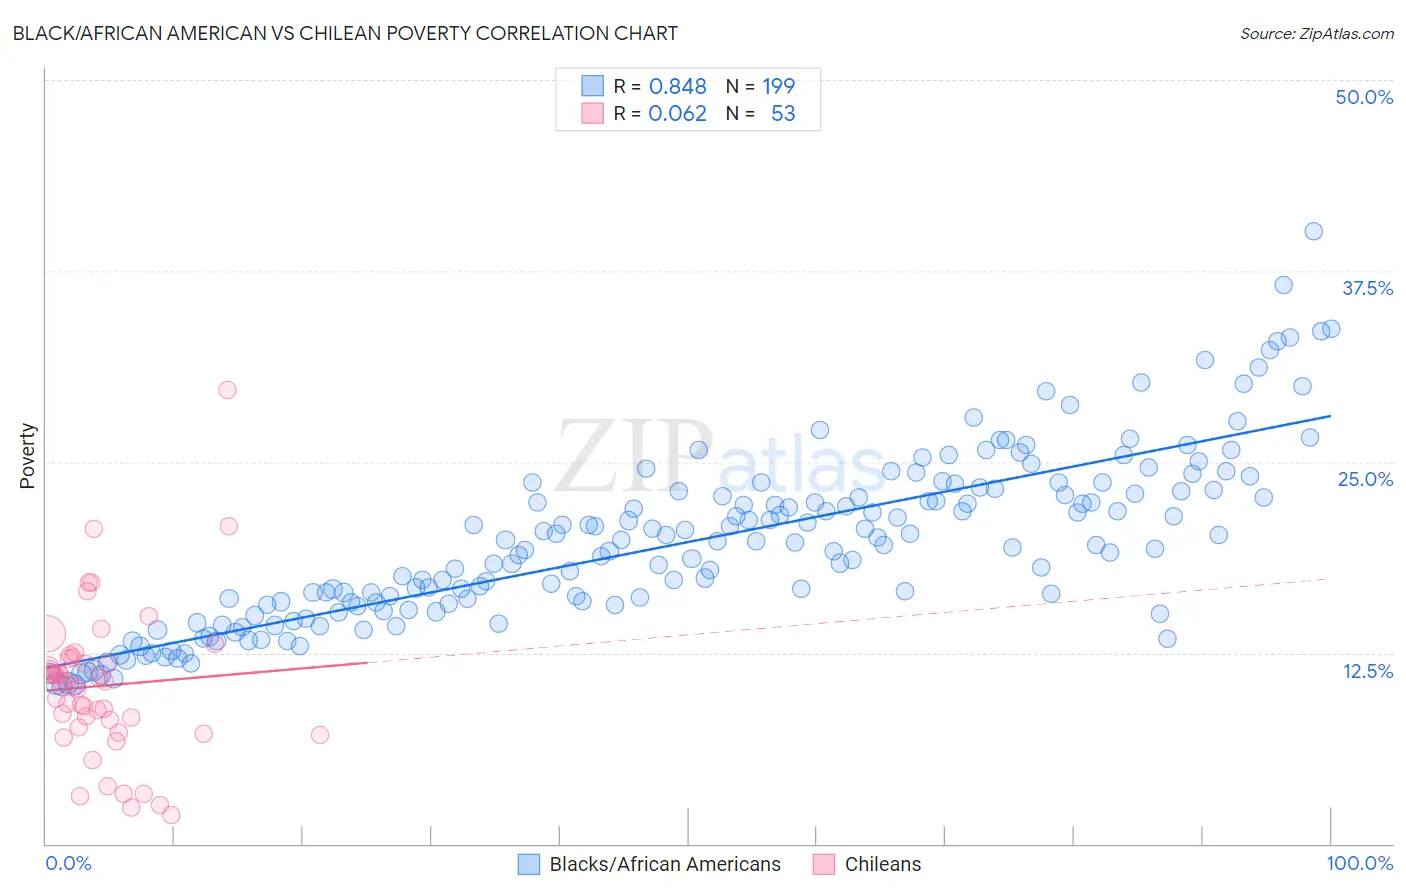
Black/African American vs Chilean Poverty Correlation Chart

The statistical analysis conducted on geographies consisting of 565,229,178 people shows a very strong positive correlation between the proportion of Blacks/African Americans and poverty level in the United States with a correlation coefficient (R) of 0.848 and weighted average of 17.3%. Similarly, the statistical analysis conducted on geographies consisting of 256,580,078 people shows a slight positive correlation between the proportion of Chileans and poverty level in the United States with a correlation coefficient (R) of 0.062 and weighted average of 11.8%, a difference of 46.0%.
Black/African American vs Chilean Poverty

Poverty Correlation Summary

MeasurementBlack/African AmericanChilean
Minimum10.3%1.9%
Maximum40.1%29.7%
Range29.8%27.8%
Mean19.7%10.3%
Median19.6%10.6%
Interquartile 25% (IQ1)15.7%7.5%
Interquartile 75% (IQ3)23.1%12.1%
Interquartile Range (IQR)7.4%4.7%
Standard Deviation (Sample)5.6%5.0%
Standard Deviation (Population)5.6%5.0%

Similar Demographics by Poverty

Demographics Similar to Blacks/African Americans by Poverty

In terms of poverty, the demographic groups most similar to Blacks/African Americans are Ute (16.9%, a difference of 2.0%), Dominican (17.6%, a difference of 2.3%), Kiowa (16.8%, a difference of 2.5%), Paiute (16.7%, a difference of 3.0%), and Immigrants from Dominican Republic (17.8%, a difference of 3.2%).
DemographicsRating | RankPoverty
Menominee
0.0
/100
|
#322
Tragic
16.4%
Colville
0.0
/100
|
#323
Tragic
16.6%
Yakama
0.0
/100
|
#324
Tragic
16.7%
Central American Indians
0.0
/100
|
#325
Tragic
16.7%
Paiute
0.0
/100
|
#326
Tragic
16.7%
Kiowa
0.0
/100
|
#327
Tragic
16.8%
Ute
0.0
/100
|
#328
Tragic
16.9%
Blacks/African Americans
0.0
/100
|
#329
Tragic
17.3%
Dominicans
0.0
/100
|
#330
Tragic
17.6%
Immigrants | Dominican Republic
0.0
/100
|
#331
Tragic
17.8%
Natives/Alaskans
0.0
/100
|
#332
Tragic
18.1%
Houma
0.0
/100
|
#333
Tragic
18.4%
Apache
0.0
/100
|
#334
Tragic
18.4%
Cheyenne
0.0
/100
|
#335
Tragic
18.9%
Pueblo
0.0
/100
|
#336
Tragic
19.4%

Demographics Similar to Chileans by Poverty

In terms of poverty, the demographic groups most similar to Chileans are Immigrants from Vietnam (11.8%, a difference of 0.19%), Yugoslavian (11.8%, a difference of 0.20%), Immigrants from Western Europe (11.8%, a difference of 0.21%), Immigrants from Switzerland (11.8%, a difference of 0.21%), and Peruvian (11.8%, a difference of 0.29%).
DemographicsRating | RankPoverty
South Africans
87.0
/100
|
#129
Excellent
11.7%
Immigrants | Ukraine
86.6
/100
|
#130
Excellent
11.8%
French
86.1
/100
|
#131
Excellent
11.8%
Peruvians
85.6
/100
|
#132
Excellent
11.8%
Immigrants | Western Europe
85.2
/100
|
#133
Excellent
11.8%
Yugoslavians
85.2
/100
|
#134
Excellent
11.8%
Immigrants | Vietnam
85.2
/100
|
#135
Excellent
11.8%
Chileans
84.2
/100
|
#136
Excellent
11.8%
Immigrants | Switzerland
83.0
/100
|
#137
Excellent
11.8%
Immigrants | Jordan
82.4
/100
|
#138
Excellent
11.9%
Pakistanis
82.2
/100
|
#139
Excellent
11.9%
Immigrants | Peru
81.1
/100
|
#140
Excellent
11.9%
Immigrants | France
80.5
/100
|
#141
Excellent
11.9%
Basques
80.4
/100
|
#142
Excellent
11.9%
Brazilians
79.7
/100
|
#143
Good
11.9%