Immigrants from Vietnam vs Chilean Householder Income Over 65 years
COMPARE
Immigrants from Vietnam
Chilean
Householder Income Over 65 years
Householder Income Over 65 years Comparison
Immigrants from Vietnam
Chileans
$63,014
HOUSEHOLDER INCOME OVER 65 YEARS
89.5/ 100
METRIC RATING
121st/ 347
METRIC RANK
$63,957
HOUSEHOLDER INCOME OVER 65 YEARS
95.8/ 100
METRIC RATING
102nd/ 347
METRIC RANK
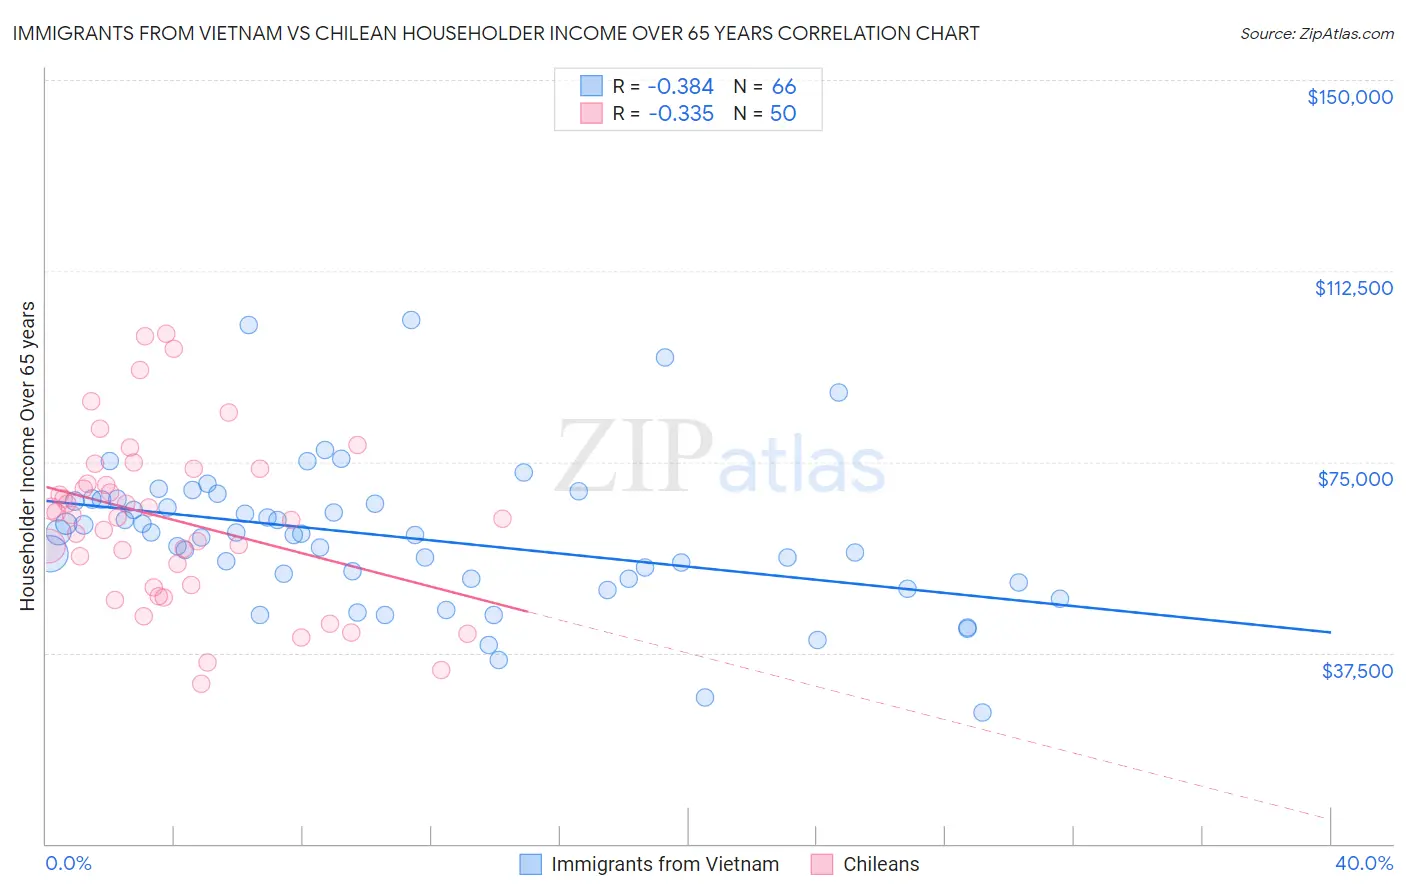
Immigrants from Vietnam vs Chilean Householder Income Over 65 years Correlation Chart
The statistical analysis conducted on geographies consisting of 403,537,097 people shows a mild negative correlation between the proportion of Immigrants from Vietnam and household income with householder over the age of 65 in the United States with a correlation coefficient (R) of -0.384 and weighted average of $63,014. Similarly, the statistical analysis conducted on geographies consisting of 256,269,150 people shows a mild negative correlation between the proportion of Chileans and household income with householder over the age of 65 in the United States with a correlation coefficient (R) of -0.335 and weighted average of $63,957, a difference of 1.5%.
Householder Income Over 65 years Correlation Summary
| Measurement | Immigrants from Vietnam | Chilean |
| Minimum | $25,692 | $31,406 |
| Maximum | $102,879 | $100,074 |
| Range | $77,187 | $68,668 |
| Mean | $60,196 | $63,656 |
| Median | $60,741 | $64,293 |
| Interquartile 25% (IQ1) | $51,982 | $50,804 |
| Interquartile 75% (IQ3) | $67,632 | $73,549 |
| Interquartile Range (IQR) | $15,650 | $22,745 |
| Standard Deviation (Sample) | $14,568 | $16,501 |
| Standard Deviation (Population) | $14,457 | $16,335 |
Demographics Similar to Immigrants from Vietnam and Chileans by Householder Income Over 65 years
In terms of householder income over 65 years, the demographic groups most similar to Immigrants from Vietnam are Ukrainian ($63,032, a difference of 0.030%), Immigrants from Jordan ($63,041, a difference of 0.040%), Danish ($63,117, a difference of 0.16%), Immigrants from Croatia ($63,168, a difference of 0.25%), and Guamanian/Chamorro ($63,187, a difference of 0.28%). Similarly, the demographic groups most similar to Chileans are British ($63,940, a difference of 0.030%), Immigrants from Cameroon ($63,907, a difference of 0.080%), Italian ($63,885, a difference of 0.11%), Immigrants from Argentina ($63,885, a difference of 0.11%), and Immigrants from Italy ($64,065, a difference of 0.17%).
| Demographics | Rating | Rank | Householder Income Over 65 years |
| Immigrants | Italy | 96.2 /100 | #101 | Exceptional $64,065 |
| Chileans | 95.8 /100 | #102 | Exceptional $63,957 |
| British | 95.7 /100 | #103 | Exceptional $63,940 |
| Immigrants | Cameroon | 95.6 /100 | #104 | Exceptional $63,907 |
| Italians | 95.5 /100 | #105 | Exceptional $63,885 |
| Immigrants | Argentina | 95.5 /100 | #106 | Exceptional $63,885 |
| Pakistanis | 95.3 /100 | #107 | Exceptional $63,844 |
| Palestinians | 95.1 /100 | #108 | Exceptional $63,800 |
| Europeans | 95.0 /100 | #109 | Exceptional $63,779 |
| Immigrants | Zimbabwe | 94.3 /100 | #110 | Exceptional $63,643 |
| Immigrants | Spain | 93.7 /100 | #111 | Exceptional $63,540 |
| Syrians | 93.4 /100 | #112 | Exceptional $63,494 |
| Immigrants | Serbia | 92.7 /100 | #113 | Exceptional $63,387 |
| Immigrants | Saudi Arabia | 92.4 /100 | #114 | Exceptional $63,355 |
| Croatians | 91.4 /100 | #115 | Exceptional $63,225 |
| Guamanians/Chamorros | 91.1 /100 | #116 | Exceptional $63,187 |
| Immigrants | Croatia | 90.9 /100 | #117 | Exceptional $63,168 |
| Danes | 90.5 /100 | #118 | Exceptional $63,117 |
| Immigrants | Jordan | 89.8 /100 | #119 | Excellent $63,041 |
| Ukrainians | 89.7 /100 | #120 | Excellent $63,032 |
| Immigrants | Vietnam | 89.5 /100 | #121 | Excellent $63,014 |