Zip Codes with the Highest Percentage of Population with a Degree in Science and Engineering in Greenwood, IN
RELATED REPORTS & OPTIONS
Science and Engineering
Greenwood
Compare Zip Codes
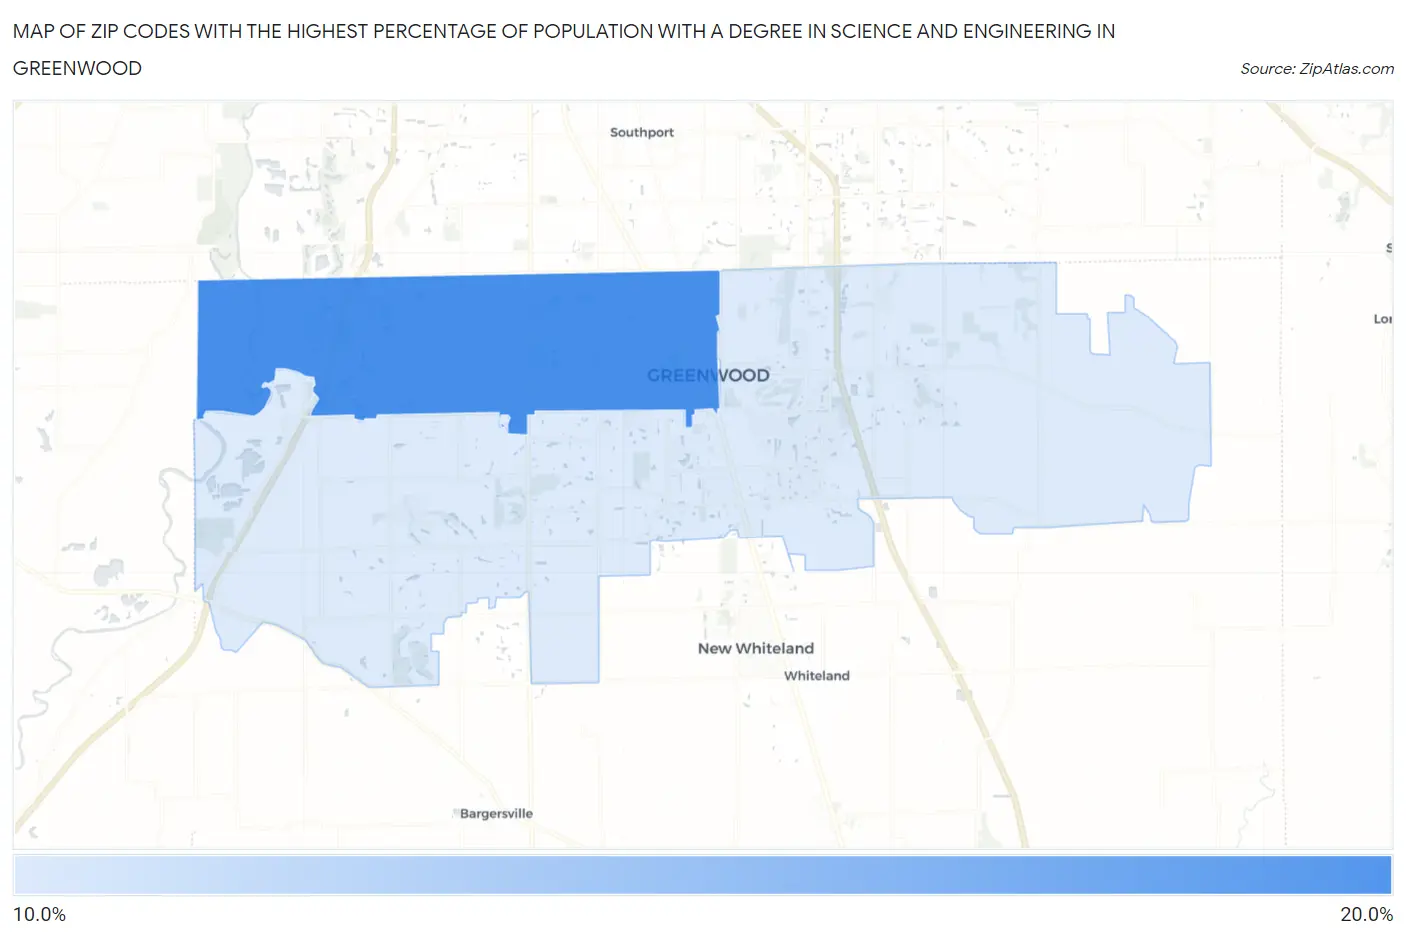
Map of Zip Codes with the Highest Percentage of Population with a Degree in Science and Engineering in Greenwood
10.5%
15.1%
Zip Codes with the Highest Percentage of Population with a Degree in Science and Engineering in Greenwood, IN
| Zip Code | % Graduates | vs State | vs National | |
| 1. | 46142 | 15.1% | 12.7%(+2.40)#257 | 9.8%(+5.29)#6,628 |
| 2. | 46143 | 10.5% | 12.7%(-2.15)#457 | 9.8%(+0.737)#13,930 |
1
Common Questions
What are the Top Zip Codes with the Highest Percentage of Population with a Degree in Science and Engineering in Greenwood, IN?
Top Zip Codes with the Highest Percentage of Population with a Degree in Science and Engineering in Greenwood, IN are:
What zip code has the Highest Percentage of Population with a Degree in Science and Engineering in Greenwood, IN?
46142 has the Highest Percentage of Population with a Degree in Science and Engineering in Greenwood, IN with 15.1%.
What is the Percentage of Population with a Degree in Science and Engineering in Greenwood, IN?
Percentage of Population with a Degree in Science and Engineering in Greenwood is 10.1%.
What is the Percentage of Population with a Degree in Science and Engineering in Indiana?
Percentage of Population with a Degree in Science and Engineering in Indiana is 12.7%.
What is the Percentage of Population with a Degree in Science and Engineering in the United States?
Percentage of Population with a Degree in Science and Engineering in the United States is 9.8%.