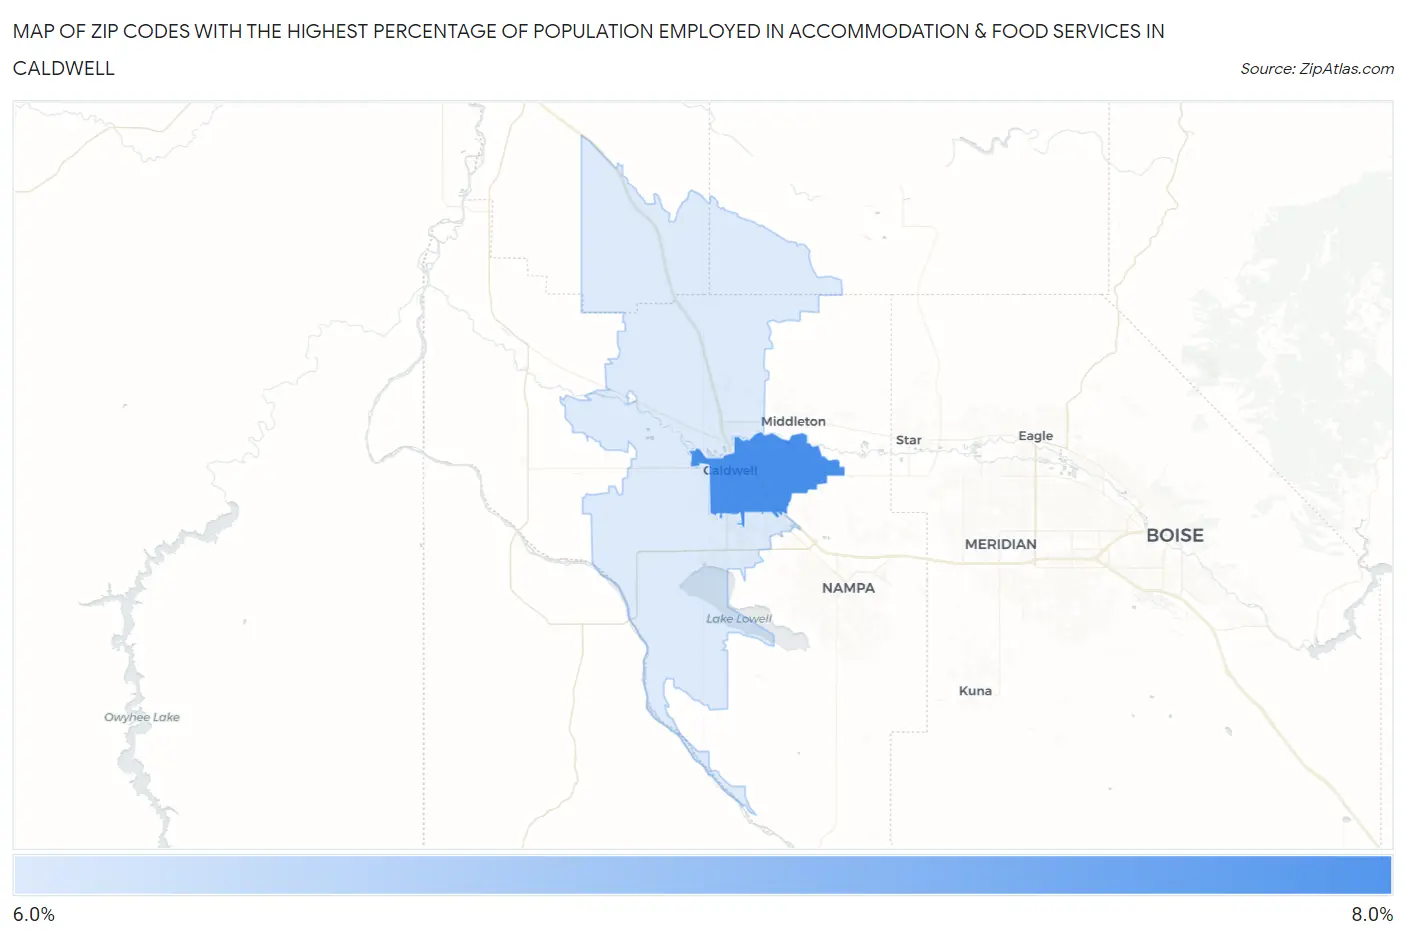
Zip Codes with the Highest Percentage of Population Employed in Accommodation & Food Services in Caldwell, ID
RELATED REPORTS & OPTIONS
Accommodation & Food Services
Caldwell
Compare Zip Codes
Map of Zip Codes with the Highest Percentage of Population Employed in Accommodation & Food Services in Caldwell
6.6%
6.8%
Zip Codes with the Highest Percentage of Population Employed in Accommodation & Food Services in Caldwell, ID
| Zip Code | % Employed | vs State | vs National | |
| 1. | 83605 | 6.8% | 7.1%(-0.317)#97 | 6.9%(-0.080)#10,885 |
| 2. | 83607 | 6.6% | 7.1%(-0.506)#104 | 6.9%(-0.270)#11,491 |
1
Common Questions
What are the Top Zip Codes with the Highest Percentage of Population Employed in Accommodation & Food Services in Caldwell, ID?
Top Zip Codes with the Highest Percentage of Population Employed in Accommodation & Food Services in Caldwell, ID are:
What zip code has the Highest Percentage of Population Employed in Accommodation & Food Services in Caldwell, ID?
83605 has the Highest Percentage of Population Employed in Accommodation & Food Services in Caldwell, ID with 6.8%.
What is the Percentage of Population Employed in Accommodation & Food Services in Caldwell, ID?
Percentage of Population Employed in Accommodation & Food Services in Caldwell is 6.9%.
What is the Percentage of Population Employed in Accommodation & Food Services in Idaho?
Percentage of Population Employed in Accommodation & Food Services in Idaho is 7.1%.
What is the Percentage of Population Employed in Accommodation & Food Services in the United States?
Percentage of Population Employed in Accommodation & Food Services in the United States is 6.9%.