Zip Codes with the Highest Percentage of Population Employed in Computer & Mathematics in Waterloo, IA
RELATED REPORTS & OPTIONS
Computer & Mathematics
Waterloo
Compare Zip Codes
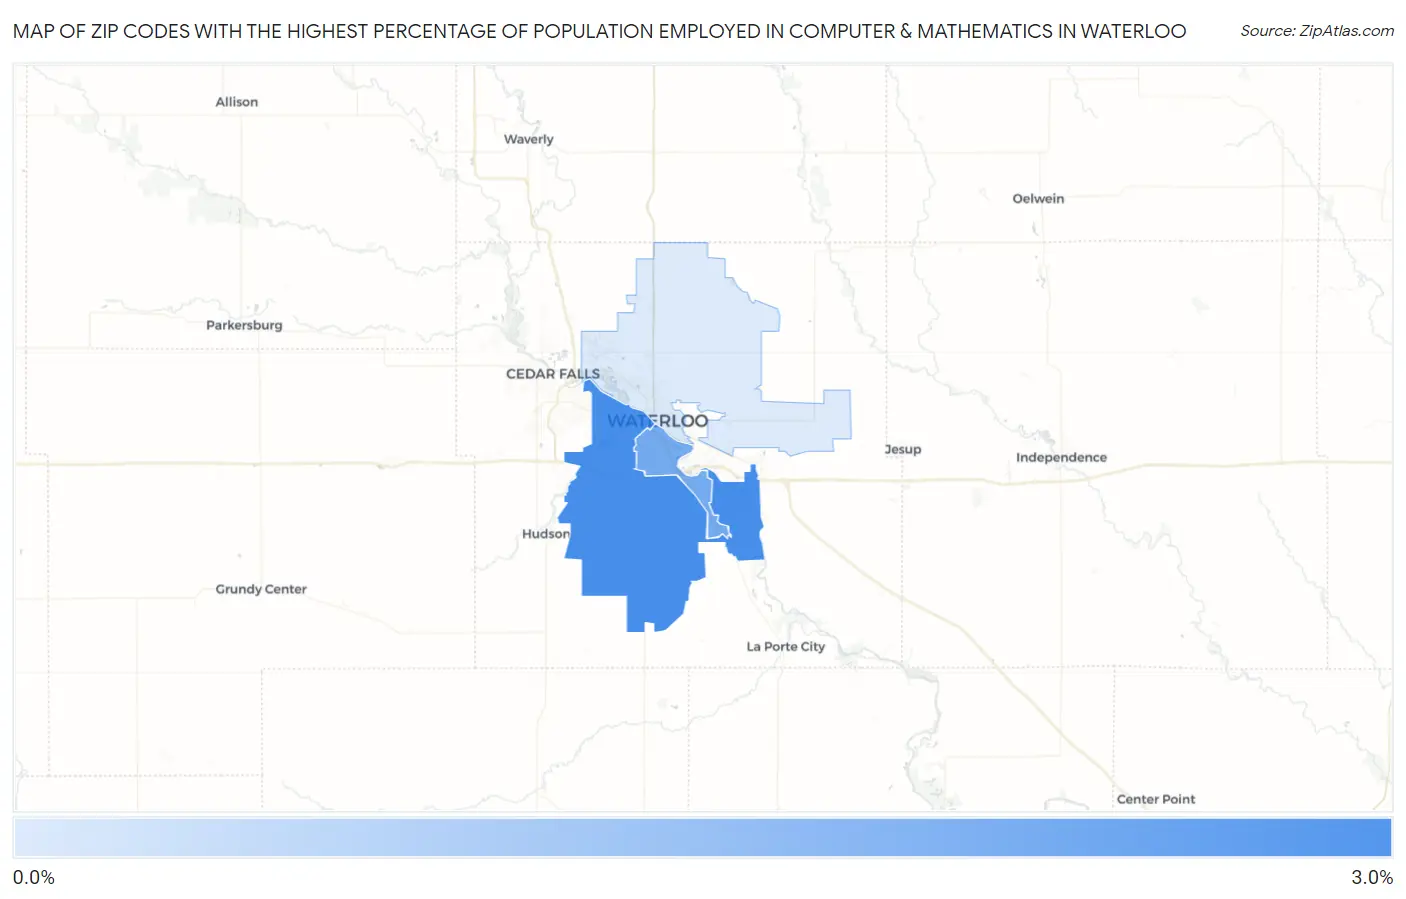
Map of Zip Codes with the Highest Percentage of Population Employed in Computer & Mathematics in Waterloo
0.41%
2.6%
Zip Codes with the Highest Percentage of Population Employed in Computer & Mathematics in Waterloo, IA
| Zip Code | % Employed | vs State | vs National | |
| 1. | 50701 | 2.6% | 2.7%(-0.087)#167 | 3.5%(-0.903)#9,139 |
| 2. | 50702 | 1.9% | 2.7%(-0.777)#234 | 3.5%(-1.59)#12,145 |
| 3. | 50703 | 0.41% | 2.7%(-2.30)#522 | 3.5%(-3.12)#21,007 |
1
Common Questions
What are the Top Zip Codes with the Highest Percentage of Population Employed in Computer & Mathematics in Waterloo, IA?
Top Zip Codes with the Highest Percentage of Population Employed in Computer & Mathematics in Waterloo, IA are:
What zip code has the Highest Percentage of Population Employed in Computer & Mathematics in Waterloo, IA?
50701 has the Highest Percentage of Population Employed in Computer & Mathematics in Waterloo, IA with 2.6%.
What is the Percentage of Population Employed in Computer & Mathematics in Waterloo, IA?
Percentage of Population Employed in Computer & Mathematics in Waterloo is 1.9%.
What is the Percentage of Population Employed in Computer & Mathematics in Iowa?
Percentage of Population Employed in Computer & Mathematics in Iowa is 2.7%.
What is the Percentage of Population Employed in Computer & Mathematics in the United States?
Percentage of Population Employed in Computer & Mathematics in the United States is 3.5%.