Zip Codes with the Highest Percentage of Population Employed in Installation, Maintenance & Repair in Snellville, GA
RELATED REPORTS & OPTIONS
Installation, Maintenance & Repair
Snellville
Compare Zip Codes
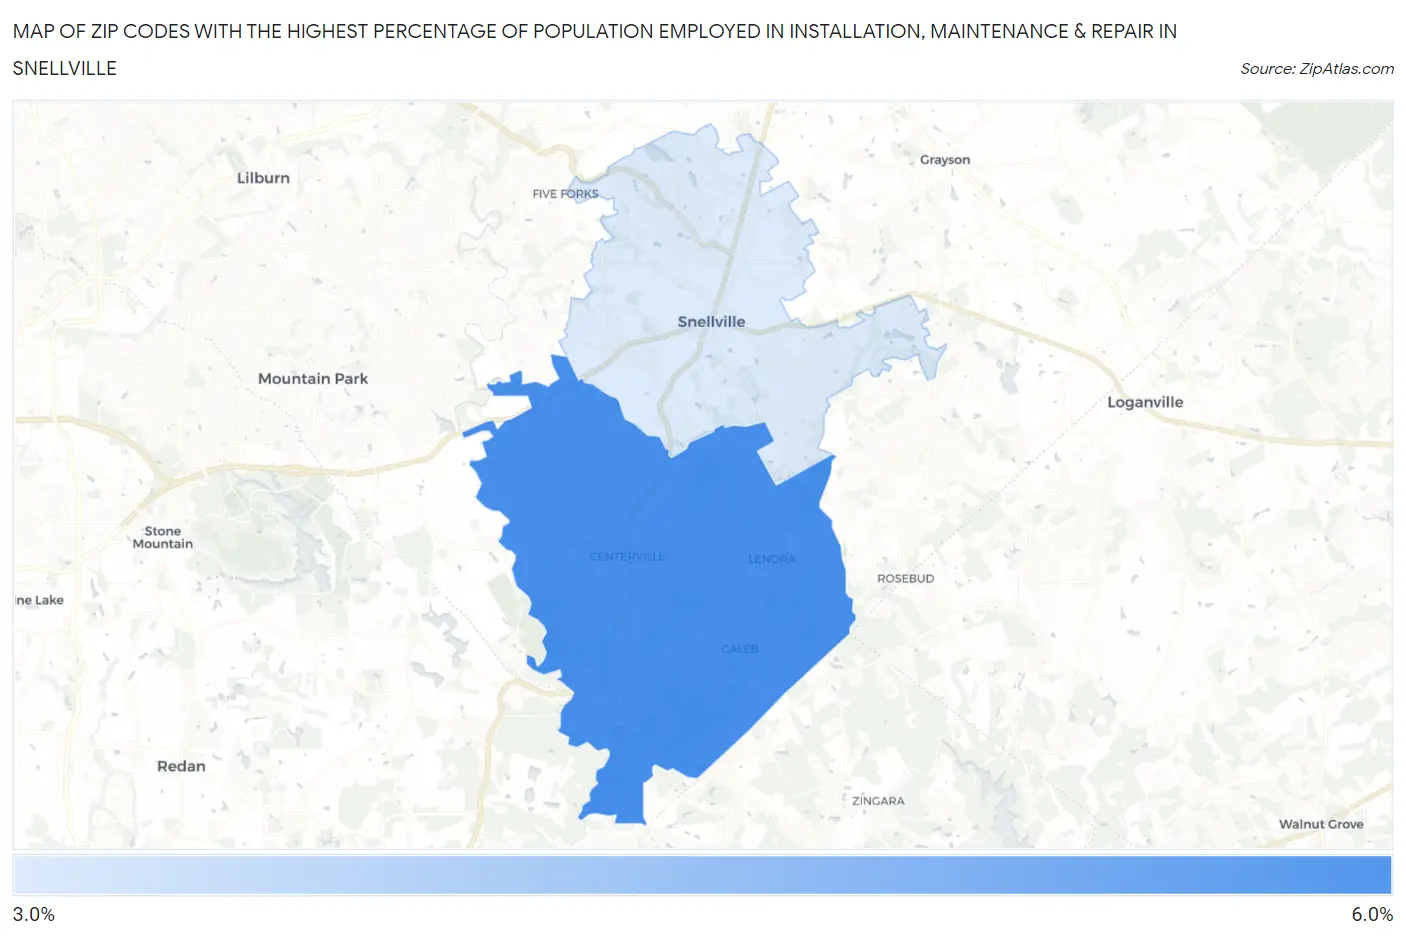
Map of Zip Codes with the Highest Percentage of Population Employed in Installation, Maintenance & Repair in Snellville
3.7%
5.6%
Zip Codes with the Highest Percentage of Population Employed in Installation, Maintenance & Repair in Snellville, GA
| Zip Code | % Employed | vs State | vs National | |
| 1. | 30039 | 5.6% | 3.4%(+2.23)#195 | 3.1%(+2.53)#7,028 |
| 2. | 30078 | 3.7% | 3.4%(+0.312)#364 | 3.1%(+0.611)#13,791 |
1
Common Questions
What are the Top Zip Codes with the Highest Percentage of Population Employed in Installation, Maintenance & Repair in Snellville, GA?
Top Zip Codes with the Highest Percentage of Population Employed in Installation, Maintenance & Repair in Snellville, GA are:
What zip code has the Highest Percentage of Population Employed in Installation, Maintenance & Repair in Snellville, GA?
30039 has the Highest Percentage of Population Employed in Installation, Maintenance & Repair in Snellville, GA with 5.6%.
What is the Percentage of Population Employed in Installation, Maintenance & Repair in Snellville, GA?
Percentage of Population Employed in Installation, Maintenance & Repair in Snellville is 2.6%.
What is the Percentage of Population Employed in Installation, Maintenance & Repair in Georgia?
Percentage of Population Employed in Installation, Maintenance & Repair in Georgia is 3.4%.
What is the Percentage of Population Employed in Installation, Maintenance & Repair in the United States?
Percentage of Population Employed in Installation, Maintenance & Repair in the United States is 3.1%.