Tlingit-Haida vs Celtic Currently Married
COMPARE
Tlingit-Haida
Celtic
Currently Married
Currently Married Comparison
Tlingit-Haida
Celtics
46.7%
CURRENTLY MARRIED
51.2/ 100
METRIC RATING
173rd/ 347
METRIC RANK
47.8%
CURRENTLY MARRIED
94.2/ 100
METRIC RATING
100th/ 347
METRIC RANK
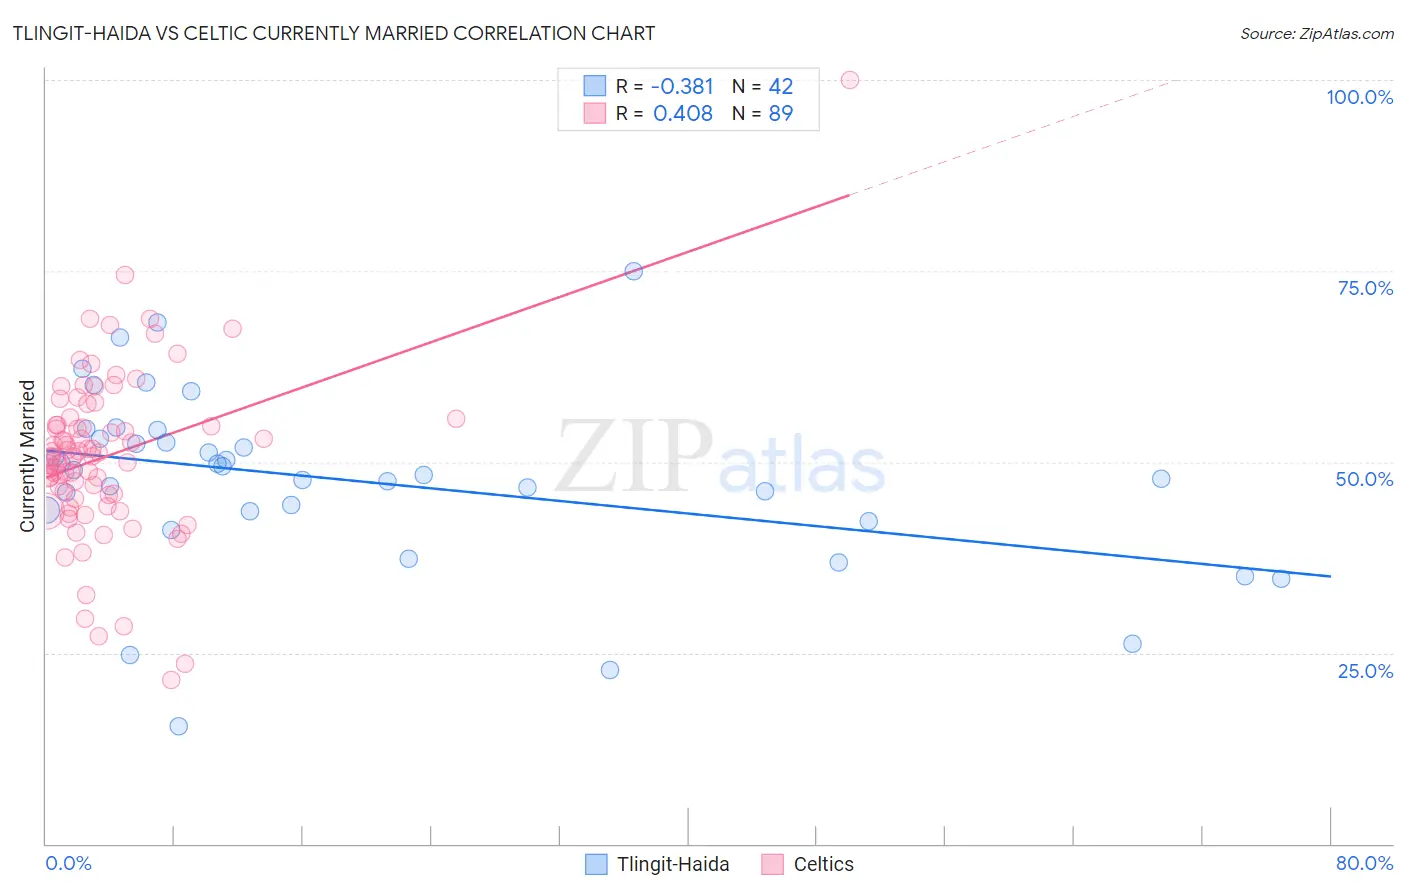
Tlingit-Haida vs Celtic Currently Married Correlation Chart
The statistical analysis conducted on geographies consisting of 60,872,339 people shows a mild negative correlation between the proportion of Tlingit-Haida and percentage of population currently married in the United States with a correlation coefficient (R) of -0.381 and weighted average of 46.7%. Similarly, the statistical analysis conducted on geographies consisting of 168,877,326 people shows a moderate positive correlation between the proportion of Celtics and percentage of population currently married in the United States with a correlation coefficient (R) of 0.408 and weighted average of 47.8%, a difference of 2.5%.
Currently Married Correlation Summary
| Measurement | Tlingit-Haida | Celtic |
| Minimum | 15.4% | 21.4% |
| Maximum | 75.0% | 100.0% |
| Range | 59.6% | 78.6% |
| Mean | 47.6% | 50.8% |
| Median | 48.6% | 50.7% |
| Interquartile 25% (IQ1) | 43.5% | 45.4% |
| Interquartile 75% (IQ3) | 53.1% | 55.2% |
| Interquartile Range (IQR) | 9.6% | 9.8% |
| Standard Deviation (Sample) | 11.9% | 11.1% |
| Standard Deviation (Population) | 11.7% | 11.0% |
Similar Demographics by Currently Married
Demographics Similar to Tlingit-Haida by Currently Married
In terms of currently married, the demographic groups most similar to Tlingit-Haida are Aleut (46.7%, a difference of 0.030%), Peruvian (46.6%, a difference of 0.040%), Immigrants from Zimbabwe (46.7%, a difference of 0.050%), Immigrants from Brazil (46.6%, a difference of 0.050%), and Hawaiian (46.6%, a difference of 0.090%).
| Demographics | Rating | Rank | Currently Married |
| Immigrants | Syria | 59.3 /100 | #166 | Average 46.8% |
| Spaniards | 58.8 /100 | #167 | Average 46.8% |
| Immigrants | Afghanistan | 58.2 /100 | #168 | Average 46.8% |
| Armenians | 58.2 /100 | #169 | Average 46.8% |
| Immigrants | Latvia | 56.7 /100 | #170 | Average 46.7% |
| Immigrants | Zimbabwe | 52.4 /100 | #171 | Average 46.7% |
| Aleuts | 52.0 /100 | #172 | Average 46.7% |
| Tlingit-Haida | 51.2 /100 | #173 | Average 46.7% |
| Peruvians | 50.0 /100 | #174 | Average 46.6% |
| Immigrants | Brazil | 49.9 /100 | #175 | Average 46.6% |
| Hawaiians | 48.6 /100 | #176 | Average 46.6% |
| Israelis | 48.6 /100 | #177 | Average 46.6% |
| Chickasaw | 47.8 /100 | #178 | Average 46.6% |
| Immigrants | Oceania | 44.6 /100 | #179 | Average 46.5% |
| Costa Ricans | 43.7 /100 | #180 | Average 46.5% |
Demographics Similar to Celtics by Currently Married
In terms of currently married, the demographic groups most similar to Celtics are Immigrants from Sweden (47.8%, a difference of 0.020%), Immigrants from Germany (47.8%, a difference of 0.020%), Turkish (47.8%, a difference of 0.040%), Cypriot (47.8%, a difference of 0.070%), and Serbian (47.8%, a difference of 0.080%).
| Demographics | Rating | Rank | Currently Married |
| Lebanese | 95.1 /100 | #93 | Exceptional 47.9% |
| Native Hawaiians | 95.0 /100 | #94 | Exceptional 47.9% |
| Immigrants | Bulgaria | 94.8 /100 | #95 | Exceptional 47.9% |
| Egyptians | 94.8 /100 | #96 | Exceptional 47.9% |
| Immigrants | Ukraine | 94.8 /100 | #97 | Exceptional 47.9% |
| Immigrants | China | 94.7 /100 | #98 | Exceptional 47.9% |
| Immigrants | Sweden | 94.3 /100 | #99 | Exceptional 47.8% |
| Celtics | 94.2 /100 | #100 | Exceptional 47.8% |
| Immigrants | Germany | 94.1 /100 | #101 | Exceptional 47.8% |
| Turks | 93.9 /100 | #102 | Exceptional 47.8% |
| Cypriots | 93.7 /100 | #103 | Exceptional 47.8% |
| Serbians | 93.6 /100 | #104 | Exceptional 47.8% |
| Immigrants | Singapore | 93.3 /100 | #105 | Exceptional 47.8% |
| Immigrants | Greece | 93.1 /100 | #106 | Exceptional 47.7% |
| Immigrants | Italy | 92.9 /100 | #107 | Exceptional 47.7% |