Tlingit-Haida vs Bhutanese Currently Married
COMPARE
Tlingit-Haida
Bhutanese
Currently Married
Currently Married Comparison
Tlingit-Haida
Bhutanese
46.7%
CURRENTLY MARRIED
51.2/ 100
METRIC RATING
173rd/ 347
METRIC RANK
48.6%
CURRENTLY MARRIED
99.1/ 100
METRIC RATING
49th/ 347
METRIC RANK
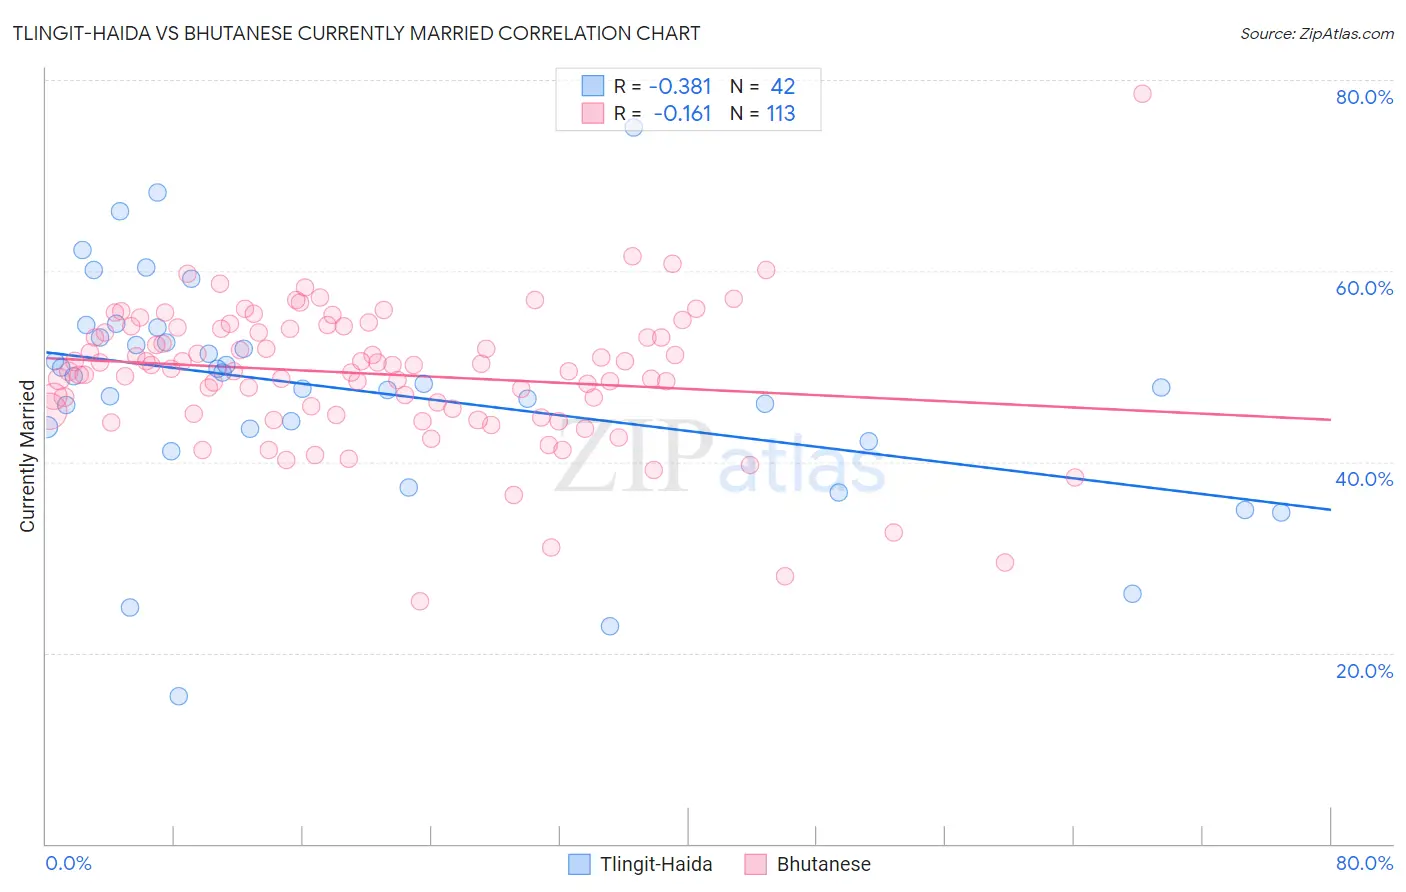
Tlingit-Haida vs Bhutanese Currently Married Correlation Chart
The statistical analysis conducted on geographies consisting of 60,872,339 people shows a mild negative correlation between the proportion of Tlingit-Haida and percentage of population currently married in the United States with a correlation coefficient (R) of -0.381 and weighted average of 46.7%. Similarly, the statistical analysis conducted on geographies consisting of 455,493,629 people shows a poor negative correlation between the proportion of Bhutanese and percentage of population currently married in the United States with a correlation coefficient (R) of -0.161 and weighted average of 48.6%, a difference of 4.3%.
Currently Married Correlation Summary
| Measurement | Tlingit-Haida | Bhutanese |
| Minimum | 15.4% | 25.4% |
| Maximum | 75.0% | 78.5% |
| Range | 59.6% | 53.1% |
| Mean | 47.6% | 49.2% |
| Median | 48.6% | 50.1% |
| Interquartile 25% (IQ1) | 43.5% | 45.2% |
| Interquartile 75% (IQ3) | 53.1% | 54.0% |
| Interquartile Range (IQR) | 9.6% | 8.9% |
| Standard Deviation (Sample) | 11.9% | 7.3% |
| Standard Deviation (Population) | 11.7% | 7.3% |
Similar Demographics by Currently Married
Demographics Similar to Tlingit-Haida by Currently Married
In terms of currently married, the demographic groups most similar to Tlingit-Haida are Aleut (46.7%, a difference of 0.030%), Peruvian (46.6%, a difference of 0.040%), Immigrants from Zimbabwe (46.7%, a difference of 0.050%), Immigrants from Brazil (46.6%, a difference of 0.050%), and Hawaiian (46.6%, a difference of 0.090%).
| Demographics | Rating | Rank | Currently Married |
| Immigrants | Syria | 59.3 /100 | #166 | Average 46.8% |
| Spaniards | 58.8 /100 | #167 | Average 46.8% |
| Immigrants | Afghanistan | 58.2 /100 | #168 | Average 46.8% |
| Armenians | 58.2 /100 | #169 | Average 46.8% |
| Immigrants | Latvia | 56.7 /100 | #170 | Average 46.7% |
| Immigrants | Zimbabwe | 52.4 /100 | #171 | Average 46.7% |
| Aleuts | 52.0 /100 | #172 | Average 46.7% |
| Tlingit-Haida | 51.2 /100 | #173 | Average 46.7% |
| Peruvians | 50.0 /100 | #174 | Average 46.6% |
| Immigrants | Brazil | 49.9 /100 | #175 | Average 46.6% |
| Hawaiians | 48.6 /100 | #176 | Average 46.6% |
| Israelis | 48.6 /100 | #177 | Average 46.6% |
| Chickasaw | 47.8 /100 | #178 | Average 46.6% |
| Immigrants | Oceania | 44.6 /100 | #179 | Average 46.5% |
| Costa Ricans | 43.7 /100 | #180 | Average 46.5% |
Demographics Similar to Bhutanese by Currently Married
In terms of currently married, the demographic groups most similar to Bhutanese are Iranian (48.6%, a difference of 0.060%), White/Caucasian (48.6%, a difference of 0.070%), Austrian (48.7%, a difference of 0.13%), Northern European (48.7%, a difference of 0.14%), and Immigrants from Iran (48.7%, a difference of 0.15%).
| Demographics | Rating | Rank | Currently Married |
| Finns | 99.3 /100 | #42 | Exceptional 48.8% |
| Scotch-Irish | 99.3 /100 | #43 | Exceptional 48.7% |
| Immigrants | North America | 99.3 /100 | #44 | Exceptional 48.7% |
| Belgians | 99.3 /100 | #45 | Exceptional 48.7% |
| Immigrants | Iran | 99.2 /100 | #46 | Exceptional 48.7% |
| Northern Europeans | 99.2 /100 | #47 | Exceptional 48.7% |
| Austrians | 99.2 /100 | #48 | Exceptional 48.7% |
| Bhutanese | 99.1 /100 | #49 | Exceptional 48.6% |
| Iranians | 99.0 /100 | #50 | Exceptional 48.6% |
| Whites/Caucasians | 99.0 /100 | #51 | Exceptional 48.6% |
| Russians | 98.9 /100 | #52 | Exceptional 48.6% |
| Immigrants | Austria | 98.8 /100 | #53 | Exceptional 48.5% |
| Immigrants | Moldova | 98.7 /100 | #54 | Exceptional 48.5% |
| Immigrants | North Macedonia | 98.7 /100 | #55 | Exceptional 48.5% |
| Latvians | 98.7 /100 | #56 | Exceptional 48.5% |