Tlingit-Haida vs Bahamian Currently Married
COMPARE
Tlingit-Haida
Bahamian
Currently Married
Currently Married Comparison
Tlingit-Haida
Bahamians
46.7%
CURRENTLY MARRIED
51.2/ 100
METRIC RATING
173rd/ 347
METRIC RANK
41.2%
CURRENTLY MARRIED
0.0/ 100
METRIC RATING
318th/ 347
METRIC RANK
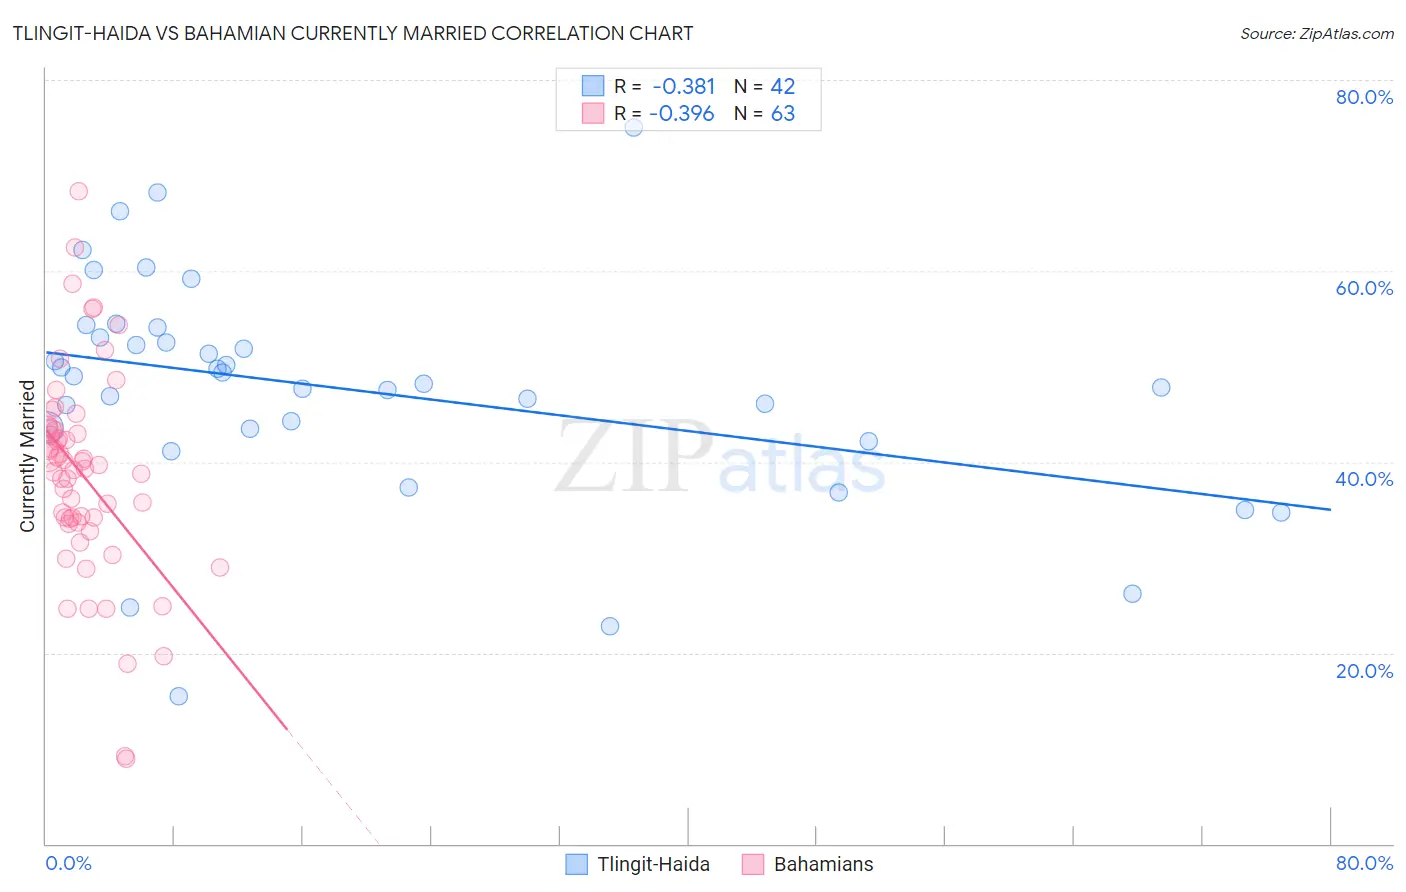
Tlingit-Haida vs Bahamian Currently Married Correlation Chart
The statistical analysis conducted on geographies consisting of 60,872,339 people shows a mild negative correlation between the proportion of Tlingit-Haida and percentage of population currently married in the United States with a correlation coefficient (R) of -0.381 and weighted average of 46.7%. Similarly, the statistical analysis conducted on geographies consisting of 112,687,531 people shows a mild negative correlation between the proportion of Bahamians and percentage of population currently married in the United States with a correlation coefficient (R) of -0.396 and weighted average of 41.2%, a difference of 13.3%.
Currently Married Correlation Summary
| Measurement | Tlingit-Haida | Bahamian |
| Minimum | 15.4% | 8.9% |
| Maximum | 75.0% | 68.3% |
| Range | 59.6% | 59.4% |
| Mean | 47.6% | 38.6% |
| Median | 48.6% | 39.3% |
| Interquartile 25% (IQ1) | 43.5% | 33.7% |
| Interquartile 75% (IQ3) | 53.1% | 43.5% |
| Interquartile Range (IQR) | 9.6% | 9.8% |
| Standard Deviation (Sample) | 11.9% | 10.9% |
| Standard Deviation (Population) | 11.7% | 10.9% |
Similar Demographics by Currently Married
Demographics Similar to Tlingit-Haida by Currently Married
In terms of currently married, the demographic groups most similar to Tlingit-Haida are Aleut (46.7%, a difference of 0.030%), Peruvian (46.6%, a difference of 0.040%), Immigrants from Zimbabwe (46.7%, a difference of 0.050%), Immigrants from Brazil (46.6%, a difference of 0.050%), and Hawaiian (46.6%, a difference of 0.090%).
| Demographics | Rating | Rank | Currently Married |
| Immigrants | Syria | 59.3 /100 | #166 | Average 46.8% |
| Spaniards | 58.8 /100 | #167 | Average 46.8% |
| Immigrants | Afghanistan | 58.2 /100 | #168 | Average 46.8% |
| Armenians | 58.2 /100 | #169 | Average 46.8% |
| Immigrants | Latvia | 56.7 /100 | #170 | Average 46.7% |
| Immigrants | Zimbabwe | 52.4 /100 | #171 | Average 46.7% |
| Aleuts | 52.0 /100 | #172 | Average 46.7% |
| Tlingit-Haida | 51.2 /100 | #173 | Average 46.7% |
| Peruvians | 50.0 /100 | #174 | Average 46.6% |
| Immigrants | Brazil | 49.9 /100 | #175 | Average 46.6% |
| Hawaiians | 48.6 /100 | #176 | Average 46.6% |
| Israelis | 48.6 /100 | #177 | Average 46.6% |
| Chickasaw | 47.8 /100 | #178 | Average 46.6% |
| Immigrants | Oceania | 44.6 /100 | #179 | Average 46.5% |
| Costa Ricans | 43.7 /100 | #180 | Average 46.5% |
Demographics Similar to Bahamians by Currently Married
In terms of currently married, the demographic groups most similar to Bahamians are Immigrants from Somalia (41.2%, a difference of 0.020%), Immigrants from Jamaica (41.1%, a difference of 0.080%), Haitian (41.3%, a difference of 0.18%), Immigrants from Caribbean (41.3%, a difference of 0.20%), and Inupiat (41.3%, a difference of 0.26%).
| Demographics | Rating | Rank | Currently Married |
| Trinidadians and Tobagonians | 0.0 /100 | #311 | Tragic 41.5% |
| Somalis | 0.0 /100 | #312 | Tragic 41.5% |
| Jamaicans | 0.0 /100 | #313 | Tragic 41.4% |
| West Indians | 0.0 /100 | #314 | Tragic 41.3% |
| Inupiat | 0.0 /100 | #315 | Tragic 41.3% |
| Immigrants | Caribbean | 0.0 /100 | #316 | Tragic 41.3% |
| Haitians | 0.0 /100 | #317 | Tragic 41.3% |
| Bahamians | 0.0 /100 | #318 | Tragic 41.2% |
| Immigrants | Somalia | 0.0 /100 | #319 | Tragic 41.2% |
| Immigrants | Jamaica | 0.0 /100 | #320 | Tragic 41.1% |
| Immigrants | Congo | 0.0 /100 | #321 | Tragic 41.1% |
| Immigrants | Haiti | 0.0 /100 | #322 | Tragic 41.0% |
| Immigrants | West Indies | 0.0 /100 | #323 | Tragic 40.7% |
| Immigrants | Senegal | 0.0 /100 | #324 | Tragic 40.7% |
| U.S. Virgin Islanders | 0.0 /100 | #325 | Tragic 40.7% |