Immigrants from Japan Currently Married
COMPARE
Immigrants from Japan
Select to Compare
Currently Married
Immigrants from Japan Currently Married
48.0%
CURRENTLY MARRIED
96.2/ 100
METRIC RATING
86th/ 347
METRIC RANK
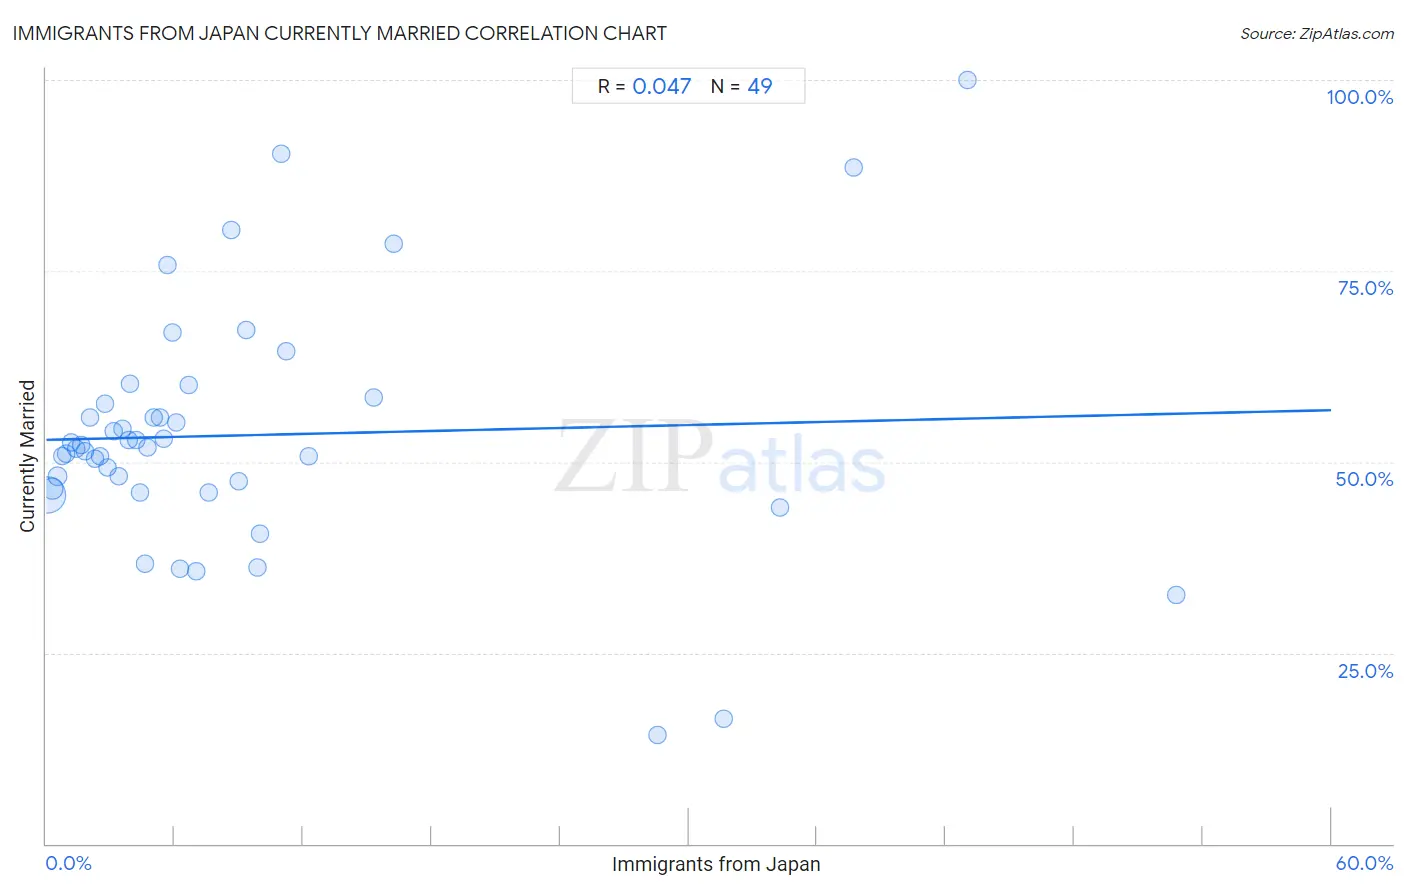
Immigrants from Japan Currently Married Correlation Chart
The statistical analysis conducted on geographies consisting of 340,094,815 people shows no correlation between the proportion of Immigrants from Japan and percentage of population currently married in the United States with a correlation coefficient (R) of 0.047 and weighted average of 48.0%. On average, for every 1% (one percent) increase in Immigrants from Japan within a typical geography, there is an increase of 0.065% in percentage of population currently married.
It is essential to understand that the correlation between the percentage of Immigrants from Japan and percentage of population currently married does not imply a direct cause-and-effect relationship. It remains uncertain whether the presence of Immigrants from Japan influences an upward or downward trend in the level of percentage of population currently married within an area, or if Immigrants from Japan simply ended up residing in those areas with higher or lower levels of percentage of population currently married due to other factors.
Demographics Similar to Immigrants from Japan by Currently Married
In terms of currently married, the demographic groups most similar to Immigrants from Japan are Jordanian (48.0%, a difference of 0.010%), French Canadian (48.0%, a difference of 0.030%), Immigrants from Eastern Europe (48.0%, a difference of 0.030%), Indian (Asian) (48.0%, a difference of 0.090%), and American (48.0%, a difference of 0.11%).
| Demographics | Rating | Rank | Currently Married |
| Immigrants from South Africa | 97.0 /100 | #79 | Exceptional 48.1% |
| Immigrants from Poland | 96.9 /100 | #80 | Exceptional 48.1% |
| Immigrants from Sri Lanka | 96.9 /100 | #81 | Exceptional 48.1% |
| Immigrants from Europe | 96.9 /100 | #82 | Exceptional 48.1% |
| Bolivians | 96.9 /100 | #83 | Exceptional 48.1% |
| Immigrants from Israel | 96.9 /100 | #84 | Exceptional 48.1% |
| French Canadians | 96.3 /100 | #85 | Exceptional 48.0% |
| Immigrants from Japan | 96.2 /100 | #86 | Exceptional 48.0% |
| Jordanians | 96.2 /100 | #87 | Exceptional 48.0% |
| Immigrants from Eastern Europe | 96.1 /100 | #88 | Exceptional 48.0% |
| Indians (Asian) | 95.8 /100 | #89 | Exceptional 48.0% |
| Americans | 95.7 /100 | #90 | Exceptional 48.0% |
| Immigrants from Bolivia | 95.6 /100 | #91 | Exceptional 47.9% |
| Koreans | 95.4 /100 | #92 | Exceptional 47.9% |
| Lebanese | 95.1 /100 | #93 | Exceptional 47.9% |
Immigrants from Japan Currently Married Correlation Summary
| Measurement | Immigrants from Japan Data | Currently Married Data |
| Minimum | 0.077% | 14.3% |
| Maximum | 52.8% | 100.0% |
| Range | 52.7% | 85.7% |
| Mean | 9.4% | 53.5% |
| Median | 5.3% | 51.9% |
| Interquartile 25% (IQ1) | 2.6% | 46.2% |
| Interquartile 75% (IQ3) | 9.9% | 58.1% |
| Interquartile Range (IQR) | 7.3% | 11.8% |
| Standard Deviation (Sample) | 11.8% | 16.1% |
| Standard Deviation (Population) | 11.7% | 15.9% |
Correlation Details
| Immigrants from Japan Percentile | Sample Size | Currently Married |
[ 0.0% - 0.5% ] 0.077% | 253,919,880 | 45.7% |
[ 0.0% - 0.5% ] 0.28% | 53,802,798 | 46.5% |
[ 0.5% - 1.0% ] 0.51% | 16,887,360 | 48.1% |
[ 0.5% - 1.0% ] 0.75% | 5,436,529 | 50.8% |
[ 0.5% - 1.0% ] 0.95% | 3,164,593 | 51.0% |
[ 1.0% - 1.5% ] 1.17% | 1,529,860 | 52.5% |
[ 1.0% - 1.5% ] 1.40% | 1,779,418 | 51.8% |
[ 1.5% - 2.0% ] 1.61% | 825,086 | 52.2% |
[ 1.5% - 2.0% ] 1.84% | 473,447 | 51.4% |
[ 2.0% - 2.5% ] 2.04% | 260,150 | 55.9% |
[ 2.0% - 2.5% ] 2.27% | 193,633 | 50.4% |
[ 2.0% - 2.5% ] 2.48% | 96,647 | 50.7% |
[ 2.5% - 3.0% ] 2.75% | 77,043 | 57.6% |
[ 2.5% - 3.0% ] 2.89% | 179,939 | 49.2% |
[ 3.0% - 3.5% ] 3.14% | 72,977 | 54.0% |
[ 3.0% - 3.5% ] 3.36% | 709,893 | 48.1% |
[ 3.5% - 4.0% ] 3.55% | 168,533 | 54.3% |
[ 3.5% - 4.0% ] 3.87% | 30,305 | 52.8% |
[ 3.5% - 4.0% ] 3.92% | 34,879 | 60.2% |
[ 4.0% - 4.5% ] 4.22% | 76,230 | 52.9% |
[ 4.0% - 4.5% ] 4.36% | 4,333 | 46.0% |
[ 4.5% - 5.0% ] 4.63% | 30,697 | 36.6% |
[ 4.5% - 5.0% ] 4.74% | 202,903 | 51.9% |
[ 5.0% - 5.5% ] 5.01% | 37,151 | 55.8% |
[ 5.0% - 5.5% ] 5.32% | 13,751 | 55.9% |
[ 5.0% - 5.5% ] 5.48% | 767 | 53.1% |
[ 5.5% - 6.0% ] 5.69% | 703 | 75.8% |
[ 5.5% - 6.0% ] 5.89% | 543 | 66.9% |
[ 6.0% - 6.5% ] 6.09% | 460 | 55.2% |
[ 6.0% - 6.5% ] 6.24% | 481 | 36.0% |
[ 6.5% - 7.0% ] 6.66% | 7,280 | 60.1% |
[ 7.0% - 7.5% ] 7.02% | 413 | 35.8% |
[ 7.5% - 8.0% ] 7.59% | 42,828 | 46.0% |
[ 8.5% - 9.0% ] 8.62% | 348 | 80.3% |
[ 9.0% - 9.5% ] 9.00% | 100 | 47.4% |
[ 9.0% - 9.5% ] 9.33% | 1,018 | 67.3% |
[ 9.5% - 10.0% ] 9.84% | 61 | 36.1% |
[ 9.5% - 10.0% ] 9.98% | 27,373 | 40.5% |
[ 10.5% - 11.0% ] 10.96% | 73 | 90.4% |
[ 11.0% - 11.5% ] 11.21% | 696 | 64.5% |
[ 12.0% - 12.5% ] 12.23% | 327 | 50.8% |
[ 15.0% - 15.5% ] 15.27% | 1,690 | 58.5% |
[ 16.0% - 16.5% ] 16.25% | 277 | 78.5% |
[ 28.5% - 29.0% ] 28.53% | 368 | 14.3% |
[ 31.5% - 32.0% ] 31.63% | 332 | 16.3% |
[ 34.0% - 34.5% ] 34.23% | 222 | 44.0% |
[ 37.5% - 38.0% ] 37.70% | 183 | 88.5% |
[ 43.0% - 43.5% ] 43.01% | 93 | 100.0% |
[ 52.5% - 53.0% ] 52.78% | 144 | 32.6% |