Assyrian/Chaldean/Syriac vs Asian Births to Unmarried Women
COMPARE
Assyrian/Chaldean/Syriac
Asian
Births to Unmarried Women
Births to Unmarried Women Comparison
Assyrians/Chaldeans/Syriacs
Asians
22.0%
BIRTHS TO UNMARRIED WOMEN
100.0/ 100
METRIC RATING
1st/ 347
METRIC RANK
26.8%
BIRTHS TO UNMARRIED WOMEN
99.9/ 100
METRIC RATING
26th/ 347
METRIC RANK
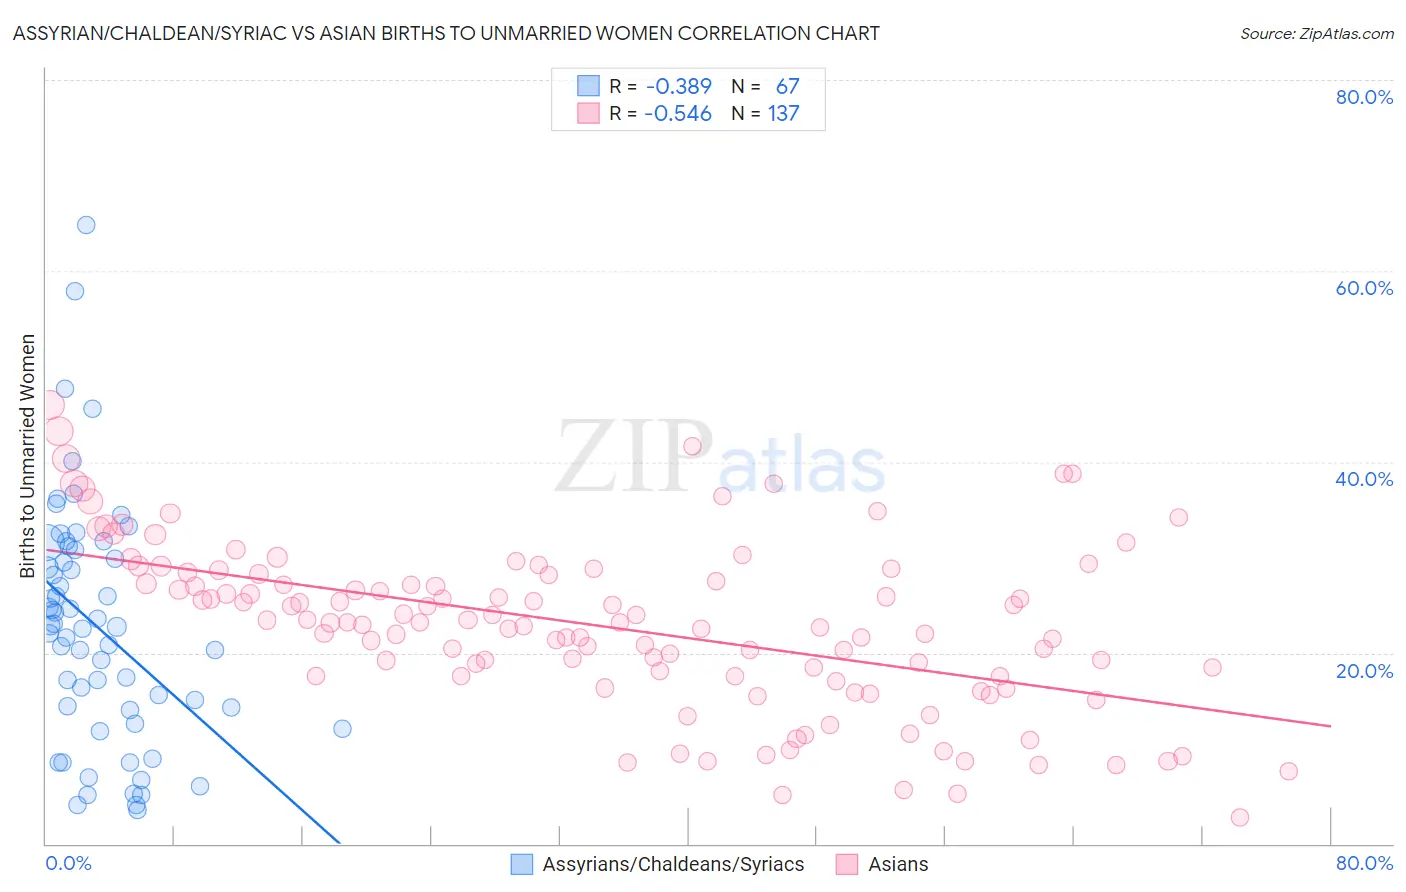
Assyrian/Chaldean/Syriac vs Asian Births to Unmarried Women Correlation Chart
The statistical analysis conducted on geographies consisting of 106,724,446 people shows a mild negative correlation between the proportion of Assyrians/Chaldeans/Syriacs and percentage of births to unmarried women in the United States with a correlation coefficient (R) of -0.389 and weighted average of 22.0%. Similarly, the statistical analysis conducted on geographies consisting of 495,064,366 people shows a substantial negative correlation between the proportion of Asians and percentage of births to unmarried women in the United States with a correlation coefficient (R) of -0.546 and weighted average of 26.8%, a difference of 21.9%.
Births to Unmarried Women Correlation Summary
| Measurement | Assyrian/Chaldean/Syriac | Asian |
| Minimum | 3.5% | 2.7% |
| Maximum | 64.8% | 46.0% |
| Range | 61.3% | 43.3% |
| Mean | 22.7% | 22.8% |
| Median | 22.7% | 23.2% |
| Interquartile 25% (IQ1) | 14.0% | 17.5% |
| Interquartile 75% (IQ3) | 30.8% | 28.2% |
| Interquartile Range (IQR) | 16.8% | 10.7% |
| Standard Deviation (Sample) | 12.6% | 8.7% |
| Standard Deviation (Population) | 12.5% | 8.7% |
Similar Demographics by Births to Unmarried Women
Demographics Similar to Assyrians/Chaldeans/Syriacs by Births to Unmarried Women
In terms of births to unmarried women, the demographic groups most similar to Assyrians/Chaldeans/Syriacs are Immigrants from India (22.9%, a difference of 4.2%), Filipino (23.0%, a difference of 4.6%), Immigrants from Taiwan (23.0%, a difference of 4.7%), Immigrants from Hong Kong (23.6%, a difference of 7.3%), and Immigrants from Iran (24.0%, a difference of 9.0%).
| Demographics | Rating | Rank | Births to Unmarried Women |
| Assyrians/Chaldeans/Syriacs | 100.0 /100 | #1 | Exceptional 22.0% |
| Immigrants | India | 100.0 /100 | #2 | Exceptional 22.9% |
| Filipinos | 100.0 /100 | #3 | Exceptional 23.0% |
| Immigrants | Taiwan | 100.0 /100 | #4 | Exceptional 23.0% |
| Immigrants | Hong Kong | 100.0 /100 | #5 | Exceptional 23.6% |
| Immigrants | Iran | 100.0 /100 | #6 | Exceptional 24.0% |
| Thais | 100.0 /100 | #7 | Exceptional 24.0% |
| Immigrants | China | 100.0 /100 | #8 | Exceptional 24.7% |
| Immigrants | South Central Asia | 100.0 /100 | #9 | Exceptional 24.7% |
| Immigrants | Eastern Asia | 100.0 /100 | #10 | Exceptional 25.0% |
| Immigrants | Israel | 100.0 /100 | #11 | Exceptional 25.1% |
| Indians (Asian) | 100.0 /100 | #12 | Exceptional 25.3% |
| Iranians | 100.0 /100 | #13 | Exceptional 25.3% |
| Immigrants | Lebanon | 100.0 /100 | #14 | Exceptional 25.3% |
| Immigrants | Singapore | 100.0 /100 | #15 | Exceptional 25.6% |
Demographics Similar to Asians by Births to Unmarried Women
In terms of births to unmarried women, the demographic groups most similar to Asians are Immigrants from Asia (26.8%, a difference of 0.010%), Cambodian (26.7%, a difference of 0.39%), Okinawan (26.9%, a difference of 0.52%), Immigrants from Australia (26.6%, a difference of 0.61%), and Cypriot (27.0%, a difference of 0.88%).
| Demographics | Rating | Rank | Births to Unmarried Women |
| Armenians | 99.9 /100 | #19 | Exceptional 26.2% |
| Immigrants | Korea | 99.9 /100 | #20 | Exceptional 26.3% |
| Soviet Union | 99.9 /100 | #21 | Exceptional 26.3% |
| Burmese | 99.9 /100 | #22 | Exceptional 26.4% |
| Immigrants | Japan | 99.9 /100 | #23 | Exceptional 26.4% |
| Immigrants | Australia | 99.9 /100 | #24 | Exceptional 26.6% |
| Cambodians | 99.9 /100 | #25 | Exceptional 26.7% |
| Asians | 99.9 /100 | #26 | Exceptional 26.8% |
| Immigrants | Asia | 99.9 /100 | #27 | Exceptional 26.8% |
| Okinawans | 99.8 /100 | #28 | Exceptional 26.9% |
| Cypriots | 99.8 /100 | #29 | Exceptional 27.0% |
| Bulgarians | 99.8 /100 | #30 | Exceptional 27.1% |
| Immigrants | Iraq | 99.8 /100 | #31 | Exceptional 27.1% |
| Immigrants | Russia | 99.8 /100 | #32 | Exceptional 27.1% |
| Immigrants | Sri Lanka | 99.8 /100 | #33 | Exceptional 27.2% |