Assyrian/Chaldean/Syriac vs Bhutanese Births to Unmarried Women

COMPARE

Assyrian/Chaldean/Syriac
Race
Ancestry
AfghanAfricanAlaska NativeAlaskan AthabascanAlbanianAleutAlsatianAmericanApacheArabArapahoArgentineanArmenianAssyrian/Chaldean/SyriacAustralianAustrianBahamianBangladeshiBarbadianBasqueBelgianBelizeanBermudanBlackfeetBolivianBrazilianBritishBritish West IndianBulgarianBurmeseCajunCambodianCanadianCape VerdeanCarpatho RusynCelticCentral AmericanCentral American IndianCherokeeCheyenneChickasawChileanChineseChippewaChoctawColombianColvilleComancheCosta RicanCreeCreekCroatianCrowCubanCypriotCzechCzechoslovakianDanishDelawareDominicanDutchDutch West IndianEastern EuropeanEcuadorianEgyptianEnglishEstonianEthiopianEuropeanFijianFilipinoFinnishFrenchFrench American IndianFrench CanadianGermanGerman RussianGhanaianGreekGuamanian/ChamorroGuatemalanGuyaneseHaitianHmongHonduranHopiHoumaHungarianIcelanderIndian (Asian)IndonesianInupiatIranianIraqiIrishIroquoisIsraeliItalianJamaicanJapaneseJordanianKenyanKiowaKoreanLaotianLatvianLebaneseLiberianLithuanianLumbeeLuxembourgerMacedonianMalaysianMalteseMarshalleseMenomineeMexicanMexican American IndianMongolianMoroccanNative HawaiianNavajoNepaleseNew ZealanderNicaraguanNigerianNorthern EuropeanNorwegianOkinawanOsageOttawaPaiutePakistaniPalestinianPanamanianParaguayanPennsylvania GermanPeruvianPimaPolishPortuguesePotawatomiPuebloPuerto RicanPuget Sound SalishRomanianRussianSalvadoranSamoanScandinavianScotch-IrishScottishSeminoleSenegaleseSerbianShoshoneSierra LeoneanSiouxSlavicSlovakSloveneSomaliSouth AfricanSouth AmericanSouth American IndianSoviet UnionSpaniardSpanishSpanish AmericanSpanish American IndianSri LankanSubsaharan AfricanSudaneseSwedishSwissSyrianTaiwaneseThaiTlingit-HaidaTohono O'OdhamTonganTrinidadian and TobagonianTsimshianTurkishU.S. Virgin IslanderUgandanUkrainianUruguayanUteVenezuelanVietnameseWelshWest IndianYakamaYaquiYugoslavianYumanYup'ikZimbabwean
Immigration
NonimmigrantsImmigrantsAfghanistanAfricaAlbaniaArgentinaArmeniaAsiaAustraliaAustriaBahamasBangladeshBarbadosBelarusBelgiumBelizeBoliviaBosnia and HerzegovinaBrazilBulgariaBurma/MyanmarCabo VerdeCambodiaCameroonCanadaCaribbeanCentral AmericaChileChinaColombiaCongoCosta RicaCroatiaCubaCzechoslovakiaDenmarkDominicaDominican RepublicEastern AfricaEastern AsiaEastern EuropeEcuadorEgyptEl SalvadorEnglandEritreaEthiopiaEuropeFijiFranceGermanyGhanaGreeceGrenadaGuatemalaGuyanaHaitiHondurasHong KongHungaryIndiaIndonesiaIranIraqIrelandIsraelItalyJamaicaJapanJordanKazakhstanKenyaKoreaKuwaitLaosLatin AmericaLatviaLebanonLiberiaLithuaniaMalaysiaMexicoMicronesiaMiddle AfricaMoldovaMoroccoNepalNetherlandsNicaraguaNigeriaNorth AmericaNorth MacedoniaNorthern AfricaNorthern EuropeNorwayOceaniaPakistanPanamaPeruPhilippinesPolandPortugalRomaniaRussiaSaudi ArabiaScotlandSenegalSerbiaSierra LeoneSingaporeSomaliaSouth AfricaSouth AmericaSouth Central AsiaSouth Eastern AsiaSouthern EuropeSpainSri LankaSt. Vincent and the GrenadinesSudanSwedenSwitzerlandSyriaTaiwanThailandTrinidad and TobagoTurkeyUgandaUkraineUruguayUzbekistanVenezuelaVietnamWest IndiesWestern AfricaWestern AsiaWestern EuropeYemenZaireZimbabweAzores
Bhutanese
Race
Ancestry
AfghanAfricanAlaska NativeAlaskan AthabascanAlbanianAleutAlsatianAmericanApacheArabArapahoArgentineanArmenianAustralianAustrianBahamianBangladeshiBarbadianBasqueBelgianBelizeanBermudanBhutaneseBlackfeetBolivianBrazilianBritishBritish West IndianBulgarianBurmeseCajunCambodianCanadianCape VerdeanCarpatho RusynCelticCentral AmericanCentral American IndianCherokeeCheyenneChickasawChileanChineseChippewaChoctawColombianColvilleComancheCosta RicanCreeCreekCroatianCrowCubanCypriotCzechCzechoslovakianDanishDelawareDominicanDutchDutch West IndianEastern EuropeanEcuadorianEgyptianEnglishEstonianEthiopianEuropeanFijianFilipinoFinnishFrenchFrench American IndianFrench CanadianGermanGerman RussianGhanaianGreekGuamanian/ChamorroGuatemalanGuyaneseHaitianHmongHonduranHopiHoumaHungarianIcelanderIndian (Asian)IndonesianInupiatIranianIraqiIrishIroquoisIsraeliItalianJamaicanJapaneseJordanianKenyanKiowaKoreanLaotianLatvianLebaneseLiberianLithuanianLumbeeLuxembourgerMacedonianMalaysianMalteseMarshalleseMenomineeMexicanMexican American IndianMongolianMoroccanNative HawaiianNavajoNepaleseNew ZealanderNicaraguanNigerianNorthern EuropeanNorwegianOkinawanOsageOttawaPaiutePakistaniPalestinianPanamanianParaguayanPennsylvania GermanPeruvianPimaPolishPortuguesePotawatomiPuebloPuerto RicanPuget Sound SalishRomanianRussianSalvadoranSamoanScandinavianScotch-IrishScottishSeminoleSenegaleseSerbianShoshoneSierra LeoneanSiouxSlavicSlovakSloveneSomaliSouth AfricanSouth AmericanSouth American IndianSoviet UnionSpaniardSpanishSpanish AmericanSpanish American IndianSri LankanSubsaharan AfricanSudaneseSwedishSwissSyrianTaiwaneseThaiTlingit-HaidaTohono O'OdhamTonganTrinidadian and TobagonianTsimshianTurkishU.S. Virgin IslanderUgandanUkrainianUruguayanUteVenezuelanVietnameseWelshWest IndianYakamaYaquiYugoslavianYumanYup'ikZimbabwean
Immigration
NonimmigrantsImmigrantsAfghanistanAfricaAlbaniaArgentinaArmeniaAsiaAustraliaAustriaBahamasBangladeshBarbadosBelarusBelgiumBelizeBoliviaBosnia and HerzegovinaBrazilBulgariaBurma/MyanmarCabo VerdeCambodiaCameroonCanadaCaribbeanCentral AmericaChileChinaColombiaCongoCosta RicaCroatiaCubaCzechoslovakiaDenmarkDominicaDominican RepublicEastern AfricaEastern AsiaEastern EuropeEcuadorEgyptEl SalvadorEnglandEritreaEthiopiaEuropeFijiFranceGermanyGhanaGreeceGrenadaGuatemalaGuyanaHaitiHondurasHong KongHungaryIndiaIndonesiaIranIraqIrelandIsraelItalyJamaicaJapanJordanKazakhstanKenyaKoreaKuwaitLaosLatin AmericaLatviaLebanonLiberiaLithuaniaMalaysiaMexicoMicronesiaMiddle AfricaMoldovaMoroccoNepalNetherlandsNicaraguaNigeriaNorth AmericaNorth MacedoniaNorthern AfricaNorthern EuropeNorwayOceaniaPakistanPanamaPeruPhilippinesPolandPortugalRomaniaRussiaSaudi ArabiaScotlandSenegalSerbiaSierra LeoneSingaporeSomaliaSouth AfricaSouth AmericaSouth Central AsiaSouth Eastern AsiaSouthern EuropeSpainSri LankaSt. Vincent and the GrenadinesSudanSwedenSwitzerlandSyriaTaiwanThailandTrinidad and TobagoTurkeyUgandaUkraineUruguayUzbekistanVenezuelaVietnamWest IndiesWestern AfricaWestern AsiaWestern EuropeYemenZaireZimbabweAzores
Births to Unmarried Women
Income
Poverty
Unemployment
Labor Participation
Family Structure
Vehicle Availability
Education Level
Disability

Births to Unmarried Women Comparison

Assyrians/Chaldeans/Syriacs

Bhutanese

Exceptional
Exceptional
22.0%
BIRTHS TO UNMARRIED WOMEN
100.0/ 100
METRIC RATING
1st/ 347
METRIC RANK
27.9%
BIRTHS TO UNMARRIED WOMEN
99.4/ 100
METRIC RATING
52nd/ 347
METRIC RANK

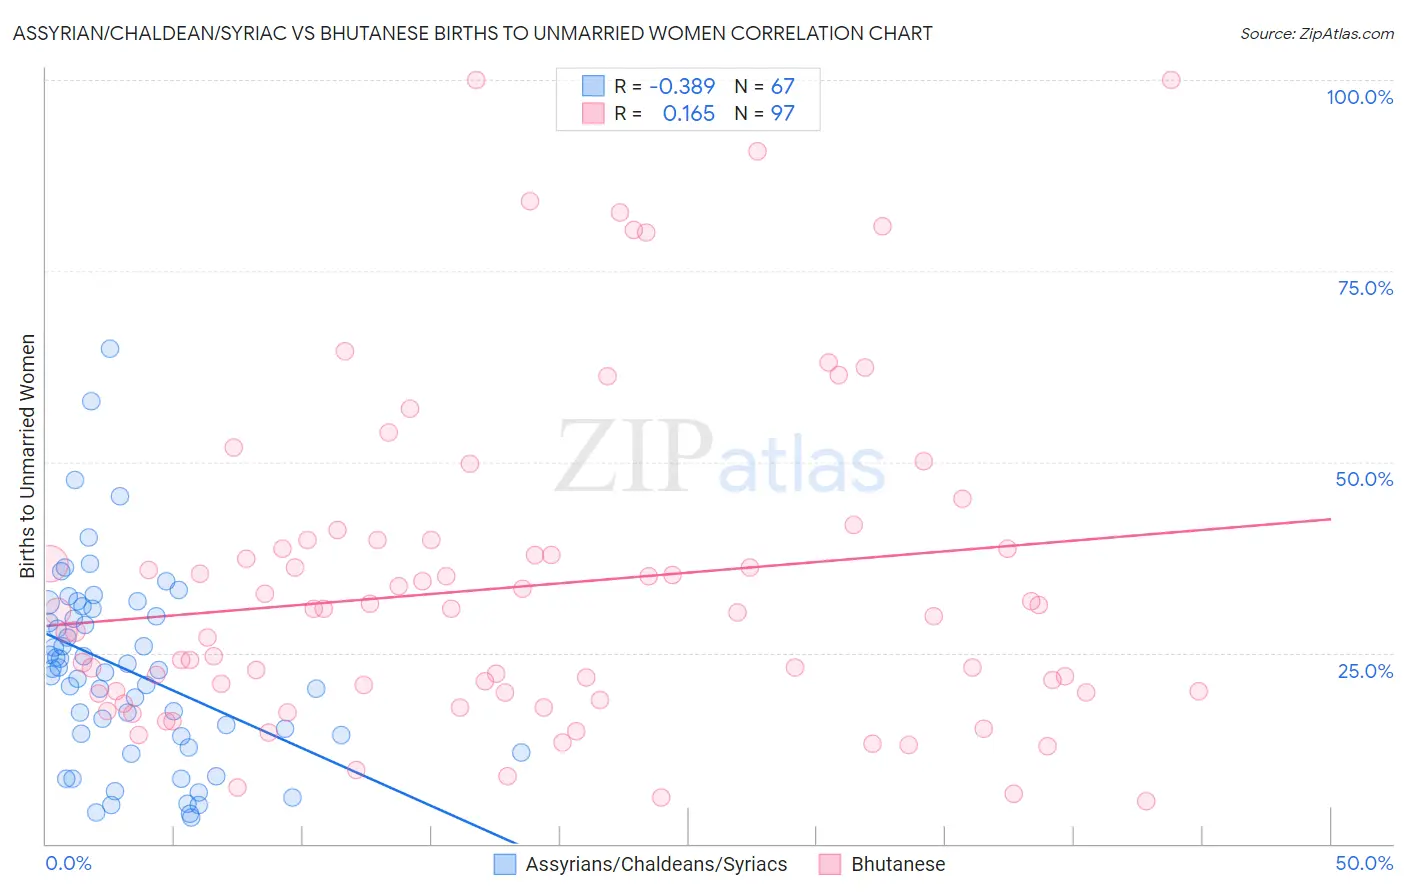
Assyrian/Chaldean/Syriac vs Bhutanese Births to Unmarried Women Correlation Chart

The statistical analysis conducted on geographies consisting of 106,724,446 people shows a mild negative correlation between the proportion of Assyrians/Chaldeans/Syriacs and percentage of births to unmarried women in the United States with a correlation coefficient (R) of -0.389 and weighted average of 22.0%. Similarly, the statistical analysis conducted on geographies consisting of 420,866,190 people shows a poor positive correlation between the proportion of Bhutanese and percentage of births to unmarried women in the United States with a correlation coefficient (R) of 0.165 and weighted average of 27.9%, a difference of 26.9%.
Assyrian/Chaldean/Syriac vs Bhutanese Births to Unmarried Women

Births to Unmarried Women Correlation Summary

MeasurementAssyrian/Chaldean/SyriacBhutanese
Minimum3.5%5.5%
Maximum64.8%100.0%
Range61.3%94.5%
Mean22.7%33.6%
Median22.7%30.3%
Interquartile 25% (IQ1)14.0%19.7%
Interquartile 75% (IQ3)30.8%39.2%
Interquartile Range (IQR)16.8%19.4%
Standard Deviation (Sample)12.6%21.1%
Standard Deviation (Population)12.5%21.0%

Similar Demographics by Births to Unmarried Women

Demographics Similar to Assyrians/Chaldeans/Syriacs by Births to Unmarried Women

In terms of births to unmarried women, the demographic groups most similar to Assyrians/Chaldeans/Syriacs are Immigrants from India (22.9%, a difference of 4.2%), Filipino (23.0%, a difference of 4.6%), Immigrants from Taiwan (23.0%, a difference of 4.7%), Immigrants from Hong Kong (23.6%, a difference of 7.3%), and Immigrants from Iran (24.0%, a difference of 9.0%).
DemographicsRating | RankBirths to Unmarried Women
Assyrians/Chaldeans/Syriacs
100.0
/100
|
#1
Exceptional
22.0%
Immigrants | India
100.0
/100
|
#2
Exceptional
22.9%
Filipinos
100.0
/100
|
#3
Exceptional
23.0%
Immigrants | Taiwan
100.0
/100
|
#4
Exceptional
23.0%
Immigrants | Hong Kong
100.0
/100
|
#5
Exceptional
23.6%
Immigrants | Iran
100.0
/100
|
#6
Exceptional
24.0%
Thais
100.0
/100
|
#7
Exceptional
24.0%
Immigrants | China
100.0
/100
|
#8
Exceptional
24.7%
Immigrants | South Central Asia
100.0
/100
|
#9
Exceptional
24.7%
Immigrants | Eastern Asia
100.0
/100
|
#10
Exceptional
25.0%
Immigrants | Israel
100.0
/100
|
#11
Exceptional
25.1%
Indians (Asian)
100.0
/100
|
#12
Exceptional
25.3%
Iranians
100.0
/100
|
#13
Exceptional
25.3%
Immigrants | Lebanon
100.0
/100
|
#14
Exceptional
25.3%
Immigrants | Singapore
100.0
/100
|
#15
Exceptional
25.6%

Demographics Similar to Bhutanese by Births to Unmarried Women

In terms of births to unmarried women, the demographic groups most similar to Bhutanese are Immigrants from Romania (27.9%, a difference of 0.020%), Macedonian (27.9%, a difference of 0.040%), Afghan (27.9%, a difference of 0.090%), Mongolian (27.9%, a difference of 0.12%), and Maltese (27.8%, a difference of 0.17%).
DemographicsRating | RankBirths to Unmarried Women
Latvians
99.5
/100
|
#45
Exceptional
27.7%
Immigrants | Lithuania
99.5
/100
|
#46
Exceptional
27.7%
Hmong
99.5
/100
|
#47
Exceptional
27.7%
Eastern Europeans
99.5
/100
|
#48
Exceptional
27.7%
Immigrants | Greece
99.4
/100
|
#49
Exceptional
27.8%
Maltese
99.4
/100
|
#50
Exceptional
27.8%
Macedonians
99.4
/100
|
#51
Exceptional
27.9%
Bhutanese
99.4
/100
|
#52
Exceptional
27.9%
Immigrants | Romania
99.4
/100
|
#53
Exceptional
27.9%
Afghans
99.4
/100
|
#54
Exceptional
27.9%
Mongolians
99.3
/100
|
#55
Exceptional
27.9%
Immigrants | Belgium
99.3
/100
|
#56
Exceptional
28.0%
Russians
99.2
/100
|
#57
Exceptional
28.0%
Immigrants | Albania
99.2
/100
|
#58
Exceptional
28.0%
Immigrants | Kazakhstan
99.1
/100
|
#59
Exceptional
28.1%