English vs Czech Male Disability
COMPARE
English
Czech
Male Disability
Male Disability Comparison
English
Czechs
12.8%
MALE DISABILITY
0.0/ 100
METRIC RATING
292nd/ 347
METRIC RANK
11.9%
MALE DISABILITY
1.1/ 100
METRIC RATING
240th/ 347
METRIC RANK
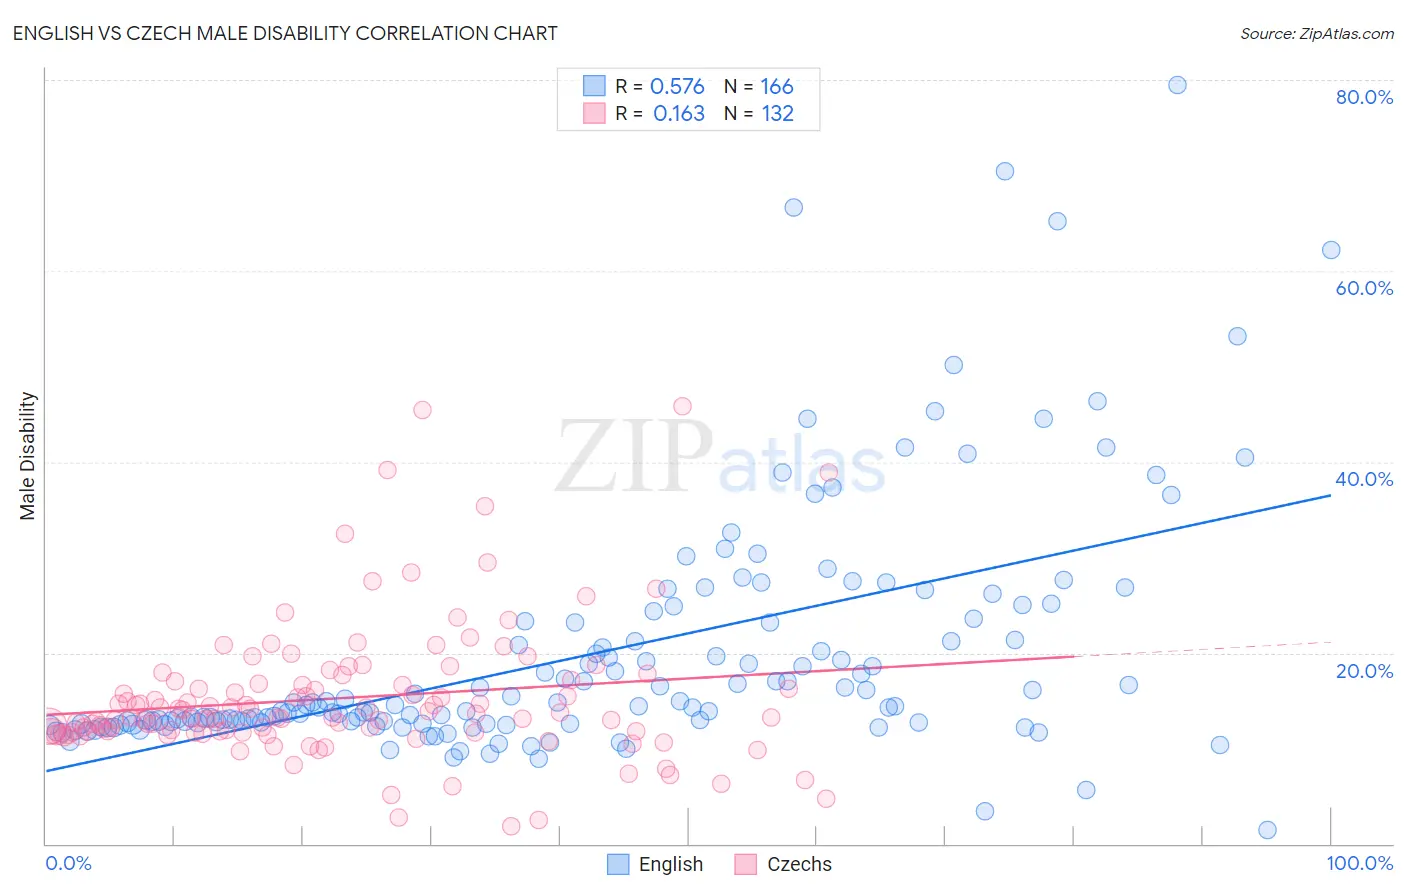
English vs Czech Male Disability Correlation Chart
The statistical analysis conducted on geographies consisting of 579,503,063 people shows a substantial positive correlation between the proportion of English and percentage of males with a disability in the United States with a correlation coefficient (R) of 0.576 and weighted average of 12.8%. Similarly, the statistical analysis conducted on geographies consisting of 484,720,527 people shows a poor positive correlation between the proportion of Czechs and percentage of males with a disability in the United States with a correlation coefficient (R) of 0.163 and weighted average of 11.9%, a difference of 7.9%.
Male Disability Correlation Summary
| Measurement | English | Czech |
| Minimum | 1.4% | 1.8% |
| Maximum | 79.4% | 45.8% |
| Range | 78.0% | 44.0% |
| Mean | 19.9% | 15.3% |
| Median | 14.4% | 13.3% |
| Interquartile 25% (IQ1) | 12.6% | 11.6% |
| Interquartile 75% (IQ3) | 23.2% | 16.9% |
| Interquartile Range (IQR) | 10.6% | 5.3% |
| Standard Deviation (Sample) | 12.8% | 7.2% |
| Standard Deviation (Population) | 12.8% | 7.2% |
Similar Demographics by Male Disability
Demographics Similar to English by Male Disability
In terms of male disability, the demographic groups most similar to English are White/Caucasian (12.8%, a difference of 0.060%), Pima (12.8%, a difference of 0.15%), Yaqui (12.9%, a difference of 0.29%), Immigrants from Cabo Verde (12.8%, a difference of 0.30%), and Yup'ik (12.8%, a difference of 0.49%).
| Demographics | Rating | Rank | Male Disability |
| Welsh | 0.0 /100 | #285 | Tragic 12.7% |
| Scottish | 0.0 /100 | #286 | Tragic 12.8% |
| Cape Verdeans | 0.0 /100 | #287 | Tragic 12.8% |
| Yup'ik | 0.0 /100 | #288 | Tragic 12.8% |
| Immigrants | Cabo Verde | 0.0 /100 | #289 | Tragic 12.8% |
| Pima | 0.0 /100 | #290 | Tragic 12.8% |
| Whites/Caucasians | 0.0 /100 | #291 | Tragic 12.8% |
| English | 0.0 /100 | #292 | Tragic 12.8% |
| Yaqui | 0.0 /100 | #293 | Tragic 12.9% |
| Marshallese | 0.0 /100 | #294 | Tragic 12.9% |
| Immigrants | Micronesia | 0.0 /100 | #295 | Tragic 12.9% |
| Immigrants | Nonimmigrants | 0.0 /100 | #296 | Tragic 12.9% |
| Inupiat | 0.0 /100 | #297 | Tragic 13.0% |
| Pennsylvania Germans | 0.0 /100 | #298 | Tragic 13.0% |
| Celtics | 0.0 /100 | #299 | Tragic 13.0% |
Demographics Similar to Czechs by Male Disability
In terms of male disability, the demographic groups most similar to Czechs are Bahamian (11.9%, a difference of 0.040%), Italian (11.9%, a difference of 0.050%), Northern European (11.9%, a difference of 0.050%), Samoan (11.9%, a difference of 0.080%), and Yugoslavian (11.9%, a difference of 0.10%).
| Demographics | Rating | Rank | Male Disability |
| Mexicans | 1.7 /100 | #233 | Tragic 11.8% |
| Immigrants | Canada | 1.6 /100 | #234 | Tragic 11.9% |
| Immigrants | North America | 1.5 /100 | #235 | Tragic 11.9% |
| U.S. Virgin Islanders | 1.3 /100 | #236 | Tragic 11.9% |
| Carpatho Rusyns | 1.3 /100 | #237 | Tragic 11.9% |
| Yugoslavians | 1.2 /100 | #238 | Tragic 11.9% |
| Italians | 1.2 /100 | #239 | Tragic 11.9% |
| Czechs | 1.1 /100 | #240 | Tragic 11.9% |
| Bahamians | 1.1 /100 | #241 | Tragic 11.9% |
| Northern Europeans | 1.1 /100 | #242 | Tragic 11.9% |
| Samoans | 1.1 /100 | #243 | Tragic 11.9% |
| Immigrants | Laos | 1.0 /100 | #244 | Tragic 11.9% |
| Immigrants | Liberia | 1.0 /100 | #245 | Tragic 11.9% |
| Danes | 0.9 /100 | #246 | Tragic 11.9% |
| Hungarians | 0.8 /100 | #247 | Tragic 12.0% |