Zip Codes with the Highest Percentage of Population Taking Taxi / Cab to Work in Loveland, CO
RELATED REPORTS & OPTIONS
Taxi / Cab
Loveland
Compare Zip Codes
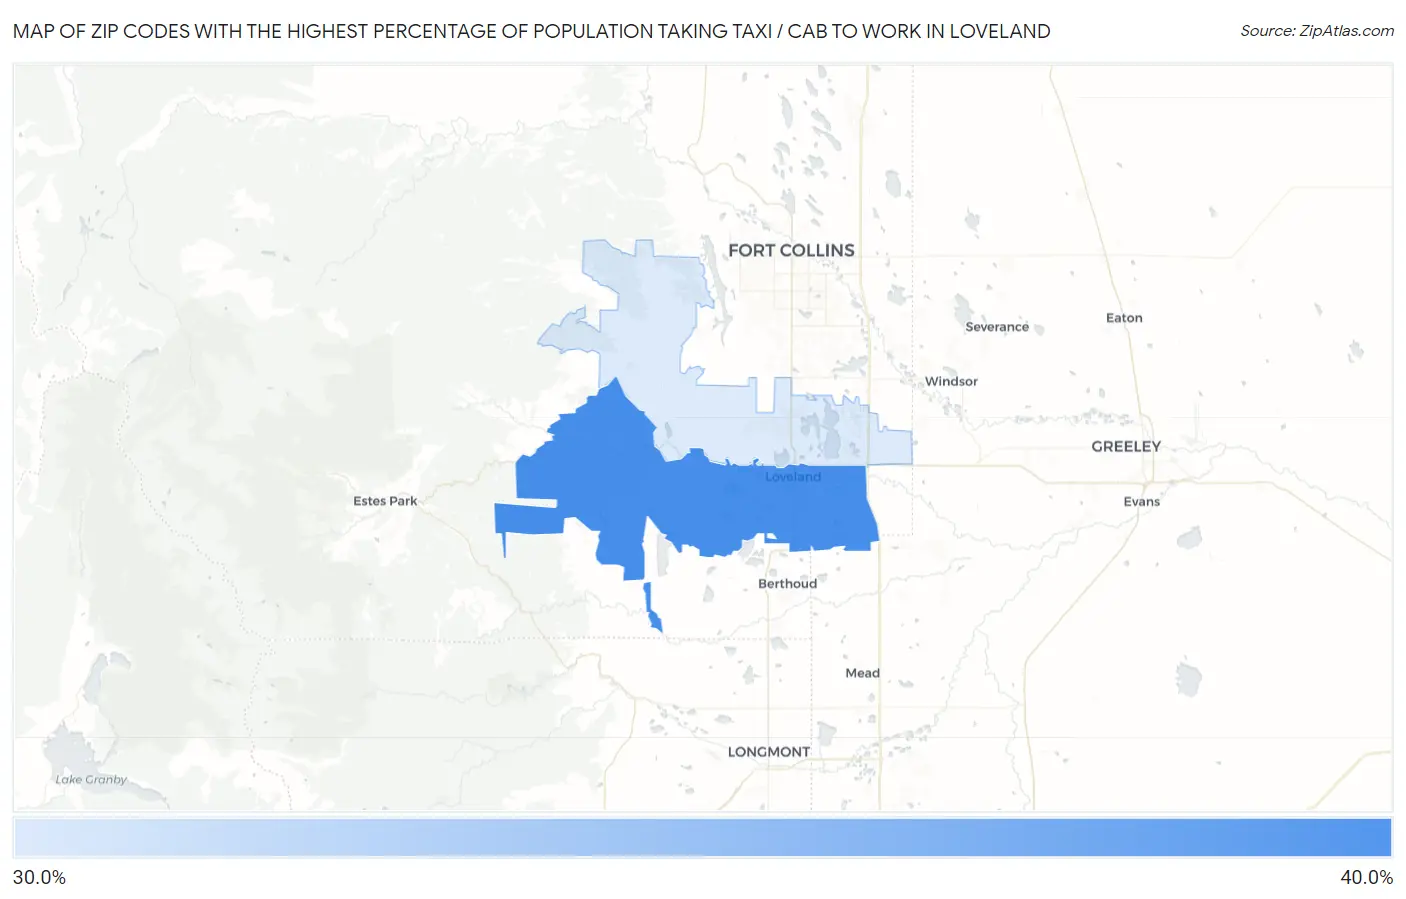
Map of Zip Codes with the Highest Percentage of Population Taking Taxi / Cab to Work in Loveland
39.6%
40.0%
Zip Codes with the Highest Percentage of Population Taking Taxi / Cab to Work in Loveland, CO
| Zip Code | % Take Taxi / Cab | vs State | vs National | |
| 1. | 80537 | 40.0% | 37.4%(+2.60)#102 | 38.2%(+1.80)#6,611 |
| 2. | 80538 | 39.6% | 37.4%(+2.20)#106 | 38.2%(+1.40)#6,777 |
1
Common Questions
What are the Top Zip Codes with the Highest Percentage of Population Taking Taxi / Cab to Work in Loveland, CO?
Top Zip Codes with the Highest Percentage of Population Taking Taxi / Cab to Work in Loveland, CO are:
What zip code has the Highest Percentage of Population Taking Taxi / Cab to Work in Loveland, CO?
80537 has the Highest Percentage of Population Taking Taxi / Cab to Work in Loveland, CO with 40.0%.
What is the Percentage of Population Taking Taxi / Cab to Work in Loveland, CO?
Percentage of Population Taking Taxi / Cab to Work in Loveland is 39.4%.
What is the Percentage of Population Taking Taxi / Cab to Work in Colorado?
Percentage of Population Taking Taxi / Cab to Work in Colorado is 37.4%.
What is the Percentage of Population Taking Taxi / Cab to Work in the United States?
Percentage of Population Taking Taxi / Cab to Work in the United States is 38.2%.