Zip Codes with the Highest Percentage of Population with a Degree in Science and Engineering in Loveland, CO
RELATED REPORTS & OPTIONS
Science and Engineering
Loveland
Compare Zip Codes
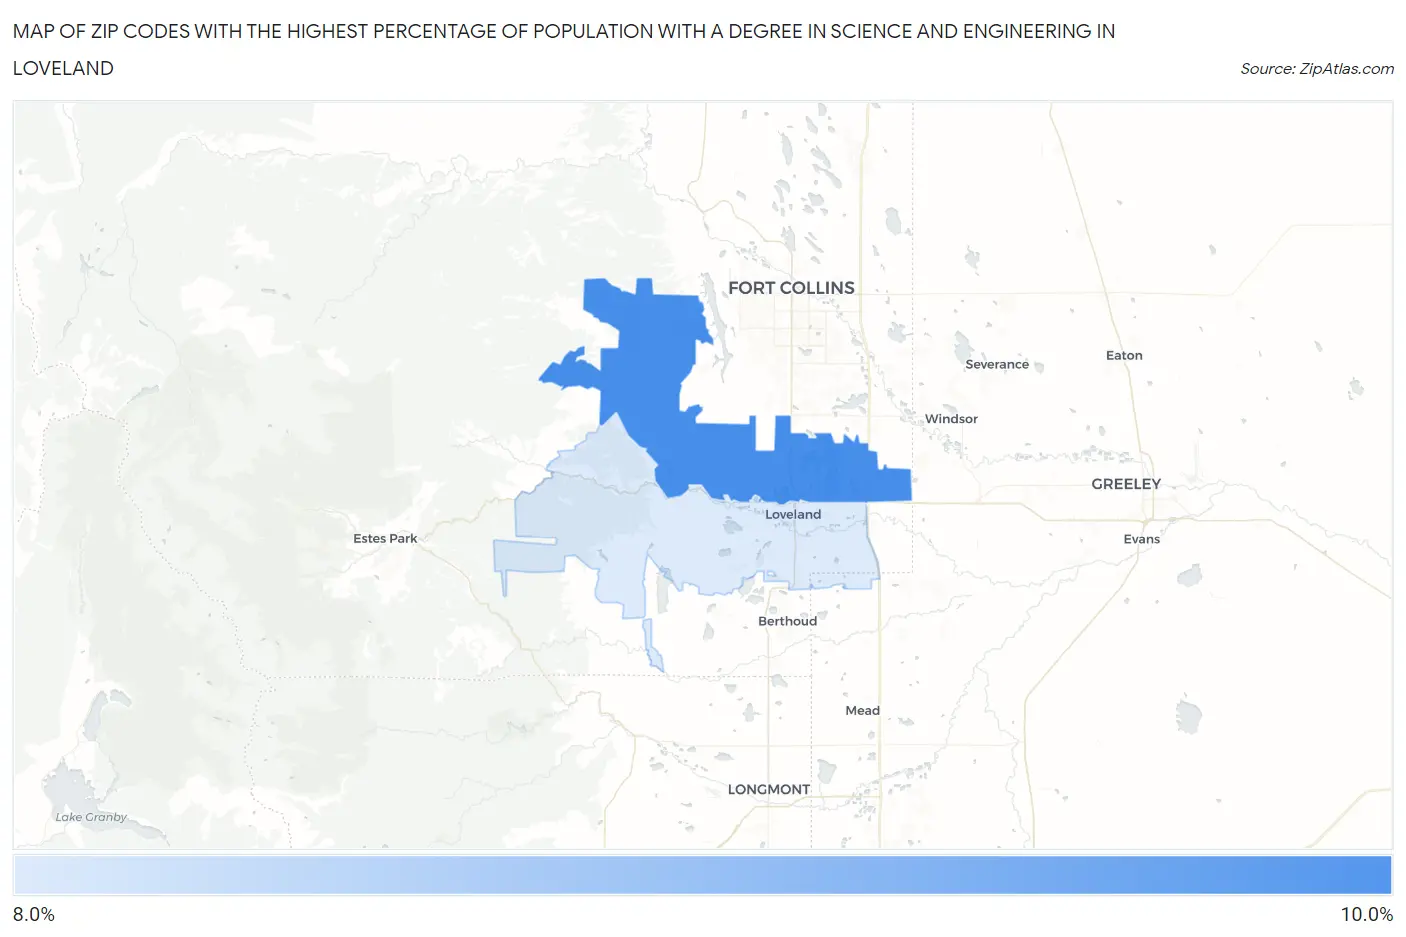
Map of Zip Codes with the Highest Percentage of Population with a Degree in Science and Engineering in Loveland
8.5%
9.9%
Zip Codes with the Highest Percentage of Population with a Degree in Science and Engineering in Loveland, CO
| Zip Code | % Graduates | vs State | vs National | |
| 1. | 80538 | 9.9% | 8.5%(+1.44)#170 | 9.8%(+0.136)#15,202 |
| 2. | 80537 | 8.5% | 8.5%(+0.031)#230 | 9.8%(-1.27)#18,443 |
1
Common Questions
What are the Top Zip Codes with the Highest Percentage of Population with a Degree in Science and Engineering in Loveland, CO?
Top Zip Codes with the Highest Percentage of Population with a Degree in Science and Engineering in Loveland, CO are:
What zip code has the Highest Percentage of Population with a Degree in Science and Engineering in Loveland, CO?
80538 has the Highest Percentage of Population with a Degree in Science and Engineering in Loveland, CO with 9.9%.
What is the Percentage of Population with a Degree in Science and Engineering in Loveland, CO?
Percentage of Population with a Degree in Science and Engineering in Loveland is 10.1%.
What is the Percentage of Population with a Degree in Science and Engineering in Colorado?
Percentage of Population with a Degree in Science and Engineering in Colorado is 8.5%.
What is the Percentage of Population with a Degree in Science and Engineering in the United States?
Percentage of Population with a Degree in Science and Engineering in the United States is 9.8%.