Zip Codes with the Highest Percentage of Population Employed in Sales & Related in Loveland, CO
RELATED REPORTS & OPTIONS
Sales & Related
Loveland
Compare Zip Codes
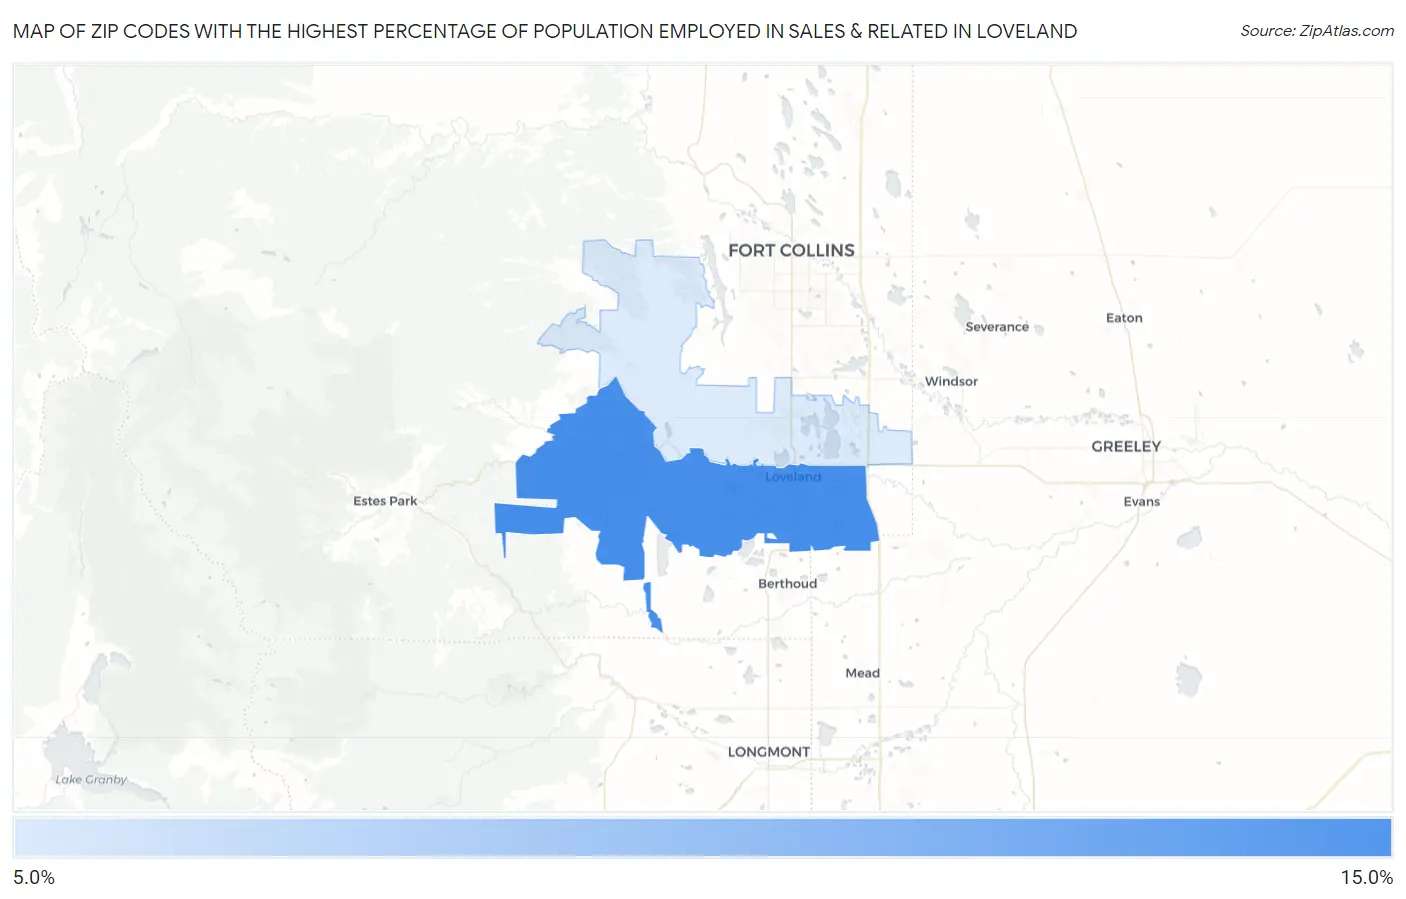
Map of Zip Codes with the Highest Percentage of Population Employed in Sales & Related in Loveland
10.5%
11.2%
Zip Codes with the Highest Percentage of Population Employed in Sales & Related in Loveland, CO
| Zip Code | % Employed | vs State | vs National | |
| 1. | 80537 | 11.2% | 9.9%(+1.31)#130 | 9.6%(+1.59)#7,729 |
| 2. | 80538 | 10.5% | 9.9%(+0.609)#160 | 9.6%(+0.888)#9,570 |
1
Common Questions
What are the Top Zip Codes with the Highest Percentage of Population Employed in Sales & Related in Loveland, CO?
Top Zip Codes with the Highest Percentage of Population Employed in Sales & Related in Loveland, CO are:
What zip code has the Highest Percentage of Population Employed in Sales & Related in Loveland, CO?
80537 has the Highest Percentage of Population Employed in Sales & Related in Loveland, CO with 11.2%.
What is the Percentage of Population Employed in Sales & Related in Loveland, CO?
Percentage of Population Employed in Sales & Related in Loveland is 11.0%.
What is the Percentage of Population Employed in Sales & Related in Colorado?
Percentage of Population Employed in Sales & Related in Colorado is 9.9%.
What is the Percentage of Population Employed in Sales & Related in the United States?
Percentage of Population Employed in Sales & Related in the United States is 9.6%.