Zip Codes with the Highest Percentage of Population Employed in Office & Administration in Loveland, CO
RELATED REPORTS & OPTIONS
Office & Administration
Loveland
Compare Zip Codes
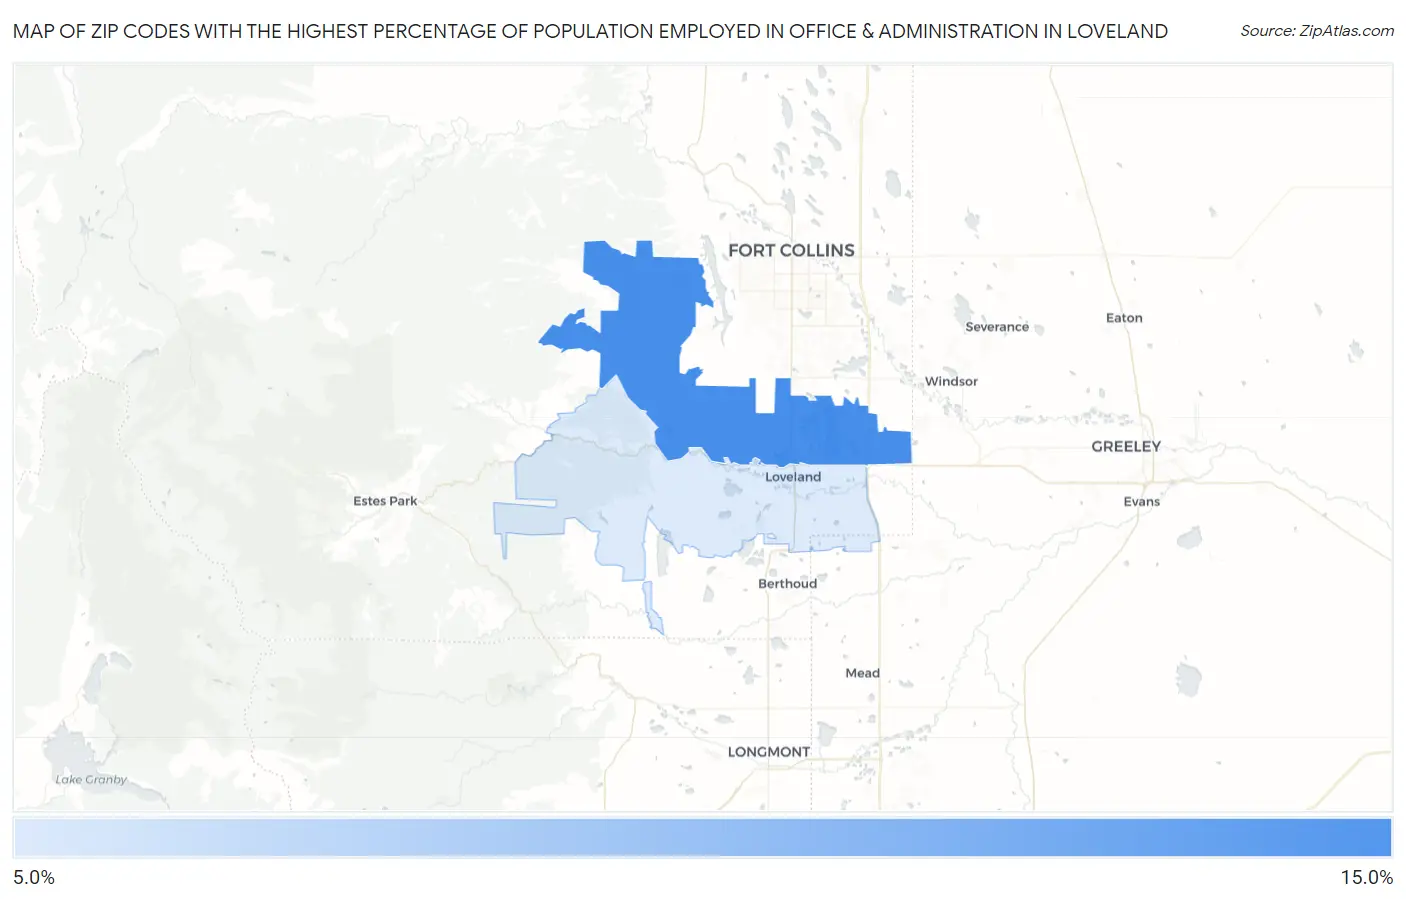
Map of Zip Codes with the Highest Percentage of Population Employed in Office & Administration in Loveland
9.2%
10.1%
Zip Codes with the Highest Percentage of Population Employed in Office & Administration in Loveland, CO
| Zip Code | % Employed | vs State | vs National | |
| 1. | 80538 | 10.1% | 10.1%(-0.030)#219 | 10.9%(-0.756)#16,797 |
| 2. | 80537 | 9.2% | 10.1%(-0.958)#260 | 10.9%(-1.68)#19,745 |
1
Common Questions
What are the Top Zip Codes with the Highest Percentage of Population Employed in Office & Administration in Loveland, CO?
Top Zip Codes with the Highest Percentage of Population Employed in Office & Administration in Loveland, CO are:
What zip code has the Highest Percentage of Population Employed in Office & Administration in Loveland, CO?
80538 has the Highest Percentage of Population Employed in Office & Administration in Loveland, CO with 10.1%.
What is the Percentage of Population Employed in Office & Administration in Loveland, CO?
Percentage of Population Employed in Office & Administration in Loveland is 9.8%.
What is the Percentage of Population Employed in Office & Administration in Colorado?
Percentage of Population Employed in Office & Administration in Colorado is 10.1%.
What is the Percentage of Population Employed in Office & Administration in the United States?
Percentage of Population Employed in Office & Administration in the United States is 10.9%.