Zip Codes with the Highest Percentage of Population Employed in Accommodation & Food Services in Loveland, CO
RELATED REPORTS & OPTIONS
Accommodation & Food Services
Loveland
Compare Zip Codes
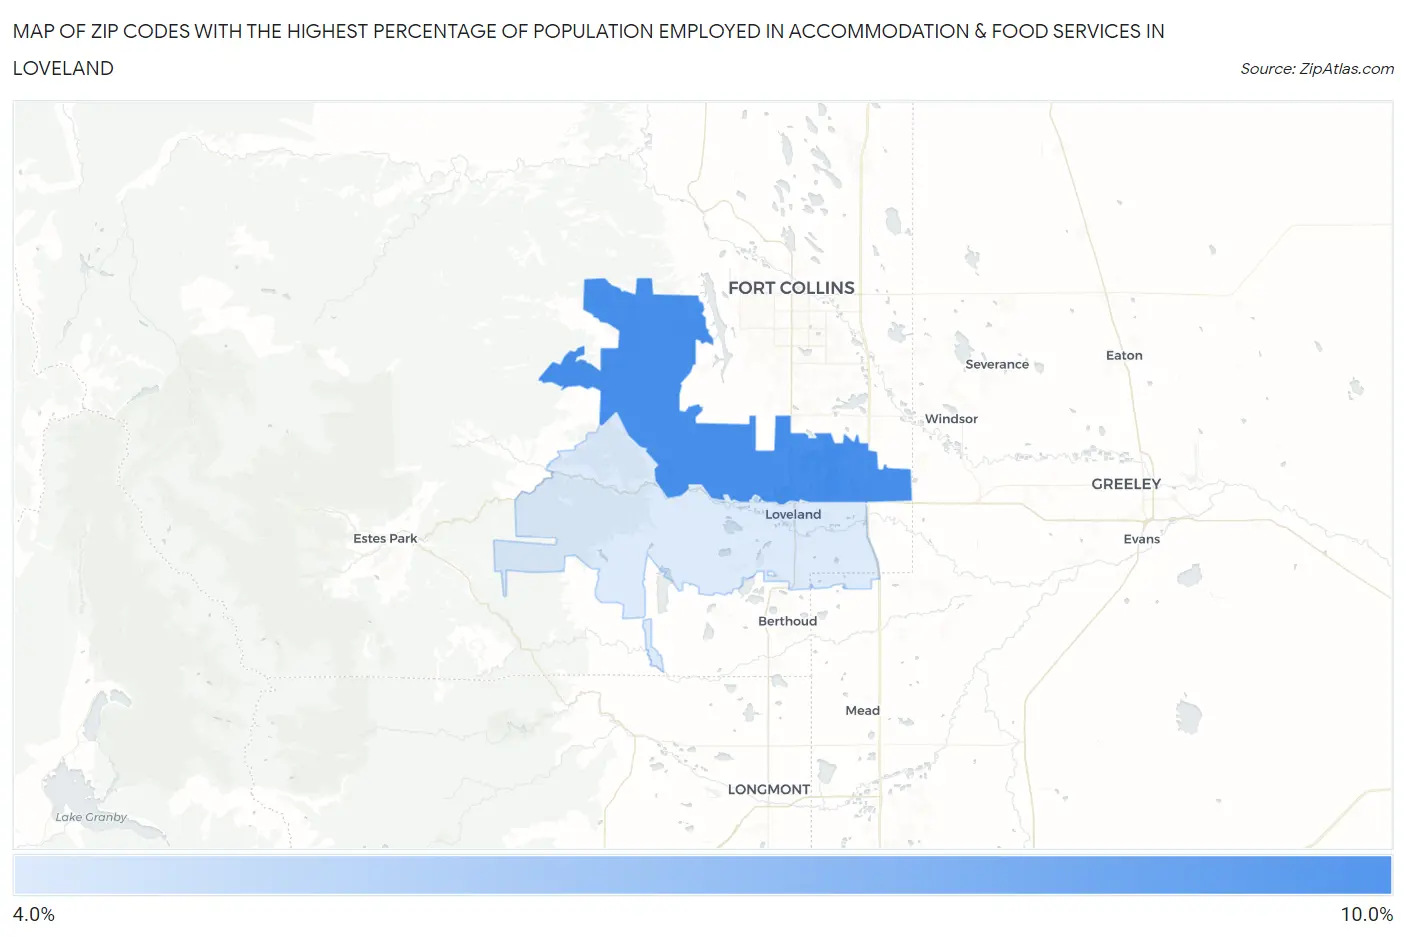
Map of Zip Codes with the Highest Percentage of Population Employed in Accommodation & Food Services in Loveland
5.0%
8.1%
Zip Codes with the Highest Percentage of Population Employed in Accommodation & Food Services in Loveland, CO
| Zip Code | % Employed | vs State | vs National | |
| 1. | 80538 | 8.1% | 6.9%(+1.23)#135 | 6.9%(+1.25)#7,576 |
| 2. | 80537 | 5.0% | 6.9%(-1.94)#282 | 6.9%(-1.92)#16,955 |
1
Common Questions
What are the Top Zip Codes with the Highest Percentage of Population Employed in Accommodation & Food Services in Loveland, CO?
Top Zip Codes with the Highest Percentage of Population Employed in Accommodation & Food Services in Loveland, CO are:
What zip code has the Highest Percentage of Population Employed in Accommodation & Food Services in Loveland, CO?
80538 has the Highest Percentage of Population Employed in Accommodation & Food Services in Loveland, CO with 8.1%.
What is the Percentage of Population Employed in Accommodation & Food Services in Loveland, CO?
Percentage of Population Employed in Accommodation & Food Services in Loveland is 7.0%.
What is the Percentage of Population Employed in Accommodation & Food Services in Colorado?
Percentage of Population Employed in Accommodation & Food Services in Colorado is 6.9%.
What is the Percentage of Population Employed in Accommodation & Food Services in the United States?
Percentage of Population Employed in Accommodation & Food Services in the United States is 6.9%.