Zip Codes with the Highest Percentage of Population Employed in Installation, Maintenance & Repair in Loveland, CO
RELATED REPORTS & OPTIONS
Installation, Maintenance & Repair
Loveland
Compare Zip Codes
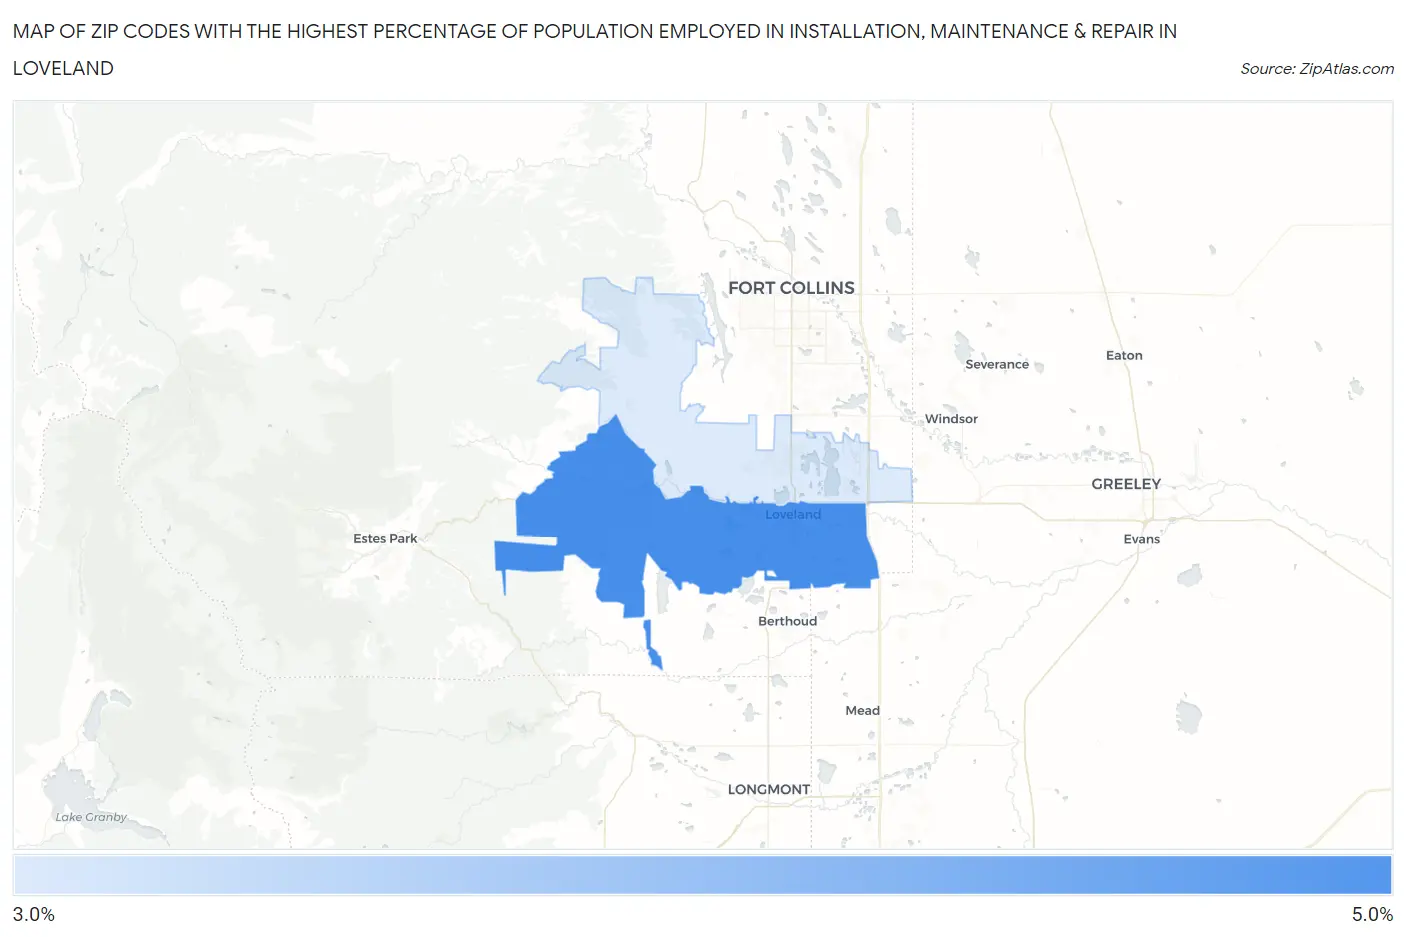
Map of Zip Codes with the Highest Percentage of Population Employed in Installation, Maintenance & Repair in Loveland
3.2%
4.8%
Zip Codes with the Highest Percentage of Population Employed in Installation, Maintenance & Repair in Loveland, CO
| Zip Code | % Employed | vs State | vs National | |
| 1. | 80537 | 4.8% | 2.8%(+1.93)#122 | 3.1%(+1.68)#9,498 |
| 2. | 80538 | 3.2% | 2.8%(+0.370)#210 | 3.1%(+0.124)#16,069 |
1
Common Questions
What are the Top Zip Codes with the Highest Percentage of Population Employed in Installation, Maintenance & Repair in Loveland, CO?
Top Zip Codes with the Highest Percentage of Population Employed in Installation, Maintenance & Repair in Loveland, CO are:
What zip code has the Highest Percentage of Population Employed in Installation, Maintenance & Repair in Loveland, CO?
80537 has the Highest Percentage of Population Employed in Installation, Maintenance & Repair in Loveland, CO with 4.8%.
What is the Percentage of Population Employed in Installation, Maintenance & Repair in Loveland, CO?
Percentage of Population Employed in Installation, Maintenance & Repair in Loveland is 3.7%.
What is the Percentage of Population Employed in Installation, Maintenance & Repair in Colorado?
Percentage of Population Employed in Installation, Maintenance & Repair in Colorado is 2.8%.
What is the Percentage of Population Employed in Installation, Maintenance & Repair in the United States?
Percentage of Population Employed in Installation, Maintenance & Repair in the United States is 3.1%.