Zip Codes with the Highest Percentage of Population Employed in Real Estate, Rental & Leasing in Longmont, CO

RELATED REPORTS & OPTIONS

Real Estate, Rental & Leasing
Population
Families and Households
Female Fertility
Female Fertility (Unmarried)
Race (Community Size)
Race (Percentage)
Ancestry (Community Size)
AfricanAmericanApacheArabArgentineanAustralianAustrianBasqueBelgianBhutaneseBlackfeetBrazilianBritishBulgarianBurmeseCanadianCelticCentral AmericanCentral American IndianCherokeeChileanChoctawColombianCosta RicanCroatianCubanCzechCzechoslovakianDanishDutchEastern EuropeanEcuadorianEnglishEstonianEthiopianEuropeanFilipinoFinnishFrenchFrench CanadianGermanGerman RussianGreekGuatemalanHonduranHungarianIcelanderIndian (Asian)IranianIrishIroquoisItalianJapaneseKoreanLebaneseLithuanianMalaysianMalteseMexicanMexican American IndianNative HawaiianNavajoNorthern EuropeanNorwegianPakistaniPennsylvania GermanPeruvianPolishPortuguesePuebloPuerto RicanRomanianRussianSalvadoranScandinavianScotch-IrishScottishSiouxSlavicSlovakSloveneSouth AfricanSouth AmericanSpaniardSpanishSpanish AmericanSri LankanSubsaharan AfricanSwedishSwissThaiUkrainianUteVenezuelanWelshYugoslavian
Ancestry (Percentage)
AfricanAmericanApacheArabArgentineanAustralianAustrianBasqueBelgianBhutaneseBlackfeetBrazilianBritishBulgarianBurmeseCanadianCelticCentral AmericanCentral American IndianCherokeeChileanChoctawColombianCosta RicanCroatianCubanCzechCzechoslovakianDanishDutchEastern EuropeanEcuadorianEnglishEstonianEthiopianEuropeanFilipinoFinnishFrenchFrench CanadianGermanGerman RussianGreekGuatemalanHonduranHungarianIcelanderIndian (Asian)IranianIrishIroquoisItalianJapaneseKoreanLebaneseLithuanianMalaysianMalteseMexicanMexican American IndianNative HawaiianNavajoNorthern EuropeanNorwegianPakistaniPennsylvania GermanPeruvianPolishPortuguesePuebloPuerto RicanRomanianRussianSalvadoranScandinavianScotch-IrishScottishSiouxSlavicSlovakSloveneSouth AfricanSouth AmericanSpaniardSpanishSpanish AmericanSri LankanSubsaharan AfricanSwedishSwissThaiUkrainianUteVenezuelanWelshYugoslavian
Immigrant Origin (Total)
Immigrant Origin (Percentage)
Income
Income (Families)
Income (Households)
Poverty
Poverty (Families)
Unemployment
Employment Occupations
Employment Industries
Employer Class
Commute Time
Commute Means
School Enrollment
Education by Degree Field
Occupancy
Finances
Physical Characteristics
Longmont
Compare Zip Codes
Comparison Subject

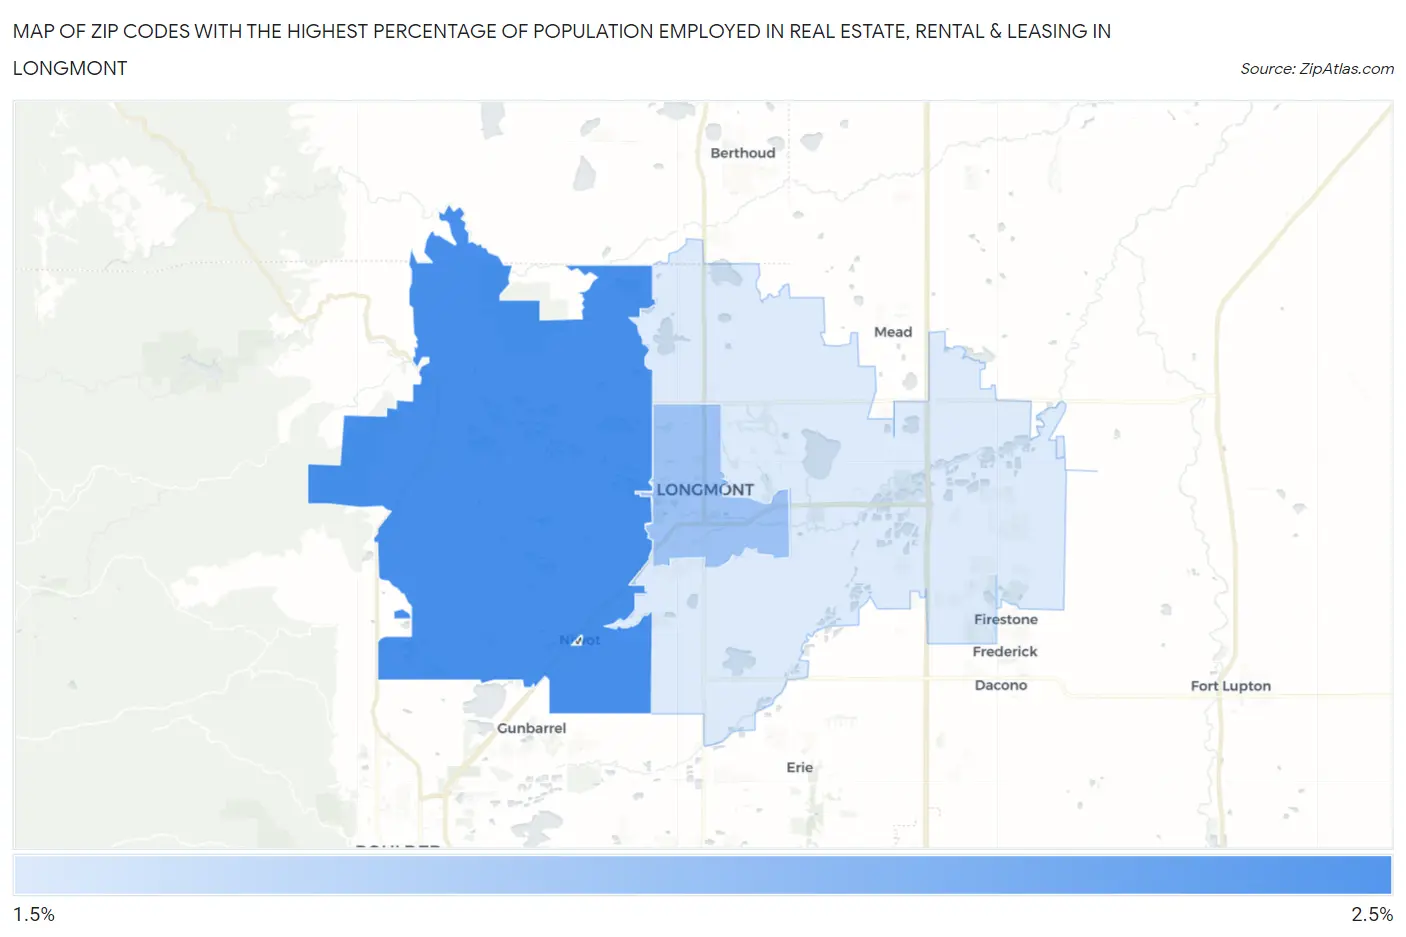
Map of Zip Codes with the Highest Percentage of Population Employed in Real Estate, Rental & Leasing in Longmont

0.0%
2.5%
Zip Codes with the Highest Percentage of Population Employed in Real Estate, Rental & Leasing in Longmont Map

Zip Codes with the Highest Percentage of Population Employed in Real Estate, Rental & Leasing in Longmont, CO

Zip Code % Employed vs State vs National
1.805032.3%2.4%(-0.148)#1811.9%(+0.382)#6,437
2.805012.0%2.4%(-0.457)#2101.9%(+0.073)#8,037
3.805041.7%2.4%(-0.697)#2401.9%(-0.167)#9,587

Common Questions

What are the Top Zip Codes with the Highest Percentage of Population Employed in Real Estate, Rental & Leasing in Longmont, CO?
Top Zip Codes with the Highest Percentage of Population Employed in Real Estate, Rental & Leasing in Longmont, CO are:
#1
2.3%
#2
2.0%
#3
1.7%
What zip code has the Highest Percentage of Population Employed in Real Estate, Rental & Leasing in Longmont, CO?
80503 has the Highest Percentage of Population Employed in Real Estate, Rental & Leasing in Longmont, CO with 2.3%.
What is the Percentage of Population Employed in Real Estate, Rental & Leasing in Longmont, CO?
Percentage of Population Employed in Real Estate, Rental & Leasing in Longmont is 1.9%.
What is the Percentage of Population Employed in Real Estate, Rental & Leasing in Colorado?
Percentage of Population Employed in Real Estate, Rental & Leasing in Colorado is 2.4%.
What is the Percentage of Population Employed in Real Estate, Rental & Leasing in the United States?
Percentage of Population Employed in Real Estate, Rental & Leasing in the United States is 1.9%.