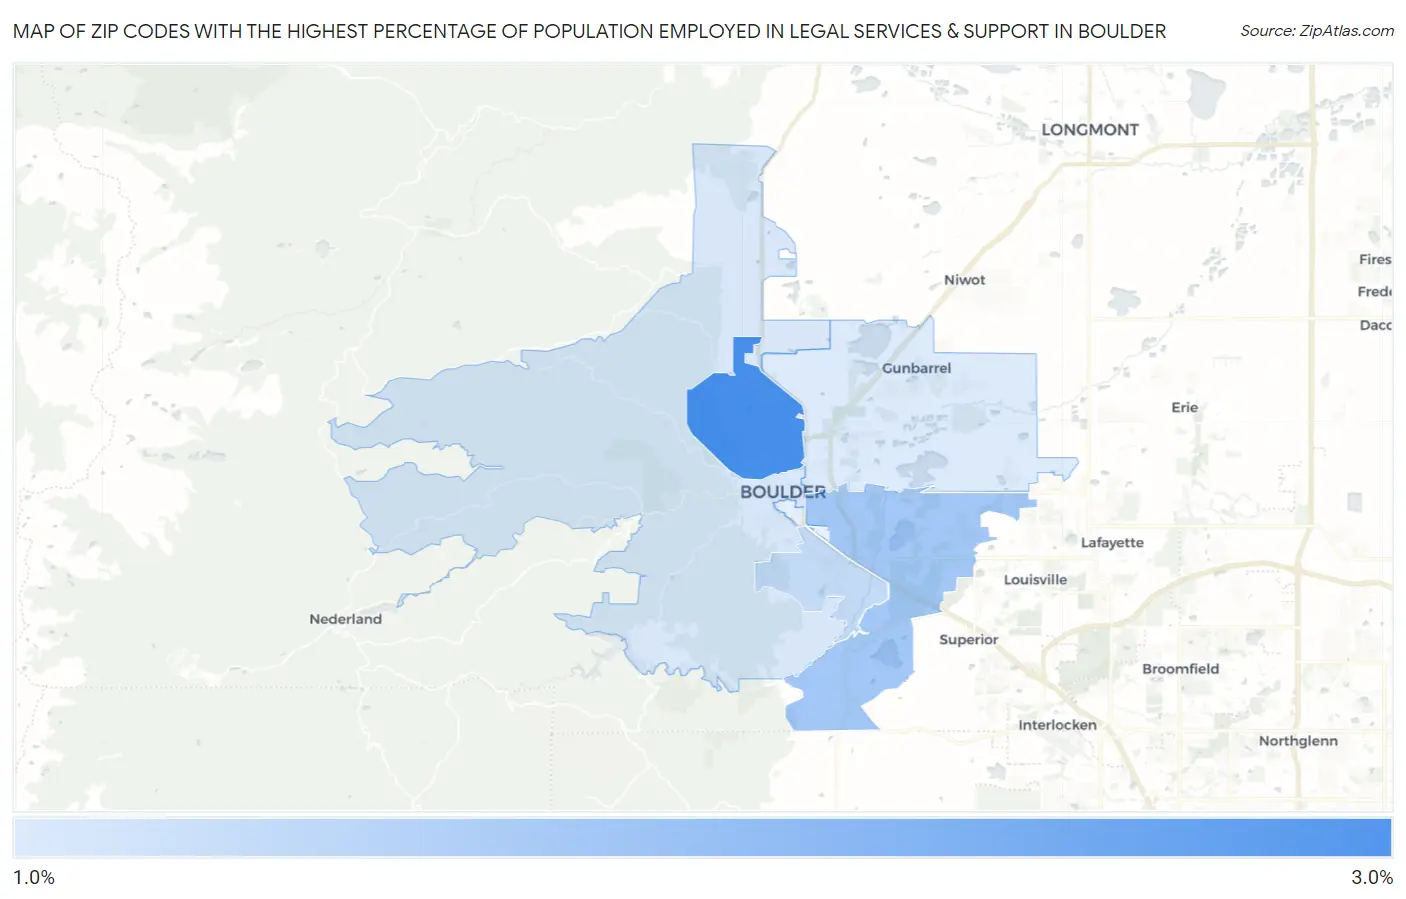
Zip Codes with the Highest Percentage of Population Employed in Legal Services & Support in Boulder, CO
RELATED REPORTS & OPTIONS
Legal Services & Support
Boulder
Compare Zip Codes
Map of Zip Codes with the Highest Percentage of Population Employed in Legal Services & Support in Boulder
1.4%
3.0%
Zip Codes with the Highest Percentage of Population Employed in Legal Services & Support in Boulder, CO
| Zip Code | % Employed | vs State | vs National | |
| 1. | 80304 | 3.0% | 1.2%(+1.77)#27 | 1.2%(+1.77)#1,900 |
| 2. | 80303 | 2.0% | 1.2%(+0.823)#67 | 1.2%(+0.824)#3,464 |
| 3. | 80305 | 1.7% | 1.2%(+0.491)#90 | 1.2%(+0.492)#4,401 |
| 4. | 80302 | 1.4% | 1.2%(+0.263)#108 | 1.2%(+0.263)#5,260 |
| 5. | 80301 | 1.4% | 1.2%(+0.226)#112 | 1.2%(+0.227)#5,422 |
1
Common Questions
What are the Top 5 Zip Codes with the Highest Percentage of Population Employed in Legal Services & Support in Boulder, CO?
Top 5 Zip Codes with the Highest Percentage of Population Employed in Legal Services & Support in Boulder, CO are:
What zip code has the Highest Percentage of Population Employed in Legal Services & Support in Boulder, CO?
80304 has the Highest Percentage of Population Employed in Legal Services & Support in Boulder, CO with 3.0%.
What is the Percentage of Population Employed in Legal Services & Support in Boulder, CO?
Percentage of Population Employed in Legal Services & Support in Boulder is 1.8%.
What is the Percentage of Population Employed in Legal Services & Support in Colorado?
Percentage of Population Employed in Legal Services & Support in Colorado is 1.2%.
What is the Percentage of Population Employed in Legal Services & Support in the United States?
Percentage of Population Employed in Legal Services & Support in the United States is 1.2%.