Zip Codes with the Highest Percentage of Population Employed in Legal Services & Support in Arvada, CO
RELATED REPORTS & OPTIONS
Legal Services & Support
Arvada
Compare Zip Codes
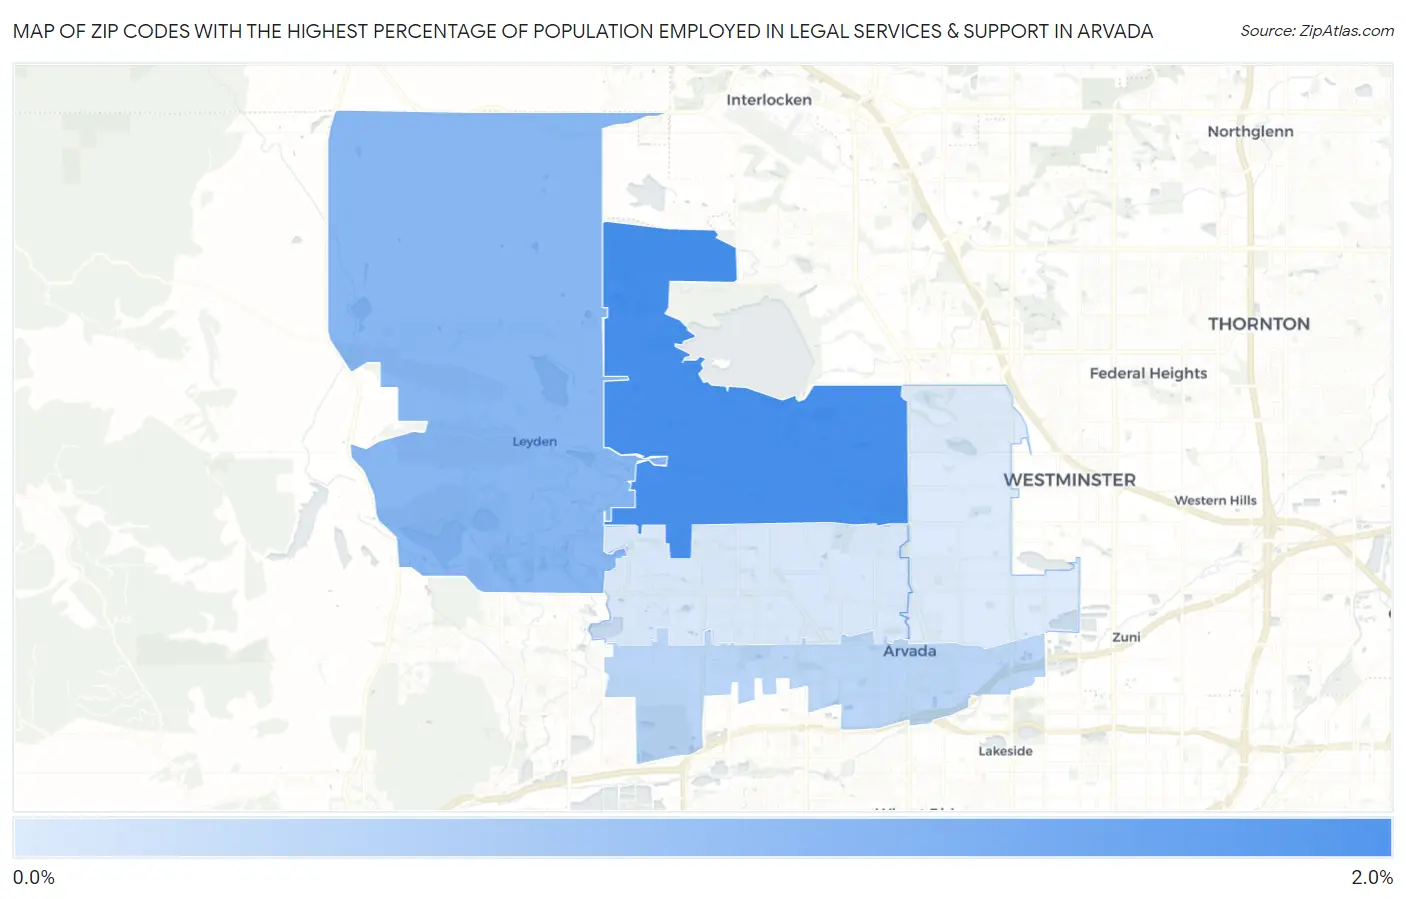
Map of Zip Codes with the Highest Percentage of Population Employed in Legal Services & Support in Arvada
0.63%
1.8%
Zip Codes with the Highest Percentage of Population Employed in Legal Services & Support in Arvada, CO
| Zip Code | % Employed | vs State | vs National | |
| 1. | 80005 | 1.8% | 1.2%(+0.596)#82 | 1.2%(+0.597)#4,053 |
| 2. | 80007 | 1.3% | 1.2%(+0.097)#126 | 1.2%(+0.098)#6,033 |
| 3. | 80002 | 0.90% | 1.2%(-0.281)#167 | 1.2%(-0.280)#8,567 |
| 4. | 80004 | 0.66% | 1.2%(-0.526)#207 | 1.2%(-0.525)#10,848 |
| 5. | 80003 | 0.63% | 1.2%(-0.553)#216 | 1.2%(-0.553)#11,118 |
1
Common Questions
What are the Top 3 Zip Codes with the Highest Percentage of Population Employed in Legal Services & Support in Arvada, CO?
Top 3 Zip Codes with the Highest Percentage of Population Employed in Legal Services & Support in Arvada, CO are:
What zip code has the Highest Percentage of Population Employed in Legal Services & Support in Arvada, CO?
80005 has the Highest Percentage of Population Employed in Legal Services & Support in Arvada, CO with 1.8%.
What is the Percentage of Population Employed in Legal Services & Support in Arvada, CO?
Percentage of Population Employed in Legal Services & Support in Arvada is 1.1%.
What is the Percentage of Population Employed in Legal Services & Support in Colorado?
Percentage of Population Employed in Legal Services & Support in Colorado is 1.2%.
What is the Percentage of Population Employed in Legal Services & Support in the United States?
Percentage of Population Employed in Legal Services & Support in the United States is 1.2%.