Zip Codes with the Highest Percentage of Population Employed in Legal Services & Support in Parker, CO
RELATED REPORTS & OPTIONS
Legal Services & Support
Parker
Compare Zip Codes
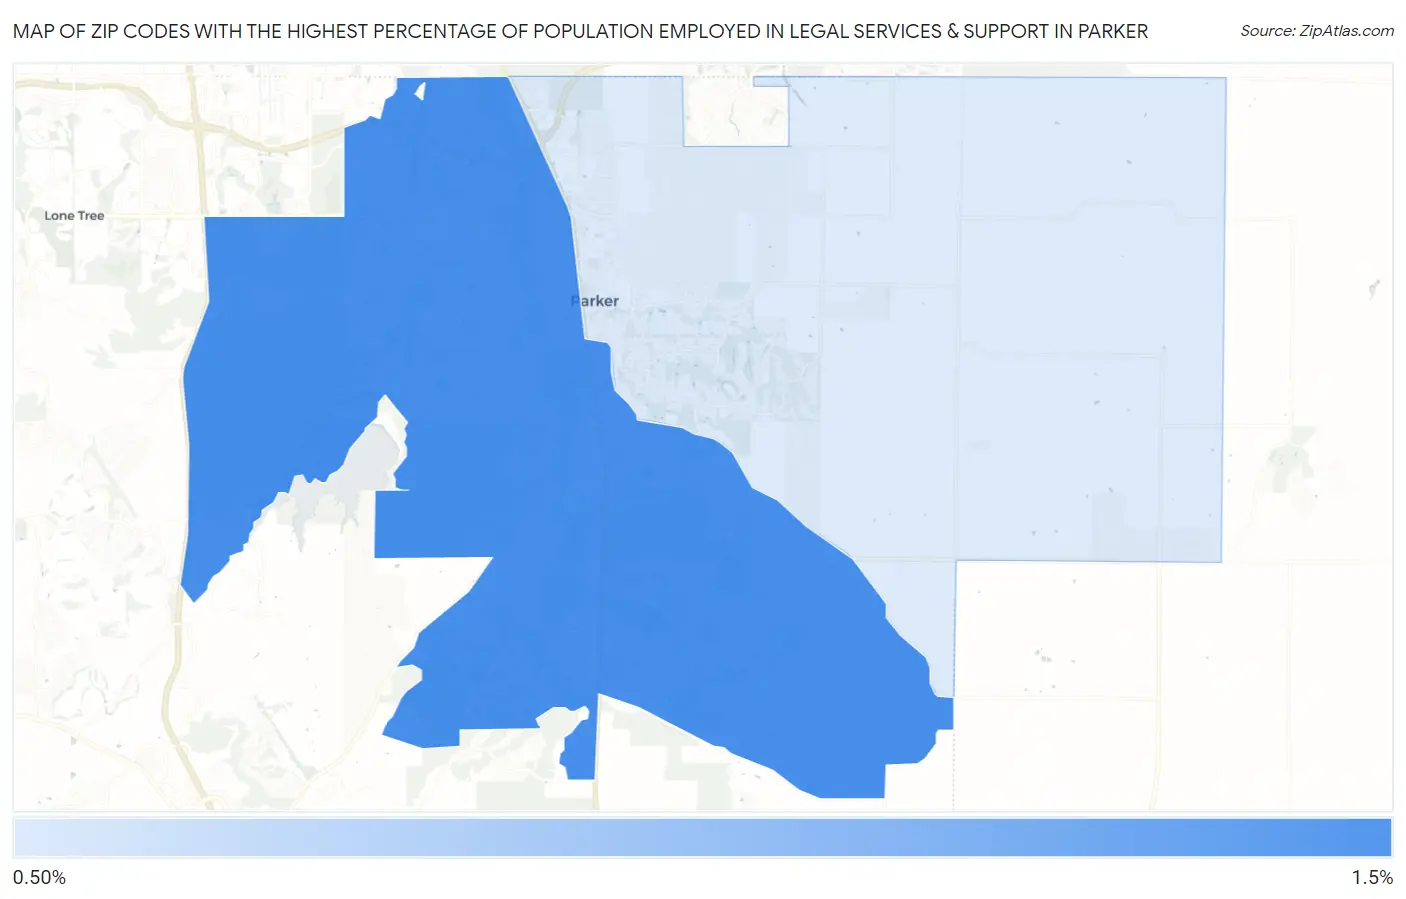
Map of Zip Codes with the Highest Percentage of Population Employed in Legal Services & Support in Parker
0.81%
1.3%
Zip Codes with the Highest Percentage of Population Employed in Legal Services & Support in Parker, CO
| Zip Code | % Employed | vs State | vs National | |
| 1. | 80134 | 1.3% | 1.2%(+0.123)#122 | 1.2%(+0.123)#5,902 |
| 2. | 80138 | 0.81% | 1.2%(-0.370)#186 | 1.2%(-0.369)#9,315 |
1
Common Questions
What are the Top Zip Codes with the Highest Percentage of Population Employed in Legal Services & Support in Parker, CO?
Top Zip Codes with the Highest Percentage of Population Employed in Legal Services & Support in Parker, CO are:
What zip code has the Highest Percentage of Population Employed in Legal Services & Support in Parker, CO?
80134 has the Highest Percentage of Population Employed in Legal Services & Support in Parker, CO with 1.3%.
What is the Percentage of Population Employed in Legal Services & Support in Parker, CO?
Percentage of Population Employed in Legal Services & Support in Parker is 1.2%.
What is the Percentage of Population Employed in Legal Services & Support in Colorado?
Percentage of Population Employed in Legal Services & Support in Colorado is 1.2%.
What is the Percentage of Population Employed in Legal Services & Support in the United States?
Percentage of Population Employed in Legal Services & Support in the United States is 1.2%.