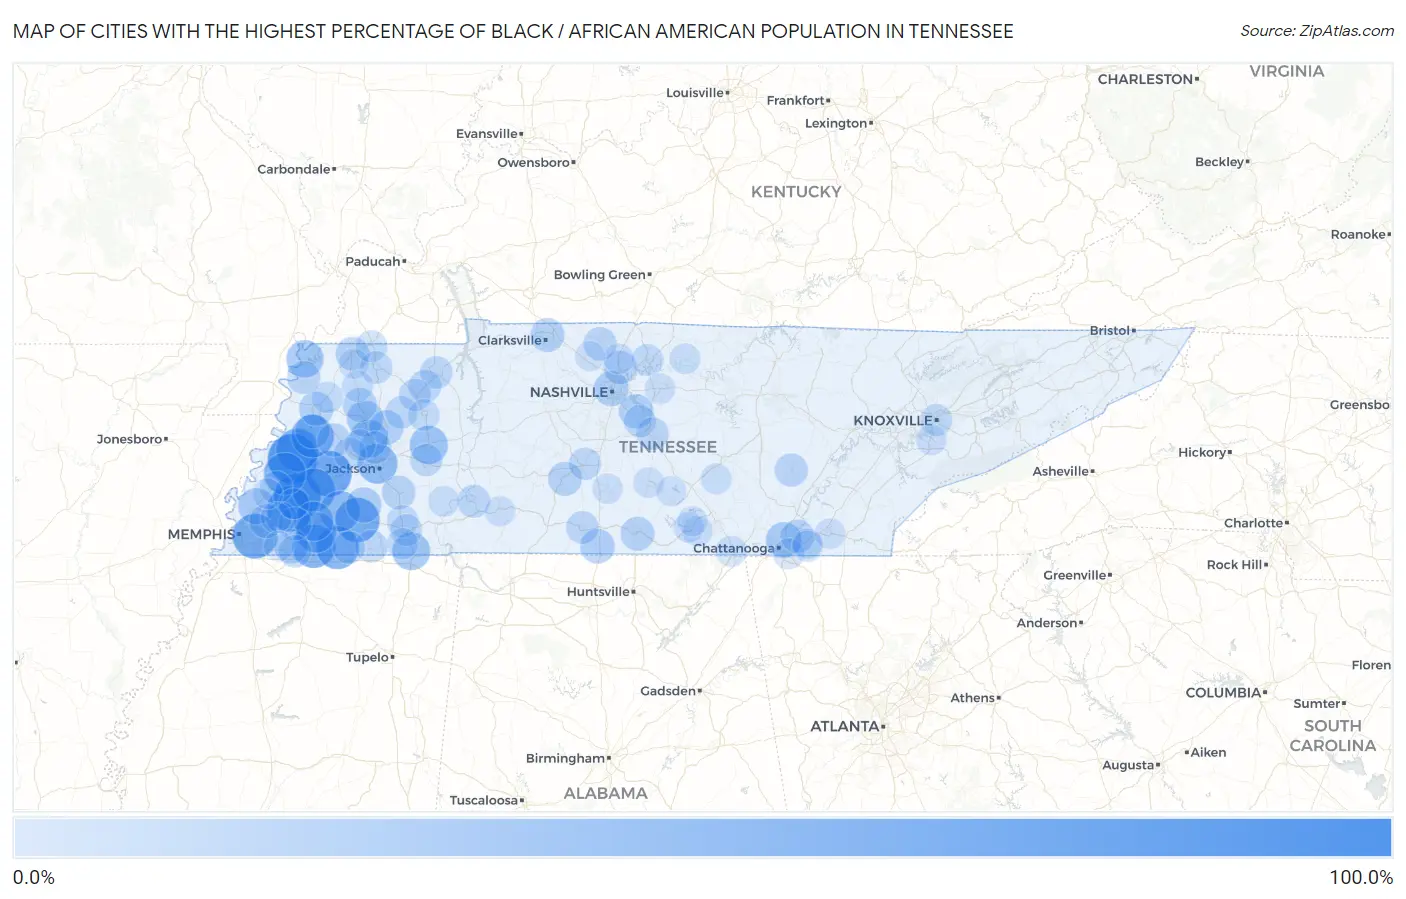
Cities with the Highest Percentage of Black / African American Population in Tennessee
RELATED REPORTS & OPTIONS
Black / African American
Tennessee
Compare Cities
Map of Cities with the Highest Percentage of Black / African American Population in Tennessee
0.0%
100.0%
Cities with the Highest Percentage of Black / African American Population in Tennessee
| City | Black / African American | vs State | vs National | |
| 1. | Pocahontas | 91.0% | 16.3%(+74.7)#1 | 12.5%(+78.5)#168 |
| 2. | Henning | 82.3% | 16.3%(+66.1)#2 | 12.5%(+69.9)#337 |
| 3. | Mason | 70.5% | 16.3%(+54.2)#3 | 12.5%(+58.0)#607 |
| 4. | Brownsville | 68.3% | 16.3%(+52.1)#4 | 12.5%(+55.9)#663 |
| 5. | Gallaway | 66.9% | 16.3%(+50.6)#5 | 12.5%(+54.4)#691 |
| 6. | Memphis | 64.4% | 16.3%(+48.1)#6 | 12.5%(+51.9)#758 |
| 7. | Bolivar | 62.2% | 16.3%(+45.9)#7 | 12.5%(+49.7)#831 |
| 8. | Moscow | 58.3% | 16.3%(+42.0)#8 | 12.5%(+45.8)#954 |
| 9. | Stanton | 58.2% | 16.3%(+41.9)#9 | 12.5%(+45.7)#959 |
| 10. | Grand Junction | 57.4% | 16.3%(+41.2)#10 | 12.5%(+45.0)#986 |
| 11. | Ripley | 56.9% | 16.3%(+40.7)#11 | 12.5%(+44.5)#1,005 |
| 12. | Gates | 55.8% | 16.3%(+39.6)#12 | 12.5%(+43.4)#1,040 |
| 13. | Covington | 54.2% | 16.3%(+38.0)#13 | 12.5%(+41.8)#1,096 |
| 14. | Whiteville | 47.9% | 16.3%(+31.6)#14 | 12.5%(+35.4)#1,324 |
| 15. | Williston | 47.4% | 16.3%(+31.1)#15 | 12.5%(+34.9)#1,358 |
| 16. | Jackson | 45.5% | 16.3%(+29.3)#16 | 12.5%(+33.1)#1,448 |
| 17. | Somerville | 44.4% | 16.3%(+28.2)#17 | 12.5%(+32.0)#1,500 |
| 18. | Parker S Crossroads | 39.3% | 16.3%(+23.0)#18 | 12.5%(+26.8)#1,780 |
| 19. | Humboldt | 38.4% | 16.3%(+22.1)#19 | 12.5%(+25.9)#1,833 |
| 20. | Guys | 37.7% | 16.3%(+21.4)#20 | 12.5%(+25.2)#1,870 |
| 21. | Tiptonville | 35.2% | 16.3%(+18.9)#21 | 12.5%(+22.7)#2,021 |
| 22. | Trenton | 31.5% | 16.3%(+15.2)#22 | 12.5%(+19.0)#2,246 |
| 23. | Millington | 30.7% | 16.3%(+14.4)#23 | 12.5%(+18.2)#2,317 |
| 24. | Chattanooga | 29.5% | 16.3%(+13.2)#24 | 12.5%(+17.0)#2,398 |
| 25. | Toone | 28.4% | 16.3%(+12.1)#25 | 12.5%(+15.9)#2,475 |
| 26. | Nashville | 26.8% | 16.3%(+10.5)#26 | 12.5%(+14.3)#2,586 |
| 27. | Milan | 25.5% | 16.3%(+9.22)#27 | 12.5%(+13.0)#2,712 |
| 28. | Elkton | 25.4% | 16.3%(+9.13)#28 | 12.5%(+12.9)#2,726 |
| 29. | La Vergne | 25.2% | 16.3%(+8.94)#29 | 12.5%(+12.7)#2,746 |
| 30. | Halls | 24.8% | 16.3%(+8.48)#30 | 12.5%(+12.3)#2,788 |
| 31. | Dyersburg | 24.4% | 16.3%(+8.08)#31 | 12.5%(+11.9)#2,822 |
| 32. | Piperton | 24.2% | 16.3%(+7.90)#32 | 12.5%(+11.7)#2,842 |
| 33. | Dyer | 23.7% | 16.3%(+7.38)#33 | 12.5%(+11.2)#2,885 |
| 34. | Clarksville | 23.5% | 16.3%(+7.21)#34 | 12.5%(+11.0)#2,912 |
| 35. | Mount Pleasant | 23.2% | 16.3%(+6.94)#35 | 12.5%(+10.7)#2,940 |
| 36. | Fayetteville | 23.0% | 16.3%(+6.68)#36 | 12.5%(+10.5)#2,969 |
| 37. | Bartlett | 22.9% | 16.3%(+6.60)#37 | 12.5%(+10.4)#2,978 |
| 38. | Beech Bluff | 22.5% | 16.3%(+6.19)#38 | 12.5%(+9.99)#3,025 |
| 39. | Union City | 22.4% | 16.3%(+6.17)#39 | 12.5%(+9.97)#3,027 |
| 40. | Goodlettsville | 22.1% | 16.3%(+5.79)#40 | 12.5%(+9.59)#3,068 |
| 41. | Henderson | 21.9% | 16.3%(+5.67)#41 | 12.5%(+9.47)#3,078 |
| 42. | Harrison | 21.4% | 16.3%(+5.17)#42 | 12.5%(+8.98)#3,133 |
| 43. | Maury City | 21.1% | 16.3%(+4.82)#43 | 12.5%(+8.62)#3,174 |
| 44. | Springfield | 20.9% | 16.3%(+4.66)#44 | 12.5%(+8.47)#3,191 |
| 45. | Oakland | 20.6% | 16.3%(+4.31)#45 | 12.5%(+8.11)#3,236 |
| 46. | Pikeville | 20.3% | 16.3%(+4.07)#46 | 12.5%(+7.88)#3,259 |
| 47. | Ridgely | 20.2% | 16.3%(+3.91)#47 | 12.5%(+7.72)#3,284 |
| 48. | Clifton | 19.6% | 16.3%(+3.29)#48 | 12.5%(+7.10)#3,354 |
| 49. | Henry | 19.3% | 16.3%(+3.03)#49 | 12.5%(+6.83)#3,391 |
| 50. | Brighton | 18.8% | 16.3%(+2.49)#50 | 12.5%(+6.29)#3,459 |
| 51. | Pulaski | 18.6% | 16.3%(+2.31)#51 | 12.5%(+6.12)#3,489 |
| 52. | Middleton | 18.4% | 16.3%(+2.12)#52 | 12.5%(+5.92)#3,517 |
| 53. | Paris | 18.3% | 16.3%(+2.05)#53 | 12.5%(+5.85)#3,532 |
| 54. | Three Way | 18.0% | 16.3%(+1.73)#54 | 12.5%(+5.54)#3,580 |
| 55. | Rossville | 18.0% | 16.3%(+1.70)#55 | 12.5%(+5.50)#3,585 |
| 56. | Murfreesboro | 17.8% | 16.3%(+1.54)#56 | 12.5%(+5.34)#3,605 |
| 57. | Bells | 17.7% | 16.3%(+1.45)#57 | 12.5%(+5.25)#3,614 |
| 58. | Trezevant | 17.6% | 16.3%(+1.33)#58 | 12.5%(+5.13)#3,631 |
| 59. | Saulsbury | 17.2% | 16.3%(+0.880)#59 | 12.5%(+4.68)#3,702 |
| 60. | Martin | 17.1% | 16.3%(+0.856)#60 | 12.5%(+4.66)#3,709 |
| 61. | Columbia | 17.1% | 16.3%(+0.851)#61 | 12.5%(+4.66)#3,713 |
| 62. | Smyrna | 17.1% | 16.3%(+0.829)#62 | 12.5%(+4.63)#3,716 |
| 63. | Mckenzie | 17.0% | 16.3%(+0.737)#63 | 12.5%(+4.54)#3,739 |
| 64. | Lexington | 16.9% | 16.3%(+0.655)#64 | 12.5%(+4.46)#3,751 |
| 65. | Bethel Springs | 16.2% | 16.3%(-0.070)#65 | 12.5%(+3.73)#3,873 |
| 66. | Knoxville | 16.1% | 16.3%(-0.168)#66 | 12.5%(+3.64)#3,890 |
| 67. | Selmer | 15.6% | 16.3%(-0.636)#67 | 12.5%(+3.17)#3,969 |
| 68. | Gallatin | 15.6% | 16.3%(-0.661)#68 | 12.5%(+3.14)#3,978 |
| 69. | Huntingdon | 15.3% | 16.3%(-1.01)#69 | 12.5%(+2.79)#4,045 |
| 70. | South Fulton | 15.1% | 16.3%(-1.18)#70 | 12.5%(+2.63)#4,079 |
| 71. | Newbern | 14.0% | 16.3%(-2.24)#71 | 12.5%(+1.56)#4,294 |
| 72. | Gadsden | 13.9% | 16.3%(-2.35)#72 | 12.5%(+1.46)#4,312 |
| 73. | Kenton | 13.7% | 16.3%(-2.54)#73 | 12.5%(+1.26)#4,347 |
| 74. | Ramer | 13.2% | 16.3%(-3.06)#74 | 12.5%(+0.742)#4,469 |
| 75. | Arlington | 13.0% | 16.3%(-3.31)#75 | 12.5%(+0.499)#4,520 |
| 76. | South Pittsburg | 12.8% | 16.3%(-3.43)#76 | 12.5%(+0.372)#4,548 |
| 77. | East Ridge | 12.5% | 16.3%(-3.74)#77 | 12.5%(+0.066)#4,619 |
| 78. | John Sevier | 12.5% | 16.3%(-3.79)#78 | 12.5%(+0.015)#4,633 |
| 79. | Saltillo | 12.5% | 16.3%(-3.81)#79 | 12.5%(-0.004)#4,639 |
| 80. | Viola | 12.4% | 16.3%(-3.89)#80 | 12.5%(-0.089)#4,659 |
| 81. | Lakeland | 12.0% | 16.3%(-4.25)#81 | 12.5%(-0.444)#4,754 |
| 82. | Hartsville Trousdale County | 11.8% | 16.3%(-4.48)#82 | 12.5%(-0.673)#4,802 |
| 83. | Collegedale | 11.7% | 16.3%(-4.53)#83 | 12.5%(-0.726)#4,818 |
| 84. | Braden | 11.6% | 16.3%(-4.67)#84 | 12.5%(-0.866)#4,852 |
| 85. | East Cleveland | 11.4% | 16.3%(-4.86)#85 | 12.5%(-1.05)#4,898 |
| 86. | Shelbyville | 11.4% | 16.3%(-4.91)#86 | 12.5%(-1.11)#4,912 |
| 87. | Atoka | 11.3% | 16.3%(-4.98)#87 | 12.5%(-1.18)#4,927 |
| 88. | Millersville | 10.8% | 16.3%(-5.46)#88 | 12.5%(-1.66)#5,075 |
| 89. | Lebanon | 10.8% | 16.3%(-5.51)#89 | 12.5%(-1.70)#5,089 |
| 90. | Lewisburg | 10.6% | 16.3%(-5.67)#90 | 12.5%(-1.86)#5,126 |
| 91. | Alcoa | 10.6% | 16.3%(-5.72)#91 | 12.5%(-1.92)#5,136 |
| 92. | Waynesboro | 10.6% | 16.3%(-5.72)#92 | 12.5%(-1.92)#5,138 |
| 93. | Ooltewah | 10.4% | 16.3%(-5.88)#93 | 12.5%(-2.08)#5,188 |
| 94. | Cowan | 10.3% | 16.3%(-5.98)#94 | 12.5%(-2.18)#5,230 |
| 95. | Winchester | 10.3% | 16.3%(-6.02)#95 | 12.5%(-2.22)#5,239 |
| 96. | Normandy | 9.9% | 16.3%(-6.36)#96 | 12.5%(-2.55)#5,353 |
| 97. | Collierville | 9.8% | 16.3%(-6.45)#97 | 12.5%(-2.64)#5,379 |
| 98. | Rives | 9.8% | 16.3%(-6.47)#98 | 12.5%(-2.67)#5,383 |
| 99. | Coopertown | 9.6% | 16.3%(-6.66)#99 | 12.5%(-2.86)#5,442 |
| 100. | Decherd | 9.4% | 16.3%(-6.83)#100 | 12.5%(-3.02)#5,494 |
Common Questions
What are the Top 10 Cities with the Highest Percentage of Black / African American Population in Tennessee?
Top 10 Cities with the Highest Percentage of Black / African American Population in Tennessee are:
#1
82.3%
#2
70.5%
#3
68.3%
#4
66.9%
#5
64.4%
#6
62.2%
#7
58.3%
#8
58.2%
#9
57.4%
#10
56.9%
What city has the Highest Percentage of Black / African American Population in Tennessee?
Henning has the Highest Percentage of Black / African American Population in Tennessee with 82.3%.
What is the Percentage of Black / African American Population in the State of Tennessee?
Percentage of Black / African American Population in Tennessee is 16.3%.
What is the Percentage of Black / African American Population in the United States?
Percentage of Black / African American Population in the United States is 12.5%.