Stanton, TN Map & Demographics
Stanton Map
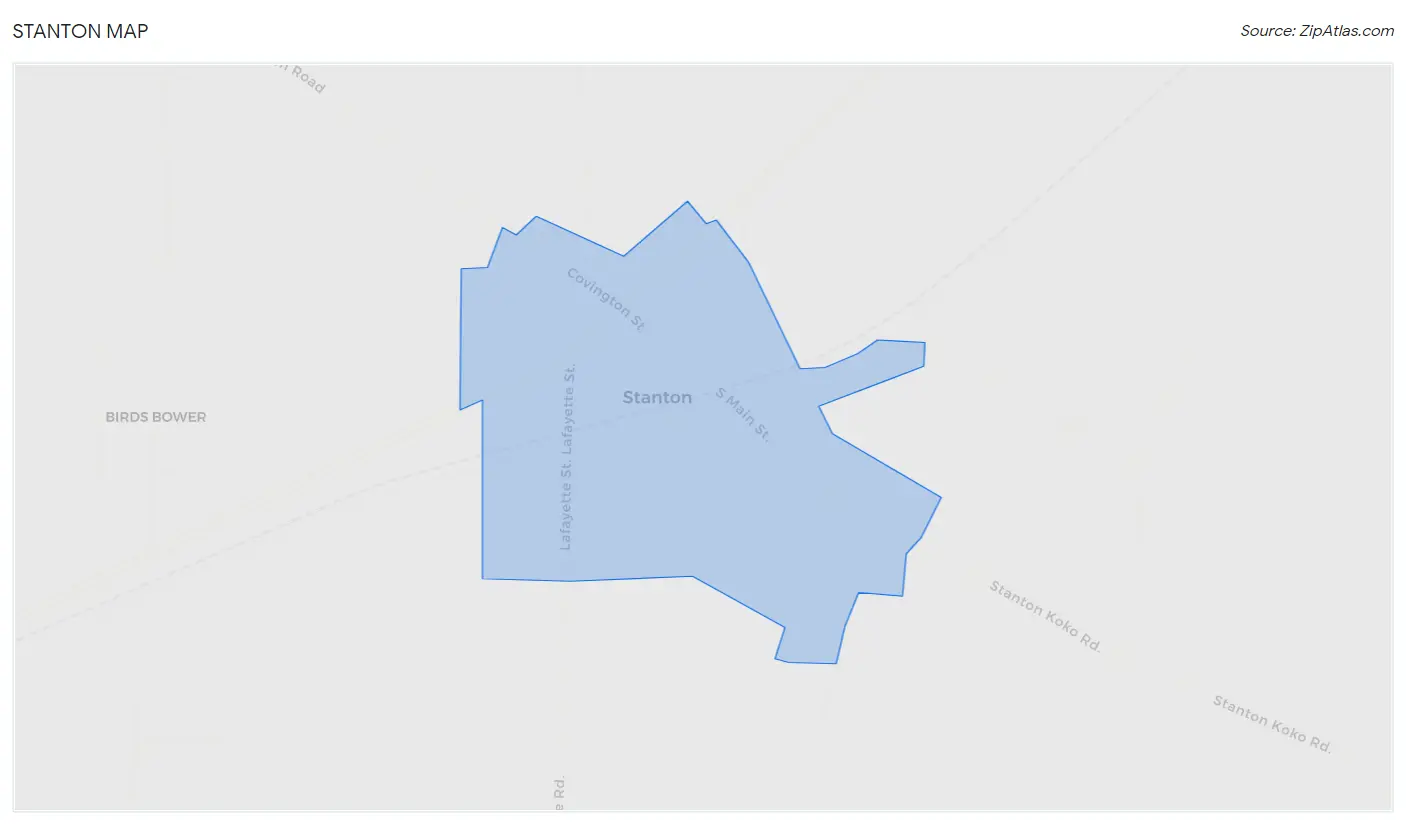
Stanton Overview
$48,509
PER CAPITA INCOME
$92,656
AVG FAMILY INCOME
$55,817
AVG HOUSEHOLD INCOME
0.65
INEQUALITY / GINI INDEX
586
TOTAL POPULATION
247
MALE POPULATION
339
FEMALE POPULATION
72.86
MALES / 100 FEMALES
137.25
FEMALES / 100 MALES
45.4
MEDIAN AGE
3.0
AVG FAMILY SIZE
2.0
AVG HOUSEHOLD SIZE
341
LABOR FORCE [ PEOPLE ]
67.3%
PERCENT IN LABOR FORCE
6.5%
UNEMPLOYMENT RATE
Stanton Zip Codes
Stanton Area Codes
Income in Stanton
Income Overview in Stanton
Per Capita Income in Stanton is $48,509, while median incomes of families and households are $92,656 and $55,817 respectively.
| Characteristic | Number | Measure |
| Per Capita Income | 586 | $48,509 |
| Median Family Income | 111 | $92,656 |
| Mean Family Income | 111 | $203,047 |
| Median Household Income | 289 | $55,817 |
| Mean Household Income | 289 | $103,710 |
| Income Deficit | 111 | $0 |
| Wage / Income Gap (%) | 586 | 0.00% |
| Wage / Income Gap ($) | 586 | 100.00¢ per $1 |
| Gini / Inequality Index | 586 | 0.65 |
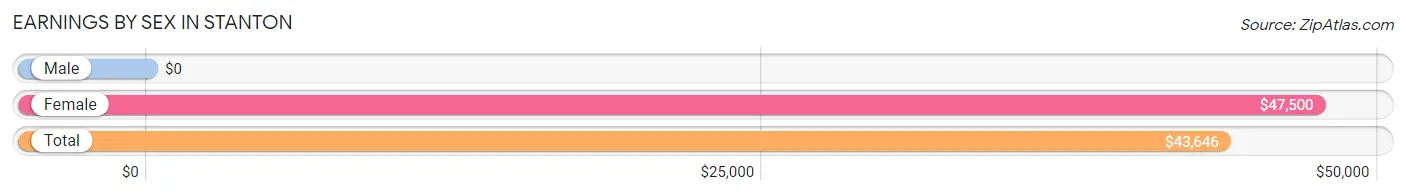
Earnings by Sex in Stanton
| Sex | Number | Average Earnings |
| Male | 119 (34.7%) | $0 |
| Female | 224 (65.3%) | $47,500 |
| Total | 343 (100.0%) | $43,646 |
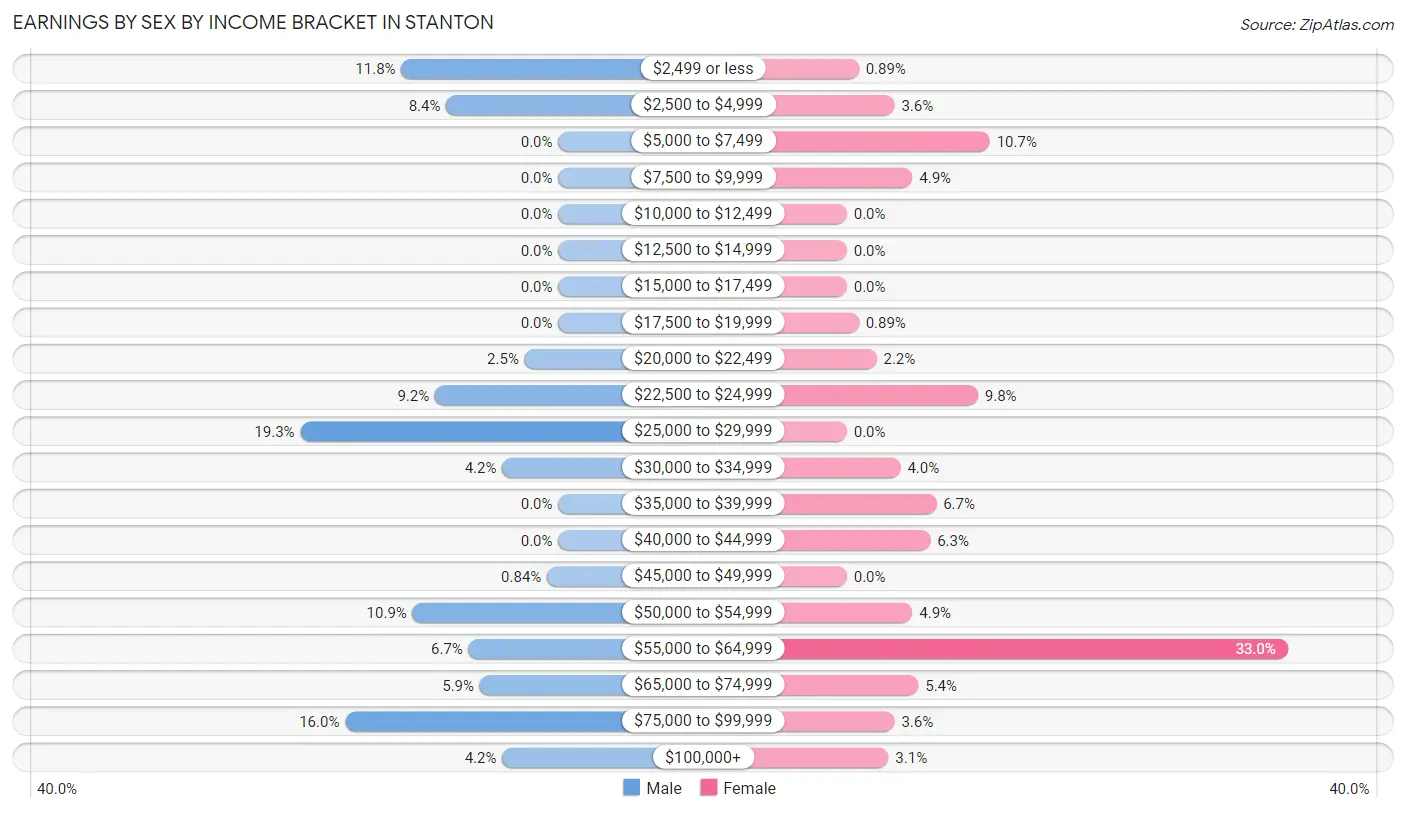
Earnings by Sex by Income Bracket in Stanton
The most common earnings brackets in Stanton are $25,000 to $29,999 for men (23 | 19.3%) and $55,000 to $64,999 for women (74 | 33.0%).
| Income | Male | Female |
| $2,499 or less | 14 (11.8%) | 2 (0.9%) |
| $2,500 to $4,999 | 10 (8.4%) | 8 (3.6%) |
| $5,000 to $7,499 | 0 (0.0%) | 24 (10.7%) |
| $7,500 to $9,999 | 0 (0.0%) | 11 (4.9%) |
| $10,000 to $12,499 | 0 (0.0%) | 0 (0.0%) |
| $12,500 to $14,999 | 0 (0.0%) | 0 (0.0%) |
| $15,000 to $17,499 | 0 (0.0%) | 0 (0.0%) |
| $17,500 to $19,999 | 0 (0.0%) | 2 (0.9%) |
| $20,000 to $22,499 | 3 (2.5%) | 5 (2.2%) |
| $22,500 to $24,999 | 11 (9.2%) | 22 (9.8%) |
| $25,000 to $29,999 | 23 (19.3%) | 0 (0.0%) |
| $30,000 to $34,999 | 5 (4.2%) | 9 (4.0%) |
| $35,000 to $39,999 | 0 (0.0%) | 15 (6.7%) |
| $40,000 to $44,999 | 0 (0.0%) | 14 (6.2%) |
| $45,000 to $49,999 | 1 (0.8%) | 0 (0.0%) |
| $50,000 to $54,999 | 13 (10.9%) | 11 (4.9%) |
| $55,000 to $64,999 | 8 (6.7%) | 74 (33.0%) |
| $65,000 to $74,999 | 7 (5.9%) | 12 (5.4%) |
| $75,000 to $99,999 | 19 (16.0%) | 8 (3.6%) |
| $100,000+ | 5 (4.2%) | 7 (3.1%) |
| Total | 119 (100.0%) | 224 (100.0%) |
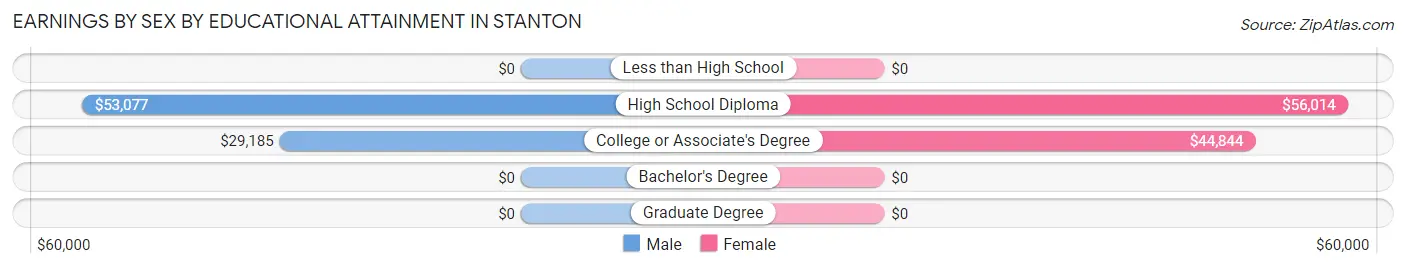
Earnings by Sex by Educational Attainment in Stanton
Average earnings in Stanton are $40,000 for men and $55,693 for women, a difference of 28.2%. Men with an educational attainment of high school diploma enjoy the highest average annual earnings of $53,077, while those with college or associate's degree education earn the least with $29,185. Women with an educational attainment of high school diploma earn the most with the average annual earnings of $56,014, while those with college or associate's degree education have the smallest earnings of $44,844.
| Educational Attainment | Male Income | Female Income |
| Less than High School | - | - |
| High School Diploma | $53,077 | $56,014 |
| College or Associate's Degree | $29,185 | $44,844 |
| Bachelor's Degree | - | - |
| Graduate Degree | - | - |
| Total | $40,000 | $55,693 |
Family Income in Stanton
Family Income Brackets in Stanton
According to the Stanton family income data, there are 40 families falling into the $75,000 to $99,999 income range, which is the most common income bracket and makes up 36.0% of all families.
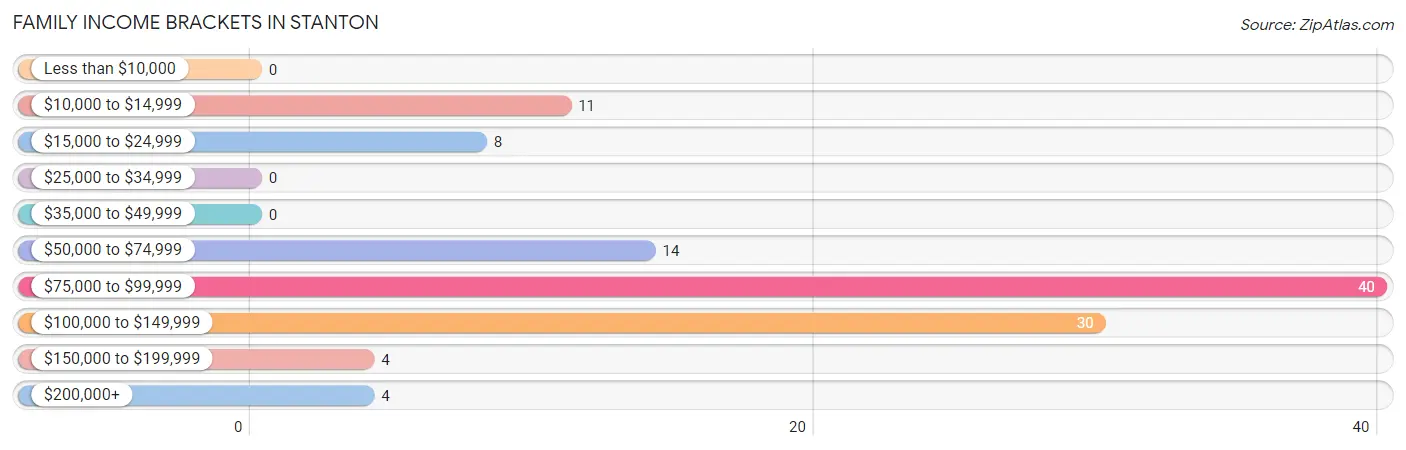
| Income Bracket | # Families | % Families |
| Less than $10,000 | 0 | 0.0% |
| $10,000 to $14,999 | 11 | 9.9% |
| $15,000 to $24,999 | 8 | 7.2% |
| $25,000 to $34,999 | 0 | 0.0% |
| $35,000 to $49,999 | 0 | 0.0% |
| $50,000 to $74,999 | 14 | 12.6% |
| $75,000 to $99,999 | 40 | 36.0% |
| $100,000 to $149,999 | 30 | 27.0% |
| $150,000 to $199,999 | 4 | 3.6% |
| $200,000+ | 4 | 3.6% |
Family Income by Famaliy Size in Stanton
2-person families (52 | 46.9%) account for the highest median family income in Stanton with $81,071 per family, while 2-person families (52 | 46.9%) have the highest median income of $40,536 per family member.
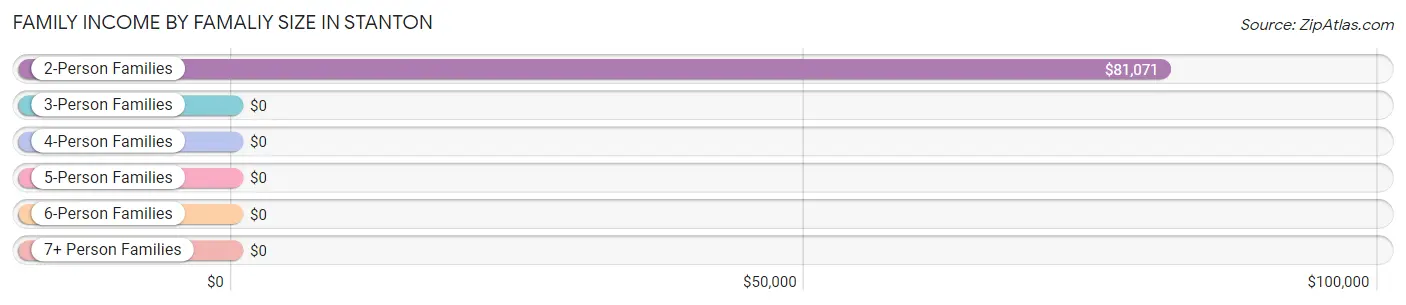
| Income Bracket | # Families | Median Income |
| 2-Person Families | 52 (46.9%) | $81,071 |
| 3-Person Families | 34 (30.6%) | $0 |
| 4-Person Families | 19 (17.1%) | $0 |
| 5-Person Families | 0 (0.0%) | $0 |
| 6-Person Families | 4 (3.6%) | $0 |
| 7+ Person Families | 2 (1.8%) | $0 |
| Total | 111 (100.0%) | $92,656 |
Family Income by Number of Earners in Stanton
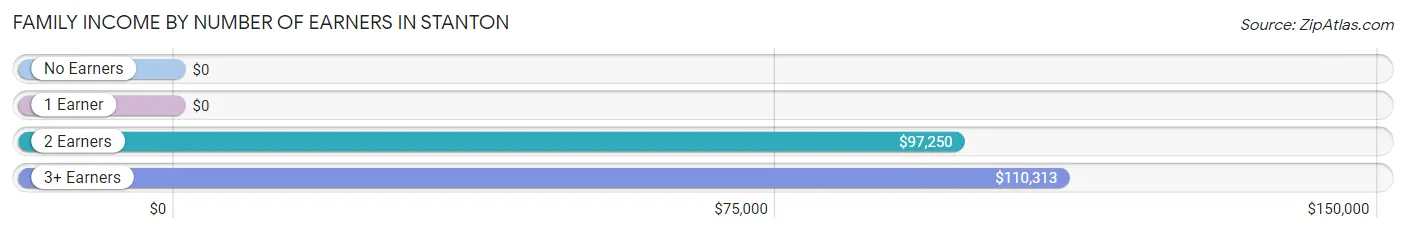
| Number of Earners | # Families | Median Income |
| No Earners | 15 (13.5%) | $0 |
| 1 Earner | 29 (26.1%) | $0 |
| 2 Earners | 60 (54.0%) | $97,250 |
| 3+ Earners | 7 (6.3%) | $110,313 |
| Total | 111 (100.0%) | $92,656 |
Household Income in Stanton
Household Income Brackets in Stanton
With 93 households falling in the category, the $50,000 to $74,999 income range is the most frequent in Stanton, accounting for 32.2% of all households. In contrast, only 4 households (1.4%) fall into the $200,000+ income bracket, making it the least populous group.
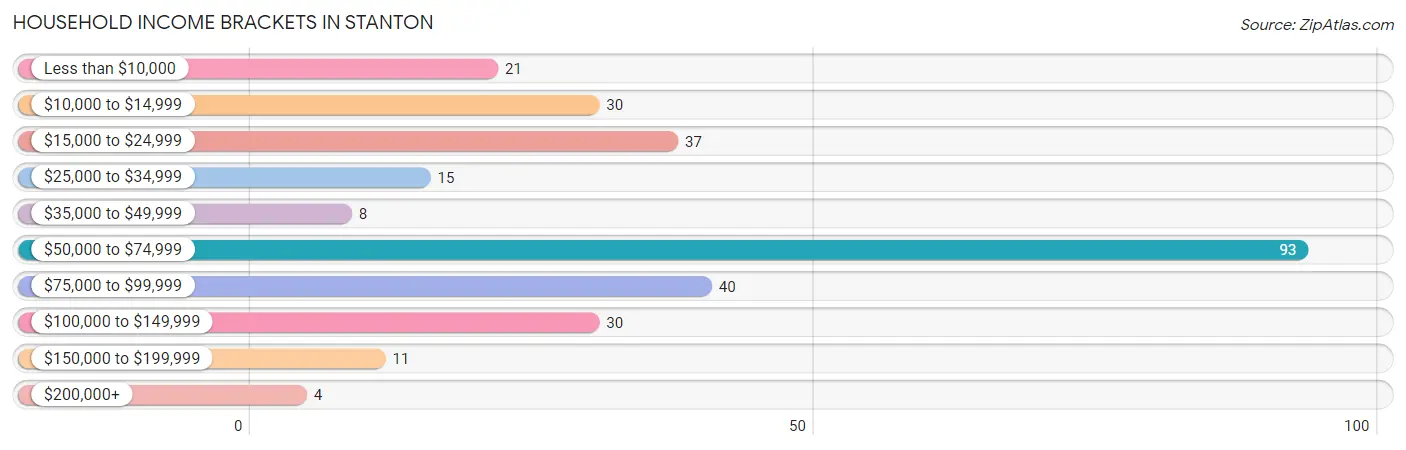
| Income Bracket | # Households | % Households |
| Less than $10,000 | 21 | 7.3% |
| $10,000 to $14,999 | 30 | 10.4% |
| $15,000 to $24,999 | 37 | 12.8% |
| $25,000 to $34,999 | 15 | 5.2% |
| $35,000 to $49,999 | 8 | 2.8% |
| $50,000 to $74,999 | 93 | 32.2% |
| $75,000 to $99,999 | 40 | 13.8% |
| $100,000 to $149,999 | 30 | 10.4% |
| $150,000 to $199,999 | 11 | 3.8% |
| $200,000+ | 4 | 1.4% |
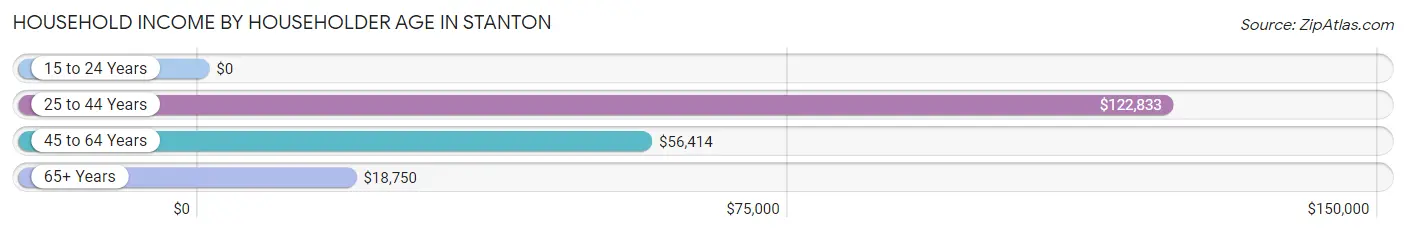
Household Income by Householder Age in Stanton
The median household income in Stanton is $55,817, with the highest median household income of $122,833 found in the 25 to 44 years age bracket for the primary householder. A total of 34 households (11.8%) fall into this category. Meanwhile, the 15 to 24 years age bracket for the primary householder has the lowest median household income of $0, with 20 households (6.9%) in this group.
| Income Bracket | # Households | Median Income |
| 15 to 24 Years | 20 (6.9%) | $0 |
| 25 to 44 Years | 34 (11.8%) | $122,833 |
| 45 to 64 Years | 184 (63.7%) | $56,414 |
| 65+ Years | 51 (17.6%) | $18,750 |
| Total | 289 (100.0%) | $55,817 |
Poverty in Stanton
Income Below Poverty by Sex and Age in Stanton
With 22.3% poverty level for males and 21.2% for females among the residents of Stanton, 75 year old and over males and 18 to 24 year old females are the most vulnerable to poverty, with 13 males (65.0%) and 28 females (38.9%) in their respective age groups living below the poverty level.
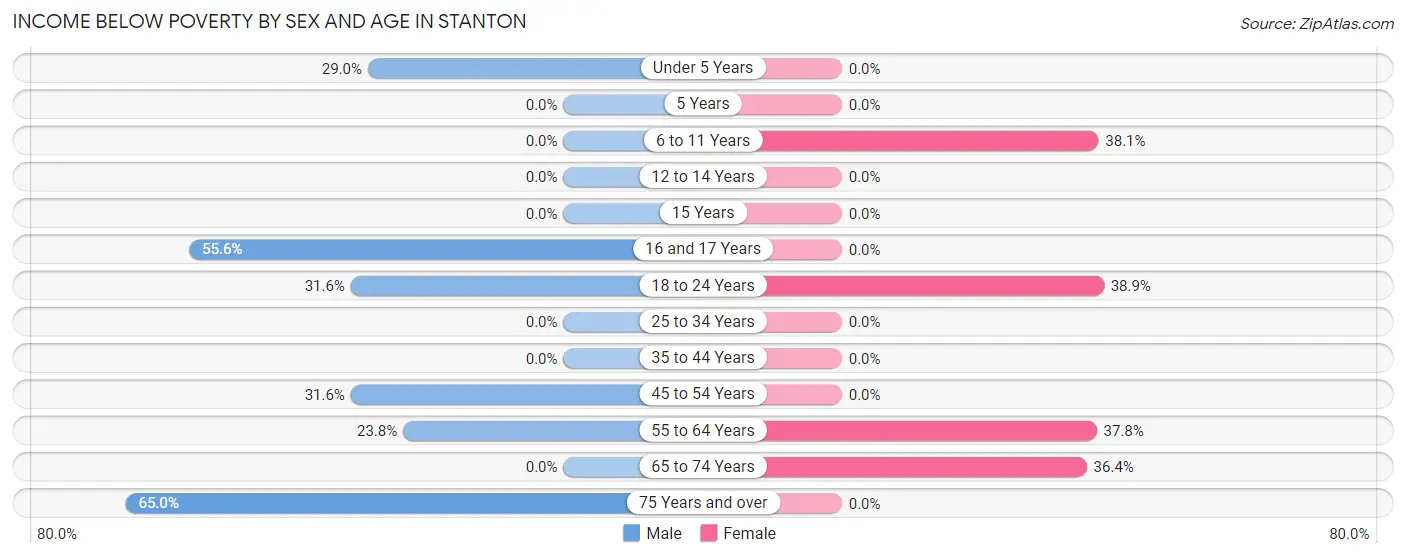
| Age Bracket | Male | Female |
| Under 5 Years | 9 (29.0%) | 0 (0.0%) |
| 5 Years | 0 (0.0%) | 0 (0.0%) |
| 6 to 11 Years | 0 (0.0%) | 8 (38.1%) |
| 12 to 14 Years | 0 (0.0%) | 0 (0.0%) |
| 15 Years | 0 (0.0%) | 0 (0.0%) |
| 16 and 17 Years | 5 (55.6%) | 0 (0.0%) |
| 18 to 24 Years | 6 (31.6%) | 28 (38.9%) |
| 25 to 34 Years | 0 (0.0%) | 0 (0.0%) |
| 35 to 44 Years | 0 (0.0%) | 0 (0.0%) |
| 45 to 54 Years | 12 (31.6%) | 0 (0.0%) |
| 55 to 64 Years | 10 (23.8%) | 28 (37.8%) |
| 65 to 74 Years | 0 (0.0%) | 8 (36.4%) |
| 75 Years and over | 13 (65.0%) | 0 (0.0%) |
| Total | 55 (22.3%) | 72 (21.2%) |
Income Above Poverty by Sex and Age in Stanton
According to the poverty statistics in Stanton, males aged 5 years and females aged 25 to 34 years are the age groups that are most secure financially, with 100.0% of males and 100.0% of females in these age groups living above the poverty line.
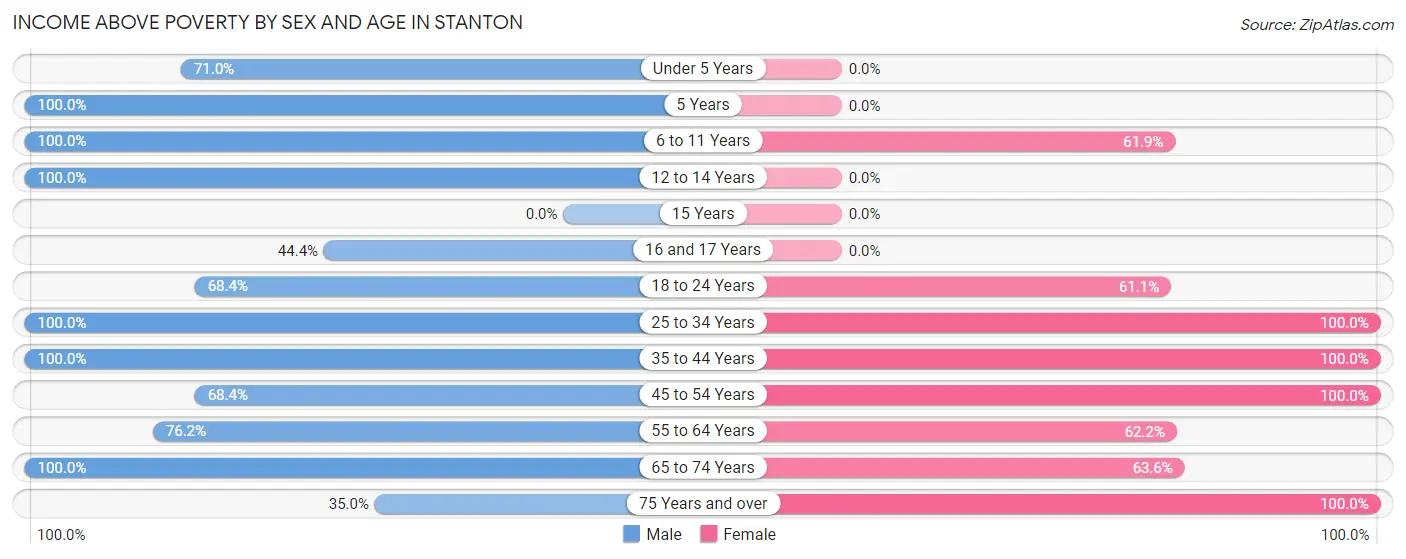
| Age Bracket | Male | Female |
| Under 5 Years | 22 (71.0%) | 0 (0.0%) |
| 5 Years | 2 (100.0%) | 0 (0.0%) |
| 6 to 11 Years | 14 (100.0%) | 13 (61.9%) |
| 12 to 14 Years | 11 (100.0%) | 0 (0.0%) |
| 15 Years | 0 (0.0%) | 0 (0.0%) |
| 16 and 17 Years | 4 (44.4%) | 0 (0.0%) |
| 18 to 24 Years | 13 (68.4%) | 44 (61.1%) |
| 25 to 34 Years | 41 (100.0%) | 7 (100.0%) |
| 35 to 44 Years | 7 (100.0%) | 30 (100.0%) |
| 45 to 54 Years | 26 (68.4%) | 105 (100.0%) |
| 55 to 64 Years | 32 (76.2%) | 46 (62.2%) |
| 65 to 74 Years | 13 (100.0%) | 14 (63.6%) |
| 75 Years and over | 7 (35.0%) | 8 (100.0%) |
| Total | 192 (77.7%) | 267 (78.8%) |
Income Below Poverty Among Married-Couple Families in Stanton
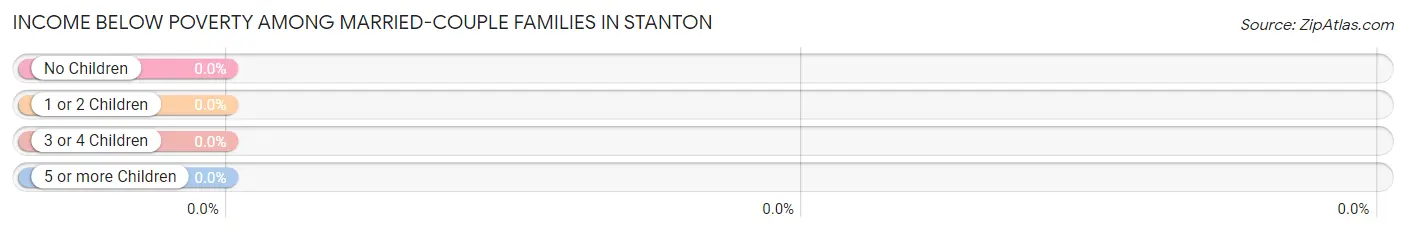
| Children | Above Poverty | Below Poverty |
| No Children | 31 (100.0%) | 0 (0.0%) |
| 1 or 2 Children | 25 (100.0%) | 0 (0.0%) |
| 3 or 4 Children | 0 (0.0%) | 0 (0.0%) |
| 5 or more Children | 0 (0.0%) | 0 (0.0%) |
| Total | 56 (100.0%) | 0 (0.0%) |
Income Below Poverty Among Single-Parent Households in Stanton
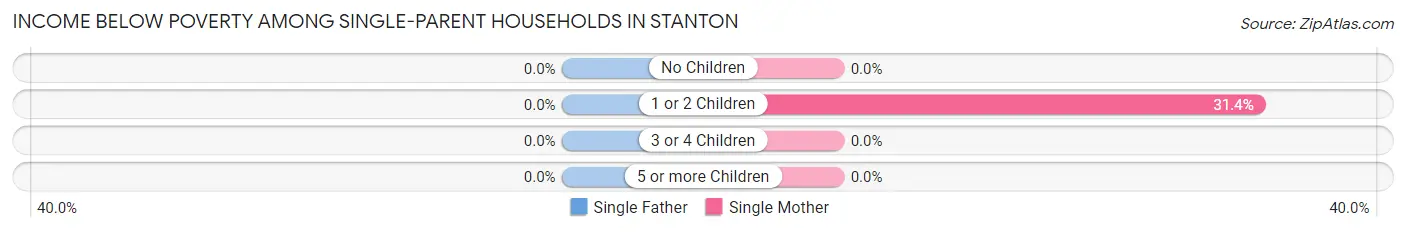
| Children | Single Father | Single Mother |
| No Children | 0 (0.0%) | 0 (0.0%) |
| 1 or 2 Children | 0 (0.0%) | 11 (31.4%) |
| 3 or 4 Children | 0 (0.0%) | 0 (0.0%) |
| 5 or more Children | 0 (0.0%) | 0 (0.0%) |
| Total | 0 (0.0%) | 11 (25.6%) |
Income Below Poverty Among Married-Couple vs Single-Parent Households in Stanton
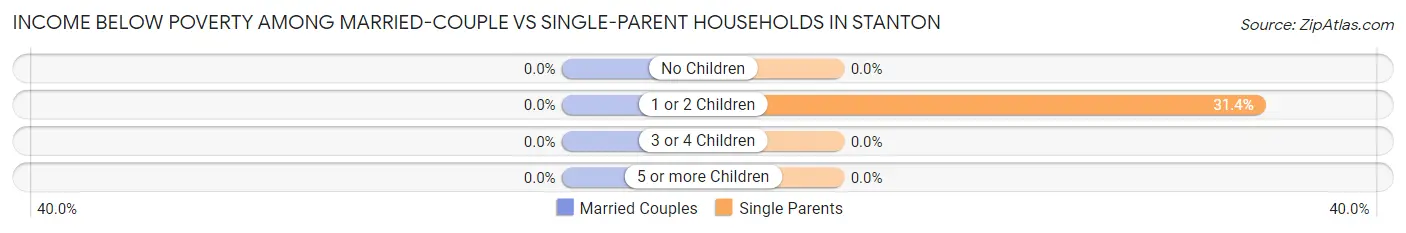
| Children | Married-Couple Families | Single-Parent Households |
| No Children | 0 (0.0%) | 0 (0.0%) |
| 1 or 2 Children | 0 (0.0%) | 11 (31.4%) |
| 3 or 4 Children | 0 (0.0%) | 0 (0.0%) |
| 5 or more Children | 0 (0.0%) | 0 (0.0%) |
| Total | 0 (0.0%) | 11 (20.0%) |
Race in Stanton
The most populous races in Stanton are Black / African American (341 | 58.2%), White / Caucasian (237 | 40.4%), and Two or more Races (8 | 1.4%).
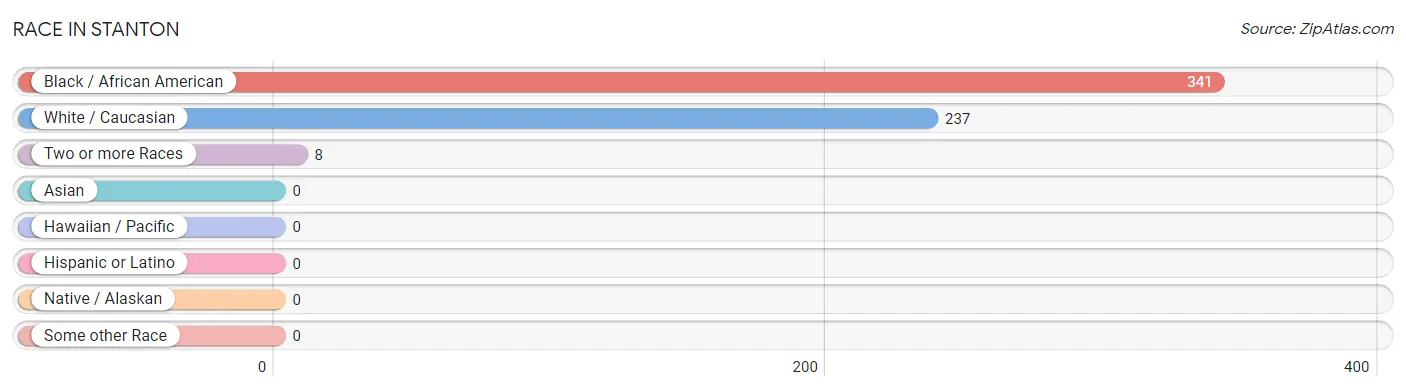
| Race | # Population | % Population |
| Asian | 0 | 0.0% |
| Black / African American | 341 | 58.2% |
| Hawaiian / Pacific | 0 | 0.0% |
| Hispanic or Latino | 0 | 0.0% |
| Native / Alaskan | 0 | 0.0% |
| White / Caucasian | 237 | 40.4% |
| Two or more Races | 8 | 1.4% |
| Some other Race | 0 | 0.0% |
| Total | 586 | 100.0% |
Ancestry in Stanton
The most populous ancestries reported in Stanton are American (63 | 10.7%), English (49 | 8.4%), German (48 | 8.2%), Irish (36 | 6.1%), and British (24 | 4.1%), together accounting for 37.5% of all Stanton residents.
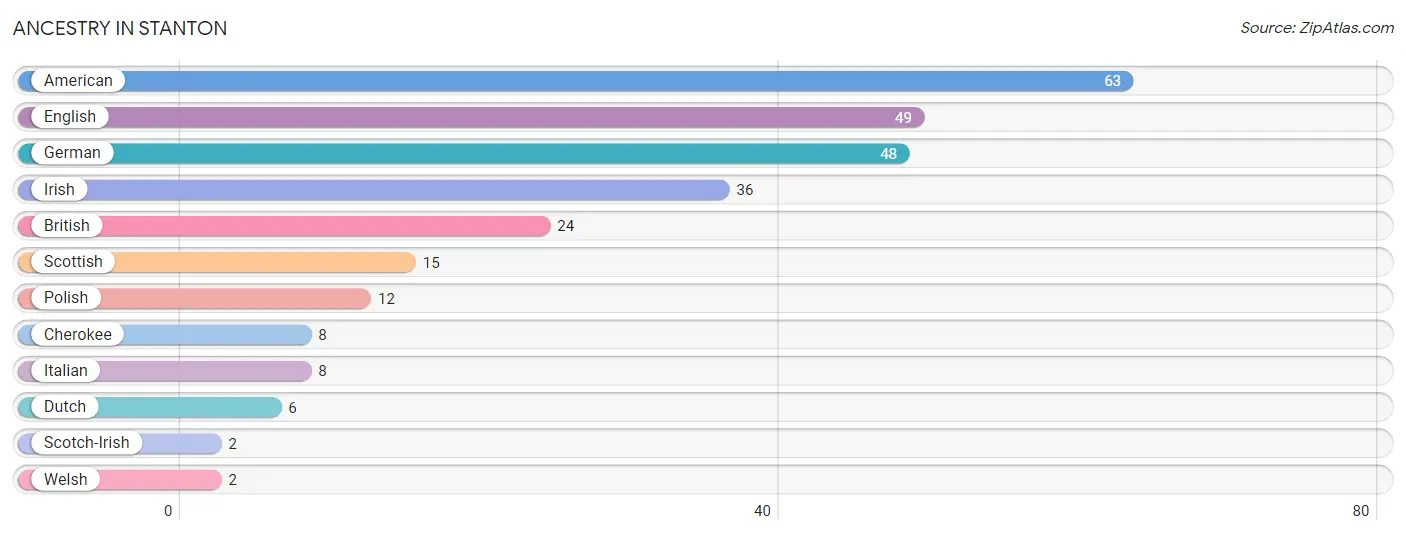
| Ancestry | # Population | % Population |
| American | 63 | 10.7% |
| British | 24 | 4.1% |
| Cherokee | 8 | 1.4% |
| Dutch | 6 | 1.0% |
| English | 49 | 8.4% |
| German | 48 | 8.2% |
| Irish | 36 | 6.1% |
| Italian | 8 | 1.4% |
| Polish | 12 | 2.1% |
| Scotch-Irish | 2 | 0.3% |
| Scottish | 15 | 2.6% |
| Welsh | 2 | 0.3% | View All 12 Rows |
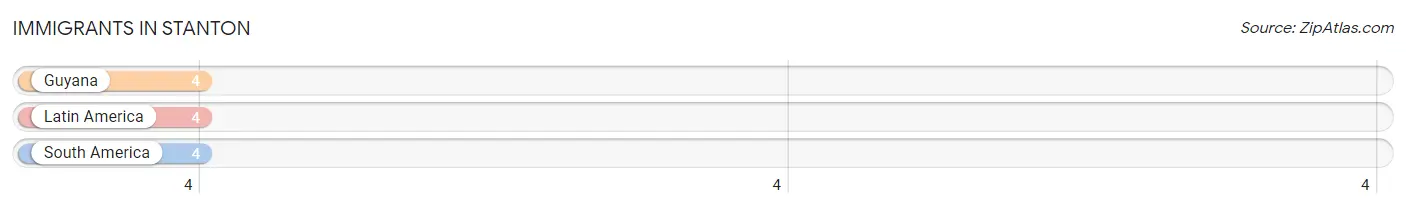
Immigrants in Stanton
The most numerous immigrant groups reported in Stanton came from Guyana (4 | 0.7%), Latin America (4 | 0.7%), and South America (4 | 0.7%), together accounting for 2.0% of all Stanton residents.
| Immigration Origin | # Population | % Population |
| Guyana | 4 | 0.7% |
| Latin America | 4 | 0.7% |
| South America | 4 | 0.7% | View All 3 Rows |
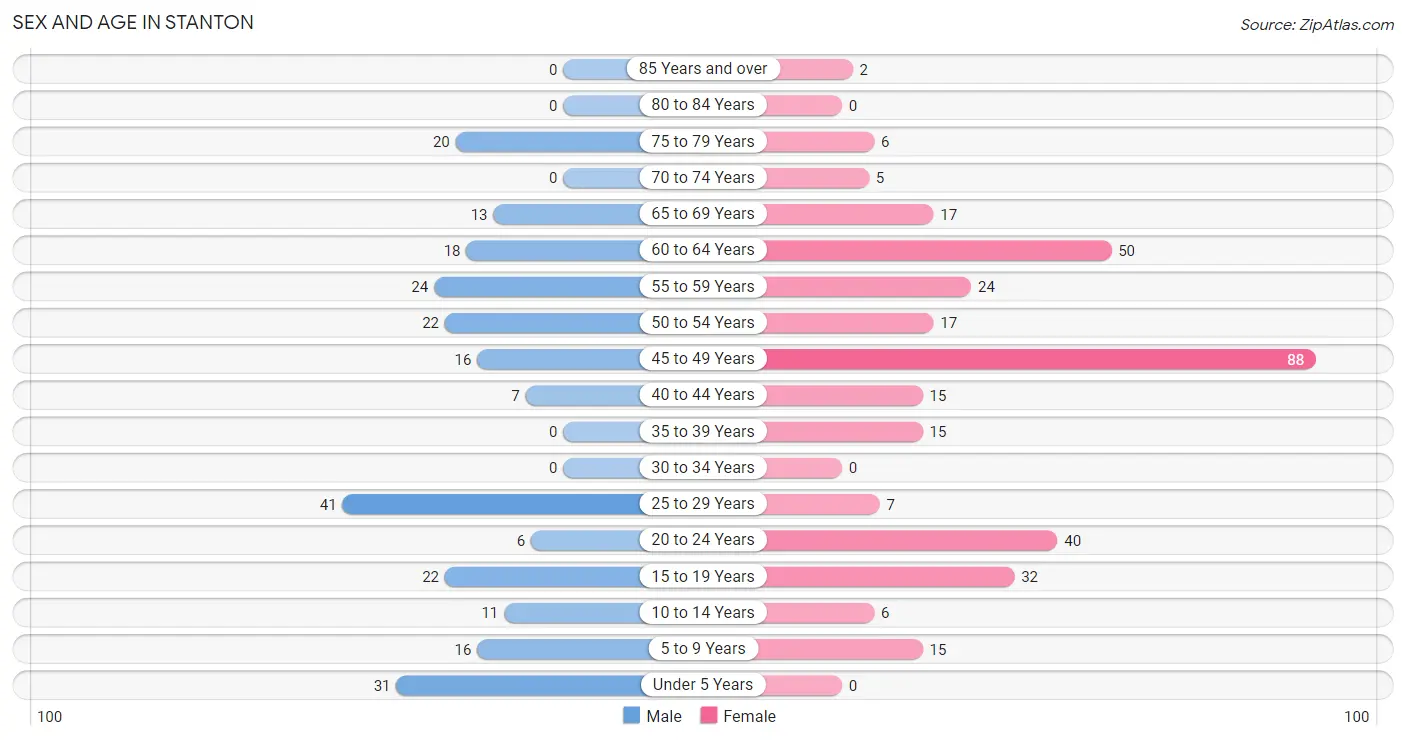
Sex and Age in Stanton
Sex and Age in Stanton
The most populous age groups in Stanton are 25 to 29 Years (41 | 16.6%) for men and 45 to 49 Years (88 | 26.0%) for women.
| Age Bracket | Male | Female |
| Under 5 Years | 31 (12.6%) | 0 (0.0%) |
| 5 to 9 Years | 16 (6.5%) | 15 (4.4%) |
| 10 to 14 Years | 11 (4.4%) | 6 (1.8%) |
| 15 to 19 Years | 22 (8.9%) | 32 (9.4%) |
| 20 to 24 Years | 6 (2.4%) | 40 (11.8%) |
| 25 to 29 Years | 41 (16.6%) | 7 (2.1%) |
| 30 to 34 Years | 0 (0.0%) | 0 (0.0%) |
| 35 to 39 Years | 0 (0.0%) | 15 (4.4%) |
| 40 to 44 Years | 7 (2.8%) | 15 (4.4%) |
| 45 to 49 Years | 16 (6.5%) | 88 (26.0%) |
| 50 to 54 Years | 22 (8.9%) | 17 (5.0%) |
| 55 to 59 Years | 24 (9.7%) | 24 (7.1%) |
| 60 to 64 Years | 18 (7.3%) | 50 (14.7%) |
| 65 to 69 Years | 13 (5.3%) | 17 (5.0%) |
| 70 to 74 Years | 0 (0.0%) | 5 (1.5%) |
| 75 to 79 Years | 20 (8.1%) | 6 (1.8%) |
| 80 to 84 Years | 0 (0.0%) | 0 (0.0%) |
| 85 Years and over | 0 (0.0%) | 2 (0.6%) |
| Total | 247 (100.0%) | 339 (100.0%) |
Families and Households in Stanton
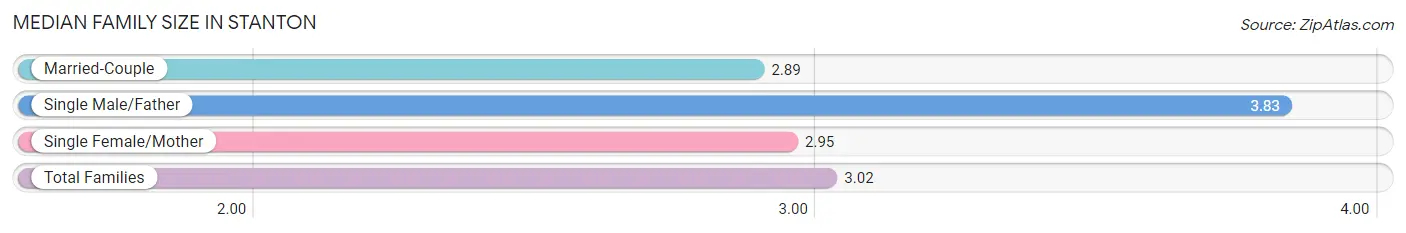
Median Family Size in Stanton
The median family size in Stanton is 3.02 persons per family, with single male/father families (12 | 10.8%) accounting for the largest median family size of 3.83 persons per family. On the other hand, married-couple families (56 | 50.4%) represent the smallest median family size with 2.89 persons per family.
| Family Type | # Families | Family Size |
| Married-Couple | 56 (50.4%) | 2.89 |
| Single Male/Father | 12 (10.8%) | 3.83 |
| Single Female/Mother | 43 (38.7%) | 2.95 |
| Total Families | 111 (100.0%) | 3.02 |
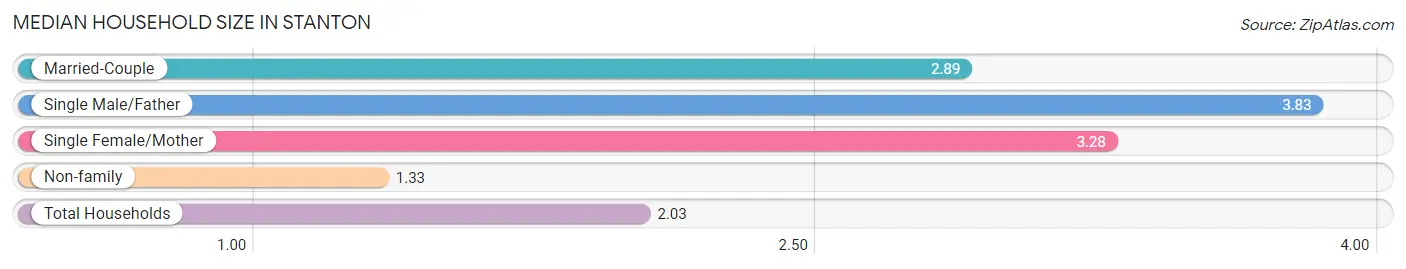
Median Household Size in Stanton
The median household size in Stanton is 2.03 persons per household, with single male/father households (12 | 4.2%) accounting for the largest median household size of 3.83 persons per household. non-family households (178 | 61.6%) represent the smallest median household size with 1.33 persons per household.
| Household Type | # Households | Household Size |
| Married-Couple | 56 (19.4%) | 2.89 |
| Single Male/Father | 12 (4.2%) | 3.83 |
| Single Female/Mother | 43 (14.9%) | 3.28 |
| Non-family | 178 (61.6%) | 1.33 |
| Total Households | 289 (100.0%) | 2.03 |
Household Size by Marriage Status in Stanton
Out of a total of 289 households in Stanton, 111 (38.4%) are family households, while 178 (61.6%) are nonfamily households. The most numerous type of family households are 2-person households, comprising 52, and the most common type of nonfamily households are 1-person households, comprising 152.
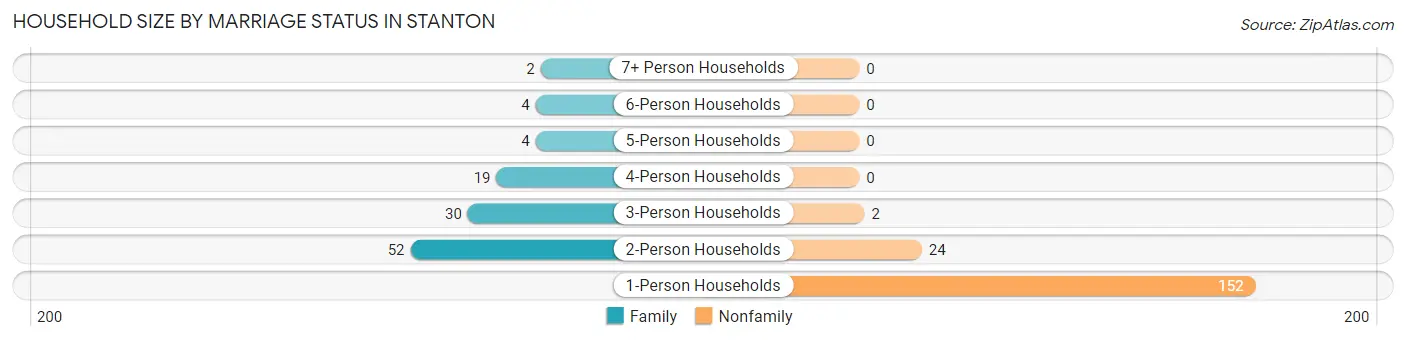
| Household Size | Family Households | Nonfamily Households |
| 1-Person Households | - | 152 (52.6%) |
| 2-Person Households | 52 (18.0%) | 24 (8.3%) |
| 3-Person Households | 30 (10.4%) | 2 (0.7%) |
| 4-Person Households | 19 (6.6%) | 0 (0.0%) |
| 5-Person Households | 4 (1.4%) | 0 (0.0%) |
| 6-Person Households | 4 (1.4%) | 0 (0.0%) |
| 7+ Person Households | 2 (0.7%) | 0 (0.0%) |
| Total | 111 (38.4%) | 178 (61.6%) |
Female Fertility in Stanton
Fertility by Age in Stanton
| Age Bracket | Women with Births | Births / 1,000 Women |
| 15 to 19 years | 0 (0.0%) | 0.0 |
| 20 to 34 years | 0 (0.0%) | 0.0 |
| 35 to 50 years | 0 (0.0%) | 0.0 |
| Total | 0 (0.0%) | 0.0 |
Fertility by Age by Marriage Status in Stanton
| Age Bracket | Married | Unmarried |
| 15 to 19 years | 0 (0.0%) | 0 (0.0%) |
| 20 to 34 years | 0 (0.0%) | 0 (0.0%) |
| 35 to 50 years | 0 (0.0%) | 0 (0.0%) |
| Total | 0 (0.0%) | 0 (0.0%) |
Fertility by Education in Stanton
| Educational Attainment | Women with Births | Births / 1,000 Women |
| Less than High School | 0 (0.0%) | 0.0 |
| High School Diploma | 0 (0.0%) | 0.0 |
| College or Associate's Degree | 0 (0.0%) | 0.0 |
| Bachelor's Degree | 0 (0.0%) | 0.0 |
| Graduate Degree | 0 (0.0%) | 0.0 |
| Total | 0 (0.0%) | 0.0 |
Fertility by Education by Marriage Status in Stanton
| Educational Attainment | Married | Unmarried |
| Less than High School | 0 (0.0%) | 0 (0.0%) |
| High School Diploma | 0 (0.0%) | 0 (0.0%) |
| College or Associate's Degree | 0 (0.0%) | 0 (0.0%) |
| Bachelor's Degree | 0 (0.0%) | 0 (0.0%) |
| Graduate Degree | 0 (0.0%) | 0 (0.0%) |
| Total | 0 (0.0%) | 0 (0.0%) |
Employment Characteristics in Stanton
Employment by Class of Employer in Stanton
Among the 298 employed individuals in Stanton, private company employees (242 | 81.2%), not-for-profit organizations (31 | 10.4%), and self-employed (not incorporated) (10 | 3.4%) make up the most common classes of employment.
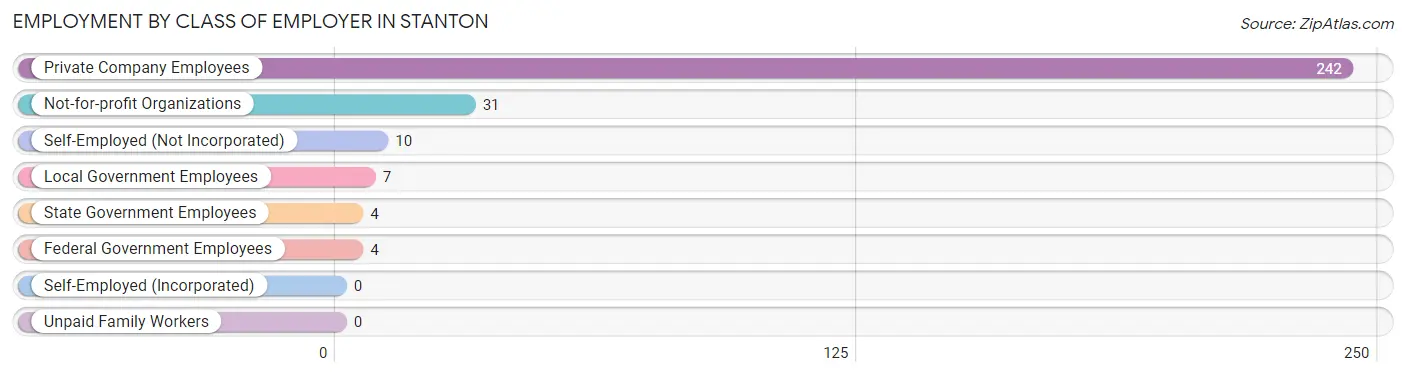
| Employer Class | # Employees | % Employees |
| Private Company Employees | 242 | 81.2% |
| Self-Employed (Incorporated) | 0 | 0.0% |
| Self-Employed (Not Incorporated) | 10 | 3.4% |
| Not-for-profit Organizations | 31 | 10.4% |
| Local Government Employees | 7 | 2.4% |
| State Government Employees | 4 | 1.3% |
| Federal Government Employees | 4 | 1.3% |
| Unpaid Family Workers | 0 | 0.0% |
| Total | 298 | 100.0% |
Employment Status by Age in Stanton
According to the labor force statistics for Stanton, out of the total population over 16 years of age (507), 67.3% or 341 individuals are in the labor force, with 6.5% or 22 of them unemployed. The age group with the highest labor force participation rate is 25 to 29 years, with 100.0% or 48 individuals in the labor force. Within the labor force, the 16 to 19 years age range has the highest percentage of unemployed individuals, with 27.0% or 10 of them being unemployed.
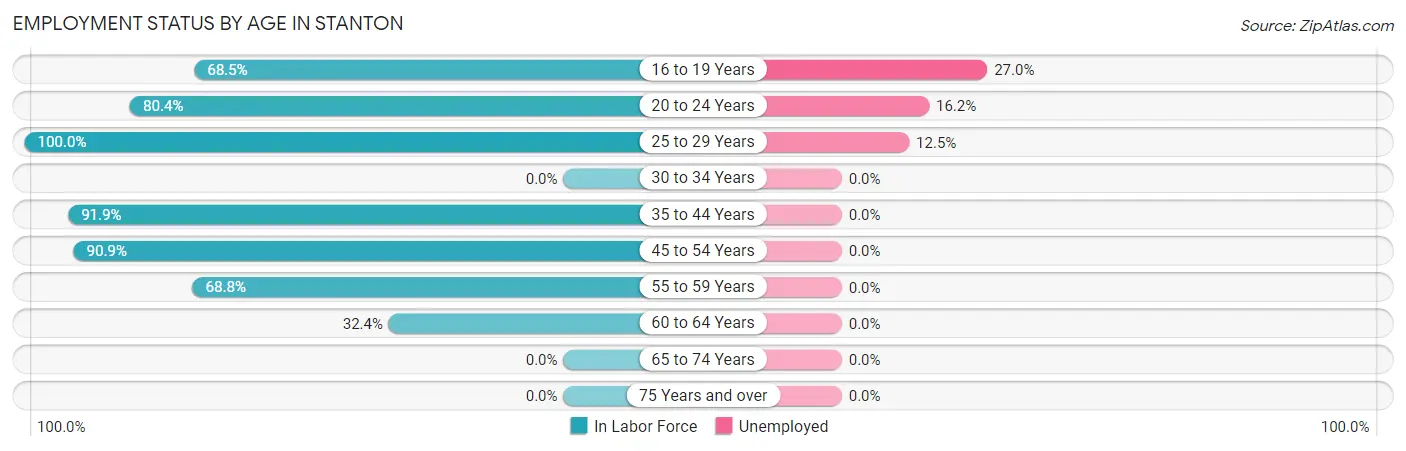
| Age Bracket | In Labor Force | Unemployed |
| 16 to 19 Years | 37 (68.5%) | 10 (27.0%) |
| 20 to 24 Years | 37 (80.4%) | 6 (16.2%) |
| 25 to 29 Years | 48 (100.0%) | 6 (12.5%) |
| 30 to 34 Years | 0 (0.0%) | 0 (0.0%) |
| 35 to 44 Years | 34 (91.9%) | 0 (0.0%) |
| 45 to 54 Years | 130 (90.9%) | 0 (0.0%) |
| 55 to 59 Years | 33 (68.8%) | 0 (0.0%) |
| 60 to 64 Years | 22 (32.4%) | 0 (0.0%) |
| 65 to 74 Years | 0 (0.0%) | 0 (0.0%) |
| 75 Years and over | 0 (0.0%) | 0 (0.0%) |
| Total | 341 (67.3%) | 22 (6.5%) |
Employment Status by Educational Attainment in Stanton
According to labor force statistics for Stanton, 77.6% of individuals (267) out of the total population between 25 and 64 years of age (344) are in the labor force, with 2.2% or 6 of them being unemployed. The group with the highest labor force participation rate are those with the educational attainment of bachelor's degree or higher, with 100.0% or 61 individuals in the labor force. Within the labor force, individuals with less than high school education have the highest percentage of unemployment, with 60.0% or 6 of them being unemployed.
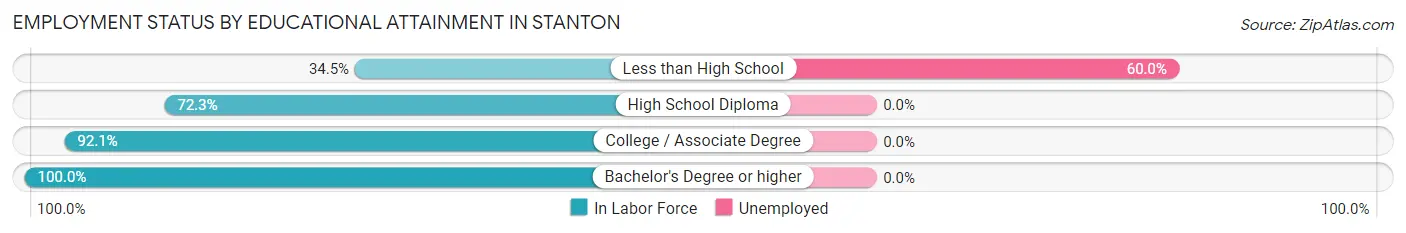
| Educational Attainment | In Labor Force | Unemployed |
| Less than High School | 10 (34.5%) | 17 (60.0%) |
| High School Diploma | 138 (72.3%) | 0 (0.0%) |
| College / Associate Degree | 58 (92.1%) | 0 (0.0%) |
| Bachelor's Degree or higher | 61 (100.0%) | 0 (0.0%) |
| Total | 267 (77.6%) | 8 (2.2%) |
Employment Occupations by Sex in Stanton
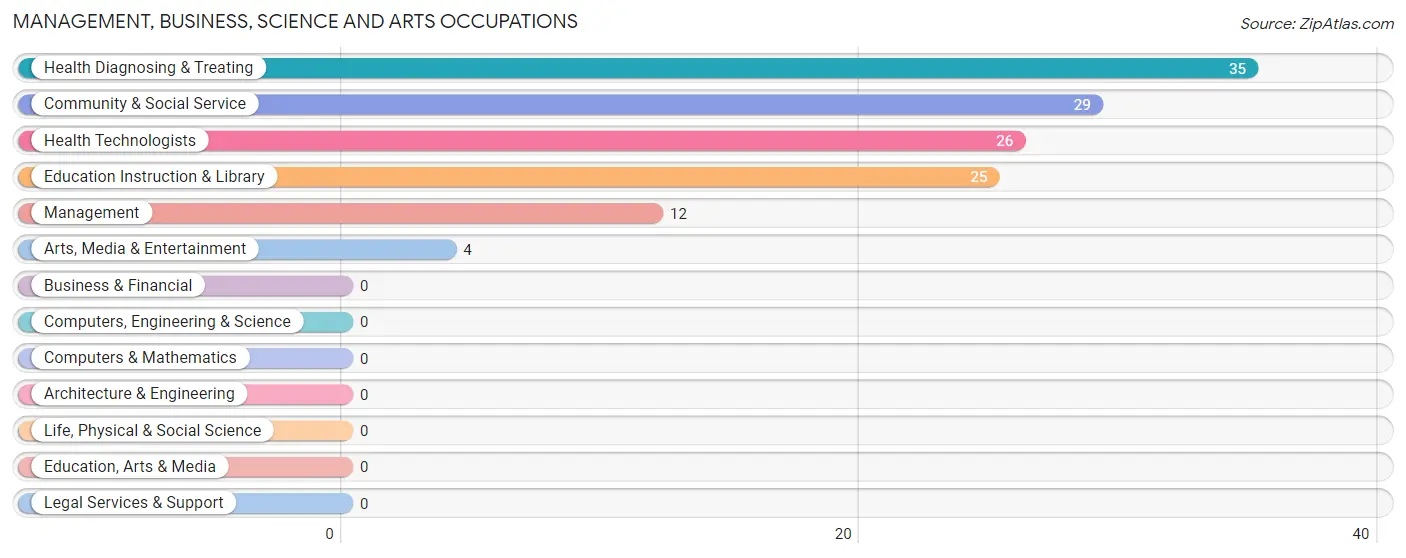
Management, Business, Science and Arts Occupations
The most common Management, Business, Science and Arts occupations in Stanton are Health Diagnosing & Treating (35 | 11.0%), Community & Social Service (29 | 9.1%), Health Technologists (26 | 8.2%), Education Instruction & Library (25 | 7.8%), and Management (12 | 3.8%).
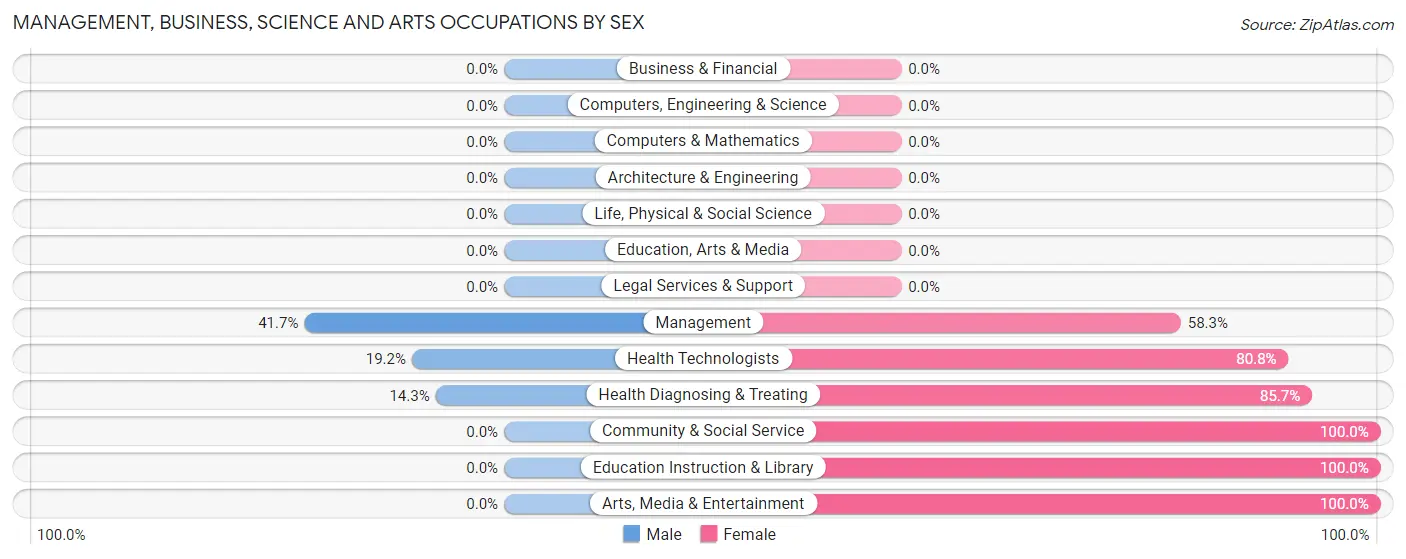
Management, Business, Science and Arts Occupations by Sex
Within the Management, Business, Science and Arts occupations in Stanton, the most male-oriented occupations are Management (41.7%), Health Technologists (19.2%), and Health Diagnosing & Treating (14.3%), while the most female-oriented occupations are Community & Social Service (100.0%), Education Instruction & Library (100.0%), and Arts, Media & Entertainment (100.0%).
| Occupation | Male | Female |
| Management | 5 (41.7%) | 7 (58.3%) |
| Business & Financial | 0 (0.0%) | 0 (0.0%) |
| Computers, Engineering & Science | 0 (0.0%) | 0 (0.0%) |
| Computers & Mathematics | 0 (0.0%) | 0 (0.0%) |
| Architecture & Engineering | 0 (0.0%) | 0 (0.0%) |
| Life, Physical & Social Science | 0 (0.0%) | 0 (0.0%) |
| Community & Social Service | 0 (0.0%) | 29 (100.0%) |
| Education, Arts & Media | 0 (0.0%) | 0 (0.0%) |
| Legal Services & Support | 0 (0.0%) | 0 (0.0%) |
| Education Instruction & Library | 0 (0.0%) | 25 (100.0%) |
| Arts, Media & Entertainment | 0 (0.0%) | 4 (100.0%) |
| Health Diagnosing & Treating | 5 (14.3%) | 30 (85.7%) |
| Health Technologists | 5 (19.2%) | 21 (80.8%) |
| Total (Category) | 10 (13.2%) | 66 (86.8%) |
| Total (Overall) | 103 (32.3%) | 216 (67.7%) |
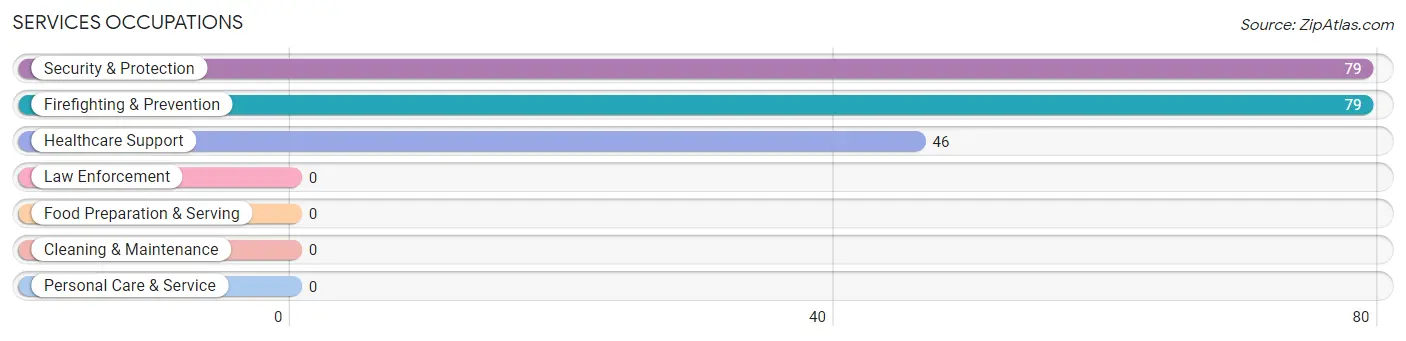
Services Occupations
The most common Services occupations in Stanton are Security & Protection (79 | 24.8%), Firefighting & Prevention (79 | 24.8%), and Healthcare Support (46 | 14.4%).
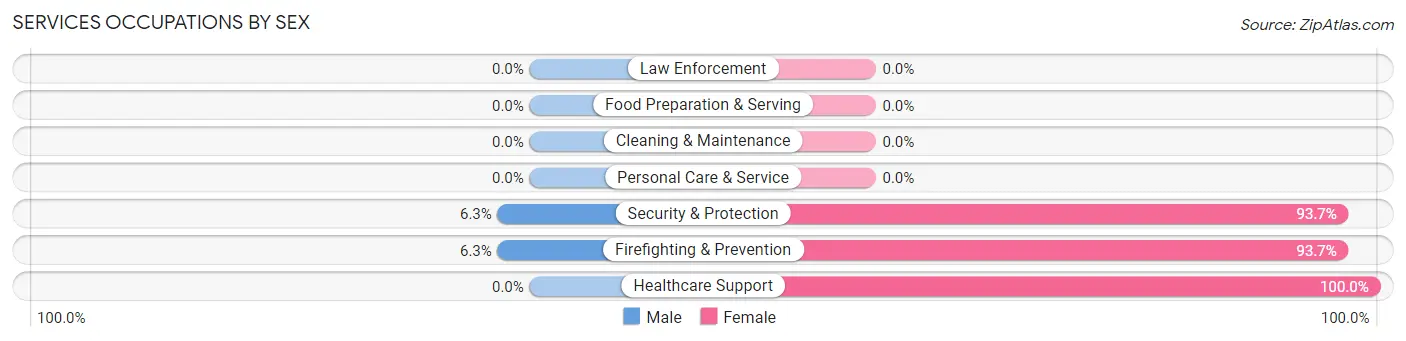
Services Occupations by Sex
Within the Services occupations in Stanton, the most male-oriented occupations are Security & Protection (6.3%), and Firefighting & Prevention (6.3%), while the most female-oriented occupations are Healthcare Support (100.0%), Security & Protection (93.7%), and Firefighting & Prevention (93.7%).
| Occupation | Male | Female |
| Healthcare Support | 0 (0.0%) | 46 (100.0%) |
| Security & Protection | 5 (6.3%) | 74 (93.7%) |
| Firefighting & Prevention | 5 (6.3%) | 74 (93.7%) |
| Law Enforcement | 0 (0.0%) | 0 (0.0%) |
| Food Preparation & Serving | 0 (0.0%) | 0 (0.0%) |
| Cleaning & Maintenance | 0 (0.0%) | 0 (0.0%) |
| Personal Care & Service | 0 (0.0%) | 0 (0.0%) |
| Total (Category) | 5 (4.0%) | 120 (96.0%) |
| Total (Overall) | 103 (32.3%) | 216 (67.7%) |
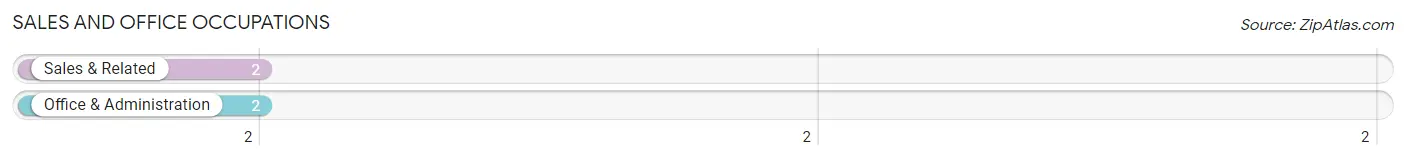
Sales and Office Occupations
The most common Sales and Office occupations in Stanton are Sales & Related (2 | 0.6%), and Office & Administration (2 | 0.6%).
Sales and Office Occupations by Sex
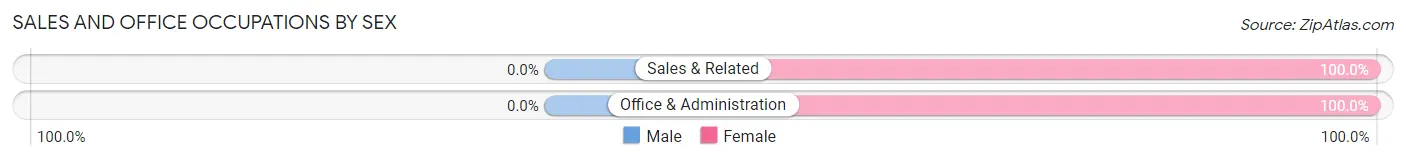
| Occupation | Male | Female |
| Sales & Related | 0 (0.0%) | 2 (100.0%) |
| Office & Administration | 0 (0.0%) | 2 (100.0%) |
| Total (Category) | 0 (0.0%) | 4 (100.0%) |
| Total (Overall) | 103 (32.3%) | 216 (67.7%) |
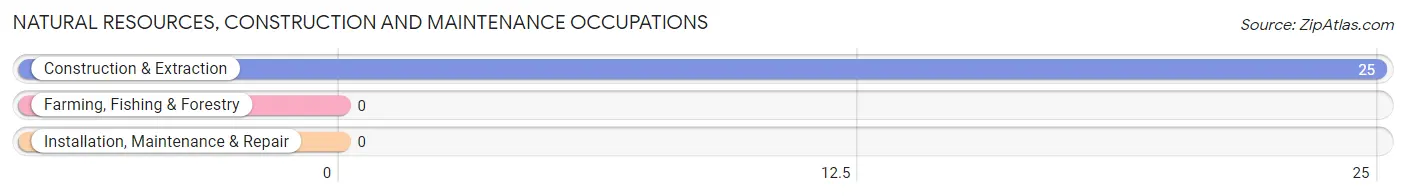
Natural Resources, Construction and Maintenance Occupations
The most common Natural Resources, Construction and Maintenance occupations in Stanton are , and Construction & Extraction (25 | 7.8%).
Natural Resources, Construction and Maintenance Occupations by Sex
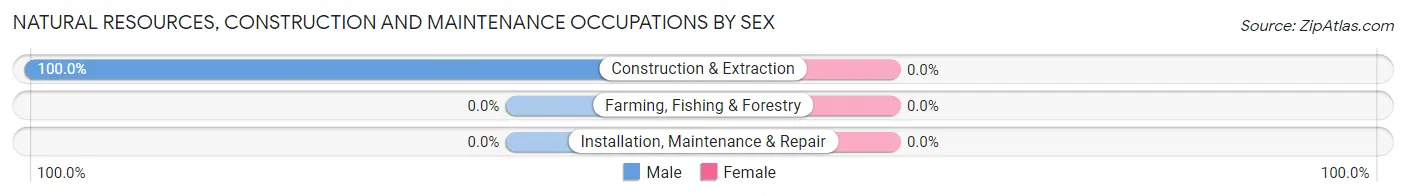
| Occupation | Male | Female |
| Farming, Fishing & Forestry | 0 (0.0%) | 0 (0.0%) |
| Construction & Extraction | 25 (100.0%) | 0 (0.0%) |
| Installation, Maintenance & Repair | 0 (0.0%) | 0 (0.0%) |
| Total (Category) | 25 (100.0%) | 0 (0.0%) |
| Total (Overall) | 103 (32.3%) | 216 (67.7%) |
Production, Transportation and Moving Occupations
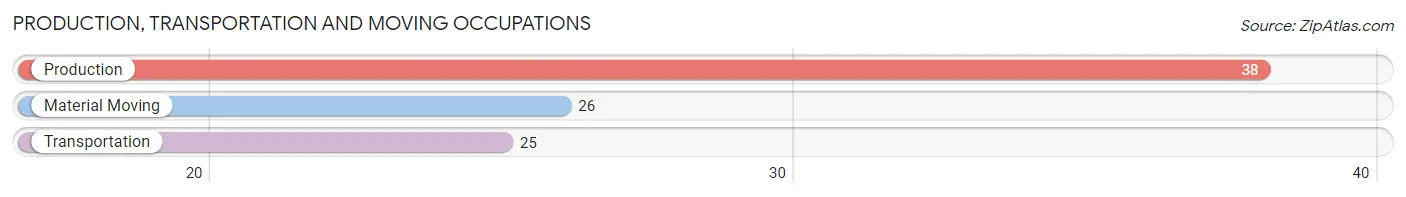
The most common Production, Transportation and Moving occupations in Stanton are Production (38 | 11.9%), Material Moving (26 | 8.2%), and Transportation (25 | 7.8%).
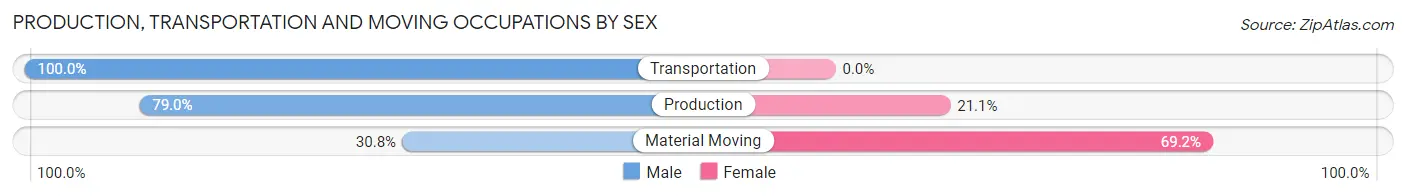
Production, Transportation and Moving Occupations by Sex
| Occupation | Male | Female |
| Production | 30 (78.9%) | 8 (21.0%) |
| Transportation | 25 (100.0%) | 0 (0.0%) |
| Material Moving | 8 (30.8%) | 18 (69.2%) |
| Total (Category) | 63 (70.8%) | 26 (29.2%) |
| Total (Overall) | 103 (32.3%) | 216 (67.7%) |
Employment Industries by Sex in Stanton
Employment Industries in Stanton
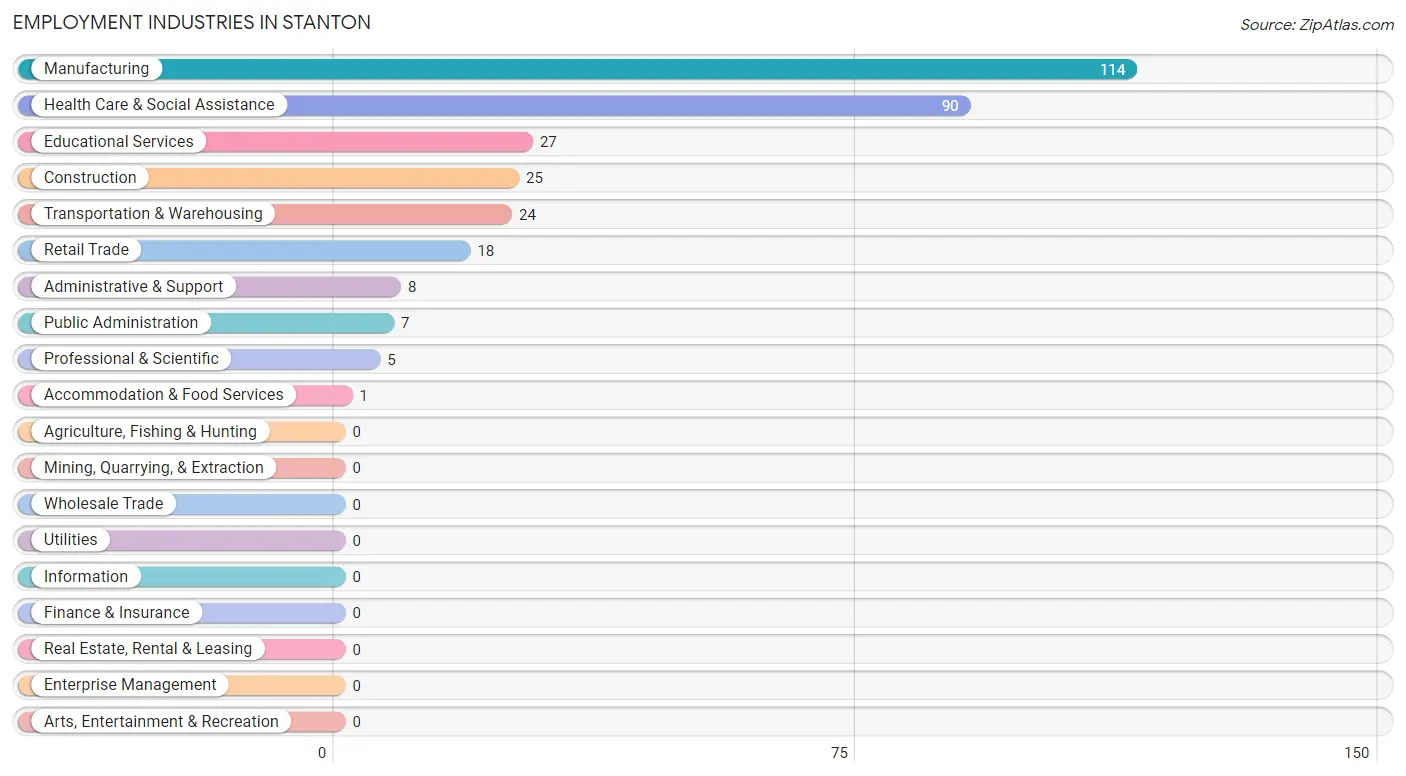
The major employment industries in Stanton include Manufacturing (114 | 35.7%), Health Care & Social Assistance (90 | 28.2%), Educational Services (27 | 8.5%), Construction (25 | 7.8%), and Transportation & Warehousing (24 | 7.5%).
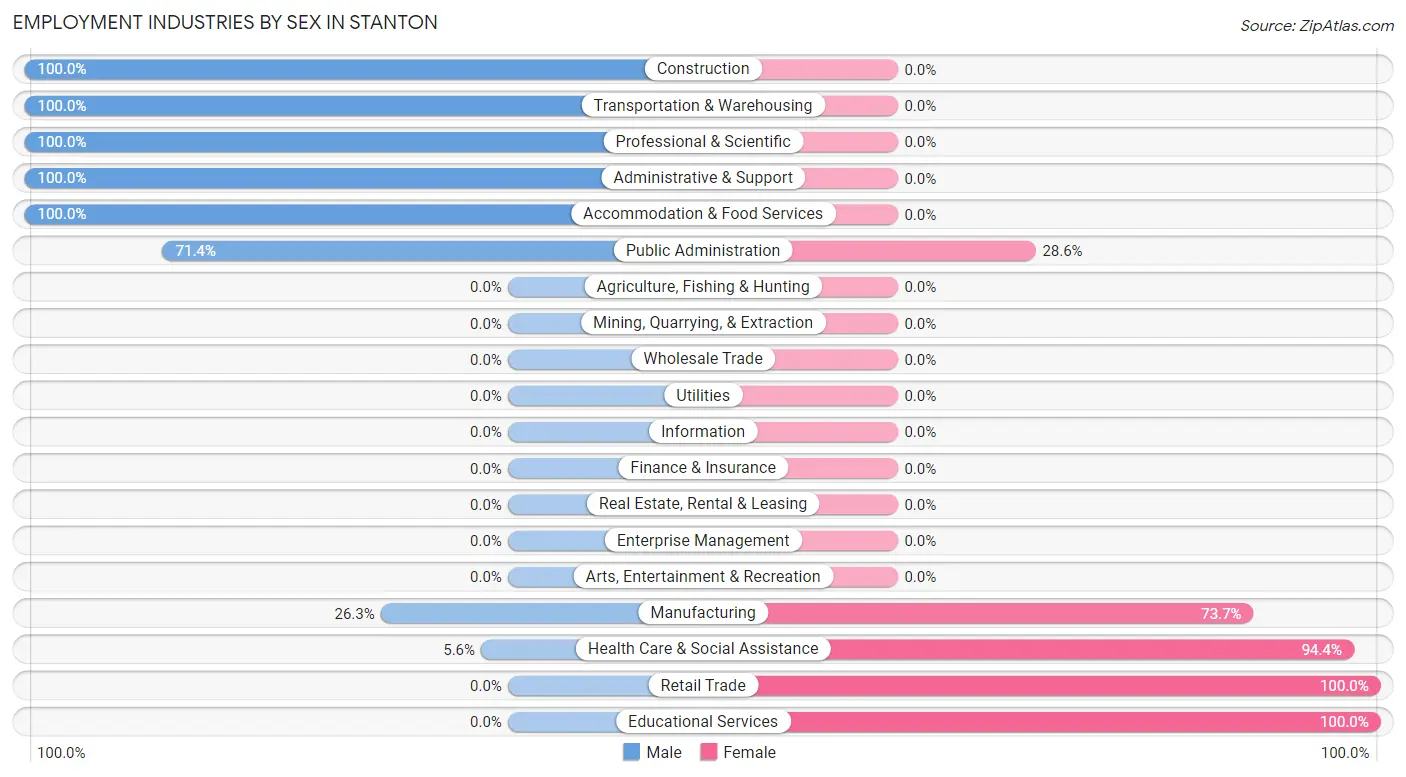
Employment Industries by Sex in Stanton
The Stanton industries that see more men than women are Construction (100.0%), Transportation & Warehousing (100.0%), and Professional & Scientific (100.0%), whereas the industries that tend to have a higher number of women are Retail Trade (100.0%), Educational Services (100.0%), and Health Care & Social Assistance (94.4%).
| Industry | Male | Female |
| Agriculture, Fishing & Hunting | 0 (0.0%) | 0 (0.0%) |
| Mining, Quarrying, & Extraction | 0 (0.0%) | 0 (0.0%) |
| Construction | 25 (100.0%) | 0 (0.0%) |
| Manufacturing | 30 (26.3%) | 84 (73.7%) |
| Wholesale Trade | 0 (0.0%) | 0 (0.0%) |
| Retail Trade | 0 (0.0%) | 18 (100.0%) |
| Transportation & Warehousing | 24 (100.0%) | 0 (0.0%) |
| Utilities | 0 (0.0%) | 0 (0.0%) |
| Information | 0 (0.0%) | 0 (0.0%) |
| Finance & Insurance | 0 (0.0%) | 0 (0.0%) |
| Real Estate, Rental & Leasing | 0 (0.0%) | 0 (0.0%) |
| Professional & Scientific | 5 (100.0%) | 0 (0.0%) |
| Enterprise Management | 0 (0.0%) | 0 (0.0%) |
| Administrative & Support | 8 (100.0%) | 0 (0.0%) |
| Educational Services | 0 (0.0%) | 27 (100.0%) |
| Health Care & Social Assistance | 5 (5.6%) | 85 (94.4%) |
| Arts, Entertainment & Recreation | 0 (0.0%) | 0 (0.0%) |
| Accommodation & Food Services | 1 (100.0%) | 0 (0.0%) |
| Public Administration | 5 (71.4%) | 2 (28.6%) |
| Total | 103 (32.3%) | 216 (67.7%) |
Education in Stanton
School Enrollment in Stanton
The most common levels of schooling among the 89 students in Stanton are college / undergraduate (24 | 27.0%), middle school (17 | 19.1%), and graduate / professional (13 | 14.6%).
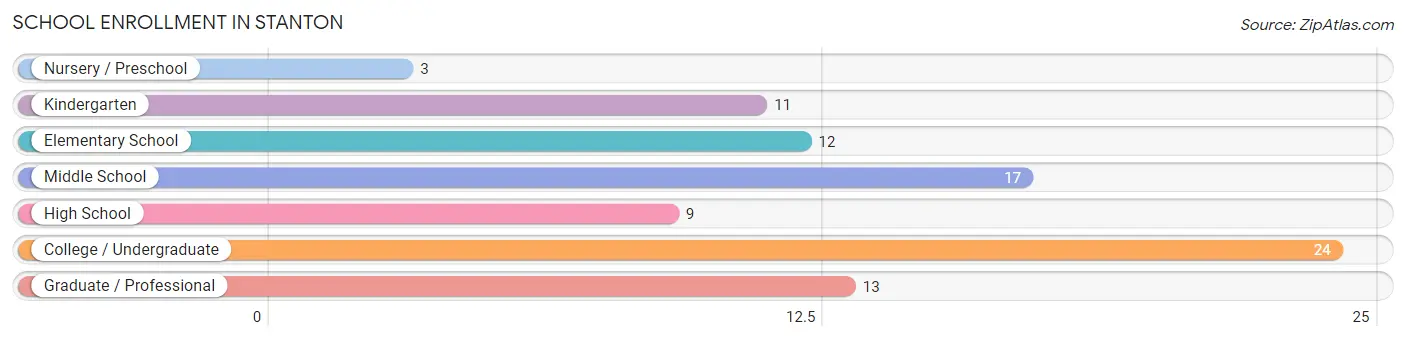
| School Level | # Students | % Students |
| Nursery / Preschool | 3 | 3.4% |
| Kindergarten | 11 | 12.4% |
| Elementary School | 12 | 13.5% |
| Middle School | 17 | 19.1% |
| High School | 9 | 10.1% |
| College / Undergraduate | 24 | 27.0% |
| Graduate / Professional | 13 | 14.6% |
| Total | 89 | 100.0% |
School Enrollment by Age by Funding Source in Stanton
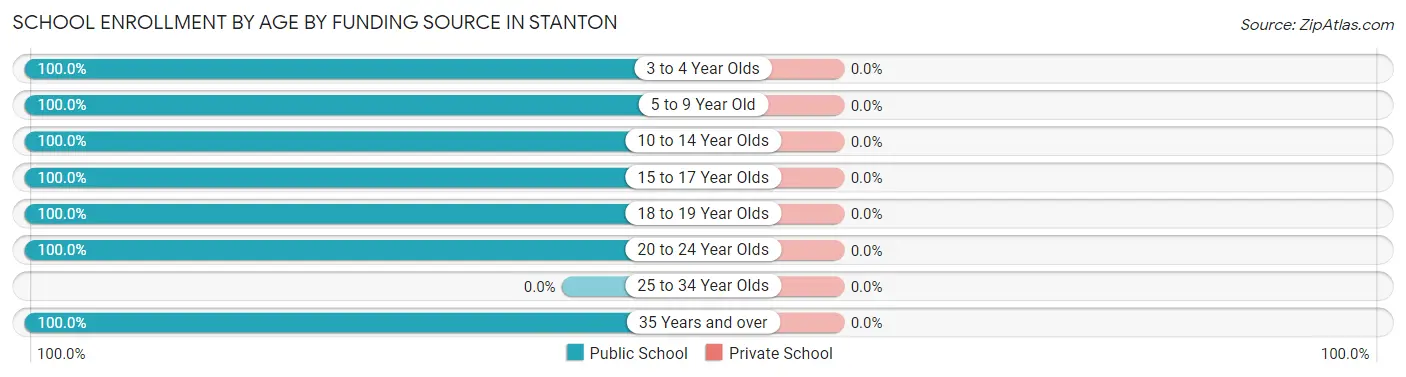
| Age Bracket | Public School | Private School |
| 3 to 4 Year Olds | 3 (100.0%) | 0 (0.0%) |
| 5 to 9 Year Old | 23 (100.0%) | 0 (0.0%) |
| 10 to 14 Year Olds | 17 (100.0%) | 0 (0.0%) |
| 15 to 17 Year Olds | 9 (100.0%) | 0 (0.0%) |
| 18 to 19 Year Olds | 24 (100.0%) | 0 (0.0%) |
| 20 to 24 Year Olds | 9 (100.0%) | 0 (0.0%) |
| 25 to 34 Year Olds | 0 (0.0%) | 0 (0.0%) |
| 35 Years and over | 4 (100.0%) | 0 (0.0%) |
| Total | 89 (100.0%) | 0 (0.0%) |
Educational Attainment by Field of Study in Stanton
Science & technology (26 | 30.2%), business (17 | 19.8%), arts & humanities (14 | 16.3%), education (12 | 14.0%), and communications (8 | 9.3%) are the most common fields of study among 86 individuals in Stanton who have obtained a bachelor's degree or higher.
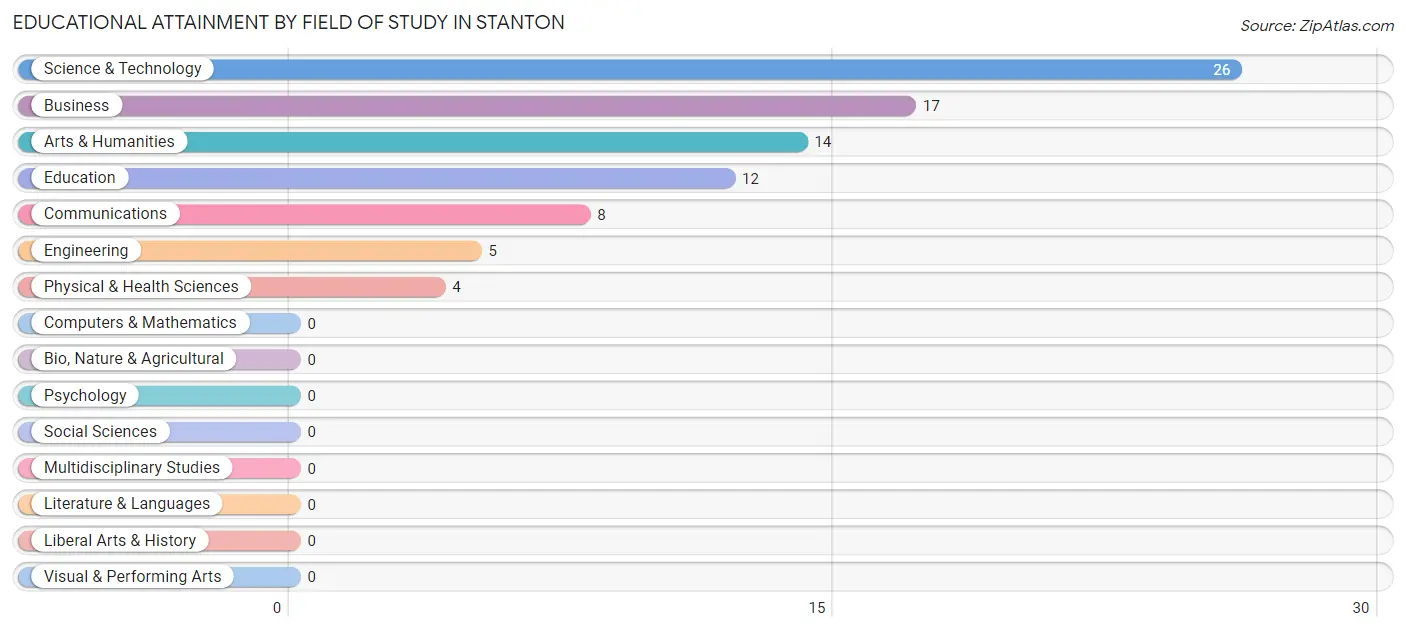
| Field of Study | # Graduates | % Graduates |
| Computers & Mathematics | 0 | 0.0% |
| Bio, Nature & Agricultural | 0 | 0.0% |
| Physical & Health Sciences | 4 | 4.6% |
| Psychology | 0 | 0.0% |
| Social Sciences | 0 | 0.0% |
| Engineering | 5 | 5.8% |
| Multidisciplinary Studies | 0 | 0.0% |
| Science & Technology | 26 | 30.2% |
| Business | 17 | 19.8% |
| Education | 12 | 14.0% |
| Literature & Languages | 0 | 0.0% |
| Liberal Arts & History | 0 | 0.0% |
| Visual & Performing Arts | 0 | 0.0% |
| Communications | 8 | 9.3% |
| Arts & Humanities | 14 | 16.3% |
| Total | 86 | 100.0% |
Transportation & Commute in Stanton
Vehicle Availability by Sex in Stanton
The most prevalent vehicle ownership categories in Stanton are males with 2 vehicles (81, accounting for 78.6%) and females with 2 vehicles (81, making up 41.5%).
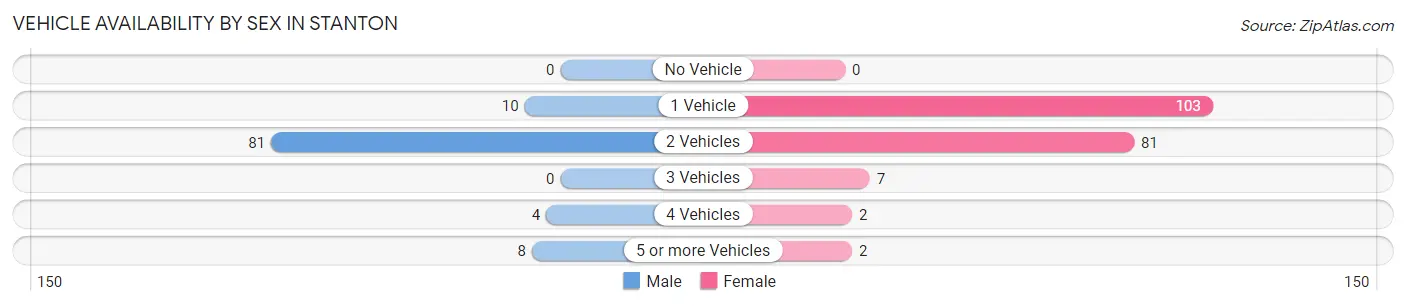
| Vehicles Available | Male | Female |
| No Vehicle | 0 (0.0%) | 0 (0.0%) |
| 1 Vehicle | 10 (9.7%) | 103 (52.8%) |
| 2 Vehicles | 81 (78.6%) | 81 (41.5%) |
| 3 Vehicles | 0 (0.0%) | 7 (3.6%) |
| 4 Vehicles | 4 (3.9%) | 2 (1.0%) |
| 5 or more Vehicles | 8 (7.8%) | 2 (1.0%) |
| Total | 103 (100.0%) | 195 (100.0%) |
Commute Time in Stanton
The most frequently occuring commute durations in Stanton are 15 to 19 minutes (79 commuters, 26.5%), 40 to 44 minutes (62 commuters, 20.8%), and 45 to 59 minutes (58 commuters, 19.5%).
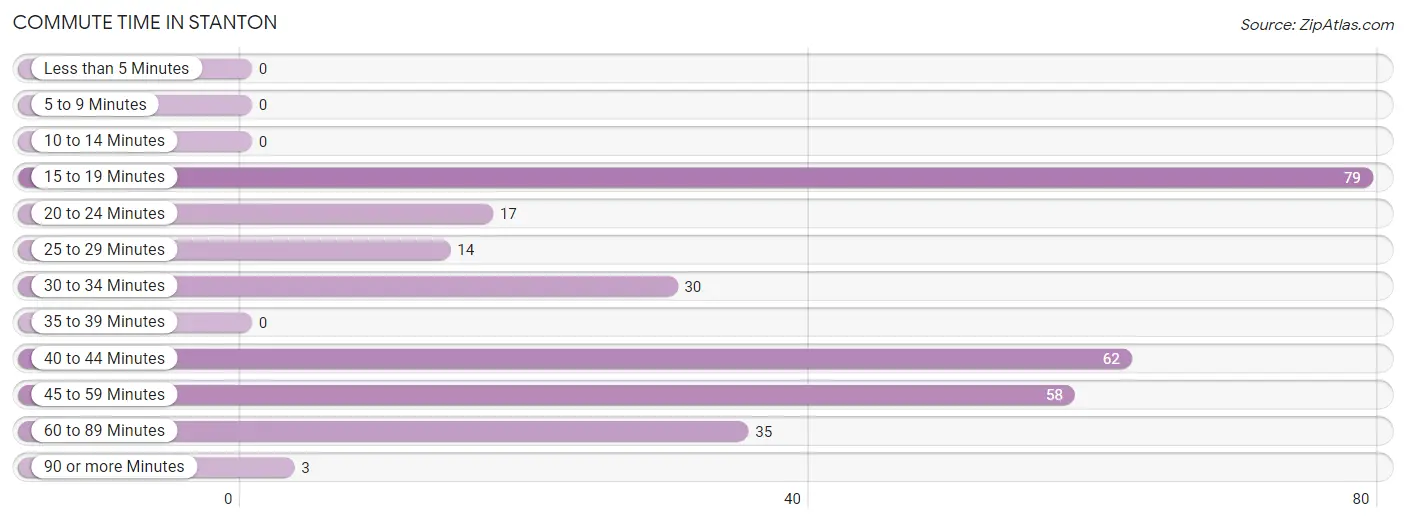
| Commute Time | # Commuters | % Commuters |
| Less than 5 Minutes | 0 | 0.0% |
| 5 to 9 Minutes | 0 | 0.0% |
| 10 to 14 Minutes | 0 | 0.0% |
| 15 to 19 Minutes | 79 | 26.5% |
| 20 to 24 Minutes | 17 | 5.7% |
| 25 to 29 Minutes | 14 | 4.7% |
| 30 to 34 Minutes | 30 | 10.1% |
| 35 to 39 Minutes | 0 | 0.0% |
| 40 to 44 Minutes | 62 | 20.8% |
| 45 to 59 Minutes | 58 | 19.5% |
| 60 to 89 Minutes | 35 | 11.7% |
| 90 or more Minutes | 3 | 1.0% |
Commute Time by Sex in Stanton
The most common commute times in Stanton are 60 to 89 minutes (31 commuters, 30.1%) for males and 15 to 19 minutes (74 commuters, 38.0%) for females.
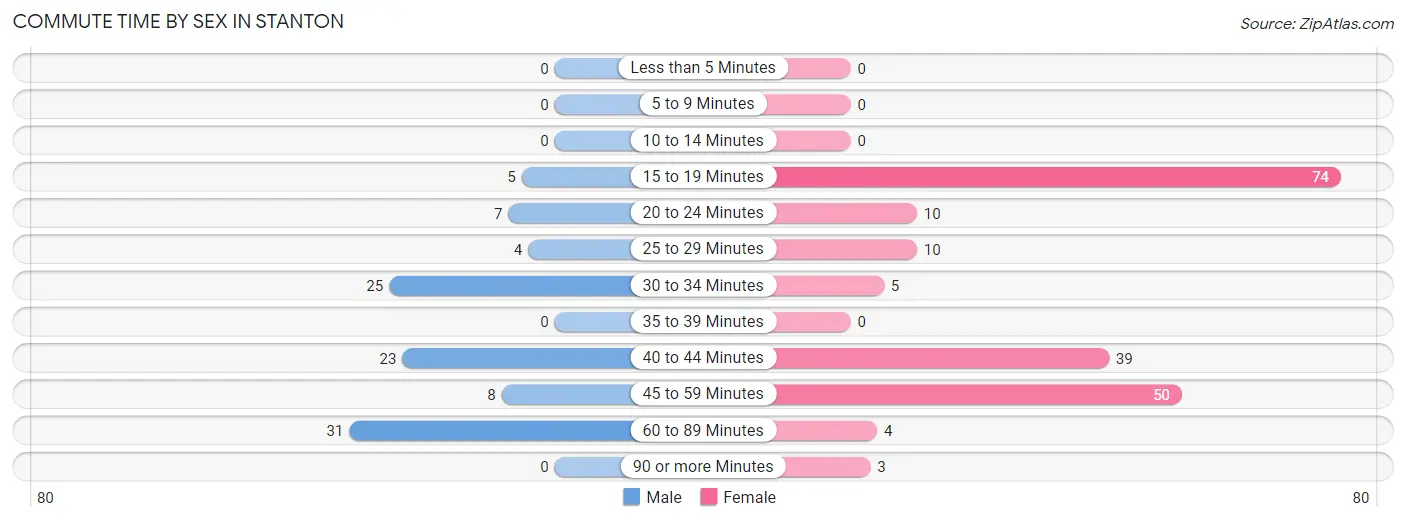
| Commute Time | Male | Female |
| Less than 5 Minutes | 0 (0.0%) | 0 (0.0%) |
| 5 to 9 Minutes | 0 (0.0%) | 0 (0.0%) |
| 10 to 14 Minutes | 0 (0.0%) | 0 (0.0%) |
| 15 to 19 Minutes | 5 (4.9%) | 74 (38.0%) |
| 20 to 24 Minutes | 7 (6.8%) | 10 (5.1%) |
| 25 to 29 Minutes | 4 (3.9%) | 10 (5.1%) |
| 30 to 34 Minutes | 25 (24.3%) | 5 (2.6%) |
| 35 to 39 Minutes | 0 (0.0%) | 0 (0.0%) |
| 40 to 44 Minutes | 23 (22.3%) | 39 (20.0%) |
| 45 to 59 Minutes | 8 (7.8%) | 50 (25.6%) |
| 60 to 89 Minutes | 31 (30.1%) | 4 (2.1%) |
| 90 or more Minutes | 0 (0.0%) | 3 (1.5%) |
Time of Departure to Work by Sex in Stanton
The most frequent times of departure to work in Stanton are 12:00 AM to 4:59 AM (25, 24.3%) for males and 5:30 AM to 5:59 AM (95, 48.7%) for females.
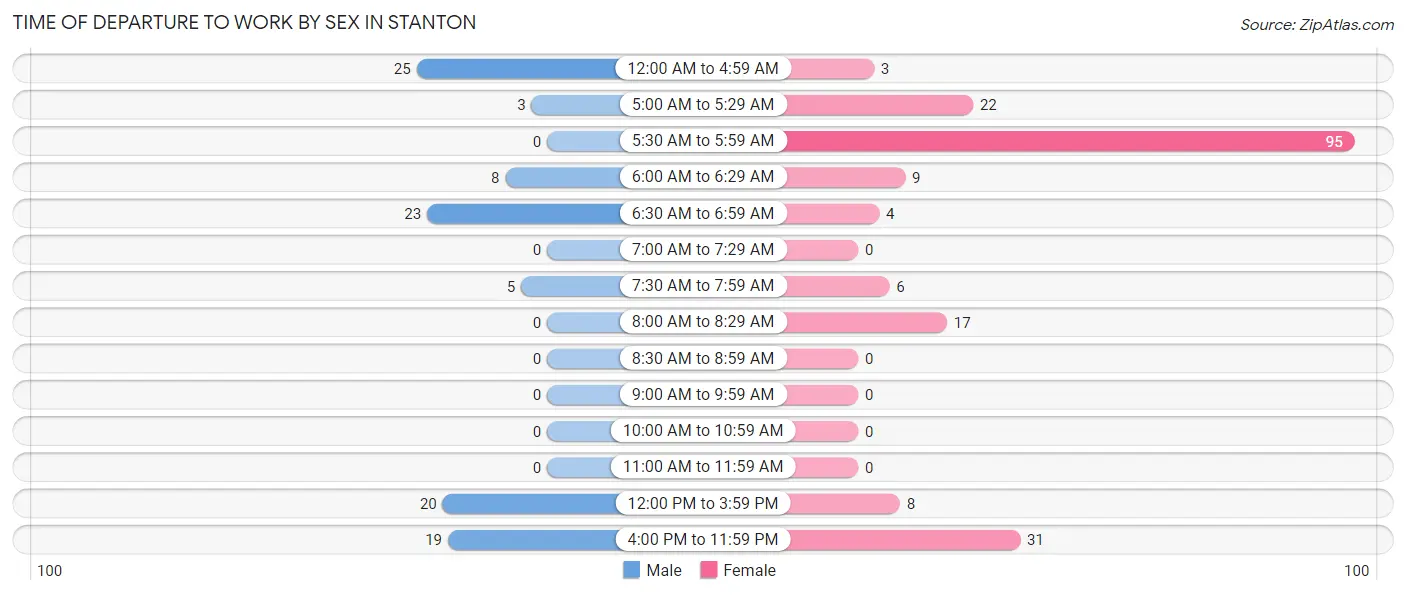
| Time of Departure | Male | Female |
| 12:00 AM to 4:59 AM | 25 (24.3%) | 3 (1.5%) |
| 5:00 AM to 5:29 AM | 3 (2.9%) | 22 (11.3%) |
| 5:30 AM to 5:59 AM | 0 (0.0%) | 95 (48.7%) |
| 6:00 AM to 6:29 AM | 8 (7.8%) | 9 (4.6%) |
| 6:30 AM to 6:59 AM | 23 (22.3%) | 4 (2.1%) |
| 7:00 AM to 7:29 AM | 0 (0.0%) | 0 (0.0%) |
| 7:30 AM to 7:59 AM | 5 (4.9%) | 6 (3.1%) |
| 8:00 AM to 8:29 AM | 0 (0.0%) | 17 (8.7%) |
| 8:30 AM to 8:59 AM | 0 (0.0%) | 0 (0.0%) |
| 9:00 AM to 9:59 AM | 0 (0.0%) | 0 (0.0%) |
| 10:00 AM to 10:59 AM | 0 (0.0%) | 0 (0.0%) |
| 11:00 AM to 11:59 AM | 0 (0.0%) | 0 (0.0%) |
| 12:00 PM to 3:59 PM | 20 (19.4%) | 8 (4.1%) |
| 4:00 PM to 11:59 PM | 19 (18.4%) | 31 (15.9%) |
| Total | 103 (100.0%) | 195 (100.0%) |
Housing Occupancy in Stanton
Occupancy by Ownership in Stanton
Of the total 289 dwellings in Stanton, owner-occupied units account for 100 (34.6%), while renter-occupied units make up 189 (65.4%).
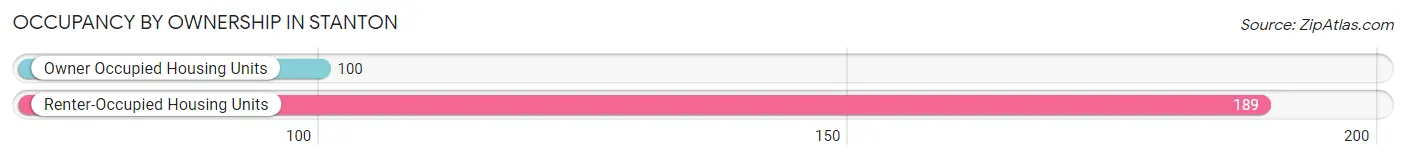
| Occupancy | # Housing Units | % Housing Units |
| Owner Occupied Housing Units | 100 | 34.6% |
| Renter-Occupied Housing Units | 189 | 65.4% |
| Total Occupied Housing Units | 289 | 100.0% |
Occupancy by Household Size in Stanton
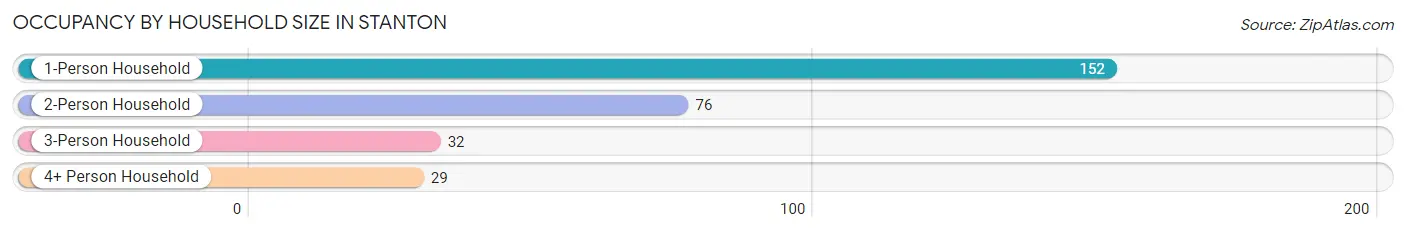
| Household Size | # Housing Units | % Housing Units |
| 1-Person Household | 152 | 52.6% |
| 2-Person Household | 76 | 26.3% |
| 3-Person Household | 32 | 11.1% |
| 4+ Person Household | 29 | 10.0% |
| Total Housing Units | 289 | 100.0% |
Occupancy by Ownership by Household Size in Stanton
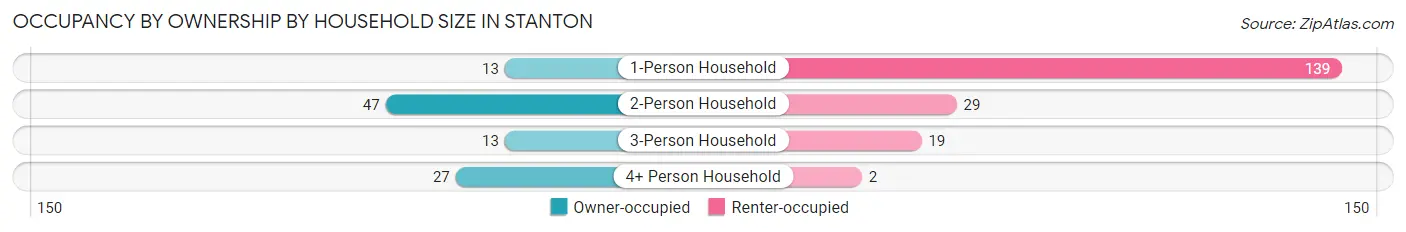
| Household Size | Owner-occupied | Renter-occupied |
| 1-Person Household | 13 (8.6%) | 139 (91.4%) |
| 2-Person Household | 47 (61.8%) | 29 (38.2%) |
| 3-Person Household | 13 (40.6%) | 19 (59.4%) |
| 4+ Person Household | 27 (93.1%) | 2 (6.9%) |
| Total Housing Units | 100 (34.6%) | 189 (65.4%) |
Occupancy by Educational Attainment in Stanton
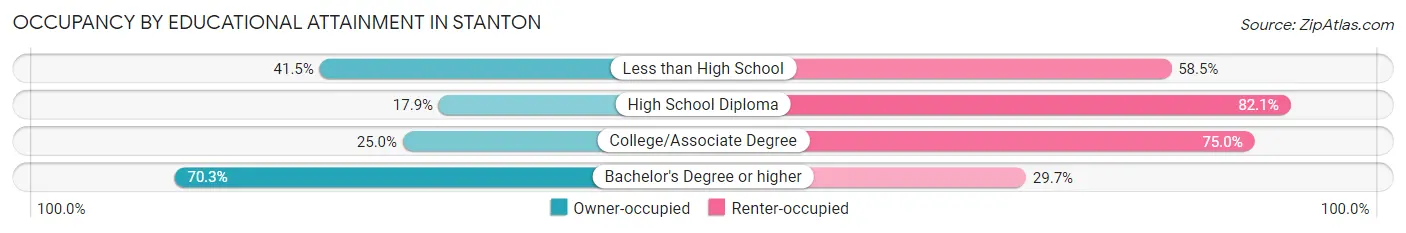
| Household Size | Owner-occupied | Renter-occupied |
| Less than High School | 22 (41.5%) | 31 (58.5%) |
| High School Diploma | 25 (17.9%) | 115 (82.1%) |
| College/Associate Degree | 8 (25.0%) | 24 (75.0%) |
| Bachelor's Degree or higher | 45 (70.3%) | 19 (29.7%) |
Occupancy by Age of Householder in Stanton
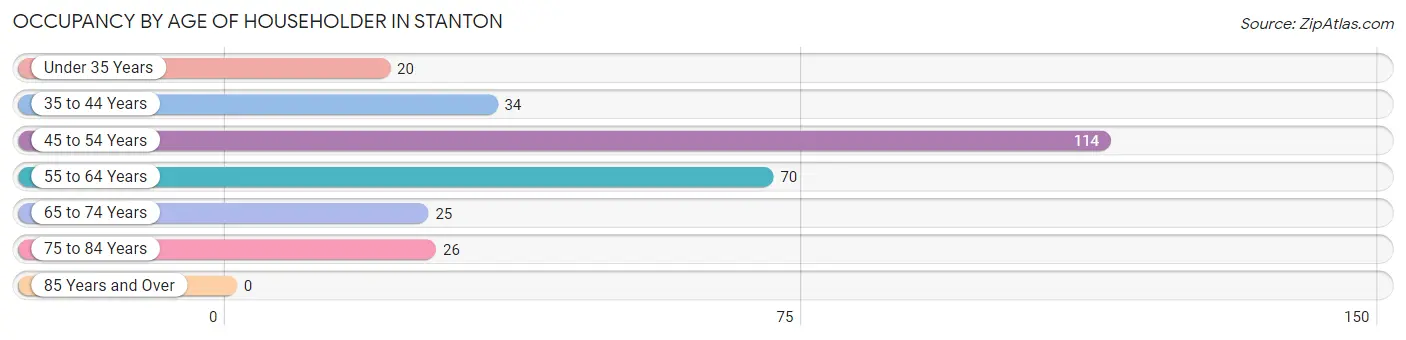
| Age Bracket | # Households | % Households |
| Under 35 Years | 20 | 6.9% |
| 35 to 44 Years | 34 | 11.8% |
| 45 to 54 Years | 114 | 39.5% |
| 55 to 64 Years | 70 | 24.2% |
| 65 to 74 Years | 25 | 8.6% |
| 75 to 84 Years | 26 | 9.0% |
| 85 Years and Over | 0 | 0.0% |
| Total | 289 | 100.0% |
Housing Finances in Stanton
Median Income by Occupancy in Stanton
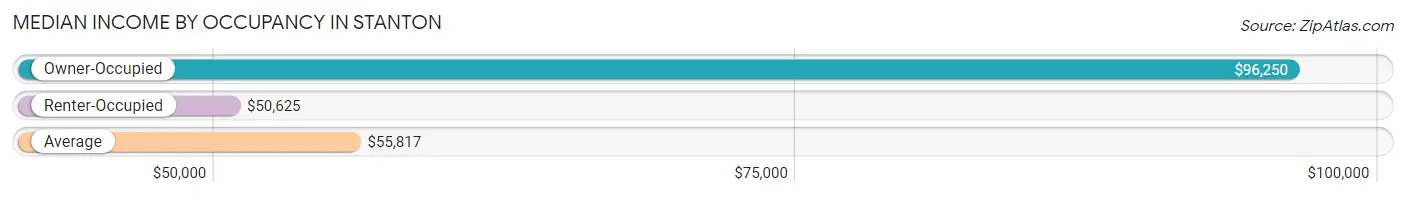
| Occupancy Type | # Households | Median Income |
| Owner-Occupied | 100 (34.6%) | $96,250 |
| Renter-Occupied | 189 (65.4%) | $50,625 |
| Average | 289 (100.0%) | $55,817 |
Occupancy by Householder Income Bracket in Stanton
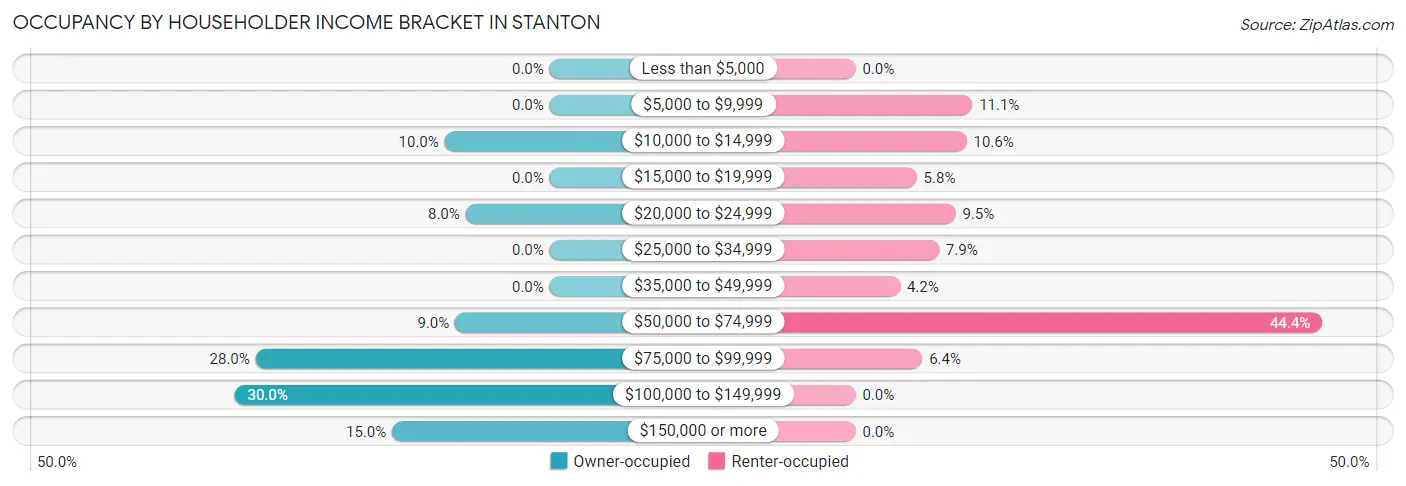
| Income Bracket | Owner-occupied | Renter-occupied |
| Less than $5,000 | 0 (0.0%) | 0 (0.0%) |
| $5,000 to $9,999 | 0 (0.0%) | 21 (11.1%) |
| $10,000 to $14,999 | 10 (10.0%) | 20 (10.6%) |
| $15,000 to $19,999 | 0 (0.0%) | 11 (5.8%) |
| $20,000 to $24,999 | 8 (8.0%) | 18 (9.5%) |
| $25,000 to $34,999 | 0 (0.0%) | 15 (7.9%) |
| $35,000 to $49,999 | 0 (0.0%) | 8 (4.2%) |
| $50,000 to $74,999 | 9 (9.0%) | 84 (44.4%) |
| $75,000 to $99,999 | 28 (28.0%) | 12 (6.4%) |
| $100,000 to $149,999 | 30 (30.0%) | 0 (0.0%) |
| $150,000 or more | 15 (15.0%) | 0 (0.0%) |
| Total | 100 (100.0%) | 189 (100.0%) |
Monthly Housing Cost Tiers in Stanton
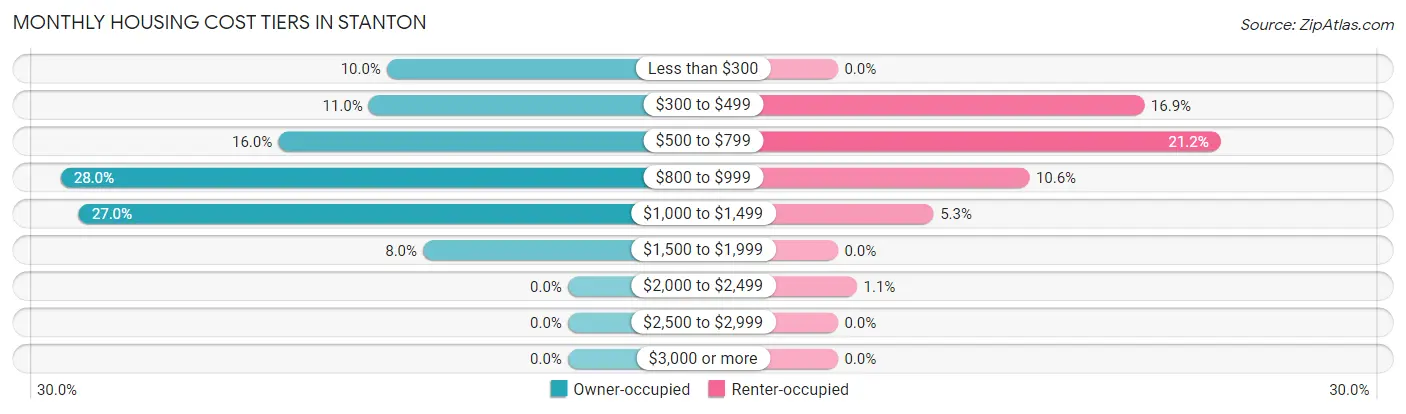
| Monthly Cost | Owner-occupied | Renter-occupied |
| Less than $300 | 10 (10.0%) | 0 (0.0%) |
| $300 to $499 | 11 (11.0%) | 32 (16.9%) |
| $500 to $799 | 16 (16.0%) | 40 (21.2%) |
| $800 to $999 | 28 (28.0%) | 20 (10.6%) |
| $1,000 to $1,499 | 27 (27.0%) | 10 (5.3%) |
| $1,500 to $1,999 | 8 (8.0%) | 0 (0.0%) |
| $2,000 to $2,499 | 0 (0.0%) | 2 (1.1%) |
| $2,500 to $2,999 | 0 (0.0%) | 0 (0.0%) |
| $3,000 or more | 0 (0.0%) | 0 (0.0%) |
| Total | 100 (100.0%) | 189 (100.0%) |
Physical Housing Characteristics in Stanton
Housing Structures in Stanton
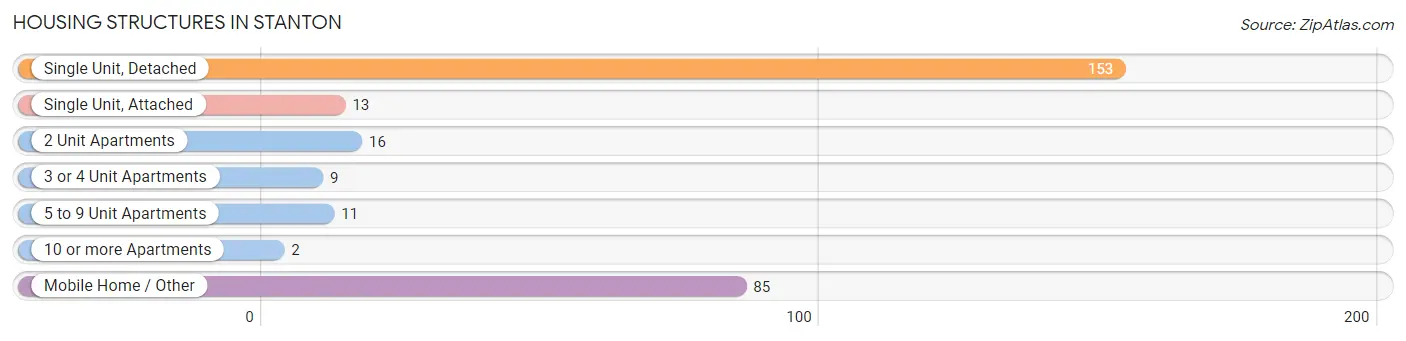
| Structure Type | # Housing Units | % Housing Units |
| Single Unit, Detached | 153 | 52.9% |
| Single Unit, Attached | 13 | 4.5% |
| 2 Unit Apartments | 16 | 5.5% |
| 3 or 4 Unit Apartments | 9 | 3.1% |
| 5 to 9 Unit Apartments | 11 | 3.8% |
| 10 or more Apartments | 2 | 0.7% |
| Mobile Home / Other | 85 | 29.4% |
| Total | 289 | 100.0% |
Housing Structures by Occupancy in Stanton
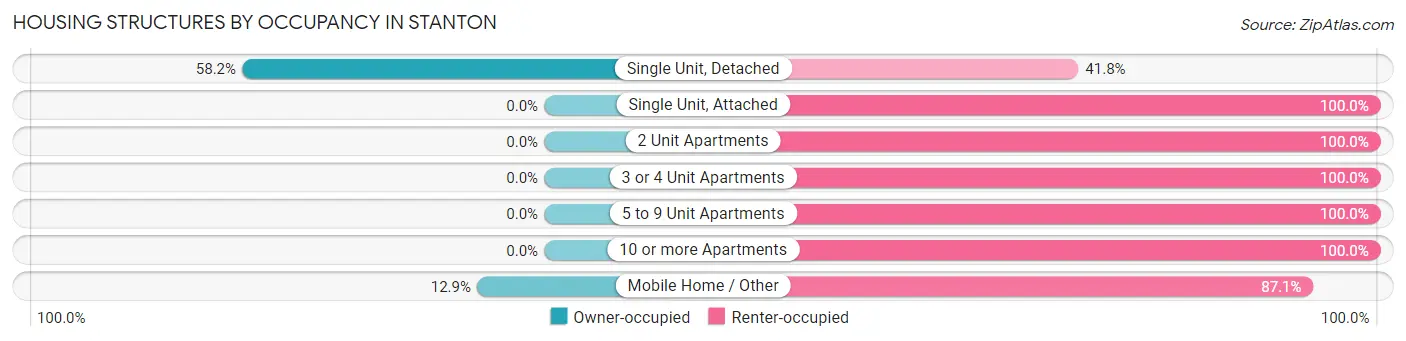
| Structure Type | Owner-occupied | Renter-occupied |
| Single Unit, Detached | 89 (58.2%) | 64 (41.8%) |
| Single Unit, Attached | 0 (0.0%) | 13 (100.0%) |
| 2 Unit Apartments | 0 (0.0%) | 16 (100.0%) |
| 3 or 4 Unit Apartments | 0 (0.0%) | 9 (100.0%) |
| 5 to 9 Unit Apartments | 0 (0.0%) | 11 (100.0%) |
| 10 or more Apartments | 0 (0.0%) | 2 (100.0%) |
| Mobile Home / Other | 11 (12.9%) | 74 (87.1%) |
| Total | 100 (34.6%) | 189 (65.4%) |
Housing Structures by Number of Rooms in Stanton
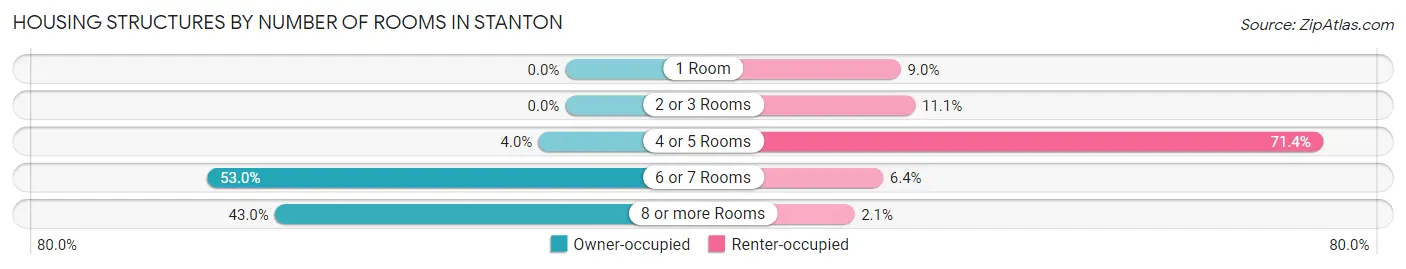
| Number of Rooms | Owner-occupied | Renter-occupied |
| 1 Room | 0 (0.0%) | 17 (9.0%) |
| 2 or 3 Rooms | 0 (0.0%) | 21 (11.1%) |
| 4 or 5 Rooms | 4 (4.0%) | 135 (71.4%) |
| 6 or 7 Rooms | 53 (53.0%) | 12 (6.4%) |
| 8 or more Rooms | 43 (43.0%) | 4 (2.1%) |
| Total | 100 (100.0%) | 189 (100.0%) |
Housing Structure by Heating Type in Stanton
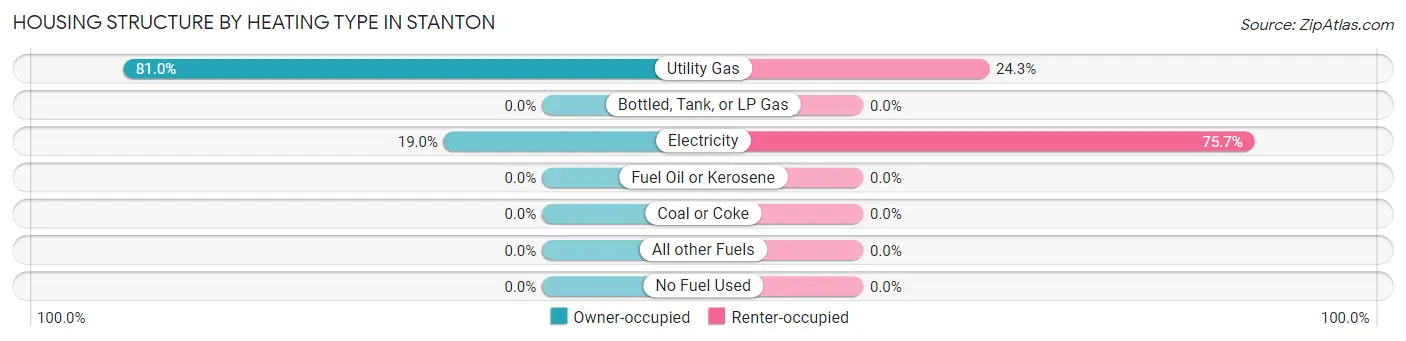
| Heating Type | Owner-occupied | Renter-occupied |
| Utility Gas | 81 (81.0%) | 46 (24.3%) |
| Bottled, Tank, or LP Gas | 0 (0.0%) | 0 (0.0%) |
| Electricity | 19 (19.0%) | 143 (75.7%) |
| Fuel Oil or Kerosene | 0 (0.0%) | 0 (0.0%) |
| Coal or Coke | 0 (0.0%) | 0 (0.0%) |
| All other Fuels | 0 (0.0%) | 0 (0.0%) |
| No Fuel Used | 0 (0.0%) | 0 (0.0%) |
| Total | 100 (100.0%) | 189 (100.0%) |
Household Vehicle Usage in Stanton
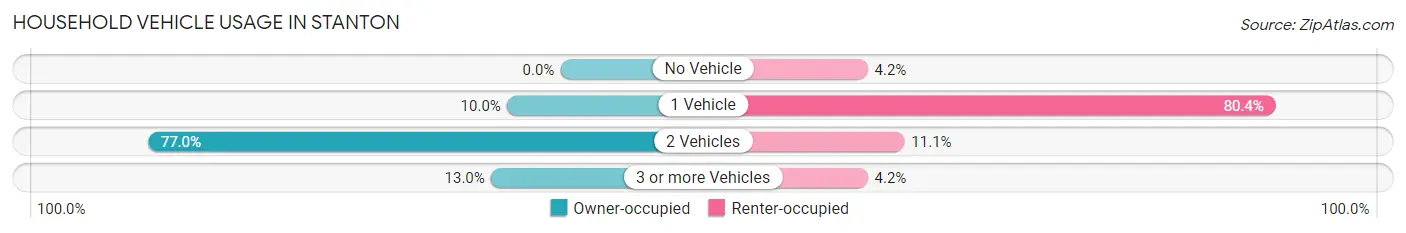
| Vehicles per Household | Owner-occupied | Renter-occupied |
| No Vehicle | 0 (0.0%) | 8 (4.2%) |
| 1 Vehicle | 10 (10.0%) | 152 (80.4%) |
| 2 Vehicles | 77 (77.0%) | 21 (11.1%) |
| 3 or more Vehicles | 13 (13.0%) | 8 (4.2%) |
| Total | 100 (100.0%) | 189 (100.0%) |
Real Estate & Mortgages in Stanton
Real Estate and Mortgage Overview in Stanton
| Characteristic | Without Mortgage | With Mortgage |
| Housing Units | 35 | 65 |
| Median Property Value | $117,000 | $159,400 |
| Median Household Income | - | - |
| Monthly Housing Costs | $456 | $0 |
| Real Estate Taxes | - | - |
Property Value by Mortgage Status in Stanton
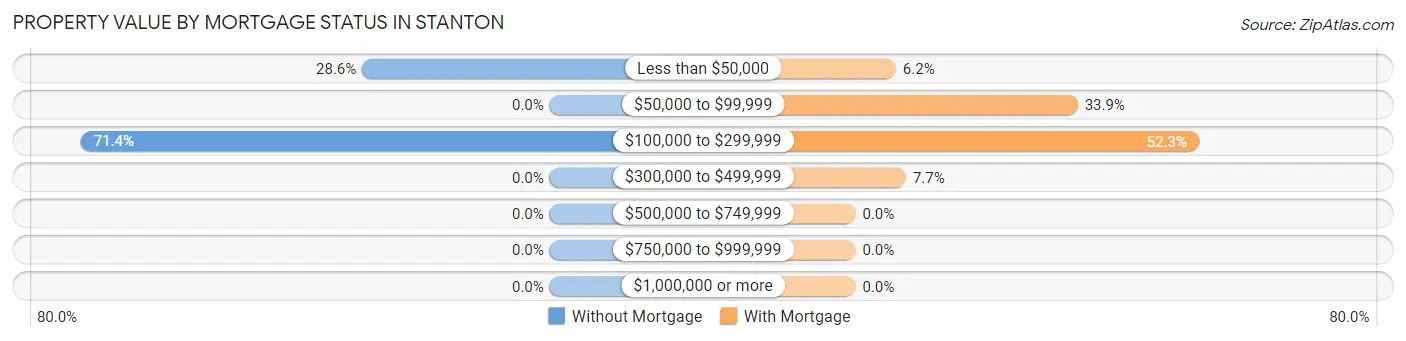
| Property Value | Without Mortgage | With Mortgage |
| Less than $50,000 | 10 (28.6%) | 4 (6.1%) |
| $50,000 to $99,999 | 0 (0.0%) | 22 (33.9%) |
| $100,000 to $299,999 | 25 (71.4%) | 34 (52.3%) |
| $300,000 to $499,999 | 0 (0.0%) | 5 (7.7%) |
| $500,000 to $749,999 | 0 (0.0%) | 0 (0.0%) |
| $750,000 to $999,999 | 0 (0.0%) | 0 (0.0%) |
| $1,000,000 or more | 0 (0.0%) | 0 (0.0%) |
| Total | 35 (100.0%) | 65 (100.0%) |
Household Income by Mortgage Status in Stanton
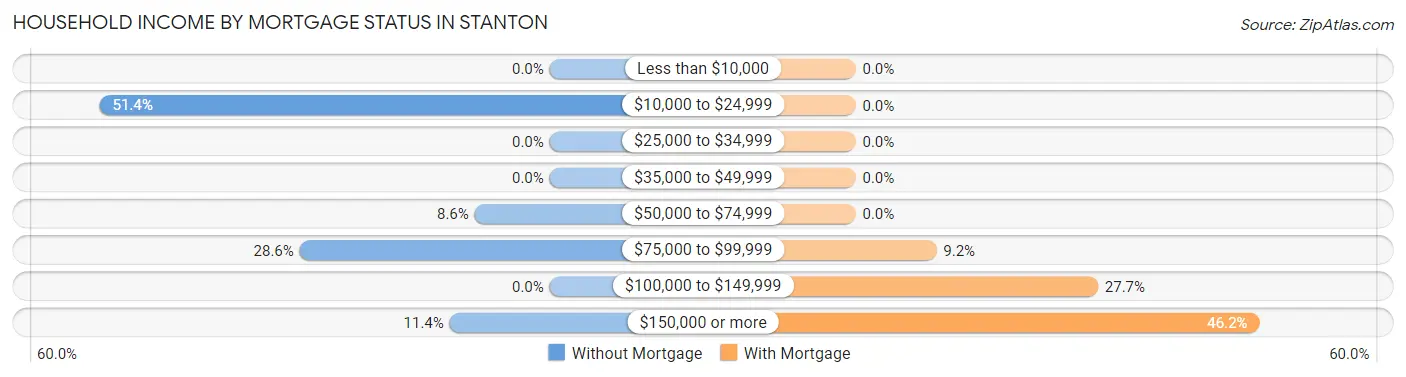
| Household Income | Without Mortgage | With Mortgage |
| Less than $10,000 | 0 (0.0%) | 0 (0.0%) |
| $10,000 to $24,999 | 18 (51.4%) | 0 (0.0%) |
| $25,000 to $34,999 | 0 (0.0%) | 0 (0.0%) |
| $35,000 to $49,999 | 0 (0.0%) | 0 (0.0%) |
| $50,000 to $74,999 | 3 (8.6%) | 0 (0.0%) |
| $75,000 to $99,999 | 10 (28.6%) | 6 (9.2%) |
| $100,000 to $149,999 | 0 (0.0%) | 18 (27.7%) |
| $150,000 or more | 4 (11.4%) | 30 (46.2%) |
| Total | 35 (100.0%) | 65 (100.0%) |
Property Value to Household Income Ratio in Stanton
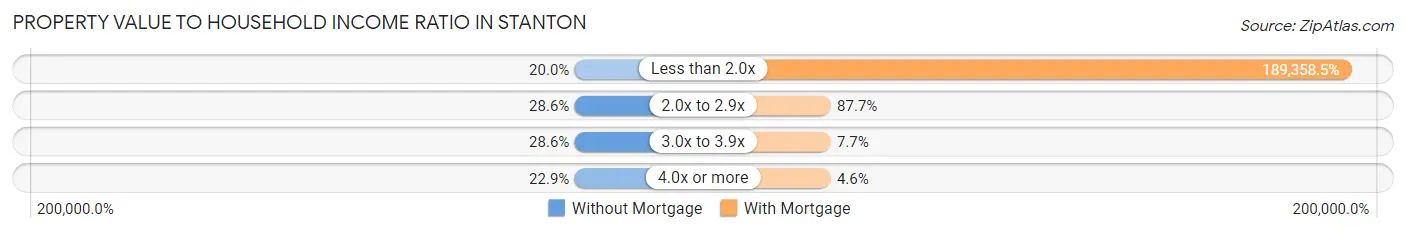
| Value-to-Income Ratio | Without Mortgage | With Mortgage |
| Less than 2.0x | 7 (20.0%) | 123,083 (189,358.5%) |
| 2.0x to 2.9x | 10 (28.6%) | 57 (87.7%) |
| 3.0x to 3.9x | 10 (28.6%) | 5 (7.7%) |
| 4.0x or more | 8 (22.9%) | 3 (4.6%) |
| Total | 35 (100.0%) | 65 (100.0%) |
Real Estate Taxes by Mortgage Status in Stanton
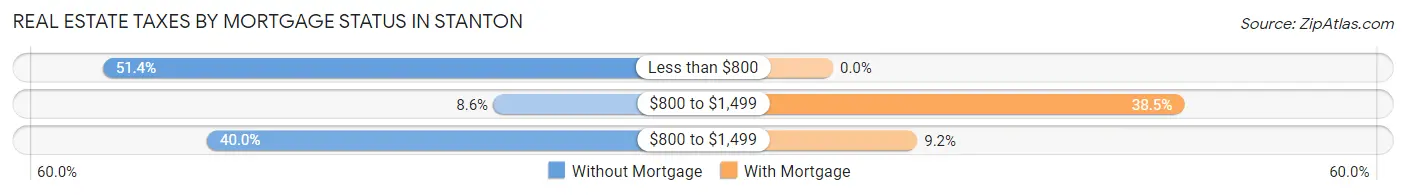
| Property Taxes | Without Mortgage | With Mortgage |
| Less than $800 | 18 (51.4%) | 0 (0.0%) |
| $800 to $1,499 | 3 (8.6%) | 25 (38.5%) |
| $800 to $1,499 | 14 (40.0%) | 6 (9.2%) |
| Total | 35 (100.0%) | 65 (100.0%) |
Health & Disability in Stanton
Health Insurance Coverage by Age in Stanton
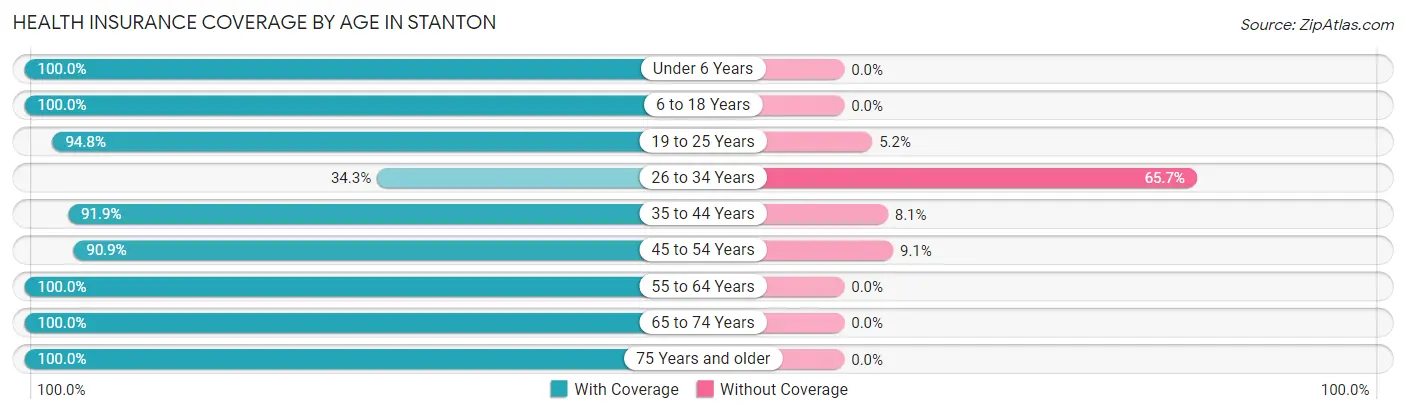
| Age Bracket | With Coverage | Without Coverage |
| Under 6 Years | 33 (100.0%) | 0 (0.0%) |
| 6 to 18 Years | 63 (100.0%) | 0 (0.0%) |
| 19 to 25 Years | 91 (94.8%) | 5 (5.2%) |
| 26 to 34 Years | 12 (34.3%) | 23 (65.7%) |
| 35 to 44 Years | 34 (91.9%) | 3 (8.1%) |
| 45 to 54 Years | 130 (90.9%) | 13 (9.1%) |
| 55 to 64 Years | 116 (100.0%) | 0 (0.0%) |
| 65 to 74 Years | 35 (100.0%) | 0 (0.0%) |
| 75 Years and older | 28 (100.0%) | 0 (0.0%) |
| Total | 542 (92.5%) | 44 (7.5%) |
Health Insurance Coverage by Citizenship Status in Stanton

| Citizenship Status | With Coverage | Without Coverage |
| Native Born | 33 (100.0%) | 0 (0.0%) |
| Foreign Born, Citizen | 63 (100.0%) | 0 (0.0%) |
| Foreign Born, not a Citizen | 91 (94.8%) | 5 (5.2%) |
Health Insurance Coverage by Household Income in Stanton
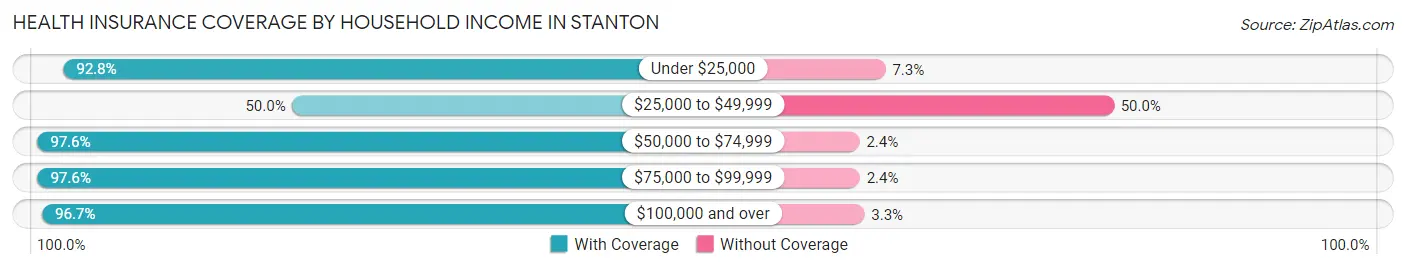
| Household Income | With Coverage | Without Coverage |
| Under $25,000 | 128 (92.7%) | 10 (7.2%) |
| $25,000 to $49,999 | 23 (50.0%) | 23 (50.0%) |
| $50,000 to $74,999 | 123 (97.6%) | 3 (2.4%) |
| $75,000 to $99,999 | 121 (97.6%) | 3 (2.4%) |
| $100,000 and over | 147 (96.7%) | 5 (3.3%) |
Public vs Private Health Insurance Coverage by Age in Stanton
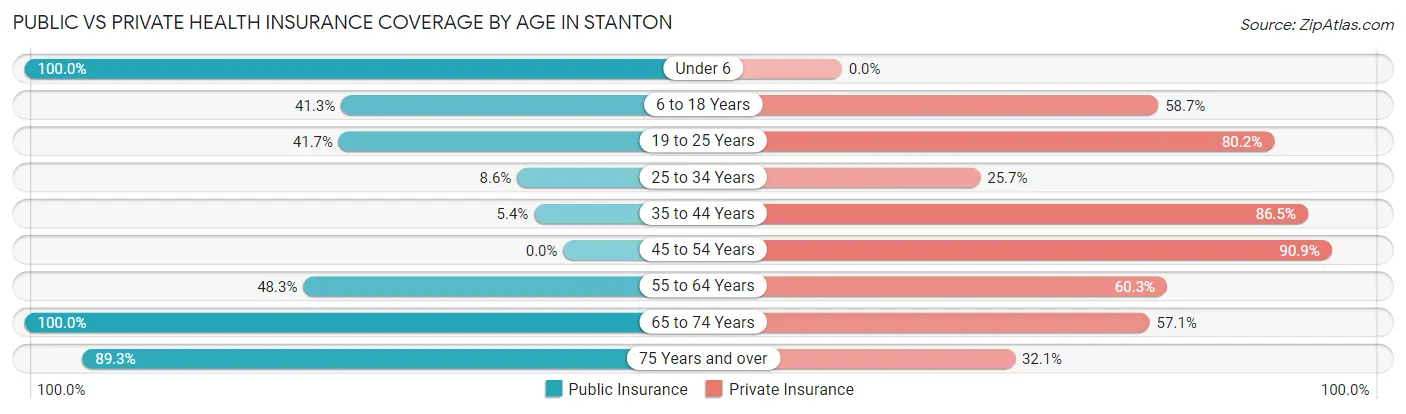
| Age Bracket | Public Insurance | Private Insurance |
| Under 6 | 33 (100.0%) | 0 (0.0%) |
| 6 to 18 Years | 26 (41.3%) | 37 (58.7%) |
| 19 to 25 Years | 40 (41.7%) | 77 (80.2%) |
| 25 to 34 Years | 3 (8.6%) | 9 (25.7%) |
| 35 to 44 Years | 2 (5.4%) | 32 (86.5%) |
| 45 to 54 Years | 0 (0.0%) | 130 (90.9%) |
| 55 to 64 Years | 56 (48.3%) | 70 (60.3%) |
| 65 to 74 Years | 35 (100.0%) | 20 (57.1%) |
| 75 Years and over | 25 (89.3%) | 9 (32.1%) |
| Total | 220 (37.5%) | 384 (65.5%) |
Disability Status by Sex by Age in Stanton
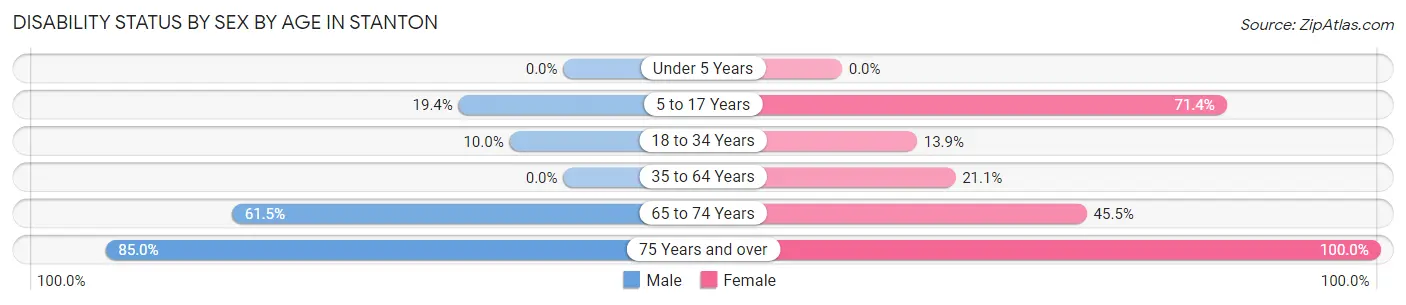
| Age Bracket | Male | Female |
| Under 5 Years | 0 (0.0%) | 0 (0.0%) |
| 5 to 17 Years | 7 (19.4%) | 15 (71.4%) |
| 18 to 34 Years | 6 (10.0%) | 11 (13.9%) |
| 35 to 64 Years | 0 (0.0%) | 44 (21.0%) |
| 65 to 74 Years | 8 (61.5%) | 10 (45.5%) |
| 75 Years and over | 17 (85.0%) | 8 (100.0%) |
Disability Class by Sex by Age in Stanton
Disability Class: Hearing Difficulty
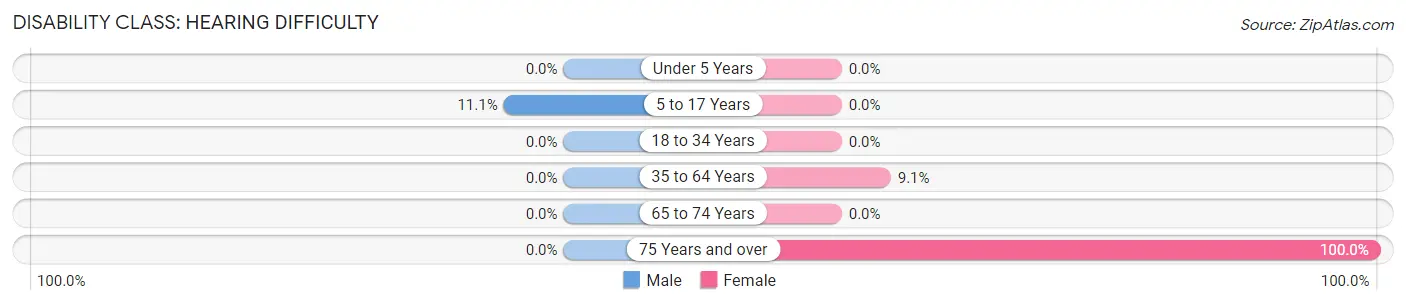
| Age Bracket | Male | Female |
| Under 5 Years | 0 (0.0%) | 0 (0.0%) |
| 5 to 17 Years | 4 (11.1%) | 0 (0.0%) |
| 18 to 34 Years | 0 (0.0%) | 0 (0.0%) |
| 35 to 64 Years | 0 (0.0%) | 19 (9.1%) |
| 65 to 74 Years | 0 (0.0%) | 0 (0.0%) |
| 75 Years and over | 0 (0.0%) | 8 (100.0%) |
Disability Class: Vision Difficulty
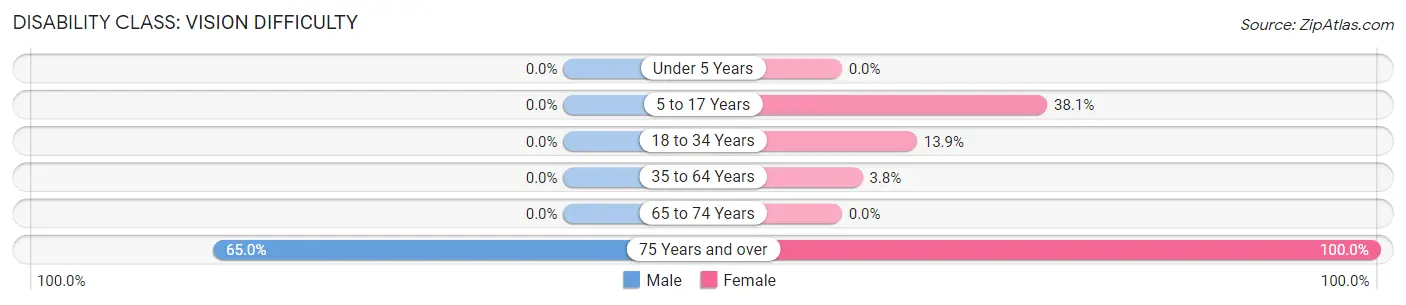
| Age Bracket | Male | Female |
| Under 5 Years | 0 (0.0%) | 0 (0.0%) |
| 5 to 17 Years | 0 (0.0%) | 8 (38.1%) |
| 18 to 34 Years | 0 (0.0%) | 11 (13.9%) |
| 35 to 64 Years | 0 (0.0%) | 8 (3.8%) |
| 65 to 74 Years | 0 (0.0%) | 0 (0.0%) |
| 75 Years and over | 13 (65.0%) | 8 (100.0%) |
Disability Class: Cognitive Difficulty
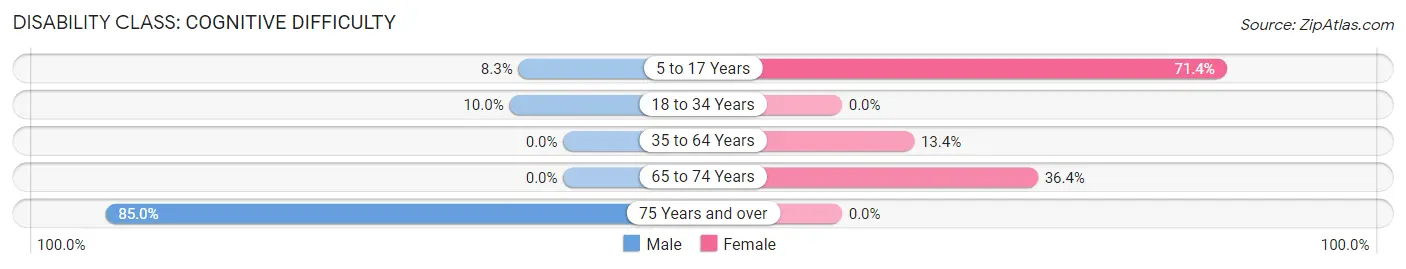
| Age Bracket | Male | Female |
| 5 to 17 Years | 3 (8.3%) | 15 (71.4%) |
| 18 to 34 Years | 6 (10.0%) | 0 (0.0%) |
| 35 to 64 Years | 0 (0.0%) | 28 (13.4%) |
| 65 to 74 Years | 0 (0.0%) | 8 (36.4%) |
| 75 Years and over | 17 (85.0%) | 0 (0.0%) |
Disability Class: Ambulatory Difficulty
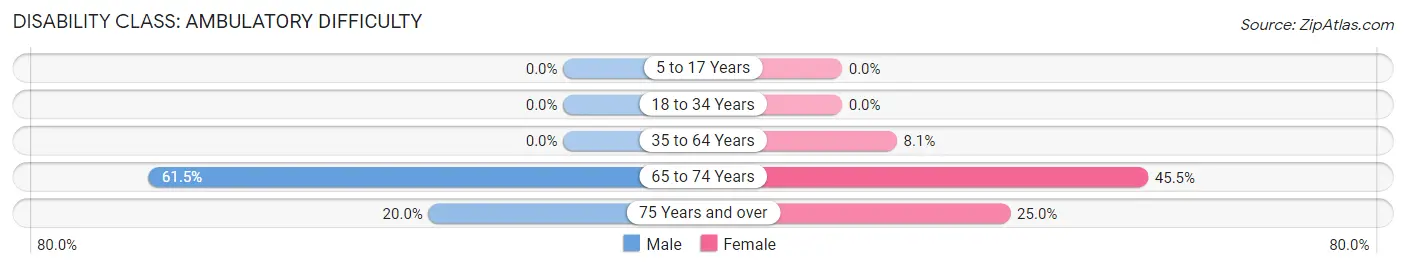
| Age Bracket | Male | Female |
| 5 to 17 Years | 0 (0.0%) | 0 (0.0%) |
| 18 to 34 Years | 0 (0.0%) | 0 (0.0%) |
| 35 to 64 Years | 0 (0.0%) | 17 (8.1%) |
| 65 to 74 Years | 8 (61.5%) | 10 (45.5%) |
| 75 Years and over | 4 (20.0%) | 2 (25.0%) |
Disability Class: Self-Care Difficulty
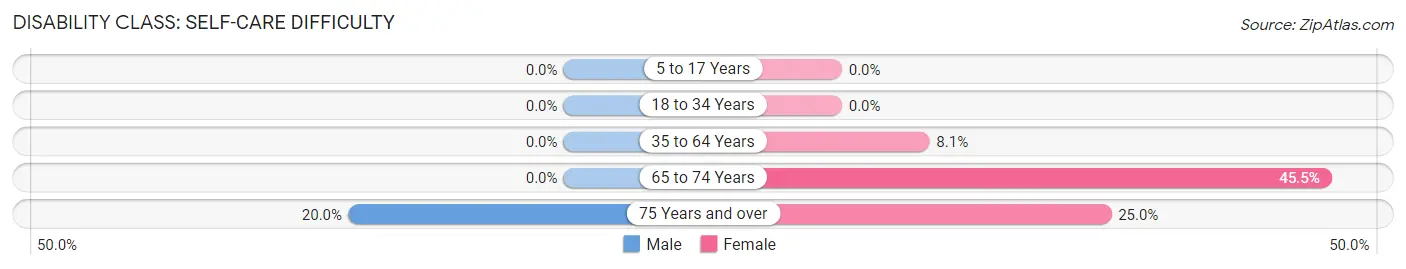
| Age Bracket | Male | Female |
| 5 to 17 Years | 0 (0.0%) | 0 (0.0%) |
| 18 to 34 Years | 0 (0.0%) | 0 (0.0%) |
| 35 to 64 Years | 0 (0.0%) | 17 (8.1%) |
| 65 to 74 Years | 0 (0.0%) | 10 (45.5%) |
| 75 Years and over | 4 (20.0%) | 2 (25.0%) |
Technology Access in Stanton
Computing Device Access in Stanton
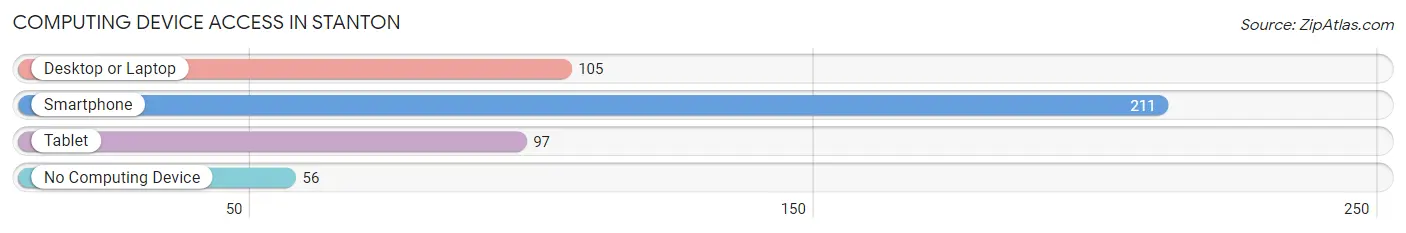
| Device Type | # Households | % Households |
| Desktop or Laptop | 105 | 36.3% |
| Smartphone | 211 | 73.0% |
| Tablet | 97 | 33.6% |
| No Computing Device | 56 | 19.4% |
| Total | 289 | 100.0% |
Internet Access in Stanton
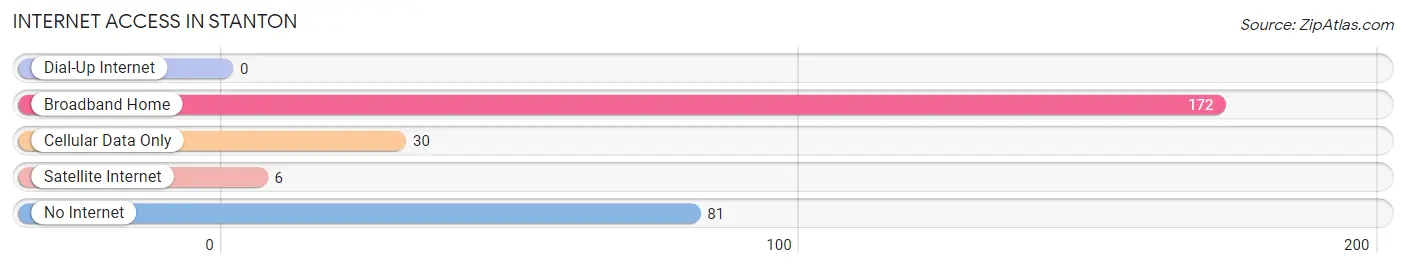
| Internet Type | # Households | % Households |
| Dial-Up Internet | 0 | 0.0% |
| Broadband Home | 172 | 59.5% |
| Cellular Data Only | 30 | 10.4% |
| Satellite Internet | 6 | 2.1% |
| No Internet | 81 | 28.0% |
| Total | 289 | 100.0% |
Stanton Summary
Stanton is a small town located in the state of Tennessee, in the United States of America. It is situated in the eastern part of the state, in the foothills of the Appalachian Mountains. The town is located in the county of Haywood, and is part of the Jackson metropolitan area. The population of Stanton was estimated to be 1,845 in the year 2020.
History
Stanton was founded in 1820 by a group of settlers from North Carolina. The town was named after the first settler, William Stanton. The town was originally a farming community, and the main crops grown were corn, wheat, and cotton. The town was also known for its production of whiskey, which was made from the local corn and wheat.
In the late 19th century, Stanton began to experience a period of growth and development. The town was connected to the railroad in 1887, and this allowed for the transportation of goods and people to and from the town. The railroad also allowed for the development of the local economy, as it allowed for the transportation of goods to other parts of the state and country.
In the early 20th century, Stanton experienced a period of decline. The town was hit hard by the Great Depression, and many of the businesses in the town closed. The town was also affected by the Dust Bowl, which caused a severe drought in the area.
Geography
Stanton is located in the eastern part of the state of Tennessee, in the foothills of the Appalachian Mountains. The town is situated in the county of Haywood, and is part of the Jackson metropolitan area. The town is located at an elevation of 845 feet above sea level.
The town is located in a rural area, and is surrounded by rolling hills and forests. The town is located near the Hatchie River, which is a tributary of the Mississippi River. The town is also located near the Natchez Trace Parkway, which is a scenic highway that runs through the state of Tennessee.
Economy
The economy of Stanton is largely based on agriculture. The town is home to several farms, which produce a variety of crops, including corn, wheat, and cotton. The town is also home to several small businesses, including restaurants, stores, and other services.
The town is also home to several manufacturing companies, which produce a variety of products, including furniture, clothing, and other items. The town is also home to several transportation companies, which provide transportation services to the surrounding area.
Demographics
The population of Stanton was estimated to be 1,845 in the year 2020. The town has a population that is predominantly white, with a small percentage of African Americans and other minorities. The median age of the population is 44.7 years, and the median household income is $37,945. The town has a poverty rate of 17.3%, which is higher than the national average.
Conclusion
Stanton is a small town located in the state of Tennessee, in the United States of America. The town has a long history, and was founded in 1820 by a group of settlers from North Carolina. The town is located in the eastern part of the state, in the foothills of the Appalachian Mountains. The economy of Stanton is largely based on agriculture, and the town is home to several small businesses. The population of Stanton was estimated to be 1,845 in the year 2020, and the town has a population that is predominantly white.
Common Questions
What is Per Capita Income in Stanton?
Per Capita income in Stanton is $48,509.
What is the Median Family Income in Stanton?
Median Family Income in Stanton is $92,656.
What is the Median Household income in Stanton?
Median Household Income in Stanton is $55,817.
What is Inequality or Gini Index in Stanton?
Inequality or Gini Index in Stanton is 0.65.
What is the Total Population of Stanton?
Total Population of Stanton is 586.
What is the Total Male Population of Stanton?
Total Male Population of Stanton is 247.
What is the Total Female Population of Stanton?
Total Female Population of Stanton is 339.
What is the Ratio of Males per 100 Females in Stanton?
There are 72.86 Males per 100 Females in Stanton.
What is the Ratio of Females per 100 Males in Stanton?
There are 137.25 Females per 100 Males in Stanton.
What is the Median Population Age in Stanton?
Median Population Age in Stanton is 45.4 Years.
What is the Average Family Size in Stanton
Average Family Size in Stanton is 3.0 People.
What is the Average Household Size in Stanton
Average Household Size in Stanton is 2.0 People.
How Large is the Labor Force in Stanton?
There are 341 People in the Labor Forcein in Stanton.
What is the Percentage of People in the Labor Force in Stanton?
67.3% of People are in the Labor Force in Stanton.
What is the Unemployment Rate in Stanton?
Unemployment Rate in Stanton is 6.5%.