Mason, TN Map & Demographics
Mason Map
Mason Overview
$19,294
PER CAPITA INCOME
$47,639
AVG FAMILY INCOME
$37,000
AVG HOUSEHOLD INCOME
30.8%
WAGE / INCOME GAP [ % ]
69.2¢/ $1
WAGE / INCOME GAP [ $ ]
0.49
INEQUALITY / GINI INDEX
1,221
TOTAL POPULATION
656
MALE POPULATION
565
FEMALE POPULATION
116.11
MALES / 100 FEMALES
86.13
FEMALES / 100 MALES
36.7
MEDIAN AGE
2.9
AVG FAMILY SIZE
2.7
AVG HOUSEHOLD SIZE
404
LABOR FORCE [ PEOPLE ]
39.4%
PERCENT IN LABOR FORCE
12.1%
UNEMPLOYMENT RATE
Mason Zip Codes
Mason Area Codes
Income in Mason
Income Overview in Mason
Per Capita Income in Mason is $19,294, while median incomes of families and households are $47,639 and $37,000 respectively.
| Characteristic | Number | Measure |
| Per Capita Income | 1,221 | $19,294 |
| Median Family Income | 269 | $47,639 |
| Mean Family Income | 269 | $68,321 |
| Median Household Income | 332 | $37,000 |
| Mean Household Income | 332 | $58,941 |
| Income Deficit | 269 | $0 |
| Wage / Income Gap (%) | 1,221 | 30.76% |
| Wage / Income Gap ($) | 1,221 | 69.24¢ per $1 |
| Gini / Inequality Index | 1,221 | 0.49 |
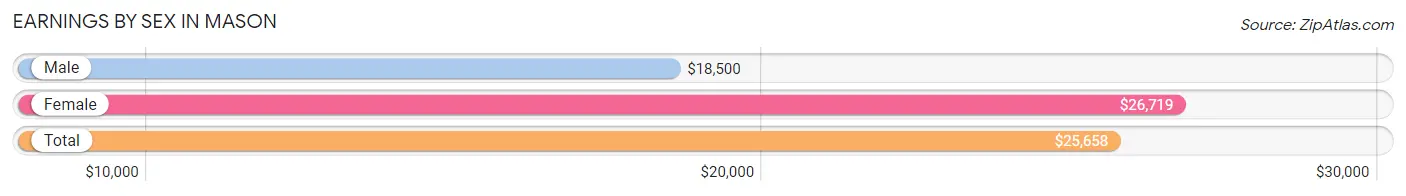
Earnings by Sex in Mason
Average Earnings in Mason are $25,658, $18,500 for men and $26,719 for women, a difference of 30.8%.
| Sex | Number | Average Earnings |
| Male | 318 (57.8%) | $18,500 |
| Female | 232 (42.2%) | $26,719 |
| Total | 550 (100.0%) | $25,658 |
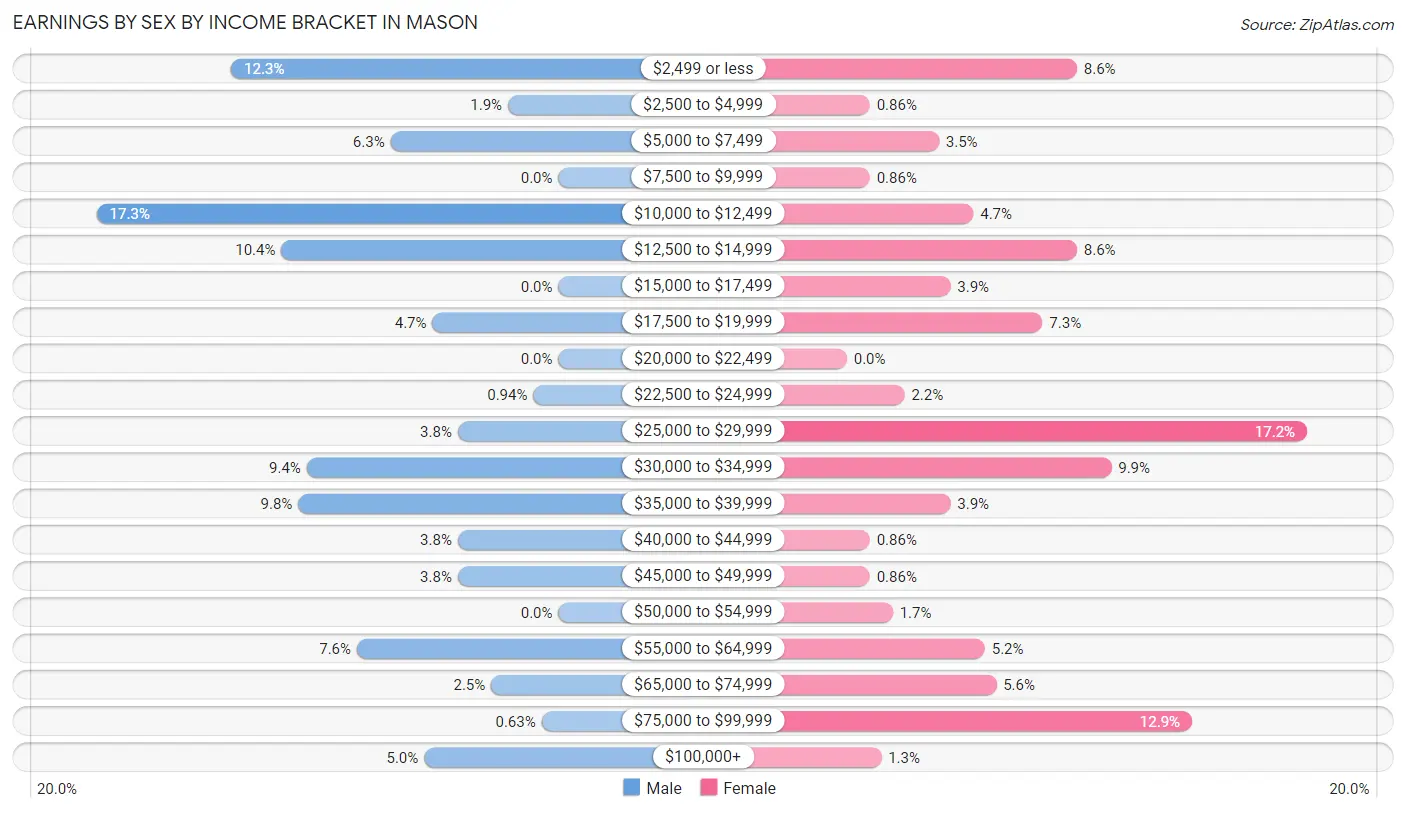
Earnings by Sex by Income Bracket in Mason
The most common earnings brackets in Mason are $10,000 to $12,499 for men (55 | 17.3%) and $25,000 to $29,999 for women (40 | 17.2%).
| Income | Male | Female |
| $2,499 or less | 39 (12.3%) | 20 (8.6%) |
| $2,500 to $4,999 | 6 (1.9%) | 2 (0.9%) |
| $5,000 to $7,499 | 20 (6.3%) | 8 (3.5%) |
| $7,500 to $9,999 | 0 (0.0%) | 2 (0.9%) |
| $10,000 to $12,499 | 55 (17.3%) | 11 (4.7%) |
| $12,500 to $14,999 | 33 (10.4%) | 20 (8.6%) |
| $15,000 to $17,499 | 0 (0.0%) | 9 (3.9%) |
| $17,500 to $19,999 | 15 (4.7%) | 17 (7.3%) |
| $20,000 to $22,499 | 0 (0.0%) | 0 (0.0%) |
| $22,500 to $24,999 | 3 (0.9%) | 5 (2.2%) |
| $25,000 to $29,999 | 12 (3.8%) | 40 (17.2%) |
| $30,000 to $34,999 | 30 (9.4%) | 23 (9.9%) |
| $35,000 to $39,999 | 31 (9.8%) | 9 (3.9%) |
| $40,000 to $44,999 | 12 (3.8%) | 2 (0.9%) |
| $45,000 to $49,999 | 12 (3.8%) | 2 (0.9%) |
| $50,000 to $54,999 | 0 (0.0%) | 4 (1.7%) |
| $55,000 to $64,999 | 24 (7.5%) | 12 (5.2%) |
| $65,000 to $74,999 | 8 (2.5%) | 13 (5.6%) |
| $75,000 to $99,999 | 2 (0.6%) | 30 (12.9%) |
| $100,000+ | 16 (5.0%) | 3 (1.3%) |
| Total | 318 (100.0%) | 232 (100.0%) |
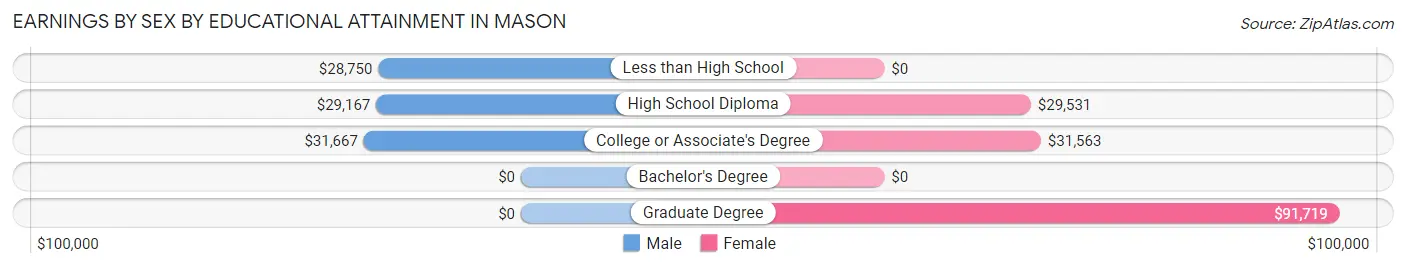
Earnings by Sex by Educational Attainment in Mason
Average earnings in Mason are $30,729 for men and $32,188 for women, a difference of 4.5%. Men with an educational attainment of college or associate's degree enjoy the highest average annual earnings of $31,667, while those with less than high school education earn the least with $28,750. Women with an educational attainment of graduate degree earn the most with the average annual earnings of $91,719, while those with high school diploma education have the smallest earnings of $29,531.
| Educational Attainment | Male Income | Female Income |
| Less than High School | $28,750 | $0 |
| High School Diploma | $29,167 | $29,531 |
| College or Associate's Degree | $31,667 | $31,563 |
| Bachelor's Degree | - | - |
| Graduate Degree | - | - |
| Total | $30,729 | $32,188 |
Family Income in Mason
Family Income Brackets in Mason
According to the Mason family income data, there are 48 families falling into the $35,000 to $49,999 income range, which is the most common income bracket and makes up 17.8% of all families. Conversely, the $200,000+ income bracket is the least frequent group with only 8 families (3.0%) belonging to this category.
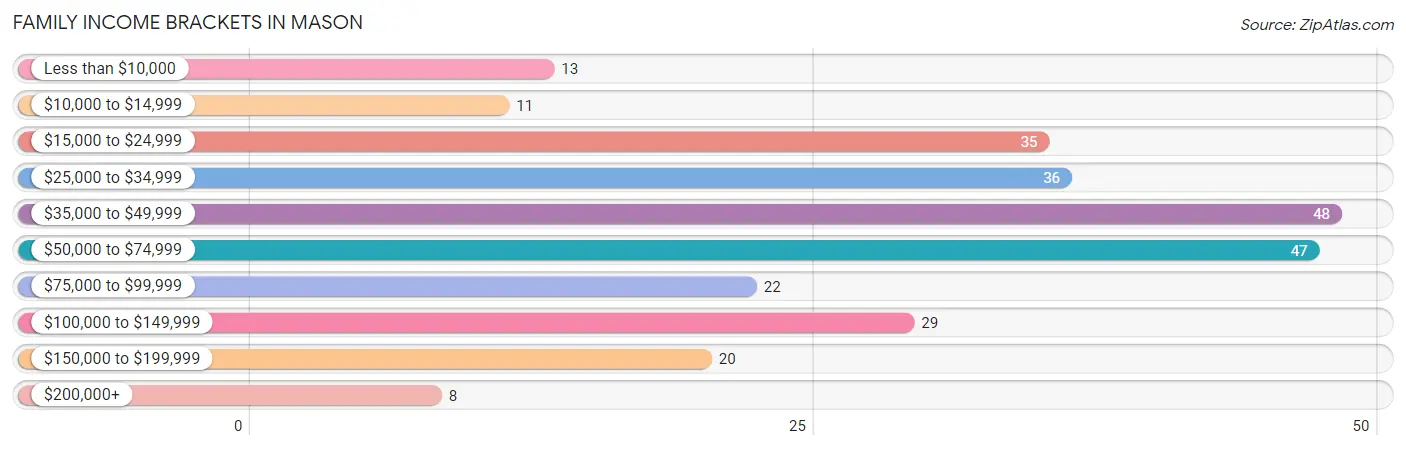
| Income Bracket | # Families | % Families |
| Less than $10,000 | 13 | 4.8% |
| $10,000 to $14,999 | 11 | 4.1% |
| $15,000 to $24,999 | 35 | 13.0% |
| $25,000 to $34,999 | 36 | 13.4% |
| $35,000 to $49,999 | 48 | 17.8% |
| $50,000 to $74,999 | 47 | 17.5% |
| $75,000 to $99,999 | 22 | 8.2% |
| $100,000 to $149,999 | 29 | 10.8% |
| $150,000 to $199,999 | 20 | 7.4% |
| $200,000+ | 8 | 3.0% |
Family Income by Famaliy Size in Mason
3-person families (88 | 32.7%) account for the highest median family income in Mason with $55,000 per family, while 2-person families (134 | 49.8%) have the highest median income of $24,166 per family member.
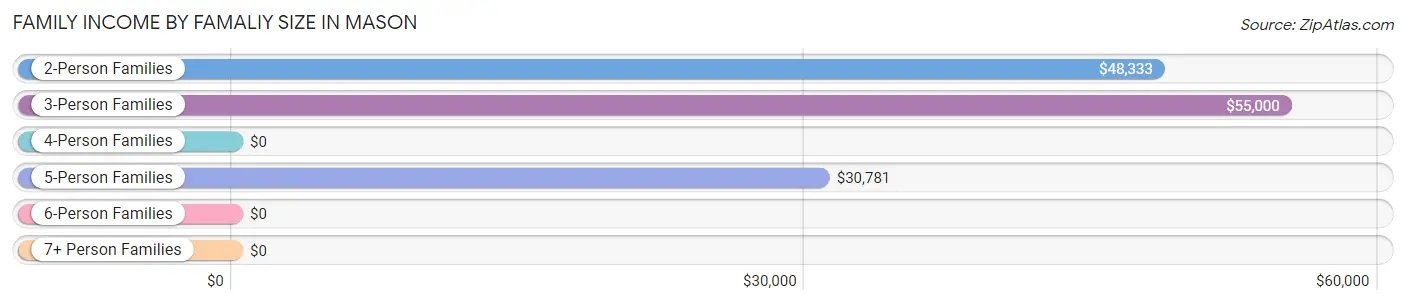
| Income Bracket | # Families | Median Income |
| 2-Person Families | 134 (49.8%) | $48,333 |
| 3-Person Families | 88 (32.7%) | $55,000 |
| 4-Person Families | 19 (7.1%) | $0 |
| 5-Person Families | 21 (7.8%) | $30,781 |
| 6-Person Families | 7 (2.6%) | $0 |
| 7+ Person Families | 0 (0.0%) | $0 |
| Total | 269 (100.0%) | $47,639 |
Family Income by Number of Earners in Mason
The median family income in Mason is $47,639, with families comprising 3+ earners (24) having the highest median family income of $123,000, while families with no earners (68) have the lowest median family income of $23,542, accounting for 8.9% and 25.3% of families, respectively.
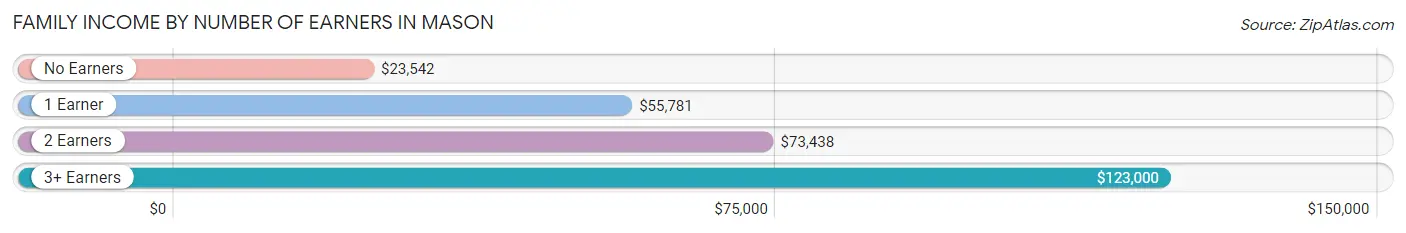
| Number of Earners | # Families | Median Income |
| No Earners | 68 (25.3%) | $23,542 |
| 1 Earner | 83 (30.9%) | $55,781 |
| 2 Earners | 94 (34.9%) | $73,438 |
| 3+ Earners | 24 (8.9%) | $123,000 |
| Total | 269 (100.0%) | $47,639 |
Household Income in Mason
Household Income Brackets in Mason
With 53 households falling in the category, the $25,000 to $34,999 income range is the most frequent in Mason, accounting for 16.0% of all households. In contrast, only 8 households (2.4%) fall into the $200,000+ income bracket, making it the least populous group.
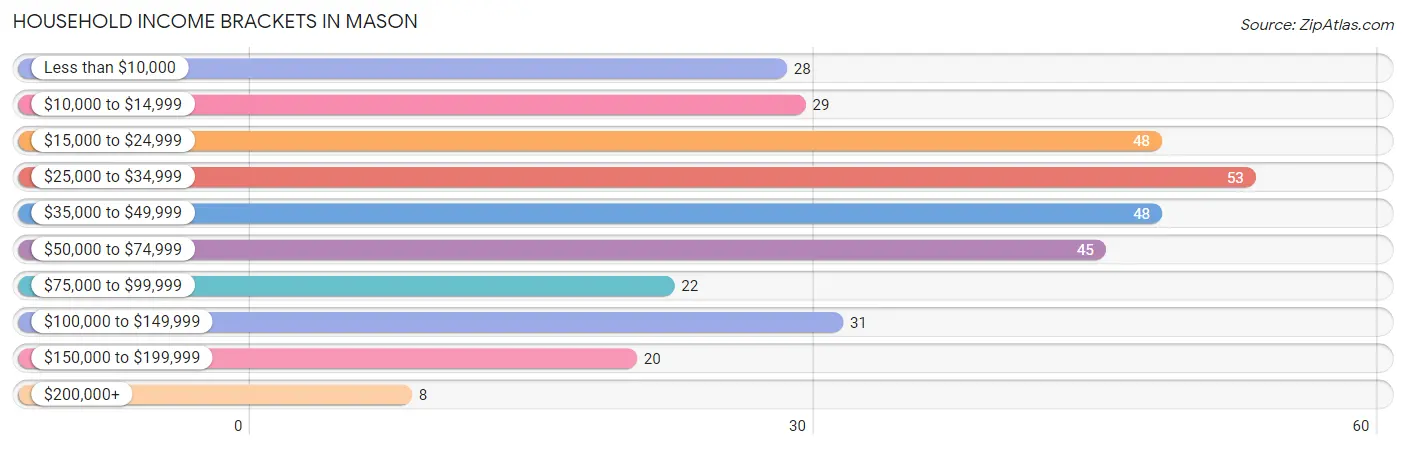
| Income Bracket | # Households | % Households |
| Less than $10,000 | 28 | 8.4% |
| $10,000 to $14,999 | 29 | 8.7% |
| $15,000 to $24,999 | 48 | 14.5% |
| $25,000 to $34,999 | 53 | 16.0% |
| $35,000 to $49,999 | 48 | 14.5% |
| $50,000 to $74,999 | 45 | 13.6% |
| $75,000 to $99,999 | 22 | 6.6% |
| $100,000 to $149,999 | 31 | 9.3% |
| $150,000 to $199,999 | 20 | 6.0% |
| $200,000+ | 8 | 2.4% |
Household Income by Householder Age in Mason
The median household income in Mason is $37,000, with the highest median household income of $48,750 found in the 45 to 64 years age bracket for the primary householder. A total of 129 households (38.9%) fall into this category. Meanwhile, the 65+ years age bracket for the primary householder has the lowest median household income of $0, with 74 households (22.3%) in this group.
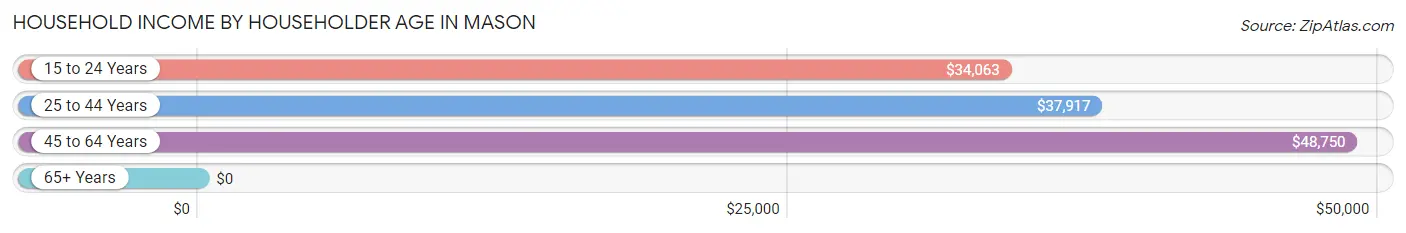
| Income Bracket | # Households | Median Income |
| 15 to 24 Years | 26 (7.8%) | $34,063 |
| 25 to 44 Years | 103 (31.0%) | $37,917 |
| 45 to 64 Years | 129 (38.9%) | $48,750 |
| 65+ Years | 74 (22.3%) | $0 |
| Total | 332 (100.0%) | $37,000 |
Poverty in Mason
Income Below Poverty by Sex and Age in Mason
With 22.3% poverty level for males and 27.2% for females among the residents of Mason, 5 year old males and 6 to 11 year old females are the most vulnerable to poverty, with 7 males (100.0%) and 21 females (60.0%) in their respective age groups living below the poverty level.
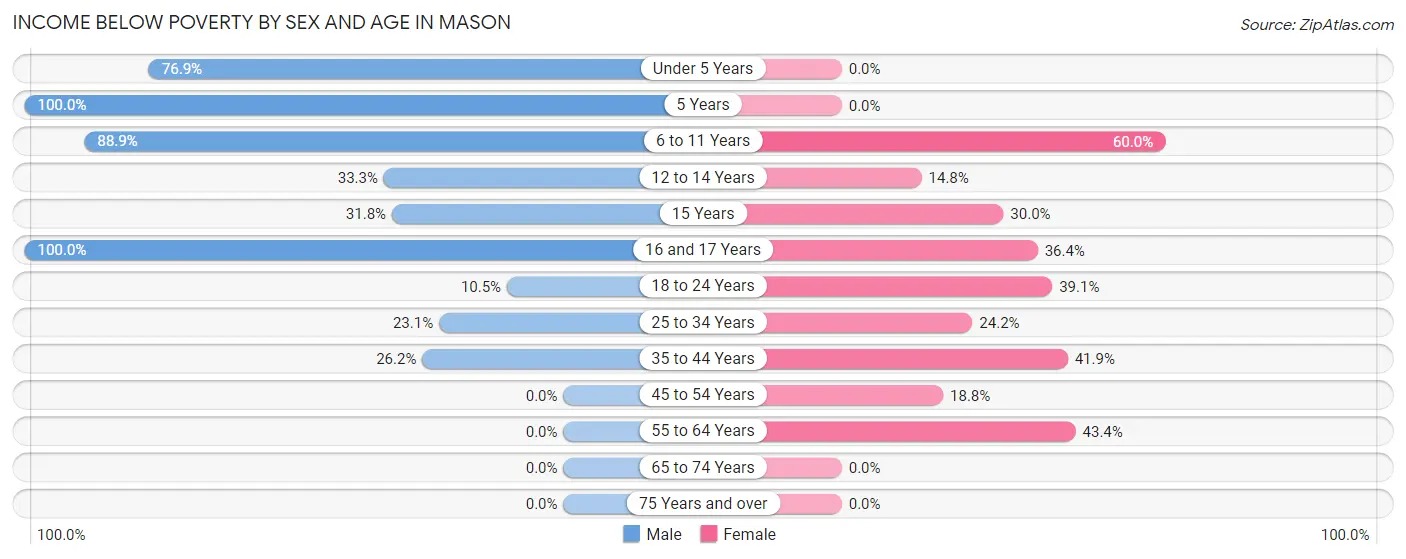
| Age Bracket | Male | Female |
| Under 5 Years | 20 (76.9%) | 0 (0.0%) |
| 5 Years | 7 (100.0%) | 0 (0.0%) |
| 6 to 11 Years | 16 (88.9%) | 21 (60.0%) |
| 12 to 14 Years | 8 (33.3%) | 4 (14.8%) |
| 15 Years | 7 (31.8%) | 3 (30.0%) |
| 16 and 17 Years | 2 (100.0%) | 4 (36.4%) |
| 18 to 24 Years | 9 (10.5%) | 25 (39.1%) |
| 25 to 34 Years | 9 (23.1%) | 8 (24.2%) |
| 35 to 44 Years | 11 (26.2%) | 26 (41.9%) |
| 45 to 54 Years | 0 (0.0%) | 19 (18.8%) |
| 55 to 64 Years | 0 (0.0%) | 23 (43.4%) |
| 65 to 74 Years | 0 (0.0%) | 0 (0.0%) |
| 75 Years and over | 0 (0.0%) | 0 (0.0%) |
| Total | 89 (22.3%) | 133 (27.2%) |
Income Above Poverty by Sex and Age in Mason
According to the poverty statistics in Mason, males aged 45 to 54 years and females aged under 5 years are the age groups that are most secure financially, with 100.0% of males and 100.0% of females in these age groups living above the poverty line.
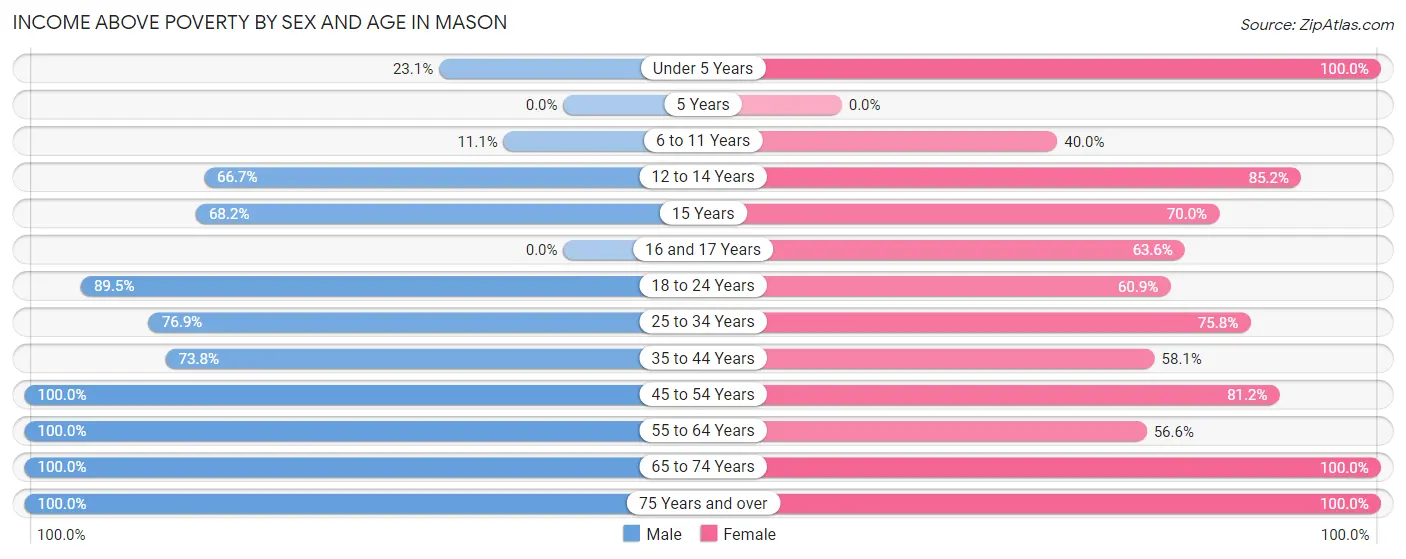
| Age Bracket | Male | Female |
| Under 5 Years | 6 (23.1%) | 18 (100.0%) |
| 5 Years | 0 (0.0%) | 0 (0.0%) |
| 6 to 11 Years | 2 (11.1%) | 14 (40.0%) |
| 12 to 14 Years | 16 (66.7%) | 23 (85.2%) |
| 15 Years | 15 (68.2%) | 7 (70.0%) |
| 16 and 17 Years | 0 (0.0%) | 7 (63.6%) |
| 18 to 24 Years | 77 (89.5%) | 39 (60.9%) |
| 25 to 34 Years | 30 (76.9%) | 25 (75.8%) |
| 35 to 44 Years | 31 (73.8%) | 36 (58.1%) |
| 45 to 54 Years | 55 (100.0%) | 82 (81.2%) |
| 55 to 64 Years | 48 (100.0%) | 30 (56.6%) |
| 65 to 74 Years | 28 (100.0%) | 42 (100.0%) |
| 75 Years and over | 2 (100.0%) | 33 (100.0%) |
| Total | 310 (77.7%) | 356 (72.8%) |
Income Below Poverty Among Married-Couple Families in Mason
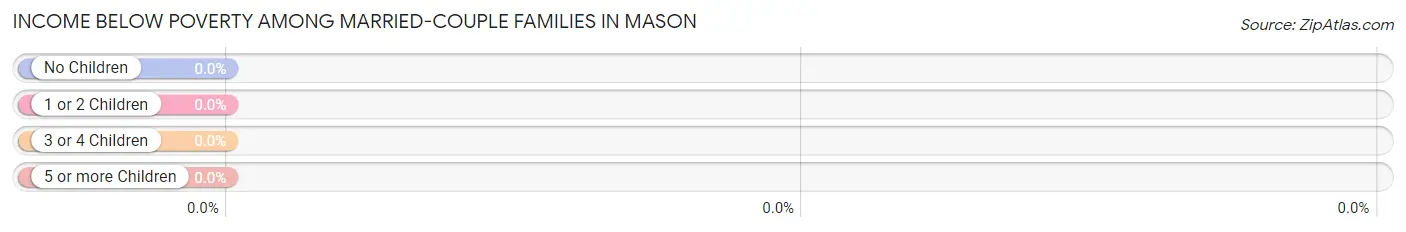
| Children | Above Poverty | Below Poverty |
| No Children | 89 (100.0%) | 0 (0.0%) |
| 1 or 2 Children | 14 (100.0%) | 0 (0.0%) |
| 3 or 4 Children | 3 (100.0%) | 0 (0.0%) |
| 5 or more Children | 0 (0.0%) | 0 (0.0%) |
| Total | 106 (100.0%) | 0 (0.0%) |
Income Below Poverty Among Single-Parent Households in Mason
According to the poverty data in Mason, 34.4% or 11 single-father households and 25.2% or 33 single-mother households are living below the poverty line. Among single-father households, those with 1 or 2 children have the highest poverty rate, with 11 households (73.3%) experiencing poverty. Likewise, among single-mother households, those with 3 or 4 children have the highest poverty rate, with 16 households (84.2%) falling below the poverty line.
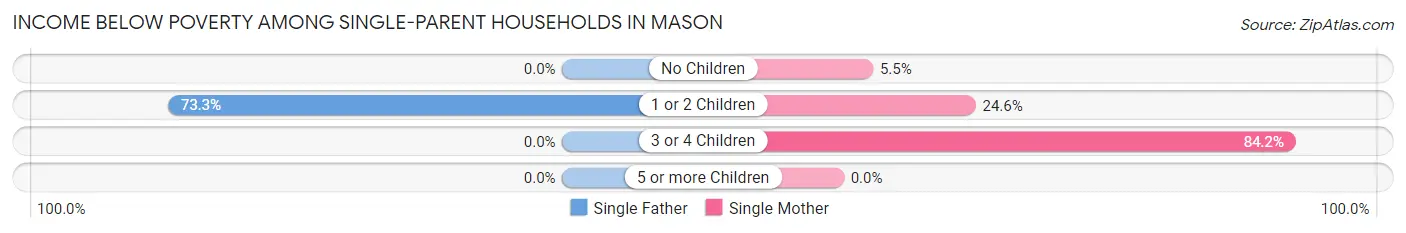
| Children | Single Father | Single Mother |
| No Children | 0 (0.0%) | 3 (5.4%) |
| 1 or 2 Children | 11 (73.3%) | 14 (24.6%) |
| 3 or 4 Children | 0 (0.0%) | 16 (84.2%) |
| 5 or more Children | 0 (0.0%) | 0 (0.0%) |
| Total | 11 (34.4%) | 33 (25.2%) |
Income Below Poverty Among Married-Couple vs Single-Parent Households in Mason
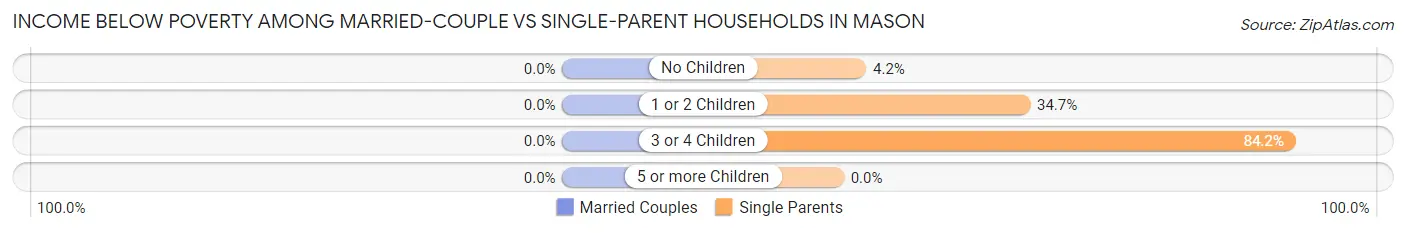
| Children | Married-Couple Families | Single-Parent Households |
| No Children | 0 (0.0%) | 3 (4.2%) |
| 1 or 2 Children | 0 (0.0%) | 25 (34.7%) |
| 3 or 4 Children | 0 (0.0%) | 16 (84.2%) |
| 5 or more Children | 0 (0.0%) | 0 (0.0%) |
| Total | 0 (0.0%) | 44 (27.0%) |
Race in Mason
The most populous races in Mason are Black / African American (861 | 70.5%), White / Caucasian (300 | 24.6%), and Two or more Races (40 | 3.3%).
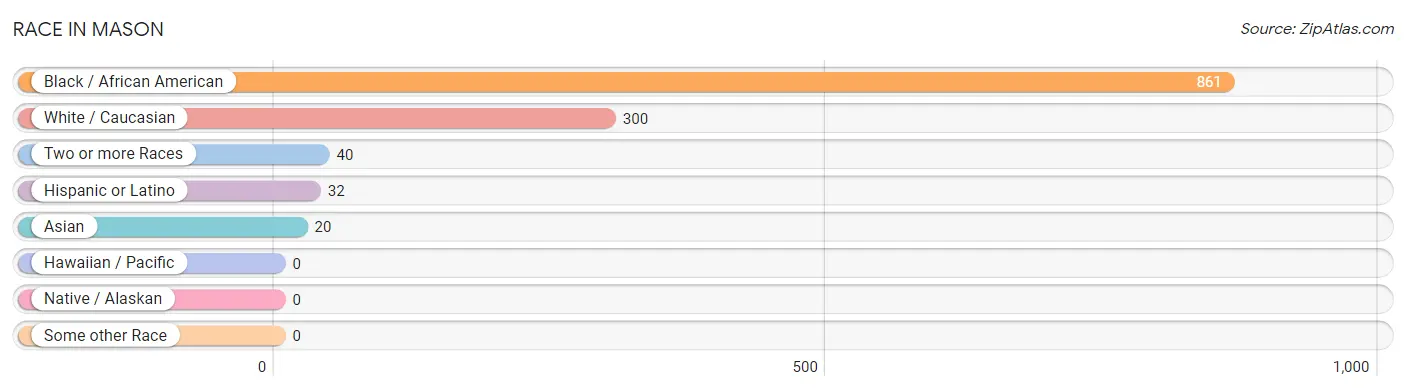
| Race | # Population | % Population |
| Asian | 20 | 1.6% |
| Black / African American | 861 | 70.5% |
| Hawaiian / Pacific | 0 | 0.0% |
| Hispanic or Latino | 32 | 2.6% |
| Native / Alaskan | 0 | 0.0% |
| White / Caucasian | 300 | 24.6% |
| Two or more Races | 40 | 3.3% |
| Some other Race | 0 | 0.0% |
| Total | 1,221 | 100.0% |
Ancestry in Mason
The most populous ancestries reported in Mason are American (86 | 7.0%), Irish (73 | 6.0%), English (58 | 4.8%), German (52 | 4.3%), and Mexican (22 | 1.8%), together accounting for 23.8% of all Mason residents.
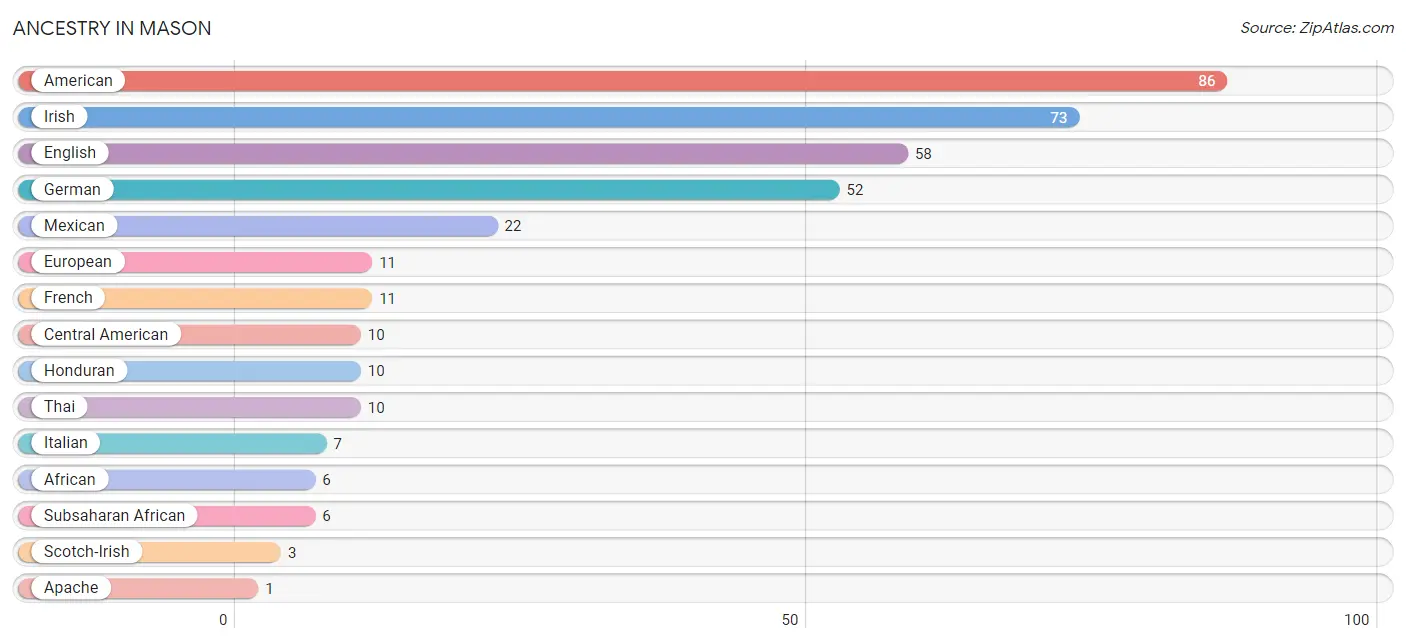
| Ancestry | # Population | % Population |
| African | 6 | 0.5% |
| American | 86 | 7.0% |
| Apache | 1 | 0.1% |
| Central American | 10 | 0.8% |
| English | 58 | 4.8% |
| European | 11 | 0.9% |
| French | 11 | 0.9% |
| German | 52 | 4.3% |
| Honduran | 10 | 0.8% |
| Irish | 73 | 6.0% |
| Italian | 7 | 0.6% |
| Mexican | 22 | 1.8% |
| Scotch-Irish | 3 | 0.3% |
| Subsaharan African | 6 | 0.5% |
| Thai | 10 | 0.8% | View All 15 Rows |
Immigrants in Mason
The most numerous immigrant groups reported in Mason came from Central America (32 | 2.6%), Latin America (32 | 2.6%), Mexico (22 | 1.8%), Asia (10 | 0.8%), and Honduras (10 | 0.8%), together accounting for 8.7% of all Mason residents.
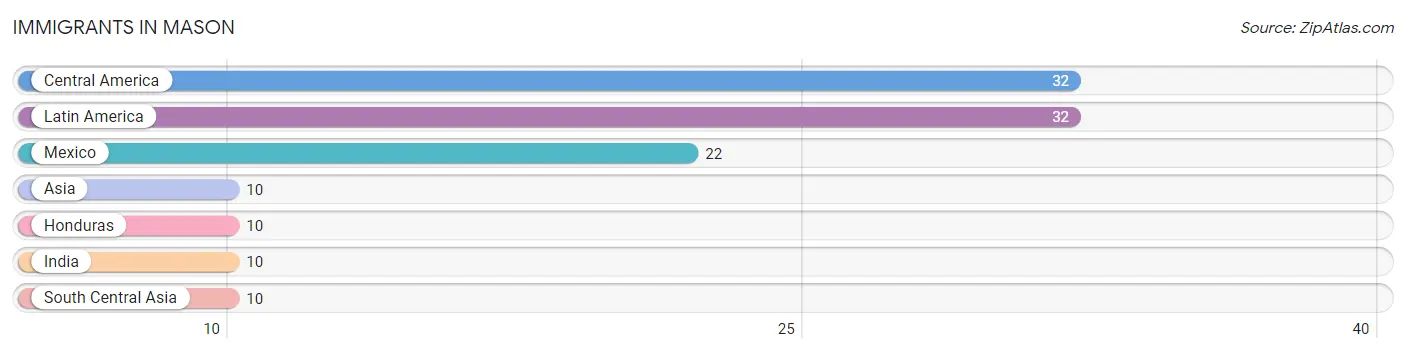
| Immigration Origin | # Population | % Population |
| Asia | 10 | 0.8% |
| Central America | 32 | 2.6% |
| Honduras | 10 | 0.8% |
| India | 10 | 0.8% |
| Latin America | 32 | 2.6% |
| Mexico | 22 | 1.8% |
| South Central Asia | 10 | 0.8% | View All 7 Rows |
Sex and Age in Mason
Sex and Age in Mason
The most populous age groups in Mason are 20 to 24 Years (101 | 15.4%) for men and 20 to 24 Years (71 | 12.6%) for women.
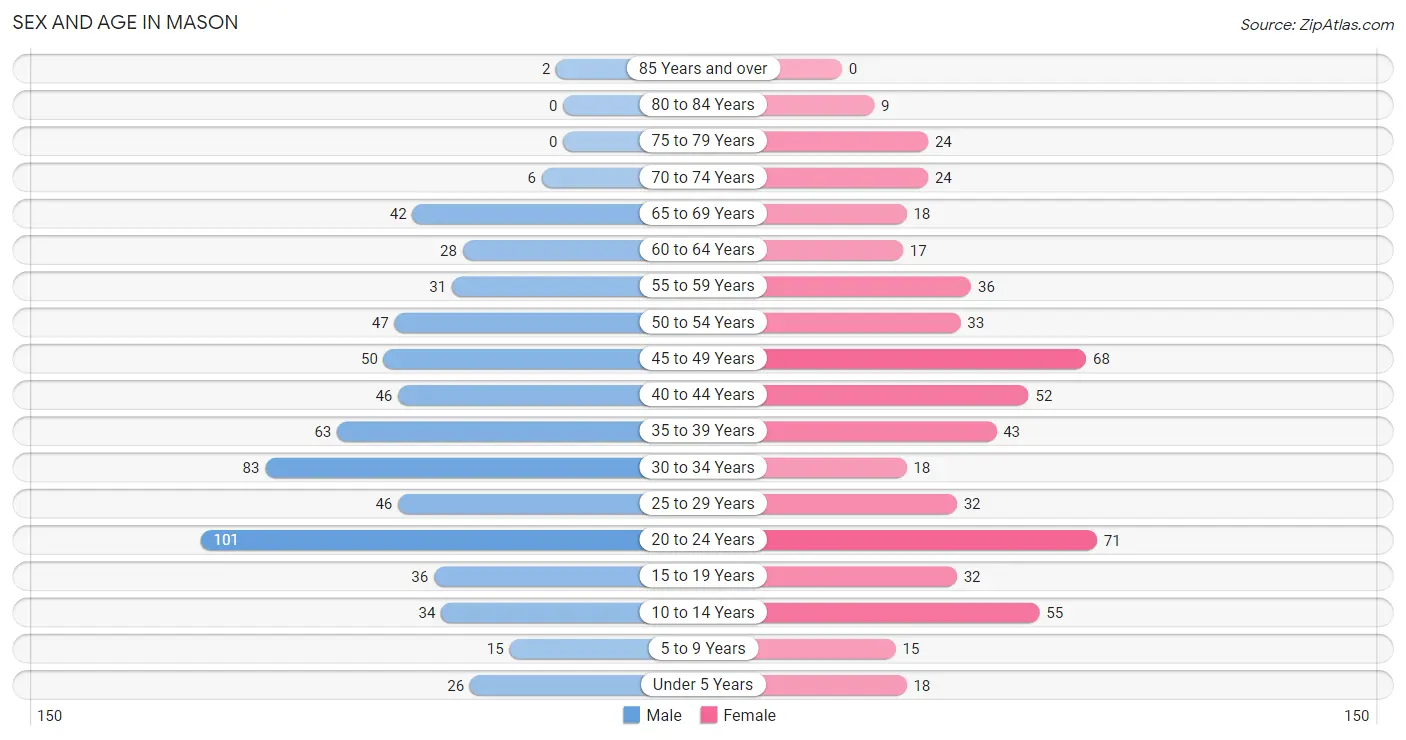
| Age Bracket | Male | Female |
| Under 5 Years | 26 (4.0%) | 18 (3.2%) |
| 5 to 9 Years | 15 (2.3%) | 15 (2.6%) |
| 10 to 14 Years | 34 (5.2%) | 55 (9.7%) |
| 15 to 19 Years | 36 (5.5%) | 32 (5.7%) |
| 20 to 24 Years | 101 (15.4%) | 71 (12.6%) |
| 25 to 29 Years | 46 (7.0%) | 32 (5.7%) |
| 30 to 34 Years | 83 (12.7%) | 18 (3.2%) |
| 35 to 39 Years | 63 (9.6%) | 43 (7.6%) |
| 40 to 44 Years | 46 (7.0%) | 52 (9.2%) |
| 45 to 49 Years | 50 (7.6%) | 68 (12.0%) |
| 50 to 54 Years | 47 (7.2%) | 33 (5.8%) |
| 55 to 59 Years | 31 (4.7%) | 36 (6.4%) |
| 60 to 64 Years | 28 (4.3%) | 17 (3.0%) |
| 65 to 69 Years | 42 (6.4%) | 18 (3.2%) |
| 70 to 74 Years | 6 (0.9%) | 24 (4.3%) |
| 75 to 79 Years | 0 (0.0%) | 24 (4.3%) |
| 80 to 84 Years | 0 (0.0%) | 9 (1.6%) |
| 85 Years and over | 2 (0.3%) | 0 (0.0%) |
| Total | 656 (100.0%) | 565 (100.0%) |
Families and Households in Mason
Median Family Size in Mason
The median family size in Mason is 2.93 persons per family, with single female/mother families (131 | 48.7%) accounting for the largest median family size of 3.45 persons per family. On the other hand, single male/father families (32 | 11.9%) represent the smallest median family size with 2.03 persons per family.
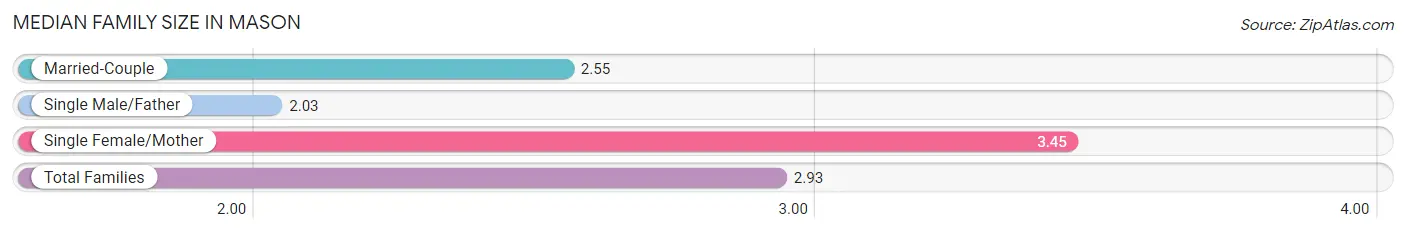
| Family Type | # Families | Family Size |
| Married-Couple | 106 (39.4%) | 2.55 |
| Single Male/Father | 32 (11.9%) | 2.03 |
| Single Female/Mother | 131 (48.7%) | 3.45 |
| Total Families | 269 (100.0%) | 2.93 |
Median Household Size in Mason
The median household size in Mason is 2.70 persons per household, with single female/mother households (131 | 39.5%) accounting for the largest median household size of 3.52 persons per household. non-family households (63 | 19.0%) represent the smallest median household size with 1.51 persons per household.
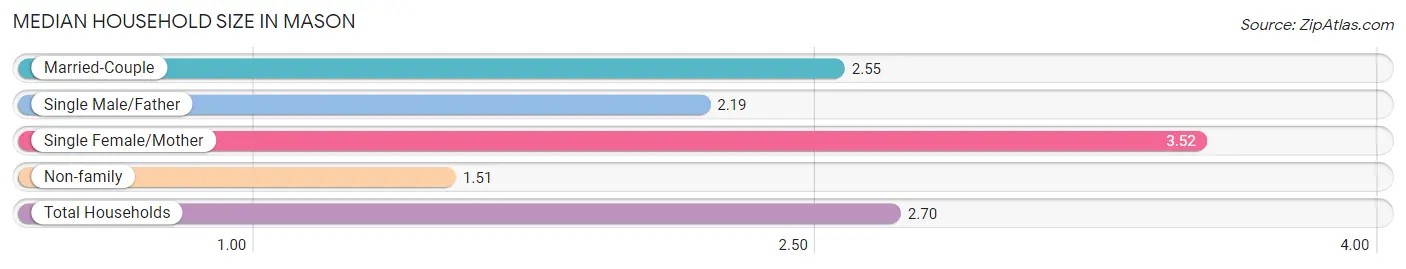
| Household Type | # Households | Household Size |
| Married-Couple | 106 (31.9%) | 2.55 |
| Single Male/Father | 32 (9.6%) | 2.19 |
| Single Female/Mother | 131 (39.5%) | 3.52 |
| Non-family | 63 (19.0%) | 1.51 |
| Total Households | 332 (100.0%) | 2.70 |
Household Size by Marriage Status in Mason
Out of a total of 332 households in Mason, 269 (81.0%) are family households, while 63 (19.0%) are nonfamily households. The most numerous type of family households are 2-person households, comprising 123, and the most common type of nonfamily households are 1-person households, comprising 42.
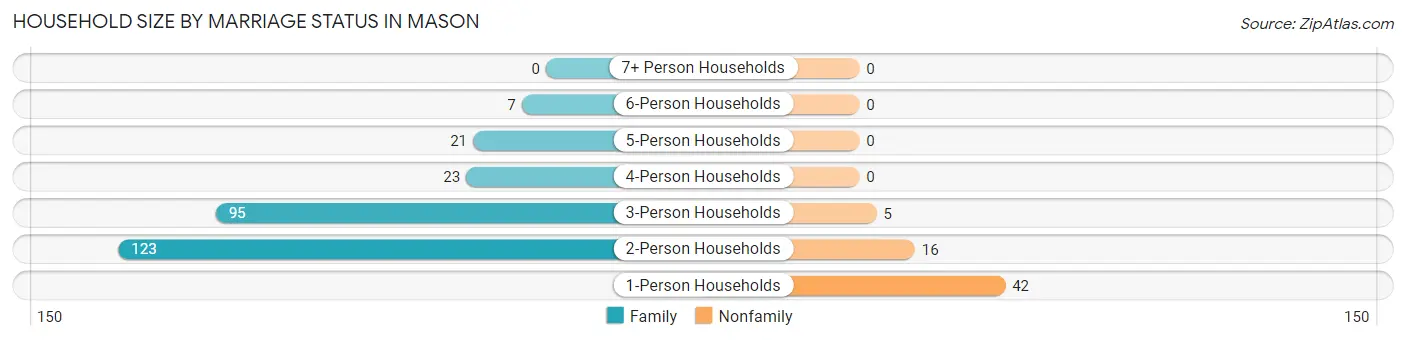
| Household Size | Family Households | Nonfamily Households |
| 1-Person Households | - | 42 (12.7%) |
| 2-Person Households | 123 (37.0%) | 16 (4.8%) |
| 3-Person Households | 95 (28.6%) | 5 (1.5%) |
| 4-Person Households | 23 (6.9%) | 0 (0.0%) |
| 5-Person Households | 21 (6.3%) | 0 (0.0%) |
| 6-Person Households | 7 (2.1%) | 0 (0.0%) |
| 7+ Person Households | 0 (0.0%) | 0 (0.0%) |
| Total | 269 (81.0%) | 63 (19.0%) |
Female Fertility in Mason
Fertility by Age in Mason
| Age Bracket | Women with Births | Births / 1,000 Women |
| 15 to 19 years | 0 (0.0%) | 0.0 |
| 20 to 34 years | 0 (0.0%) | 0.0 |
| 35 to 50 years | 0 (0.0%) | 0.0 |
| Total | 0 (0.0%) | 0.0 |
Fertility by Age by Marriage Status in Mason
| Age Bracket | Married | Unmarried |
| 15 to 19 years | 0 (0.0%) | 0 (0.0%) |
| 20 to 34 years | 0 (0.0%) | 0 (0.0%) |
| 35 to 50 years | 0 (0.0%) | 0 (0.0%) |
| Total | 0 (0.0%) | 0 (0.0%) |
Fertility by Education in Mason
| Educational Attainment | Women with Births | Births / 1,000 Women |
| Less than High School | 0 (0.0%) | 0.0 |
| High School Diploma | 0 (0.0%) | 0.0 |
| College or Associate's Degree | 0 (0.0%) | 0.0 |
| Bachelor's Degree | 0 (0.0%) | 0.0 |
| Graduate Degree | 0 (0.0%) | 0.0 |
| Total | 0 (0.0%) | 0.0 |
Fertility by Education by Marriage Status in Mason
| Educational Attainment | Married | Unmarried |
| Less than High School | 0 (0.0%) | 0 (0.0%) |
| High School Diploma | 0 (0.0%) | 0 (0.0%) |
| College or Associate's Degree | 0 (0.0%) | 0 (0.0%) |
| Bachelor's Degree | 0 (0.0%) | 0 (0.0%) |
| Graduate Degree | 0 (0.0%) | 0 (0.0%) |
| Total | 0 (0.0%) | 0 (0.0%) |
Employment Characteristics in Mason
Employment by Class of Employer in Mason
Among the 323 employed individuals in Mason, private company employees (248 | 76.8%), not-for-profit organizations (22 | 6.8%), and federal government employees (20 | 6.2%) make up the most common classes of employment.
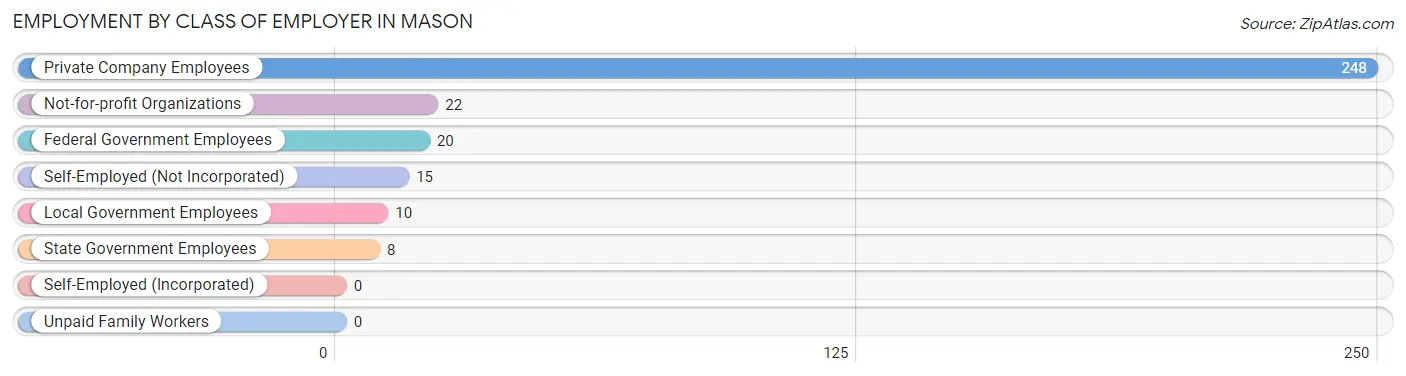
| Employer Class | # Employees | % Employees |
| Private Company Employees | 248 | 76.8% |
| Self-Employed (Incorporated) | 0 | 0.0% |
| Self-Employed (Not Incorporated) | 15 | 4.6% |
| Not-for-profit Organizations | 22 | 6.8% |
| Local Government Employees | 10 | 3.1% |
| State Government Employees | 8 | 2.5% |
| Federal Government Employees | 20 | 6.2% |
| Unpaid Family Workers | 0 | 0.0% |
| Total | 323 | 100.0% |
Employment Status by Age in Mason
According to the labor force statistics for Mason, out of the total population over 16 years of age (1,026), 39.4% or 404 individuals are in the labor force, with 12.1% or 49 of them unemployed. The age group with the highest labor force participation rate is 45 to 54 years, with 63.6% or 126 individuals in the labor force. Within the labor force, the 25 to 29 years age range has the highest percentage of unemployed individuals, with 33.3% or 12 of them being unemployed.
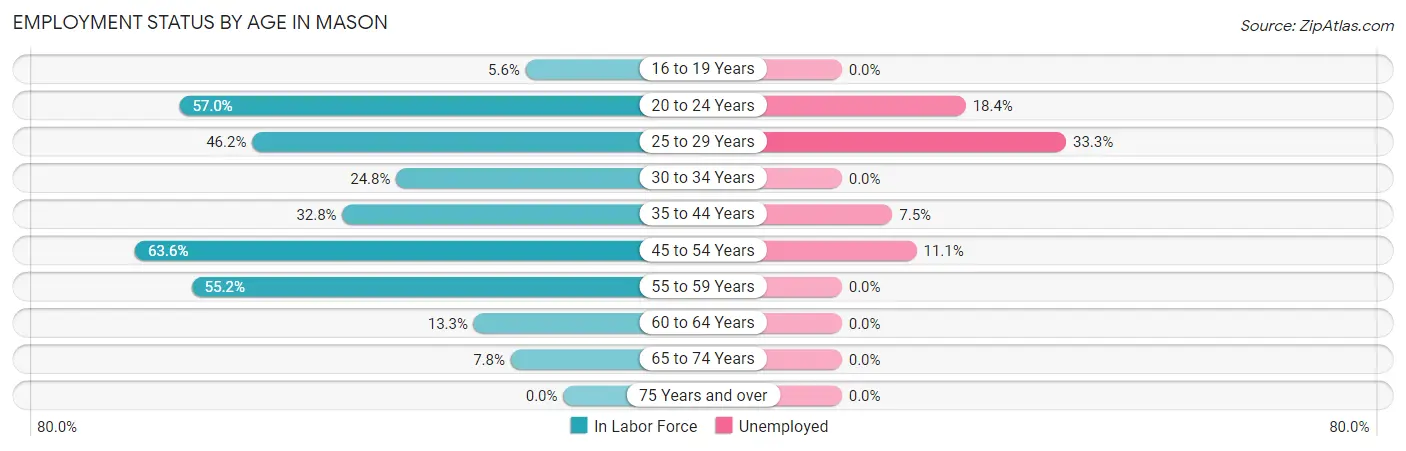
| Age Bracket | In Labor Force | Unemployed |
| 16 to 19 Years | 2 (5.6%) | 0 (0.0%) |
| 20 to 24 Years | 98 (57.0%) | 18 (18.4%) |
| 25 to 29 Years | 36 (46.2%) | 12 (33.3%) |
| 30 to 34 Years | 25 (24.8%) | 0 (0.0%) |
| 35 to 44 Years | 67 (32.8%) | 5 (7.5%) |
| 45 to 54 Years | 126 (63.6%) | 14 (11.1%) |
| 55 to 59 Years | 37 (55.2%) | 0 (0.0%) |
| 60 to 64 Years | 6 (13.3%) | 0 (0.0%) |
| 65 to 74 Years | 7 (7.8%) | 0 (0.0%) |
| 75 Years and over | 0 (0.0%) | 0 (0.0%) |
| Total | 404 (39.4%) | 49 (12.1%) |
Employment Status by Educational Attainment in Mason
According to labor force statistics for Mason, 42.9% of individuals (297) out of the total population between 25 and 64 years of age (693) are in the labor force, with 10.4% or 31 of them being unemployed. The group with the highest labor force participation rate are those with the educational attainment of high school diploma, with 50.4% or 141 individuals in the labor force. Within the labor force, individuals with college / associate degree education have the highest percentage of unemployment, with 17.2% or 17 of them being unemployed.
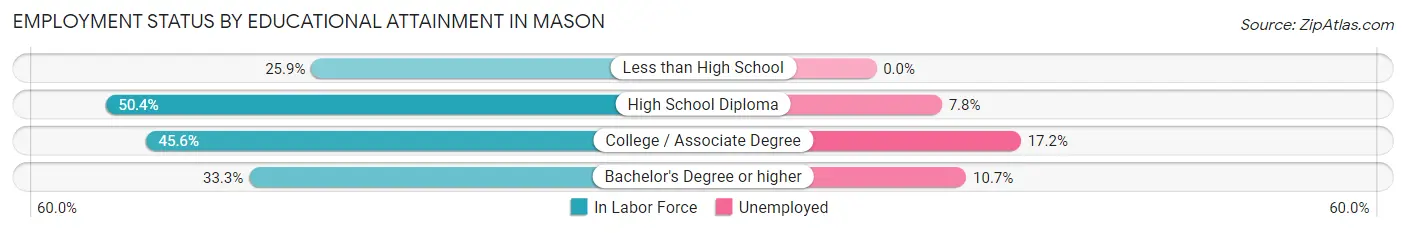
| Educational Attainment | In Labor Force | Unemployed |
| Less than High School | 29 (25.9%) | 0 (0.0%) |
| High School Diploma | 141 (50.4%) | 22 (7.8%) |
| College / Associate Degree | 99 (45.6%) | 37 (17.2%) |
| Bachelor's Degree or higher | 28 (33.3%) | 9 (10.7%) |
| Total | 297 (42.9%) | 72 (10.4%) |
Employment Occupations by Sex in Mason
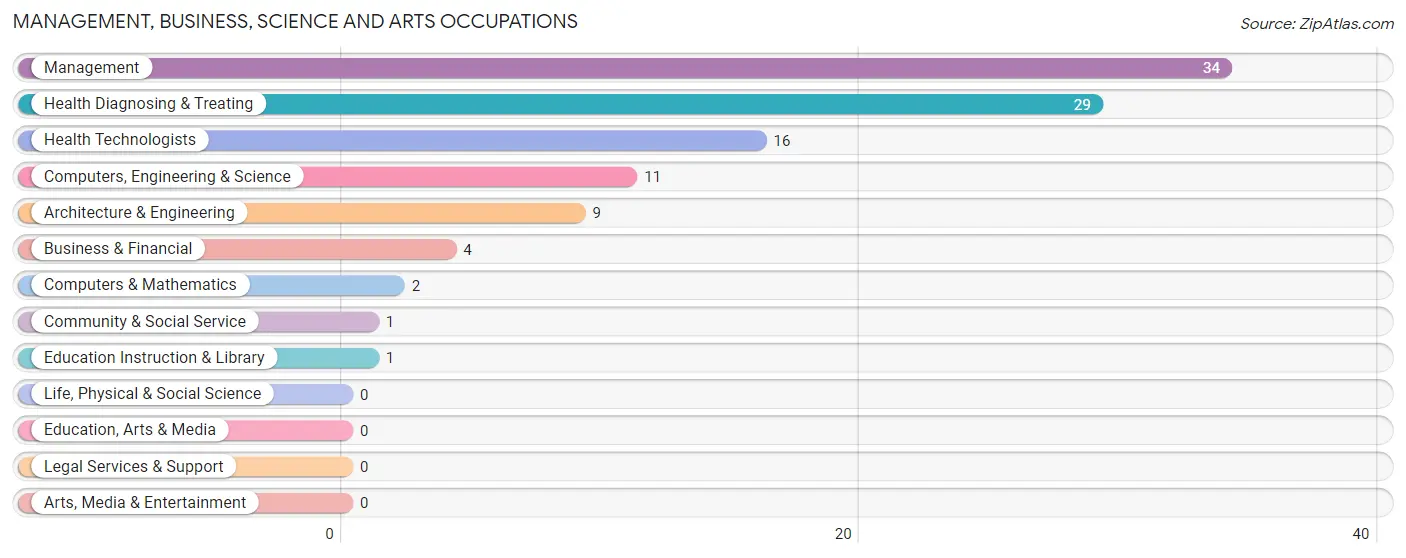
Management, Business, Science and Arts Occupations
The most common Management, Business, Science and Arts occupations in Mason are Management (34 | 9.6%), Health Diagnosing & Treating (29 | 8.2%), Health Technologists (16 | 4.5%), Computers, Engineering & Science (11 | 3.1%), and Architecture & Engineering (9 | 2.5%).
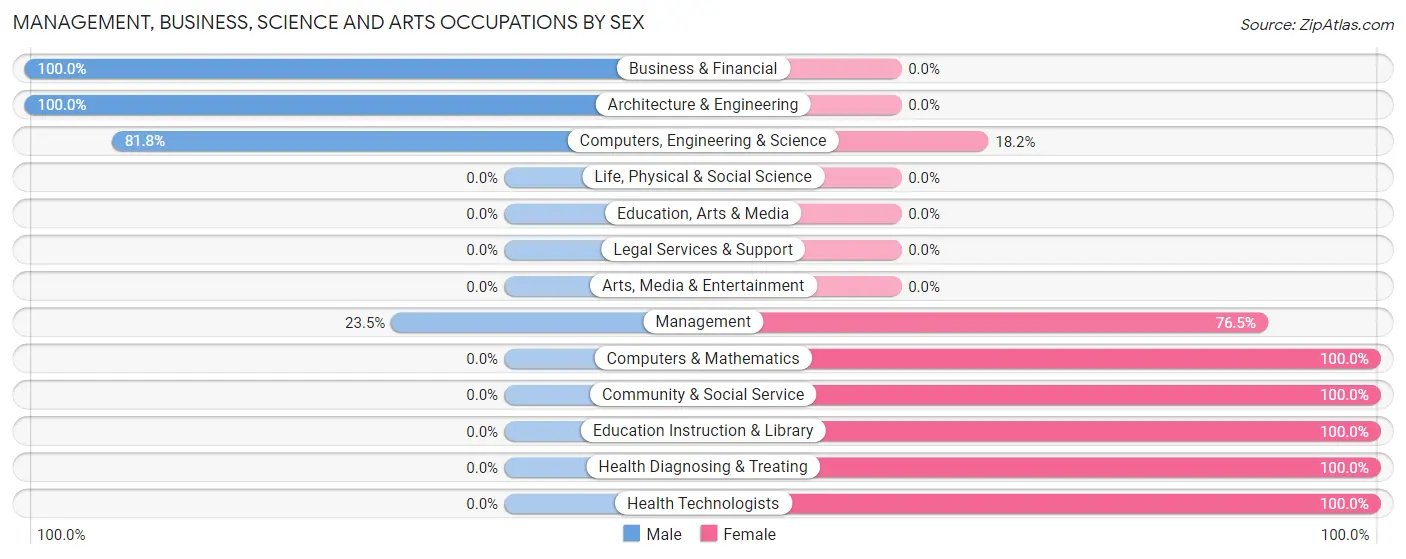
Management, Business, Science and Arts Occupations by Sex
Within the Management, Business, Science and Arts occupations in Mason, the most male-oriented occupations are Business & Financial (100.0%), Architecture & Engineering (100.0%), and Computers, Engineering & Science (81.8%), while the most female-oriented occupations are Computers & Mathematics (100.0%), Community & Social Service (100.0%), and Education Instruction & Library (100.0%).
| Occupation | Male | Female |
| Management | 8 (23.5%) | 26 (76.5%) |
| Business & Financial | 4 (100.0%) | 0 (0.0%) |
| Computers, Engineering & Science | 9 (81.8%) | 2 (18.2%) |
| Computers & Mathematics | 0 (0.0%) | 2 (100.0%) |
| Architecture & Engineering | 9 (100.0%) | 0 (0.0%) |
| Life, Physical & Social Science | 0 (0.0%) | 0 (0.0%) |
| Community & Social Service | 0 (0.0%) | 1 (100.0%) |
| Education, Arts & Media | 0 (0.0%) | 0 (0.0%) |
| Legal Services & Support | 0 (0.0%) | 0 (0.0%) |
| Education Instruction & Library | 0 (0.0%) | 1 (100.0%) |
| Arts, Media & Entertainment | 0 (0.0%) | 0 (0.0%) |
| Health Diagnosing & Treating | 0 (0.0%) | 29 (100.0%) |
| Health Technologists | 0 (0.0%) | 16 (100.0%) |
| Total (Category) | 21 (26.6%) | 58 (73.4%) |
| Total (Overall) | 166 (46.8%) | 189 (53.2%) |
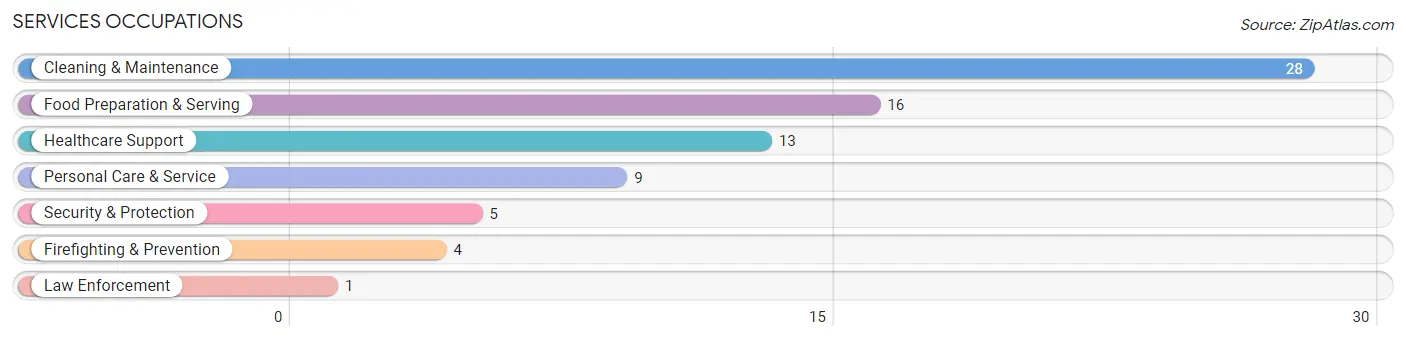
Services Occupations
The most common Services occupations in Mason are Cleaning & Maintenance (28 | 7.9%), Food Preparation & Serving (16 | 4.5%), Healthcare Support (13 | 3.7%), Personal Care & Service (9 | 2.5%), and Security & Protection (5 | 1.4%).
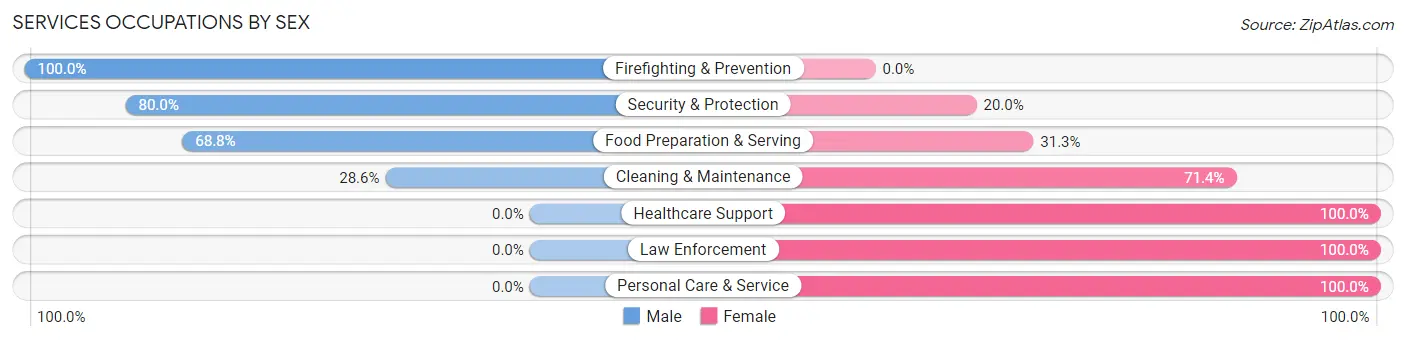
Services Occupations by Sex
Within the Services occupations in Mason, the most male-oriented occupations are Firefighting & Prevention (100.0%), Security & Protection (80.0%), and Food Preparation & Serving (68.8%), while the most female-oriented occupations are Healthcare Support (100.0%), Law Enforcement (100.0%), and Personal Care & Service (100.0%).
| Occupation | Male | Female |
| Healthcare Support | 0 (0.0%) | 13 (100.0%) |
| Security & Protection | 4 (80.0%) | 1 (20.0%) |
| Firefighting & Prevention | 4 (100.0%) | 0 (0.0%) |
| Law Enforcement | 0 (0.0%) | 1 (100.0%) |
| Food Preparation & Serving | 11 (68.8%) | 5 (31.2%) |
| Cleaning & Maintenance | 8 (28.6%) | 20 (71.4%) |
| Personal Care & Service | 0 (0.0%) | 9 (100.0%) |
| Total (Category) | 23 (32.4%) | 48 (67.6%) |
| Total (Overall) | 166 (46.8%) | 189 (53.2%) |
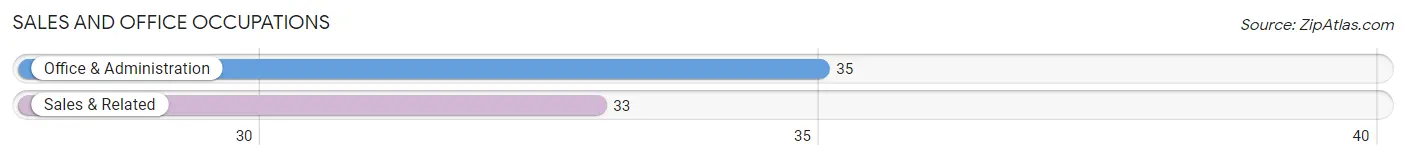
Sales and Office Occupations
The most common Sales and Office occupations in Mason are Office & Administration (35 | 9.9%), and Sales & Related (33 | 9.3%).
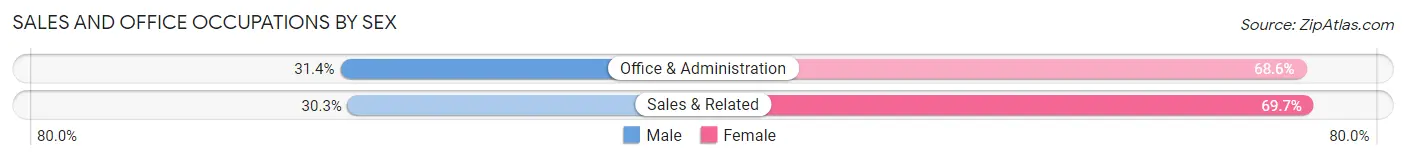
Sales and Office Occupations by Sex
| Occupation | Male | Female |
| Sales & Related | 10 (30.3%) | 23 (69.7%) |
| Office & Administration | 11 (31.4%) | 24 (68.6%) |
| Total (Category) | 21 (30.9%) | 47 (69.1%) |
| Total (Overall) | 166 (46.8%) | 189 (53.2%) |
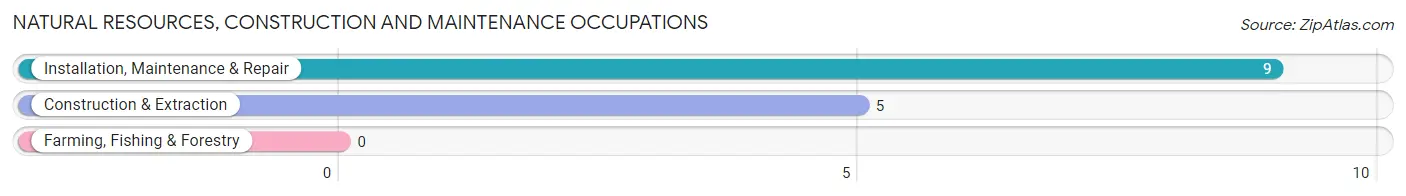
Natural Resources, Construction and Maintenance Occupations
The most common Natural Resources, Construction and Maintenance occupations in Mason are Installation, Maintenance & Repair (9 | 2.5%), and Construction & Extraction (5 | 1.4%).
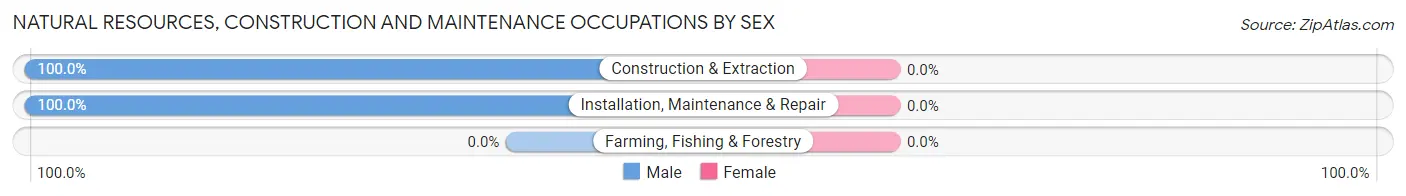
Natural Resources, Construction and Maintenance Occupations by Sex
| Occupation | Male | Female |
| Farming, Fishing & Forestry | 0 (0.0%) | 0 (0.0%) |
| Construction & Extraction | 5 (100.0%) | 0 (0.0%) |
| Installation, Maintenance & Repair | 9 (100.0%) | 0 (0.0%) |
| Total (Category) | 14 (100.0%) | 0 (0.0%) |
| Total (Overall) | 166 (46.8%) | 189 (53.2%) |
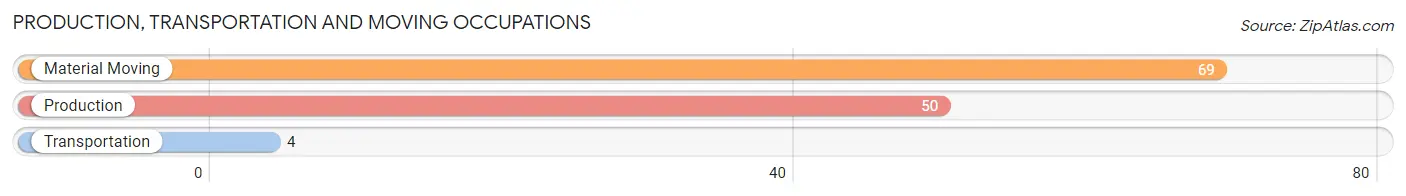
Production, Transportation and Moving Occupations
The most common Production, Transportation and Moving occupations in Mason are Material Moving (69 | 19.4%), Production (50 | 14.1%), and Transportation (4 | 1.1%).
Production, Transportation and Moving Occupations by Sex
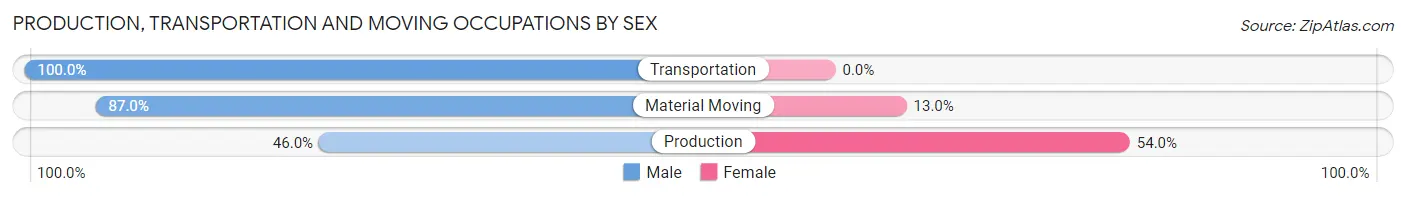
| Occupation | Male | Female |
| Production | 23 (46.0%) | 27 (54.0%) |
| Transportation | 4 (100.0%) | 0 (0.0%) |
| Material Moving | 60 (87.0%) | 9 (13.0%) |
| Total (Category) | 87 (70.7%) | 36 (29.3%) |
| Total (Overall) | 166 (46.8%) | 189 (53.2%) |
Employment Industries by Sex in Mason
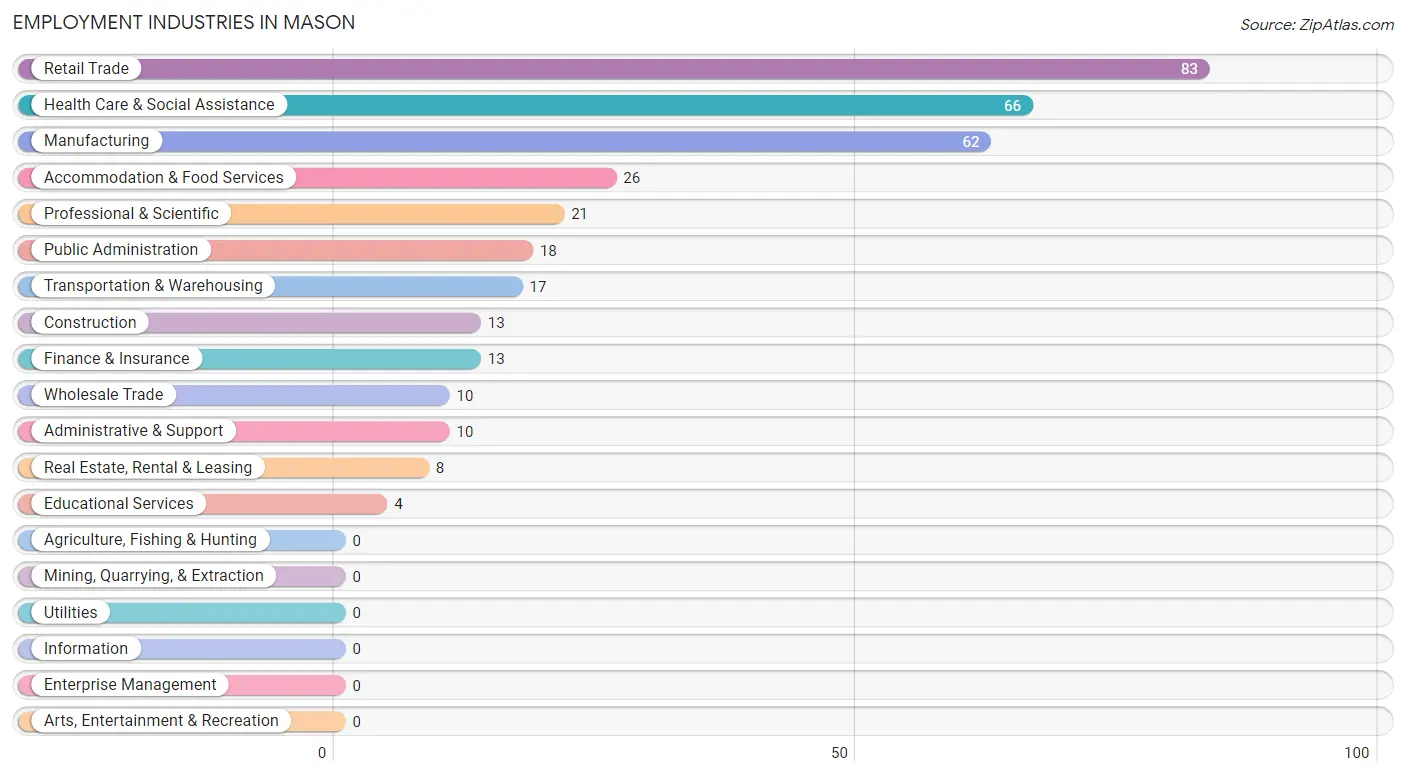
Employment Industries in Mason
The major employment industries in Mason include Retail Trade (83 | 23.4%), Health Care & Social Assistance (66 | 18.6%), Manufacturing (62 | 17.5%), Accommodation & Food Services (26 | 7.3%), and Professional & Scientific (21 | 5.9%).
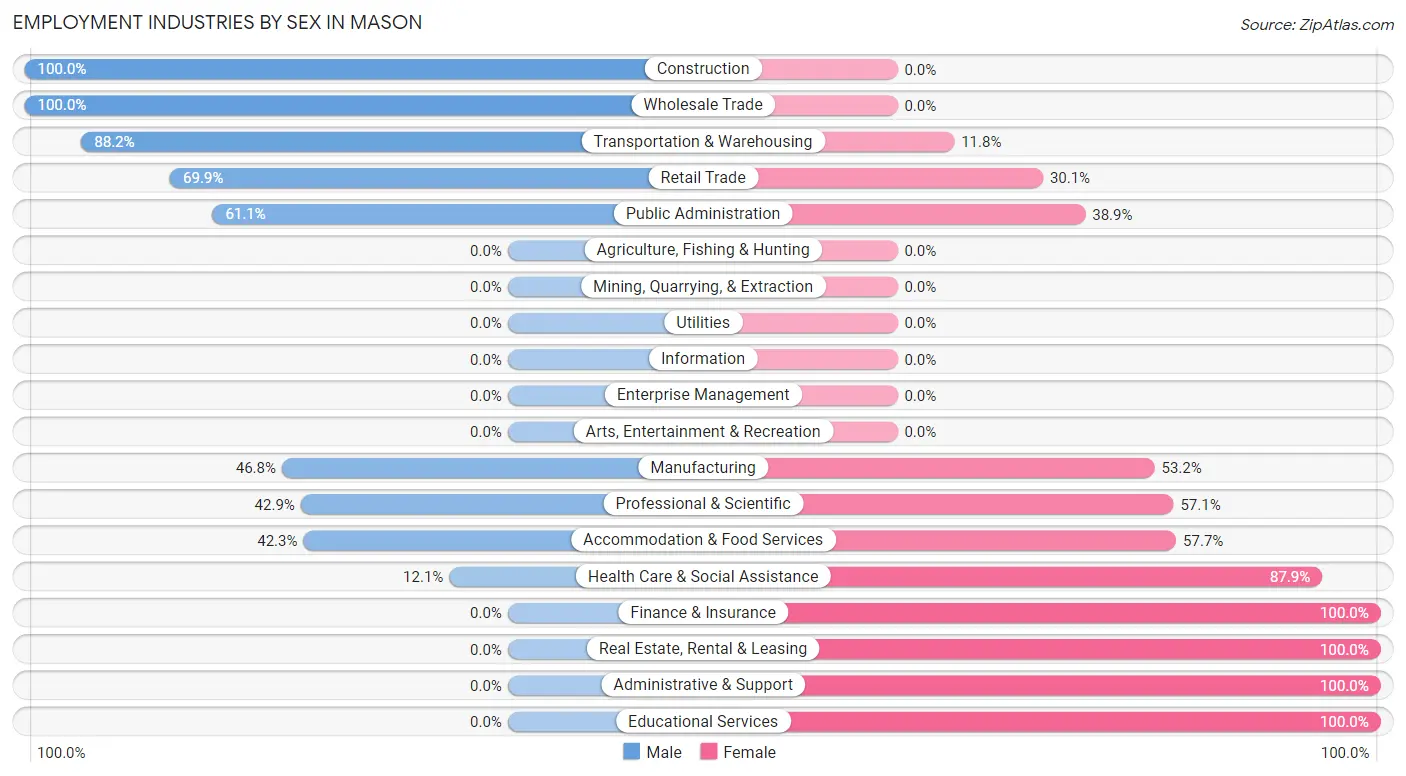
Employment Industries by Sex in Mason
The Mason industries that see more men than women are Construction (100.0%), Wholesale Trade (100.0%), and Transportation & Warehousing (88.2%), whereas the industries that tend to have a higher number of women are Finance & Insurance (100.0%), Real Estate, Rental & Leasing (100.0%), and Administrative & Support (100.0%).
| Industry | Male | Female |
| Agriculture, Fishing & Hunting | 0 (0.0%) | 0 (0.0%) |
| Mining, Quarrying, & Extraction | 0 (0.0%) | 0 (0.0%) |
| Construction | 13 (100.0%) | 0 (0.0%) |
| Manufacturing | 29 (46.8%) | 33 (53.2%) |
| Wholesale Trade | 10 (100.0%) | 0 (0.0%) |
| Retail Trade | 58 (69.9%) | 25 (30.1%) |
| Transportation & Warehousing | 15 (88.2%) | 2 (11.8%) |
| Utilities | 0 (0.0%) | 0 (0.0%) |
| Information | 0 (0.0%) | 0 (0.0%) |
| Finance & Insurance | 0 (0.0%) | 13 (100.0%) |
| Real Estate, Rental & Leasing | 0 (0.0%) | 8 (100.0%) |
| Professional & Scientific | 9 (42.9%) | 12 (57.1%) |
| Enterprise Management | 0 (0.0%) | 0 (0.0%) |
| Administrative & Support | 0 (0.0%) | 10 (100.0%) |
| Educational Services | 0 (0.0%) | 4 (100.0%) |
| Health Care & Social Assistance | 8 (12.1%) | 58 (87.9%) |
| Arts, Entertainment & Recreation | 0 (0.0%) | 0 (0.0%) |
| Accommodation & Food Services | 11 (42.3%) | 15 (57.7%) |
| Public Administration | 11 (61.1%) | 7 (38.9%) |
| Total | 166 (46.8%) | 189 (53.2%) |
Education in Mason
School Enrollment in Mason
The most common levels of schooling among the 283 students in Mason are college / undergraduate (98 | 34.6%), middle school (81 | 28.6%), and high school (51 | 18.0%).
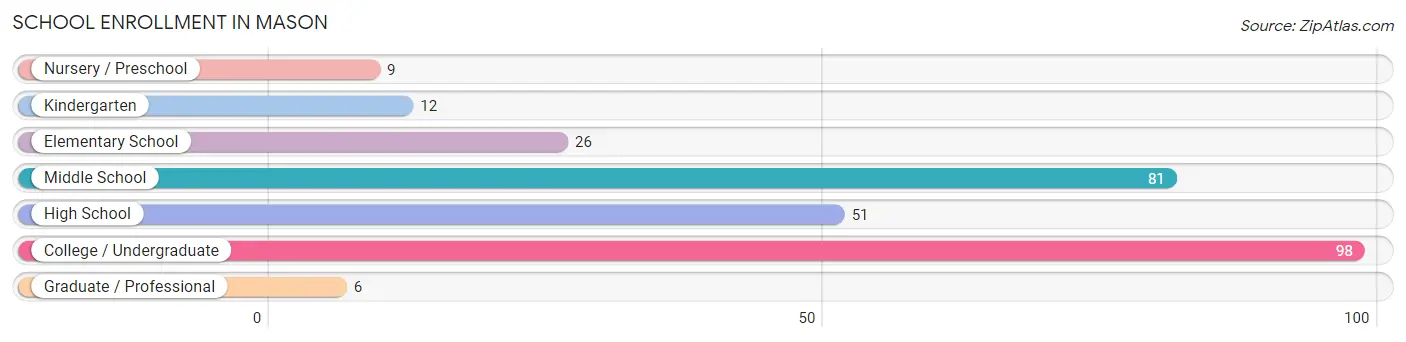
| School Level | # Students | % Students |
| Nursery / Preschool | 9 | 3.2% |
| Kindergarten | 12 | 4.2% |
| Elementary School | 26 | 9.2% |
| Middle School | 81 | 28.6% |
| High School | 51 | 18.0% |
| College / Undergraduate | 98 | 34.6% |
| Graduate / Professional | 6 | 2.1% |
| Total | 283 | 100.0% |
School Enrollment by Age by Funding Source in Mason
Out of a total of 283 students who are enrolled in schools in Mason, 37 (13.1%) attend a private institution, while the remaining 246 (86.9%) are enrolled in public schools. The age group of 35 years and over has the highest likelihood of being enrolled in private schools, with 19 (76.0% in the age bracket) enrolled. Conversely, the age group of 3 to 4 year olds has the lowest likelihood of being enrolled in a private school, with 9 (100.0% in the age bracket) attending a public institution.
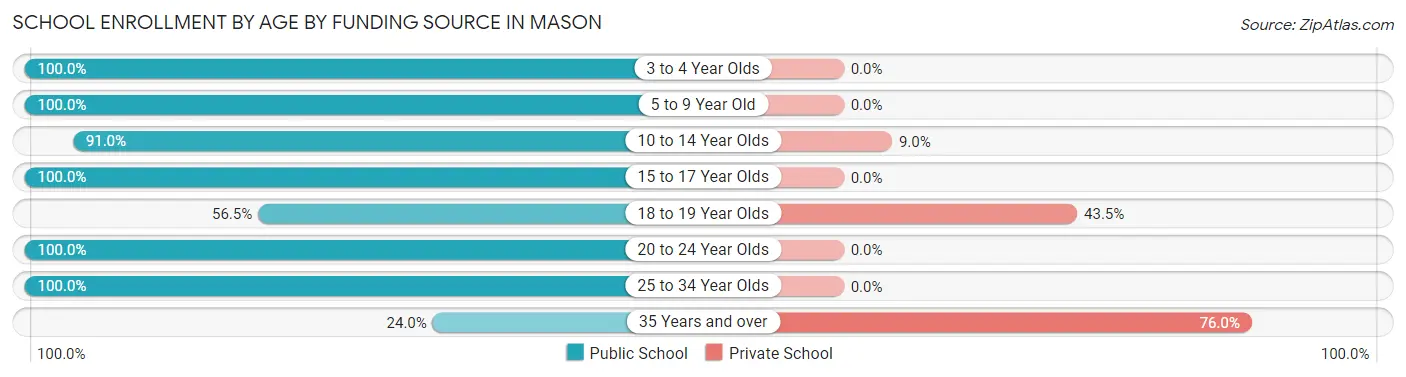
| Age Bracket | Public School | Private School |
| 3 to 4 Year Olds | 9 (100.0%) | 0 (0.0%) |
| 5 to 9 Year Old | 30 (100.0%) | 0 (0.0%) |
| 10 to 14 Year Olds | 81 (91.0%) | 8 (9.0%) |
| 15 to 17 Year Olds | 38 (100.0%) | 0 (0.0%) |
| 18 to 19 Year Olds | 13 (56.5%) | 10 (43.5%) |
| 20 to 24 Year Olds | 48 (100.0%) | 0 (0.0%) |
| 25 to 34 Year Olds | 21 (100.0%) | 0 (0.0%) |
| 35 Years and over | 6 (24.0%) | 19 (76.0%) |
| Total | 246 (86.9%) | 37 (13.1%) |
Educational Attainment by Field of Study in Mason
Education (28 | 24.8%), business (22 | 19.5%), computers & mathematics (14 | 12.4%), science & technology (12 | 10.6%), and physical & health sciences (11 | 9.7%) are the most common fields of study among 113 individuals in Mason who have obtained a bachelor's degree or higher.
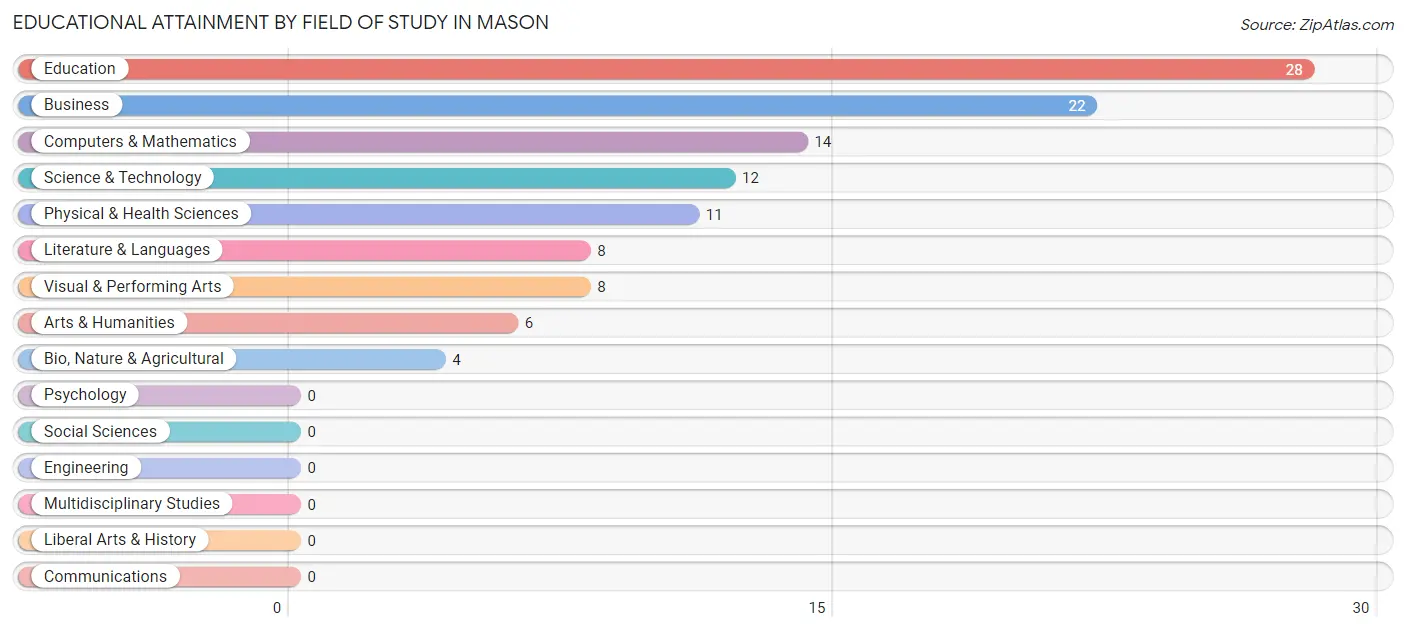
| Field of Study | # Graduates | % Graduates |
| Computers & Mathematics | 14 | 12.4% |
| Bio, Nature & Agricultural | 4 | 3.5% |
| Physical & Health Sciences | 11 | 9.7% |
| Psychology | 0 | 0.0% |
| Social Sciences | 0 | 0.0% |
| Engineering | 0 | 0.0% |
| Multidisciplinary Studies | 0 | 0.0% |
| Science & Technology | 12 | 10.6% |
| Business | 22 | 19.5% |
| Education | 28 | 24.8% |
| Literature & Languages | 8 | 7.1% |
| Liberal Arts & History | 0 | 0.0% |
| Visual & Performing Arts | 8 | 7.1% |
| Communications | 0 | 0.0% |
| Arts & Humanities | 6 | 5.3% |
| Total | 113 | 100.0% |
Transportation & Commute in Mason
Vehicle Availability by Sex in Mason
The most prevalent vehicle ownership categories in Mason are males with 2 vehicles (44, accounting for 31.2%) and females with 2 vehicles (34, making up 24.2%).
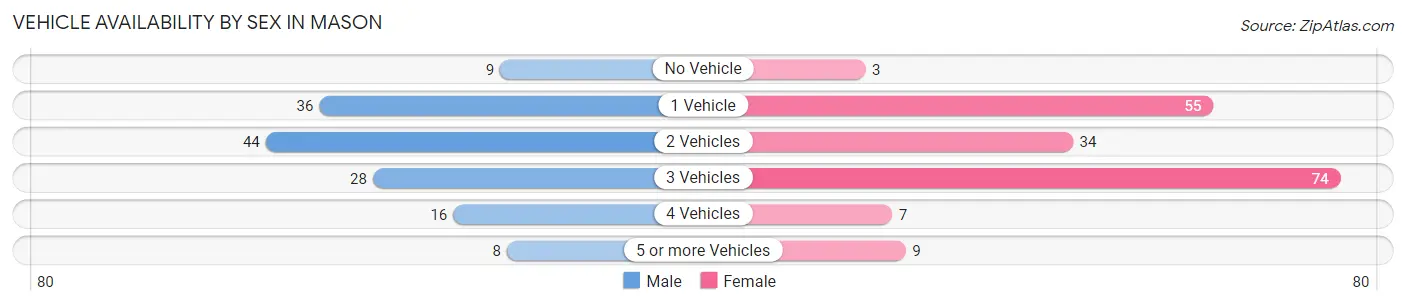
| Vehicles Available | Male | Female |
| No Vehicle | 9 (6.4%) | 3 (1.7%) |
| 1 Vehicle | 36 (25.5%) | 55 (30.2%) |
| 2 Vehicles | 44 (31.2%) | 34 (18.7%) |
| 3 Vehicles | 28 (19.9%) | 74 (40.7%) |
| 4 Vehicles | 16 (11.4%) | 7 (3.8%) |
| 5 or more Vehicles | 8 (5.7%) | 9 (5.0%) |
| Total | 141 (100.0%) | 182 (100.0%) |
Commute Time in Mason
The most frequently occuring commute durations in Mason are 20 to 24 minutes (63 commuters, 20.6%), 15 to 19 minutes (56 commuters, 18.3%), and 30 to 34 minutes (39 commuters, 12.8%).
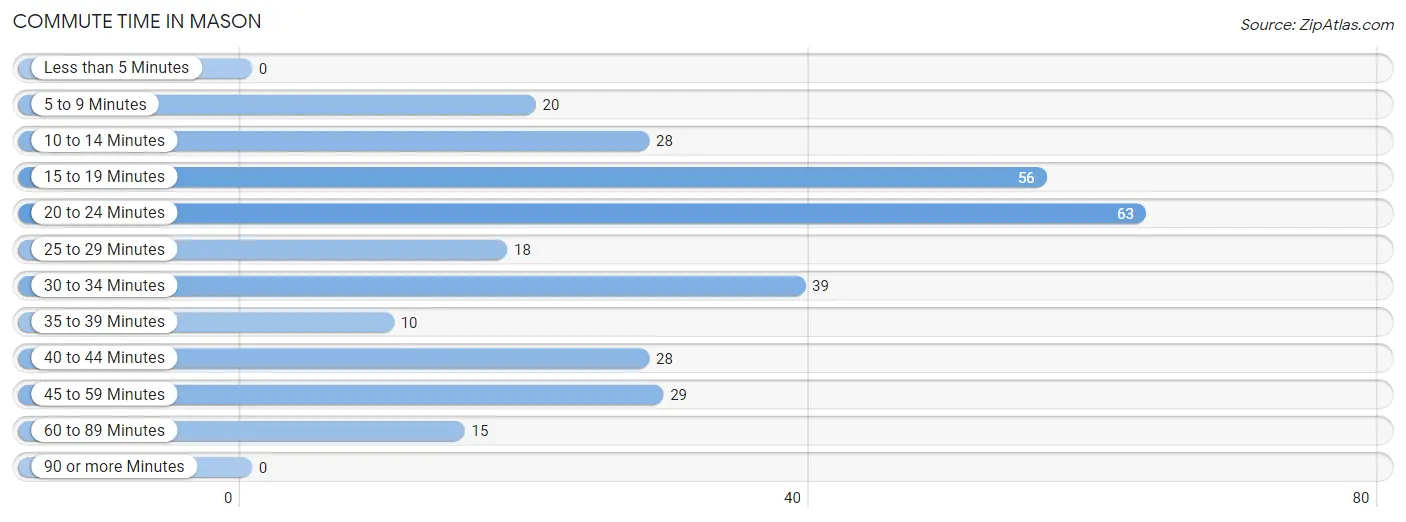
| Commute Time | # Commuters | % Commuters |
| Less than 5 Minutes | 0 | 0.0% |
| 5 to 9 Minutes | 20 | 6.5% |
| 10 to 14 Minutes | 28 | 9.1% |
| 15 to 19 Minutes | 56 | 18.3% |
| 20 to 24 Minutes | 63 | 20.6% |
| 25 to 29 Minutes | 18 | 5.9% |
| 30 to 34 Minutes | 39 | 12.8% |
| 35 to 39 Minutes | 10 | 3.3% |
| 40 to 44 Minutes | 28 | 9.1% |
| 45 to 59 Minutes | 29 | 9.5% |
| 60 to 89 Minutes | 15 | 4.9% |
| 90 or more Minutes | 0 | 0.0% |
Commute Time by Sex in Mason
The most common commute times in Mason are 15 to 19 minutes (40 commuters, 29.8%) for males and 20 to 24 minutes (62 commuters, 36.0%) for females.
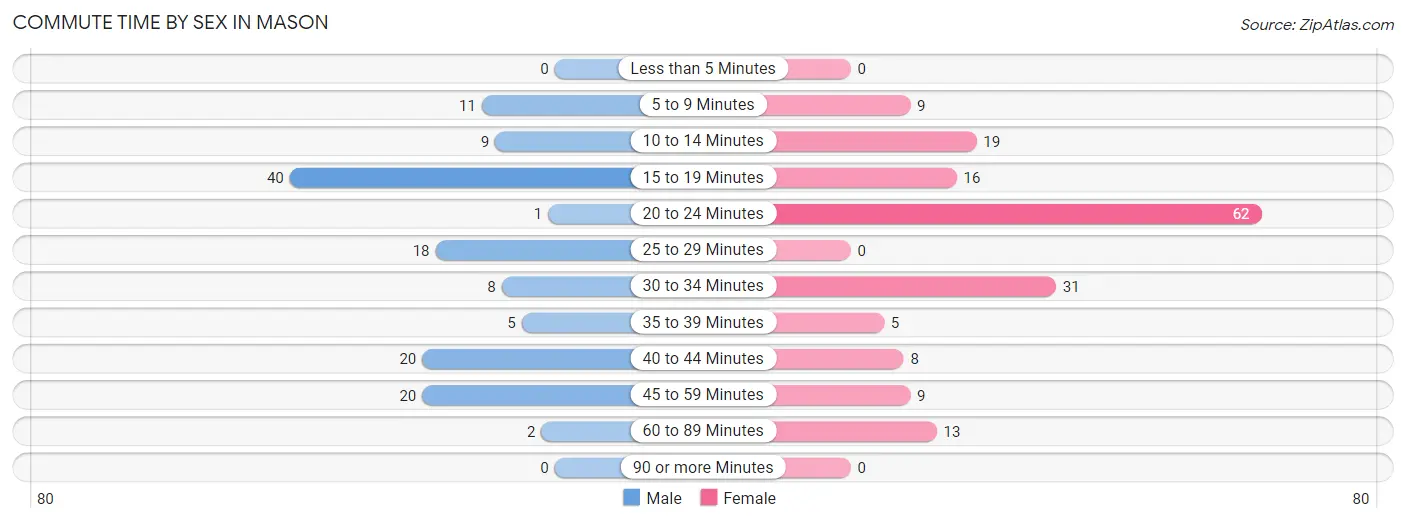
| Commute Time | Male | Female |
| Less than 5 Minutes | 0 (0.0%) | 0 (0.0%) |
| 5 to 9 Minutes | 11 (8.2%) | 9 (5.2%) |
| 10 to 14 Minutes | 9 (6.7%) | 19 (11.1%) |
| 15 to 19 Minutes | 40 (29.8%) | 16 (9.3%) |
| 20 to 24 Minutes | 1 (0.7%) | 62 (36.0%) |
| 25 to 29 Minutes | 18 (13.4%) | 0 (0.0%) |
| 30 to 34 Minutes | 8 (6.0%) | 31 (18.0%) |
| 35 to 39 Minutes | 5 (3.7%) | 5 (2.9%) |
| 40 to 44 Minutes | 20 (14.9%) | 8 (4.6%) |
| 45 to 59 Minutes | 20 (14.9%) | 9 (5.2%) |
| 60 to 89 Minutes | 2 (1.5%) | 13 (7.6%) |
| 90 or more Minutes | 0 (0.0%) | 0 (0.0%) |
Time of Departure to Work by Sex in Mason
The most frequent times of departure to work in Mason are 12:00 PM to 3:59 PM (26, 19.4%) for males and 6:30 AM to 6:59 AM (25, 14.5%) for females.
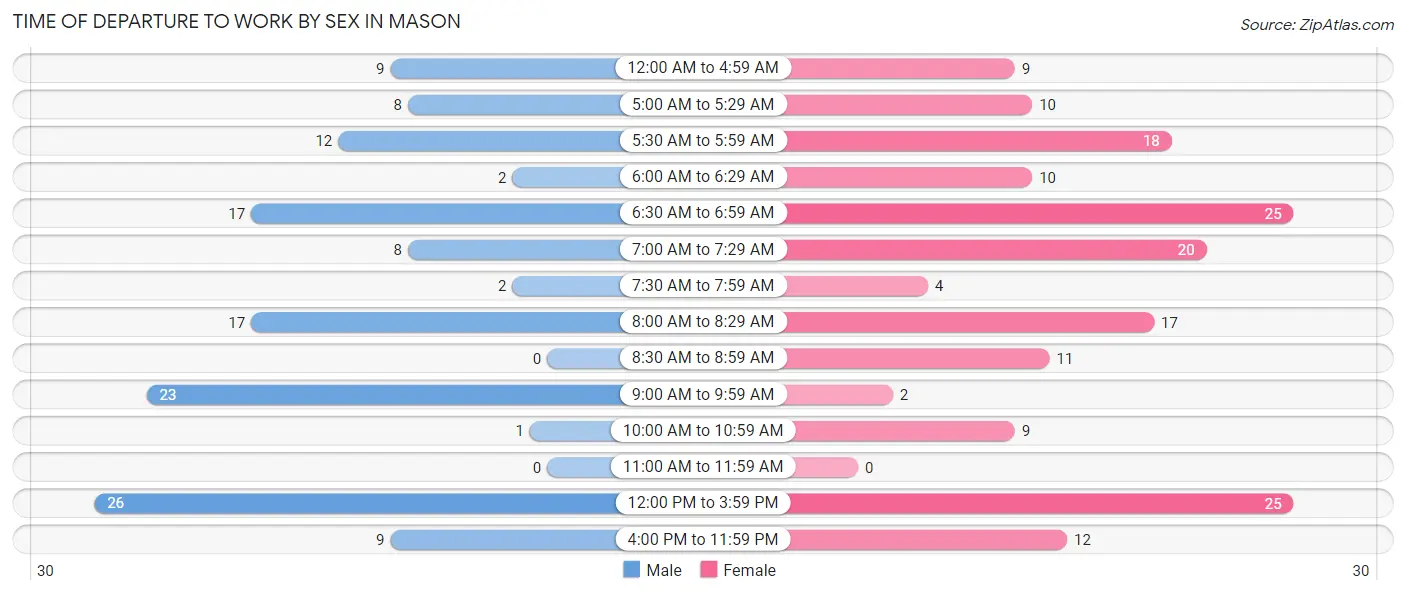
| Time of Departure | Male | Female |
| 12:00 AM to 4:59 AM | 9 (6.7%) | 9 (5.2%) |
| 5:00 AM to 5:29 AM | 8 (6.0%) | 10 (5.8%) |
| 5:30 AM to 5:59 AM | 12 (9.0%) | 18 (10.5%) |
| 6:00 AM to 6:29 AM | 2 (1.5%) | 10 (5.8%) |
| 6:30 AM to 6:59 AM | 17 (12.7%) | 25 (14.5%) |
| 7:00 AM to 7:29 AM | 8 (6.0%) | 20 (11.6%) |
| 7:30 AM to 7:59 AM | 2 (1.5%) | 4 (2.3%) |
| 8:00 AM to 8:29 AM | 17 (12.7%) | 17 (9.9%) |
| 8:30 AM to 8:59 AM | 0 (0.0%) | 11 (6.4%) |
| 9:00 AM to 9:59 AM | 23 (17.2%) | 2 (1.2%) |
| 10:00 AM to 10:59 AM | 1 (0.7%) | 9 (5.2%) |
| 11:00 AM to 11:59 AM | 0 (0.0%) | 0 (0.0%) |
| 12:00 PM to 3:59 PM | 26 (19.4%) | 25 (14.5%) |
| 4:00 PM to 11:59 PM | 9 (6.7%) | 12 (7.0%) |
| Total | 134 (100.0%) | 172 (100.0%) |
Housing Occupancy in Mason
Occupancy by Ownership in Mason
Of the total 332 dwellings in Mason, owner-occupied units account for 172 (51.8%), while renter-occupied units make up 160 (48.2%).
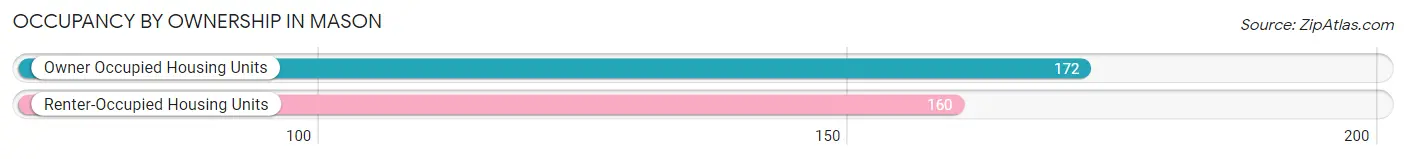
| Occupancy | # Housing Units | % Housing Units |
| Owner Occupied Housing Units | 172 | 51.8% |
| Renter-Occupied Housing Units | 160 | 48.2% |
| Total Occupied Housing Units | 332 | 100.0% |
Occupancy by Household Size in Mason
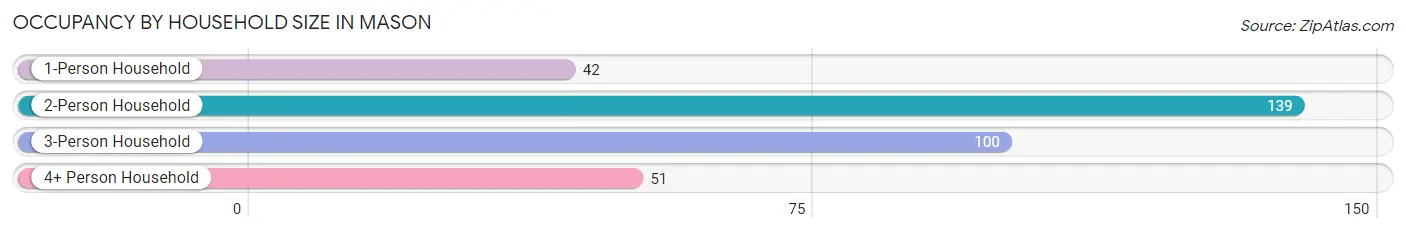
| Household Size | # Housing Units | % Housing Units |
| 1-Person Household | 42 | 12.7% |
| 2-Person Household | 139 | 41.9% |
| 3-Person Household | 100 | 30.1% |
| 4+ Person Household | 51 | 15.4% |
| Total Housing Units | 332 | 100.0% |
Occupancy by Ownership by Household Size in Mason
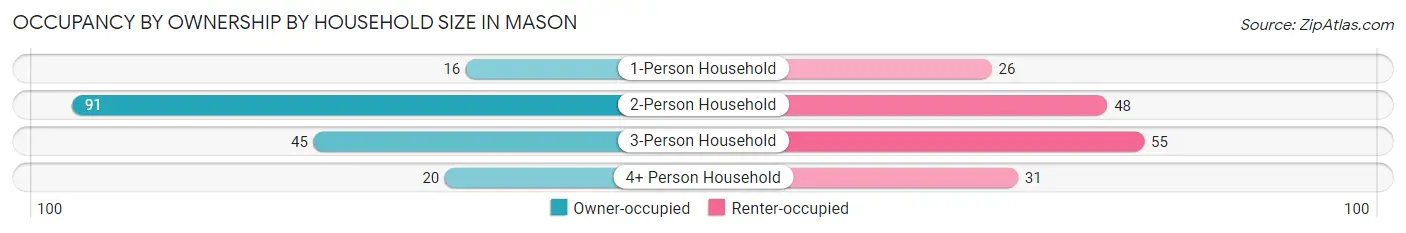
| Household Size | Owner-occupied | Renter-occupied |
| 1-Person Household | 16 (38.1%) | 26 (61.9%) |
| 2-Person Household | 91 (65.5%) | 48 (34.5%) |
| 3-Person Household | 45 (45.0%) | 55 (55.0%) |
| 4+ Person Household | 20 (39.2%) | 31 (60.8%) |
| Total Housing Units | 172 (51.8%) | 160 (48.2%) |
Occupancy by Educational Attainment in Mason
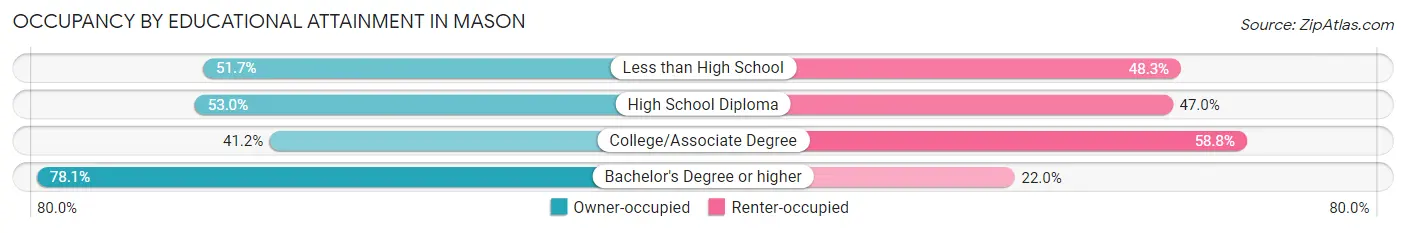
| Household Size | Owner-occupied | Renter-occupied |
| Less than High School | 31 (51.7%) | 29 (48.3%) |
| High School Diploma | 62 (53.0%) | 55 (47.0%) |
| College/Associate Degree | 47 (41.2%) | 67 (58.8%) |
| Bachelor's Degree or higher | 32 (78.0%) | 9 (22.0%) |
Occupancy by Age of Householder in Mason
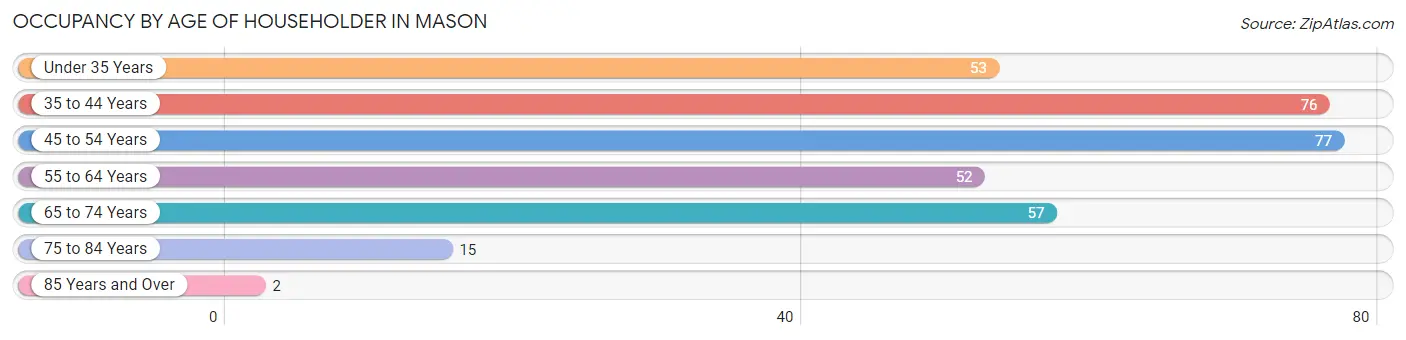
| Age Bracket | # Households | % Households |
| Under 35 Years | 53 | 16.0% |
| 35 to 44 Years | 76 | 22.9% |
| 45 to 54 Years | 77 | 23.2% |
| 55 to 64 Years | 52 | 15.7% |
| 65 to 74 Years | 57 | 17.2% |
| 75 to 84 Years | 15 | 4.5% |
| 85 Years and Over | 2 | 0.6% |
| Total | 332 | 100.0% |
Housing Finances in Mason
Median Income by Occupancy in Mason
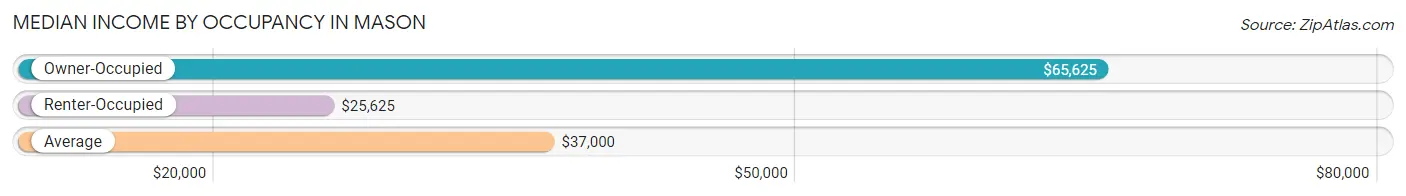
| Occupancy Type | # Households | Median Income |
| Owner-Occupied | 172 (51.8%) | $65,625 |
| Renter-Occupied | 160 (48.2%) | $25,625 |
| Average | 332 (100.0%) | $37,000 |
Occupancy by Householder Income Bracket in Mason
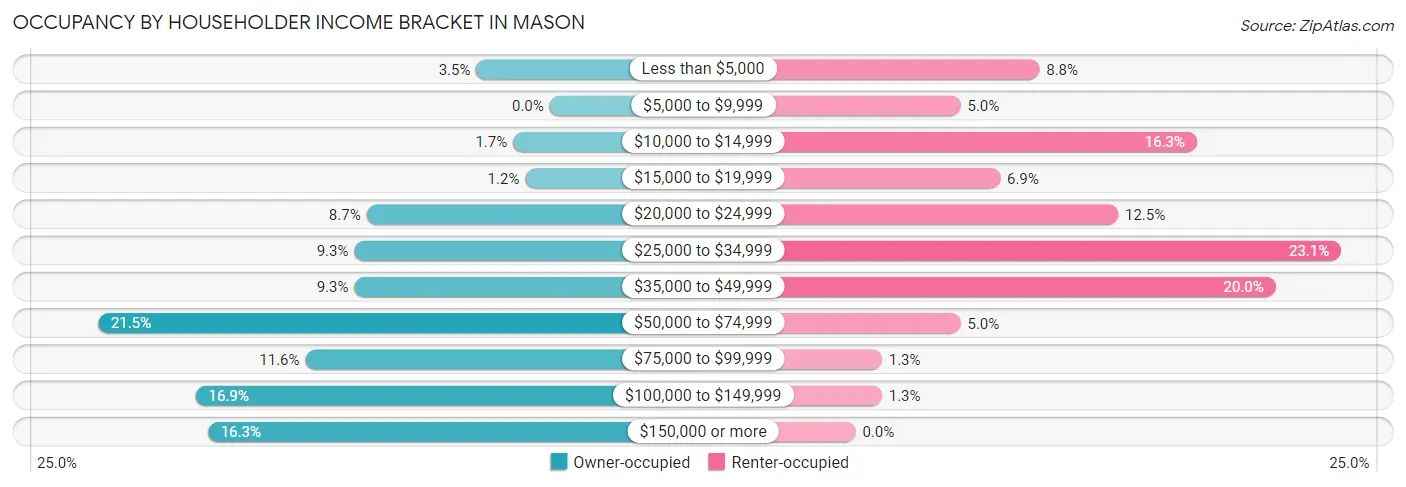
| Income Bracket | Owner-occupied | Renter-occupied |
| Less than $5,000 | 6 (3.5%) | 14 (8.7%) |
| $5,000 to $9,999 | 0 (0.0%) | 8 (5.0%) |
| $10,000 to $14,999 | 3 (1.7%) | 26 (16.3%) |
| $15,000 to $19,999 | 2 (1.2%) | 11 (6.9%) |
| $20,000 to $24,999 | 15 (8.7%) | 20 (12.5%) |
| $25,000 to $34,999 | 16 (9.3%) | 37 (23.1%) |
| $35,000 to $49,999 | 16 (9.3%) | 32 (20.0%) |
| $50,000 to $74,999 | 37 (21.5%) | 8 (5.0%) |
| $75,000 to $99,999 | 20 (11.6%) | 2 (1.3%) |
| $100,000 to $149,999 | 29 (16.9%) | 2 (1.3%) |
| $150,000 or more | 28 (16.3%) | 0 (0.0%) |
| Total | 172 (100.0%) | 160 (100.0%) |
Monthly Housing Cost Tiers in Mason
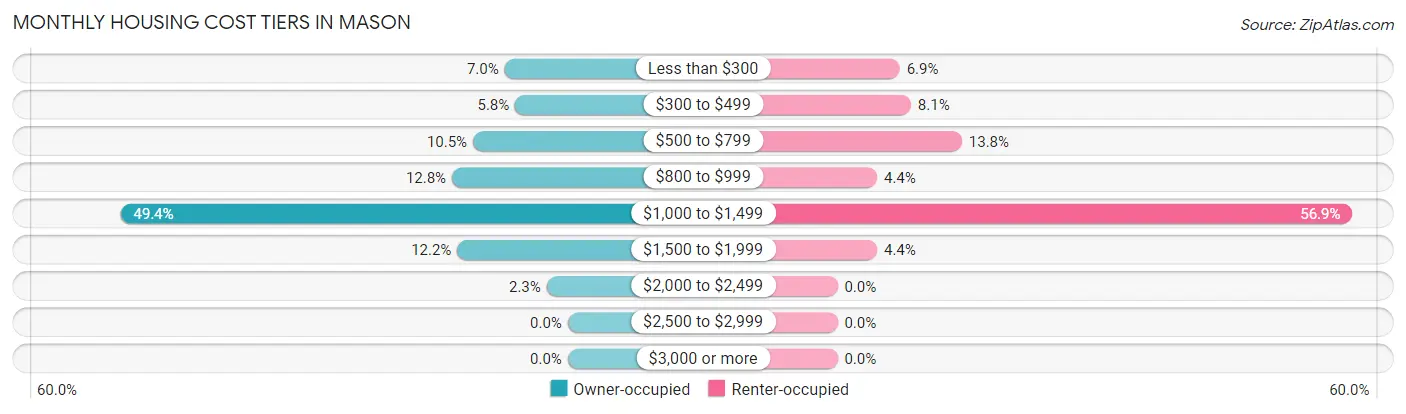
| Monthly Cost | Owner-occupied | Renter-occupied |
| Less than $300 | 12 (7.0%) | 11 (6.9%) |
| $300 to $499 | 10 (5.8%) | 13 (8.1%) |
| $500 to $799 | 18 (10.5%) | 22 (13.8%) |
| $800 to $999 | 22 (12.8%) | 7 (4.4%) |
| $1,000 to $1,499 | 85 (49.4%) | 91 (56.9%) |
| $1,500 to $1,999 | 21 (12.2%) | 7 (4.4%) |
| $2,000 to $2,499 | 4 (2.3%) | 0 (0.0%) |
| $2,500 to $2,999 | 0 (0.0%) | 0 (0.0%) |
| $3,000 or more | 0 (0.0%) | 0 (0.0%) |
| Total | 172 (100.0%) | 160 (100.0%) |
Physical Housing Characteristics in Mason
Housing Structures in Mason
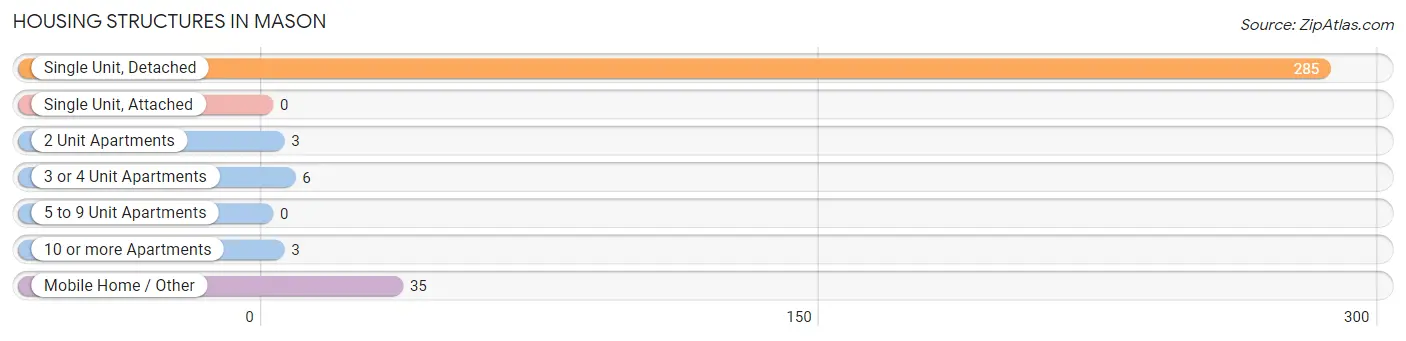
| Structure Type | # Housing Units | % Housing Units |
| Single Unit, Detached | 285 | 85.8% |
| Single Unit, Attached | 0 | 0.0% |
| 2 Unit Apartments | 3 | 0.9% |
| 3 or 4 Unit Apartments | 6 | 1.8% |
| 5 to 9 Unit Apartments | 0 | 0.0% |
| 10 or more Apartments | 3 | 0.9% |
| Mobile Home / Other | 35 | 10.5% |
| Total | 332 | 100.0% |
Housing Structures by Occupancy in Mason
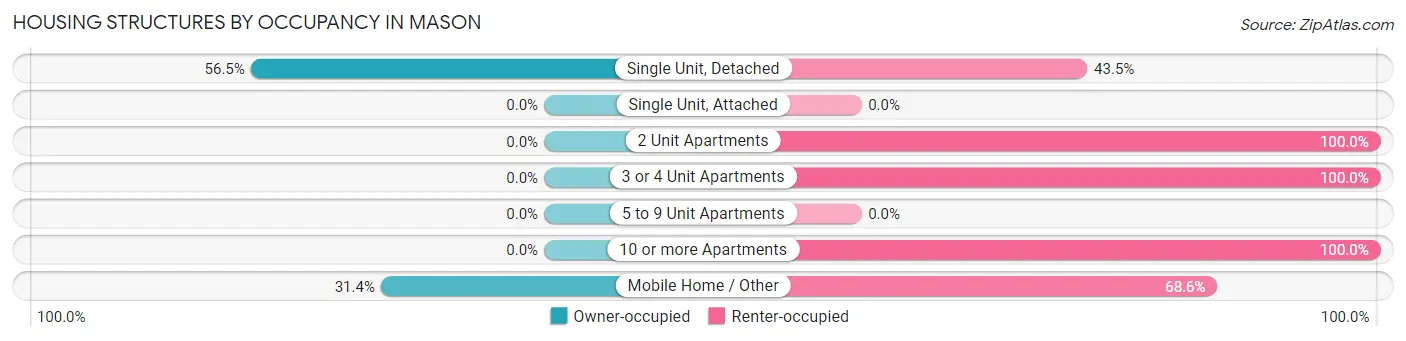
| Structure Type | Owner-occupied | Renter-occupied |
| Single Unit, Detached | 161 (56.5%) | 124 (43.5%) |
| Single Unit, Attached | 0 (0.0%) | 0 (0.0%) |
| 2 Unit Apartments | 0 (0.0%) | 3 (100.0%) |
| 3 or 4 Unit Apartments | 0 (0.0%) | 6 (100.0%) |
| 5 to 9 Unit Apartments | 0 (0.0%) | 0 (0.0%) |
| 10 or more Apartments | 0 (0.0%) | 3 (100.0%) |
| Mobile Home / Other | 11 (31.4%) | 24 (68.6%) |
| Total | 172 (51.8%) | 160 (48.2%) |
Housing Structures by Number of Rooms in Mason
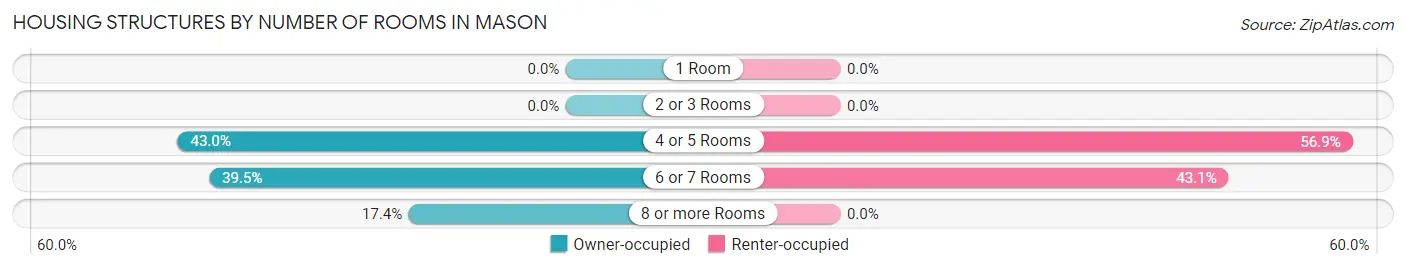
| Number of Rooms | Owner-occupied | Renter-occupied |
| 1 Room | 0 (0.0%) | 0 (0.0%) |
| 2 or 3 Rooms | 0 (0.0%) | 0 (0.0%) |
| 4 or 5 Rooms | 74 (43.0%) | 91 (56.9%) |
| 6 or 7 Rooms | 68 (39.5%) | 69 (43.1%) |
| 8 or more Rooms | 30 (17.4%) | 0 (0.0%) |
| Total | 172 (100.0%) | 160 (100.0%) |
Housing Structure by Heating Type in Mason
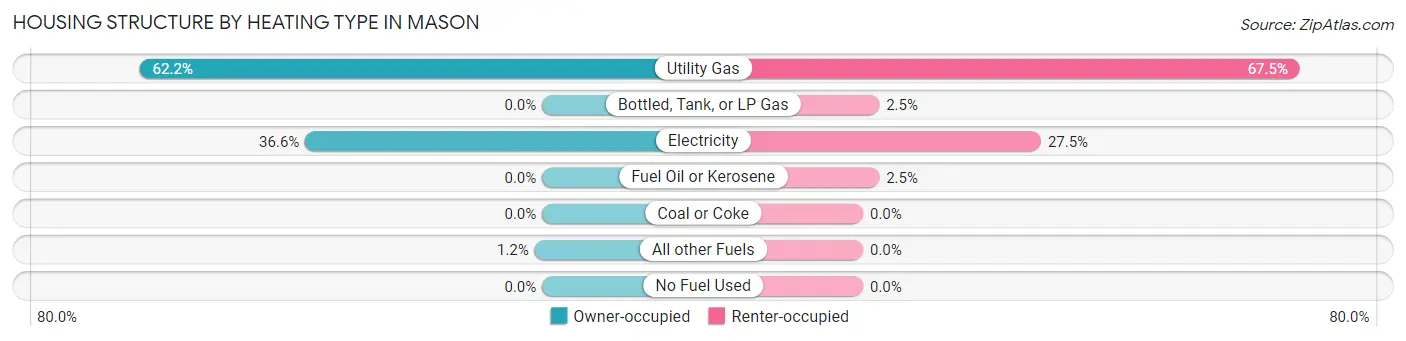
| Heating Type | Owner-occupied | Renter-occupied |
| Utility Gas | 107 (62.2%) | 108 (67.5%) |
| Bottled, Tank, or LP Gas | 0 (0.0%) | 4 (2.5%) |
| Electricity | 63 (36.6%) | 44 (27.5%) |
| Fuel Oil or Kerosene | 0 (0.0%) | 4 (2.5%) |
| Coal or Coke | 0 (0.0%) | 0 (0.0%) |
| All other Fuels | 2 (1.2%) | 0 (0.0%) |
| No Fuel Used | 0 (0.0%) | 0 (0.0%) |
| Total | 172 (100.0%) | 160 (100.0%) |
Household Vehicle Usage in Mason
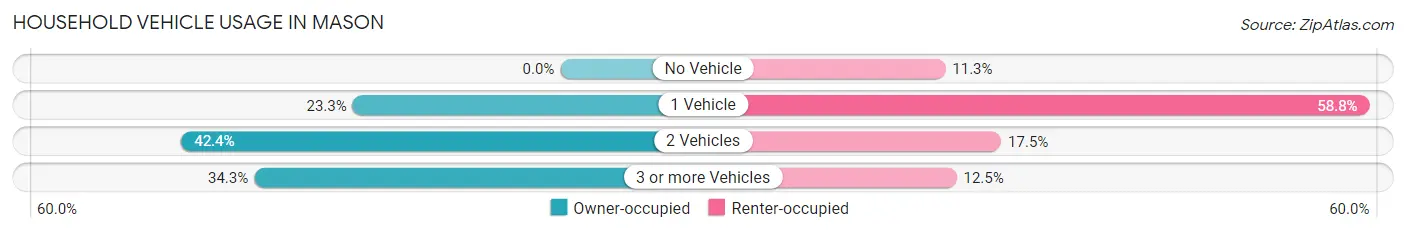
| Vehicles per Household | Owner-occupied | Renter-occupied |
| No Vehicle | 0 (0.0%) | 18 (11.3%) |
| 1 Vehicle | 40 (23.3%) | 94 (58.8%) |
| 2 Vehicles | 73 (42.4%) | 28 (17.5%) |
| 3 or more Vehicles | 59 (34.3%) | 20 (12.5%) |
| Total | 172 (100.0%) | 160 (100.0%) |
Real Estate & Mortgages in Mason
Real Estate and Mortgage Overview in Mason
| Characteristic | Without Mortgage | With Mortgage |
| Housing Units | 36 | 136 |
| Median Property Value | - | - |
| Median Household Income | $145,833 | $14 |
| Monthly Housing Costs | $338 | $0 |
| Real Estate Taxes | $1,143 | $0 |
Property Value by Mortgage Status in Mason
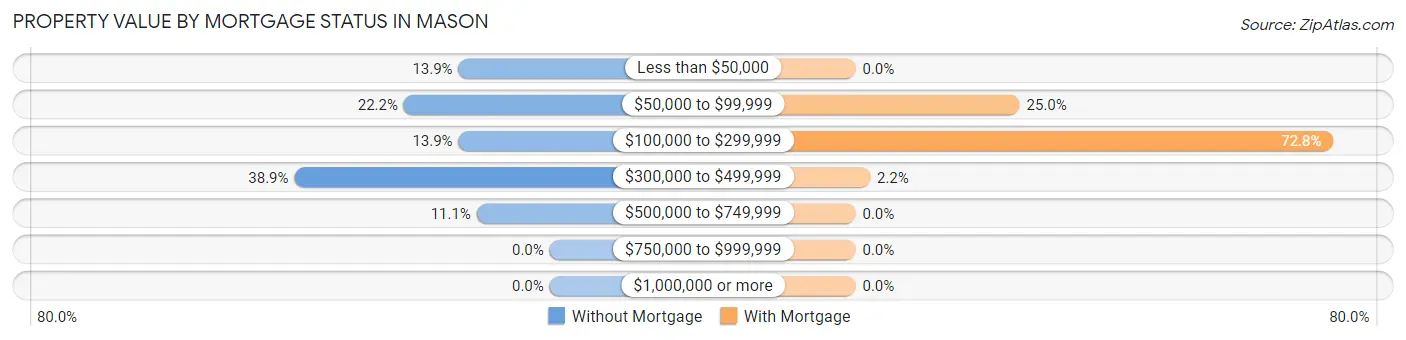
| Property Value | Without Mortgage | With Mortgage |
| Less than $50,000 | 5 (13.9%) | 0 (0.0%) |
| $50,000 to $99,999 | 8 (22.2%) | 34 (25.0%) |
| $100,000 to $299,999 | 5 (13.9%) | 99 (72.8%) |
| $300,000 to $499,999 | 14 (38.9%) | 3 (2.2%) |
| $500,000 to $749,999 | 4 (11.1%) | 0 (0.0%) |
| $750,000 to $999,999 | 0 (0.0%) | 0 (0.0%) |
| $1,000,000 or more | 0 (0.0%) | 0 (0.0%) |
| Total | 36 (100.0%) | 136 (100.0%) |
Household Income by Mortgage Status in Mason
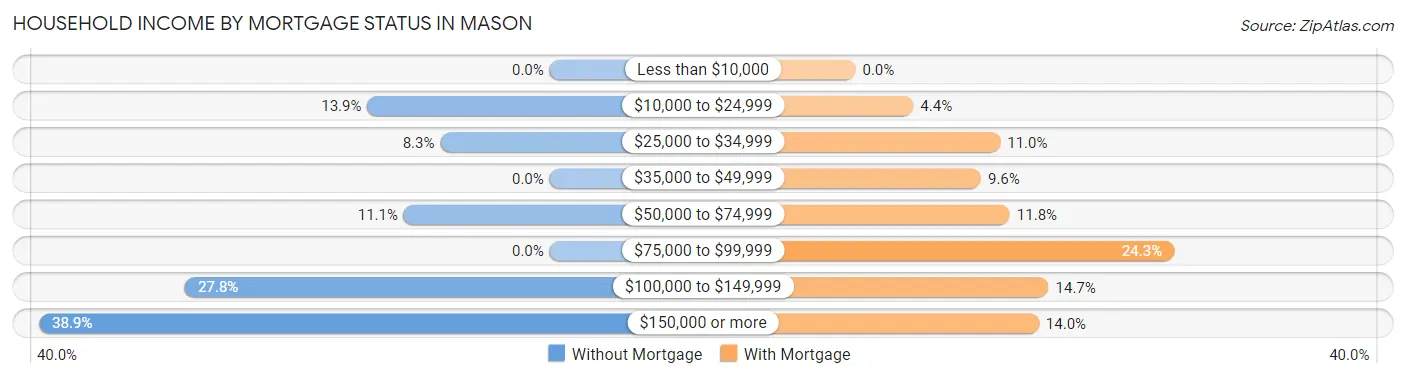
| Household Income | Without Mortgage | With Mortgage |
| Less than $10,000 | 0 (0.0%) | 0 (0.0%) |
| $10,000 to $24,999 | 5 (13.9%) | 6 (4.4%) |
| $25,000 to $34,999 | 3 (8.3%) | 15 (11.0%) |
| $35,000 to $49,999 | 0 (0.0%) | 13 (9.6%) |
| $50,000 to $74,999 | 4 (11.1%) | 16 (11.8%) |
| $75,000 to $99,999 | 0 (0.0%) | 33 (24.3%) |
| $100,000 to $149,999 | 10 (27.8%) | 20 (14.7%) |
| $150,000 or more | 14 (38.9%) | 19 (14.0%) |
| Total | 36 (100.0%) | 136 (100.0%) |
Property Value to Household Income Ratio in Mason
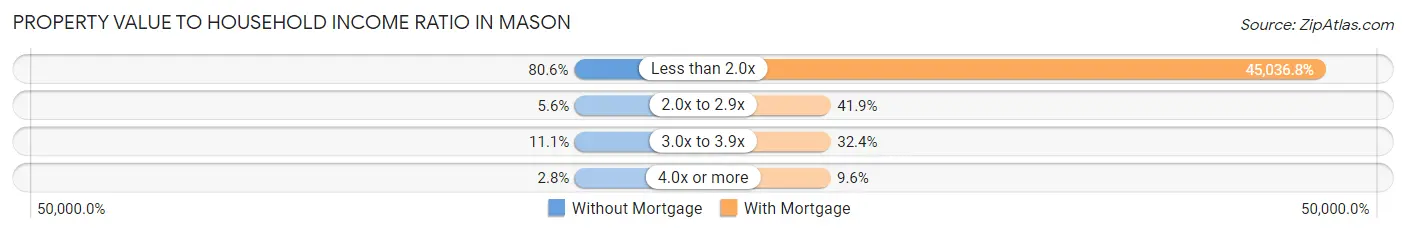
| Value-to-Income Ratio | Without Mortgage | With Mortgage |
| Less than 2.0x | 29 (80.6%) | 61,250 (45,036.8%) |
| 2.0x to 2.9x | 2 (5.6%) | 57 (41.9%) |
| 3.0x to 3.9x | 4 (11.1%) | 44 (32.4%) |
| 4.0x or more | 1 (2.8%) | 13 (9.6%) |
| Total | 36 (100.0%) | 136 (100.0%) |
Real Estate Taxes by Mortgage Status in Mason
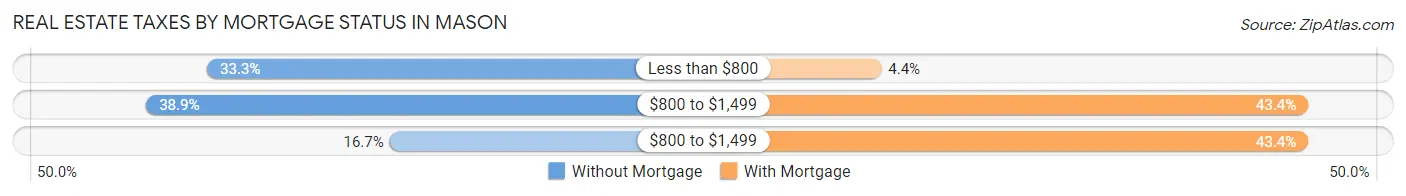
| Property Taxes | Without Mortgage | With Mortgage |
| Less than $800 | 12 (33.3%) | 6 (4.4%) |
| $800 to $1,499 | 14 (38.9%) | 59 (43.4%) |
| $800 to $1,499 | 6 (16.7%) | 59 (43.4%) |
| Total | 36 (100.0%) | 136 (100.0%) |
Health & Disability in Mason
Health Insurance Coverage by Age in Mason
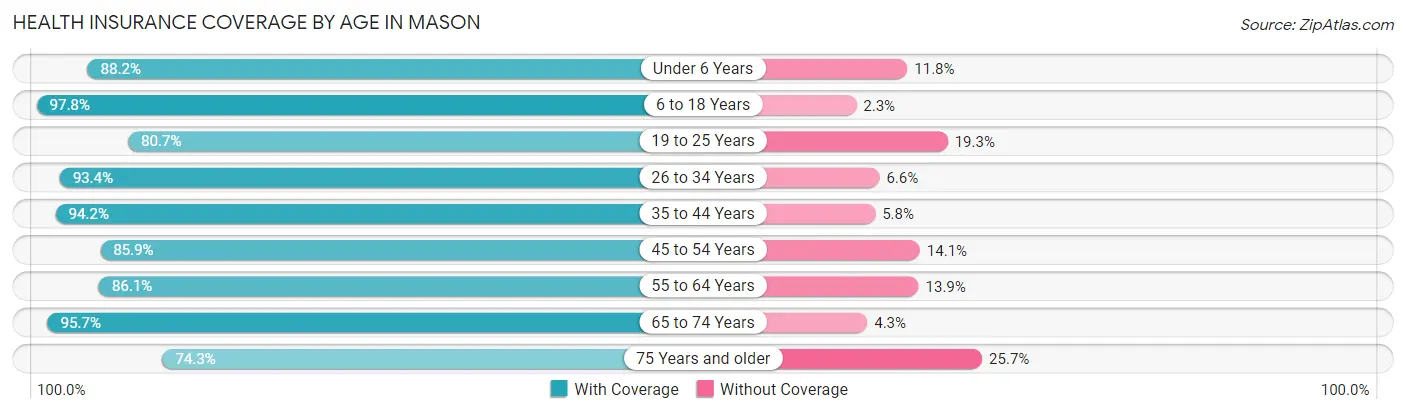
| Age Bracket | With Coverage | Without Coverage |
| Under 6 Years | 45 (88.2%) | 6 (11.8%) |
| 6 to 18 Years | 174 (97.8%) | 4 (2.2%) |
| 19 to 25 Years | 113 (80.7%) | 27 (19.3%) |
| 26 to 34 Years | 57 (93.4%) | 4 (6.6%) |
| 35 to 44 Years | 98 (94.2%) | 6 (5.8%) |
| 45 to 54 Years | 134 (85.9%) | 22 (14.1%) |
| 55 to 64 Years | 87 (86.1%) | 14 (13.9%) |
| 65 to 74 Years | 67 (95.7%) | 3 (4.3%) |
| 75 Years and older | 26 (74.3%) | 9 (25.7%) |
| Total | 801 (89.4%) | 95 (10.6%) |
Health Insurance Coverage by Citizenship Status in Mason
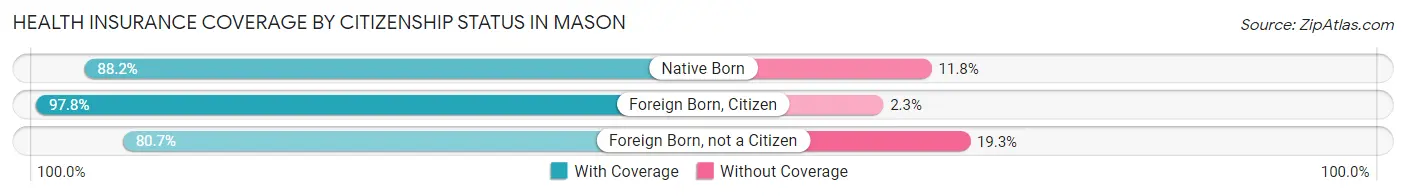
| Citizenship Status | With Coverage | Without Coverage |
| Native Born | 45 (88.2%) | 6 (11.8%) |
| Foreign Born, Citizen | 174 (97.8%) | 4 (2.2%) |
| Foreign Born, not a Citizen | 113 (80.7%) | 27 (19.3%) |
Health Insurance Coverage by Household Income in Mason
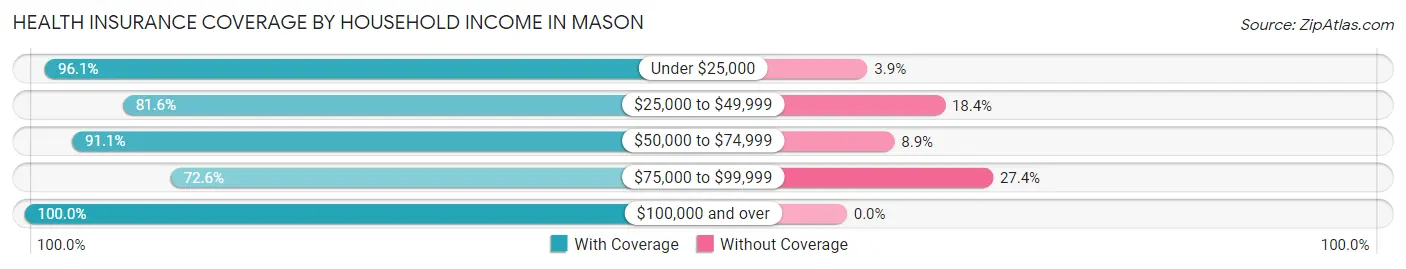
| Household Income | With Coverage | Without Coverage |
| Under $25,000 | 199 (96.1%) | 8 (3.9%) |
| $25,000 to $49,999 | 244 (81.6%) | 55 (18.4%) |
| $50,000 to $74,999 | 92 (91.1%) | 9 (8.9%) |
| $75,000 to $99,999 | 61 (72.6%) | 23 (27.4%) |
| $100,000 and over | 205 (100.0%) | 0 (0.0%) |
Public vs Private Health Insurance Coverage by Age in Mason
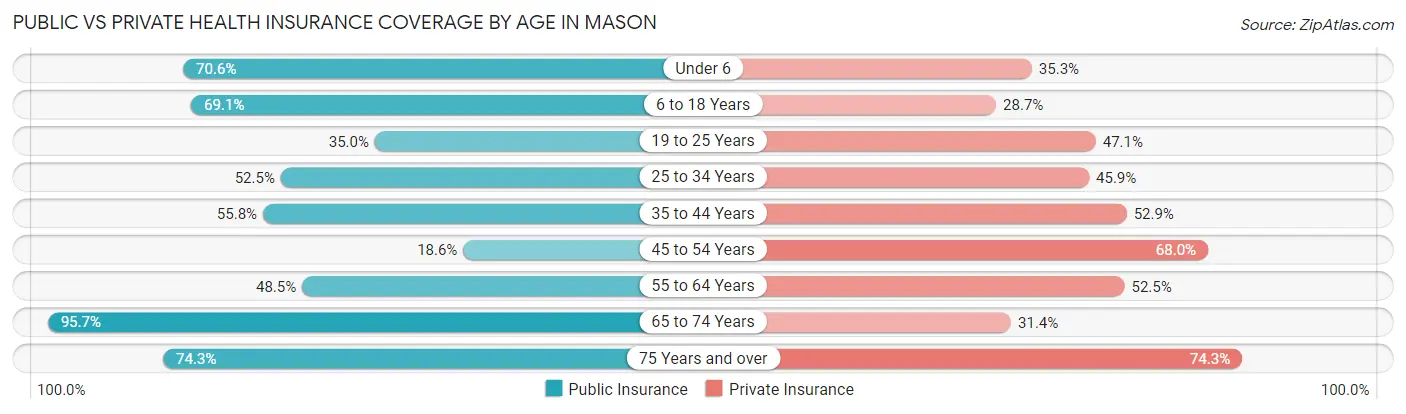
| Age Bracket | Public Insurance | Private Insurance |
| Under 6 | 36 (70.6%) | 18 (35.3%) |
| 6 to 18 Years | 123 (69.1%) | 51 (28.6%) |
| 19 to 25 Years | 49 (35.0%) | 66 (47.1%) |
| 25 to 34 Years | 32 (52.5%) | 28 (45.9%) |
| 35 to 44 Years | 58 (55.8%) | 55 (52.9%) |
| 45 to 54 Years | 29 (18.6%) | 106 (67.9%) |
| 55 to 64 Years | 49 (48.5%) | 53 (52.5%) |
| 65 to 74 Years | 67 (95.7%) | 22 (31.4%) |
| 75 Years and over | 26 (74.3%) | 26 (74.3%) |
| Total | 469 (52.3%) | 425 (47.4%) |
Disability Status by Sex by Age in Mason
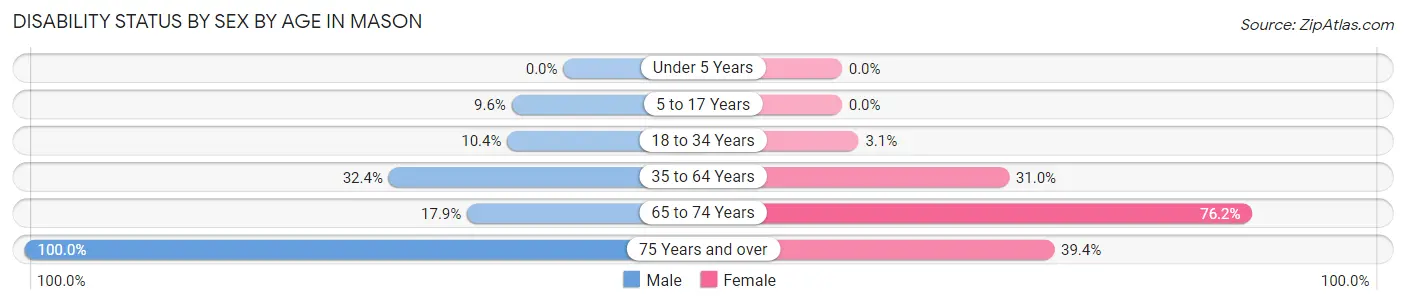
| Age Bracket | Male | Female |
| Under 5 Years | 0 (0.0%) | 0 (0.0%) |
| 5 to 17 Years | 7 (9.6%) | 0 (0.0%) |
| 18 to 34 Years | 13 (10.4%) | 3 (3.1%) |
| 35 to 64 Years | 47 (32.4%) | 67 (31.0%) |
| 65 to 74 Years | 5 (17.9%) | 32 (76.2%) |
| 75 Years and over | 2 (100.0%) | 13 (39.4%) |
Disability Class by Sex by Age in Mason
Disability Class: Hearing Difficulty
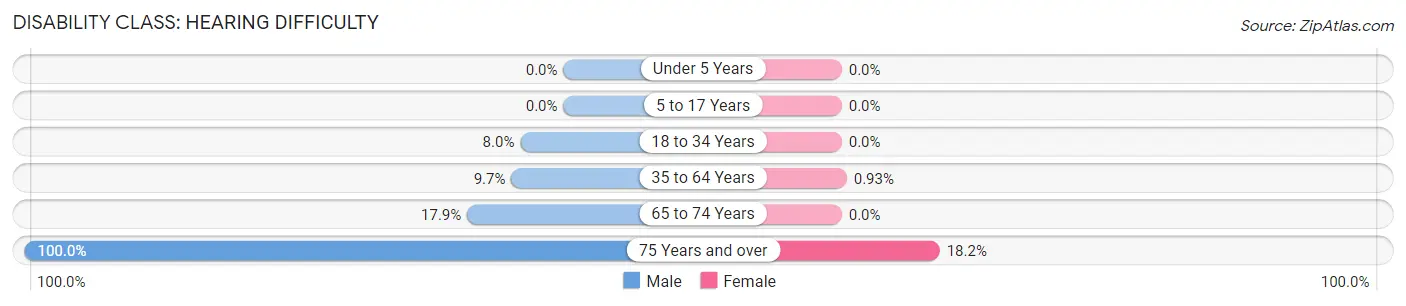
| Age Bracket | Male | Female |
| Under 5 Years | 0 (0.0%) | 0 (0.0%) |
| 5 to 17 Years | 0 (0.0%) | 0 (0.0%) |
| 18 to 34 Years | 10 (8.0%) | 0 (0.0%) |
| 35 to 64 Years | 14 (9.7%) | 2 (0.9%) |
| 65 to 74 Years | 5 (17.9%) | 0 (0.0%) |
| 75 Years and over | 2 (100.0%) | 6 (18.2%) |
Disability Class: Vision Difficulty
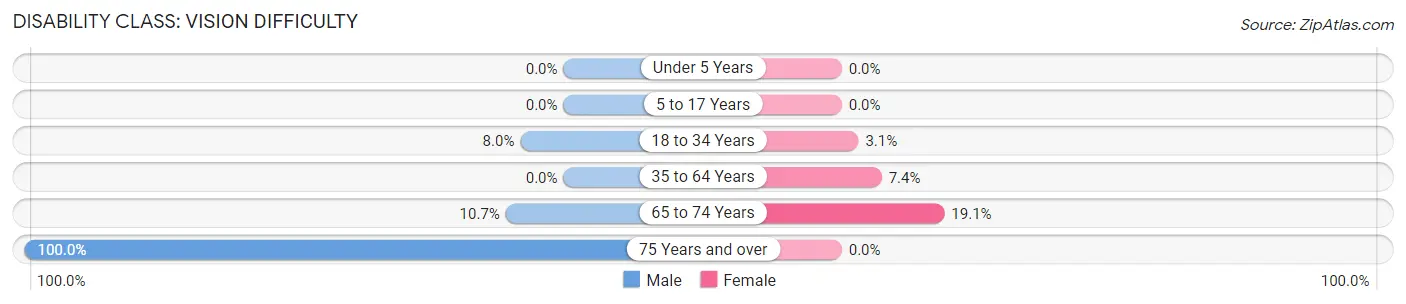
| Age Bracket | Male | Female |
| Under 5 Years | 0 (0.0%) | 0 (0.0%) |
| 5 to 17 Years | 0 (0.0%) | 0 (0.0%) |
| 18 to 34 Years | 10 (8.0%) | 3 (3.1%) |
| 35 to 64 Years | 0 (0.0%) | 16 (7.4%) |
| 65 to 74 Years | 3 (10.7%) | 8 (19.1%) |
| 75 Years and over | 2 (100.0%) | 0 (0.0%) |
Disability Class: Cognitive Difficulty
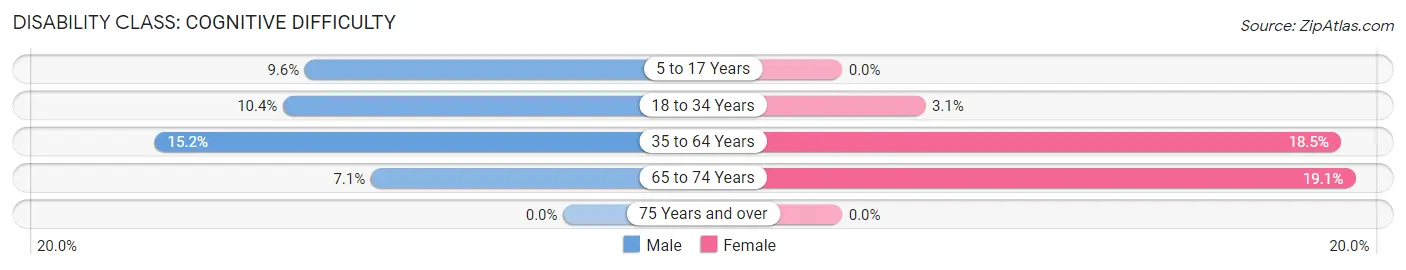
| Age Bracket | Male | Female |
| 5 to 17 Years | 7 (9.6%) | 0 (0.0%) |
| 18 to 34 Years | 13 (10.4%) | 3 (3.1%) |
| 35 to 64 Years | 22 (15.2%) | 40 (18.5%) |
| 65 to 74 Years | 2 (7.1%) | 8 (19.1%) |
| 75 Years and over | 0 (0.0%) | 0 (0.0%) |
Disability Class: Ambulatory Difficulty
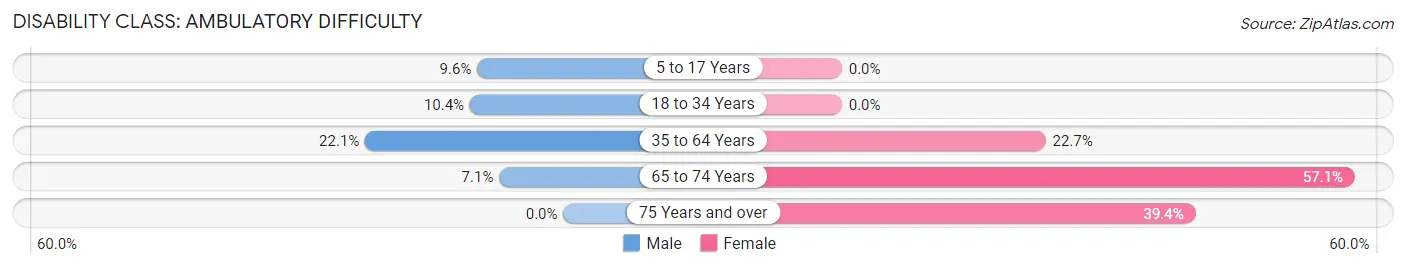
| Age Bracket | Male | Female |
| 5 to 17 Years | 7 (9.6%) | 0 (0.0%) |
| 18 to 34 Years | 13 (10.4%) | 0 (0.0%) |
| 35 to 64 Years | 32 (22.1%) | 49 (22.7%) |
| 65 to 74 Years | 2 (7.1%) | 24 (57.1%) |
| 75 Years and over | 0 (0.0%) | 13 (39.4%) |
Disability Class: Self-Care Difficulty
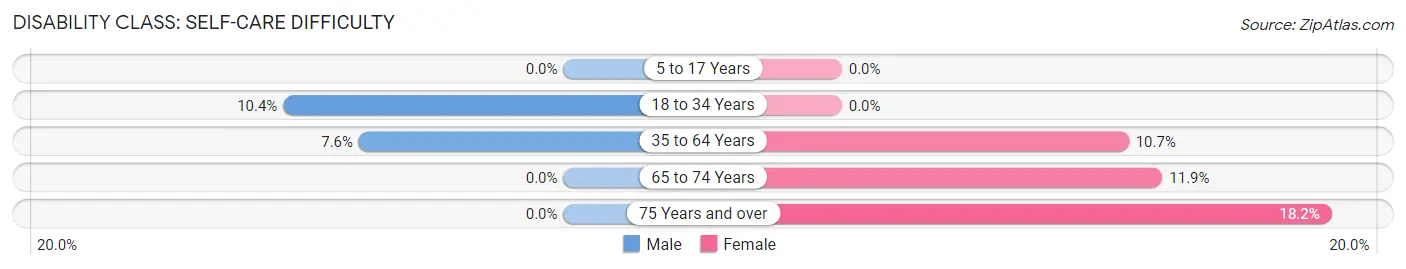
| Age Bracket | Male | Female |
| 5 to 17 Years | 0 (0.0%) | 0 (0.0%) |
| 18 to 34 Years | 13 (10.4%) | 0 (0.0%) |
| 35 to 64 Years | 11 (7.6%) | 23 (10.6%) |
| 65 to 74 Years | 0 (0.0%) | 5 (11.9%) |
| 75 Years and over | 0 (0.0%) | 6 (18.2%) |
Technology Access in Mason
Computing Device Access in Mason
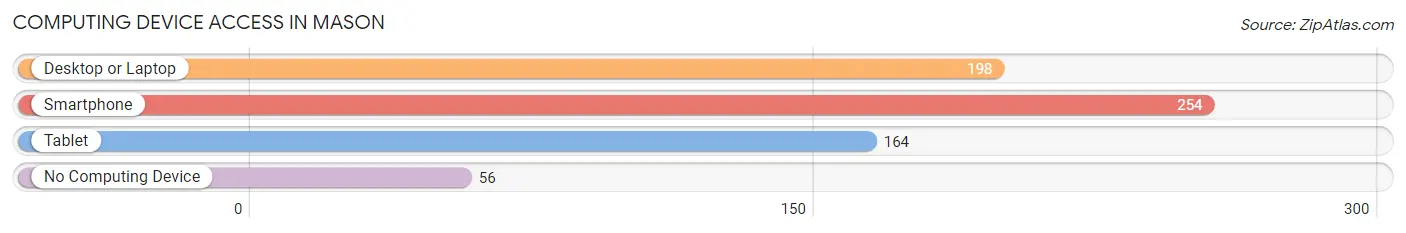
| Device Type | # Households | % Households |
| Desktop or Laptop | 198 | 59.6% |
| Smartphone | 254 | 76.5% |
| Tablet | 164 | 49.4% |
| No Computing Device | 56 | 16.9% |
| Total | 332 | 100.0% |
Internet Access in Mason
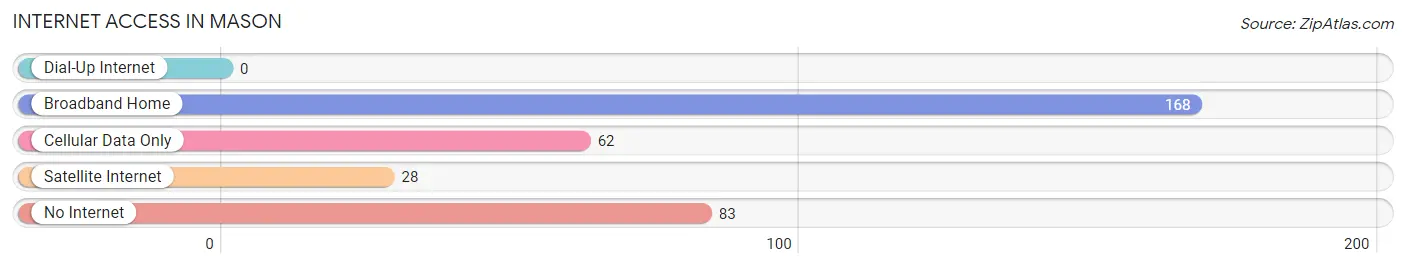
| Internet Type | # Households | % Households |
| Dial-Up Internet | 0 | 0.0% |
| Broadband Home | 168 | 50.6% |
| Cellular Data Only | 62 | 18.7% |
| Satellite Internet | 28 | 8.4% |
| No Internet | 83 | 25.0% |
| Total | 332 | 100.0% |
Mason Summary
Mason is a small town located in the state of Tennessee, in the United States of America. It is situated in the southwestern part of the state, in the county of Tipton. The town has a population of approximately 1,500 people, according to the 2010 census.
Geography
Mason is located in the southwestern part of Tennessee, in the county of Tipton. It is situated at an elevation of approximately 500 feet above sea level. The town is located on the banks of the Mississippi River, and is surrounded by rolling hills and forests. The climate in Mason is humid subtropical, with hot summers and mild winters.
Economy
Mason’s economy is largely based on agriculture and tourism. The town is home to several farms, which produce a variety of crops, including corn, soybeans, cotton, and wheat. The town also has a number of small businesses, including restaurants, shops, and other services. Tourism is also an important part of the local economy, as the town is located near several popular attractions, such as the Great Smoky Mountains National Park and the Natchez Trace Parkway.
Demographics
According to the 2010 census, the population of Mason was 1,500. The racial makeup of the town was 95.3% White, 2.3% African American, 0.7% Native American, 0.3% Asian, and 1.3% from other races. The median household income was $37,500, and the median family income was $45,000. The per capita income was $18,000.
History
Mason was founded in 1820 by a group of settlers from North Carolina. The town was named after the Mason family, who were among the first settlers. The town grew slowly, but steadily, and by the mid-19th century, it had become an important trading center for the surrounding area. The town was also home to several churches, schools, and other businesses.
In the late 19th century, Mason was connected to the rest of the state by the Memphis and Charleston Railroad. This allowed the town to become more connected to the rest of the state, and it also allowed for the growth of the local economy.
In the early 20th century, Mason was home to several factories, including a cotton mill and a furniture factory. These factories provided employment for many of the town’s residents. The town also had a number of stores, restaurants, and other businesses.
Today, Mason is a small, rural town with a population of approximately 1,500 people. The town is still largely agricultural, and it is home to several farms and businesses. The town is also home to several churches, schools, and other businesses. Mason is a popular tourist destination, as it is located near several popular attractions, such as the Great Smoky Mountains National Park and the Natchez Trace Parkway.
Common Questions
What is Per Capita Income in Mason?
Per Capita income in Mason is $19,294.
What is the Median Family Income in Mason?
Median Family Income in Mason is $47,639.
What is the Median Household income in Mason?
Median Household Income in Mason is $37,000.
What is Income or Wage Gap in Mason?
Income or Wage Gap in Mason is 30.8%.
Women in Mason earn 69.2 cents for every dollar earned by a man.
What is Inequality or Gini Index in Mason?
Inequality or Gini Index in Mason is 0.49.
What is the Total Population of Mason?
Total Population of Mason is 1,221.
What is the Total Male Population of Mason?
Total Male Population of Mason is 656.
What is the Total Female Population of Mason?
Total Female Population of Mason is 565.
What is the Ratio of Males per 100 Females in Mason?
There are 116.11 Males per 100 Females in Mason.
What is the Ratio of Females per 100 Males in Mason?
There are 86.13 Females per 100 Males in Mason.
What is the Median Population Age in Mason?
Median Population Age in Mason is 36.7 Years.
What is the Average Family Size in Mason
Average Family Size in Mason is 2.9 People.
What is the Average Household Size in Mason
Average Household Size in Mason is 2.7 People.
How Large is the Labor Force in Mason?
There are 404 People in the Labor Forcein in Mason.
What is the Percentage of People in the Labor Force in Mason?
39.4% of People are in the Labor Force in Mason.
What is the Unemployment Rate in Mason?
Unemployment Rate in Mason is 12.1%.