Parker s Crossroads, TN Map & Demographics
Parker s Crossroads Map
Parker s Crossroads Overview
$28,561
PER CAPITA INCOME
$68,333
AVG FAMILY INCOME
$67,440
AVG HOUSEHOLD INCOME
33.6%
WAGE / INCOME GAP [ % ]
66.4¢/ $1
WAGE / INCOME GAP [ $ ]
0.32
INEQUALITY / GINI INDEX
598
TOTAL POPULATION
341
MALE POPULATION
257
FEMALE POPULATION
132.68
MALES / 100 FEMALES
75.37
FEMALES / 100 MALES
40.3
MEDIAN AGE
3.1
AVG FAMILY SIZE
2.9
AVG HOUSEHOLD SIZE
187
LABOR FORCE [ PEOPLE ]
35.9%
PERCENT IN LABOR FORCE
Income in Parker s Crossroads
Income Overview in Parker s Crossroads
Per Capita Income in Parker s Crossroads is $28,561, while median incomes of families and households are $68,333 and $67,440 respectively.
| Characteristic | Number | Measure |
| Per Capita Income | 598 | $28,561 |
| Median Family Income | 168 | $68,333 |
| Mean Family Income | 168 | $83,234 |
| Median Household Income | 209 | $67,440 |
| Mean Household Income | 209 | $77,311 |
| Income Deficit | 168 | $0 |
| Wage / Income Gap (%) | 598 | 33.55% |
| Wage / Income Gap ($) | 598 | 66.45¢ per $1 |
| Gini / Inequality Index | 598 | 0.32 |
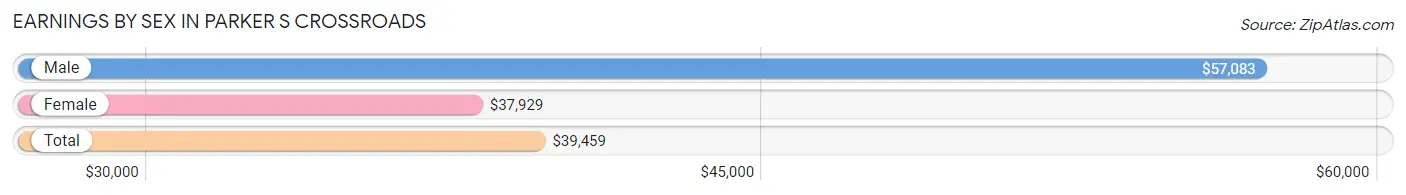
Earnings by Sex in Parker s Crossroads
Average Earnings in Parker s Crossroads are $39,459, $57,083 for men and $37,929 for women, a difference of 33.6%.
| Sex | Number | Average Earnings |
| Male | 88 (44.0%) | $57,083 |
| Female | 112 (56.0%) | $37,929 |
| Total | 200 (100.0%) | $39,459 |
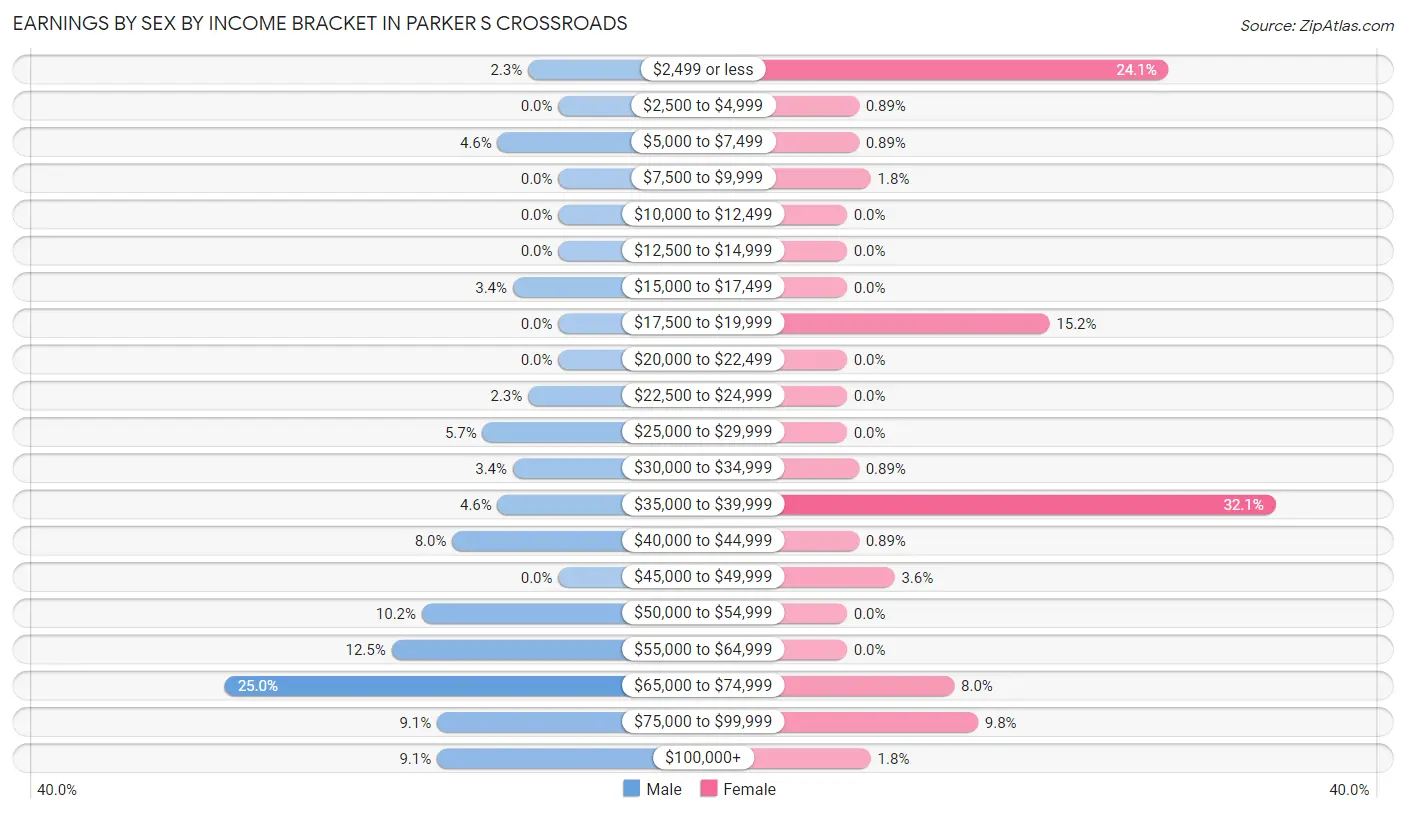
Earnings by Sex by Income Bracket in Parker s Crossroads
The most common earnings brackets in Parker s Crossroads are $65,000 to $74,999 for men (22 | 25.0%) and $35,000 to $39,999 for women (36 | 32.1%).
| Income | Male | Female |
| $2,499 or less | 2 (2.3%) | 27 (24.1%) |
| $2,500 to $4,999 | 0 (0.0%) | 1 (0.9%) |
| $5,000 to $7,499 | 4 (4.5%) | 1 (0.9%) |
| $7,500 to $9,999 | 0 (0.0%) | 2 (1.8%) |
| $10,000 to $12,499 | 0 (0.0%) | 0 (0.0%) |
| $12,500 to $14,999 | 0 (0.0%) | 0 (0.0%) |
| $15,000 to $17,499 | 3 (3.4%) | 0 (0.0%) |
| $17,500 to $19,999 | 0 (0.0%) | 17 (15.2%) |
| $20,000 to $22,499 | 0 (0.0%) | 0 (0.0%) |
| $22,500 to $24,999 | 2 (2.3%) | 0 (0.0%) |
| $25,000 to $29,999 | 5 (5.7%) | 0 (0.0%) |
| $30,000 to $34,999 | 3 (3.4%) | 1 (0.9%) |
| $35,000 to $39,999 | 4 (4.5%) | 36 (32.1%) |
| $40,000 to $44,999 | 7 (8.0%) | 1 (0.9%) |
| $45,000 to $49,999 | 0 (0.0%) | 4 (3.6%) |
| $50,000 to $54,999 | 9 (10.2%) | 0 (0.0%) |
| $55,000 to $64,999 | 11 (12.5%) | 0 (0.0%) |
| $65,000 to $74,999 | 22 (25.0%) | 9 (8.0%) |
| $75,000 to $99,999 | 8 (9.1%) | 11 (9.8%) |
| $100,000+ | 8 (9.1%) | 2 (1.8%) |
| Total | 88 (100.0%) | 112 (100.0%) |
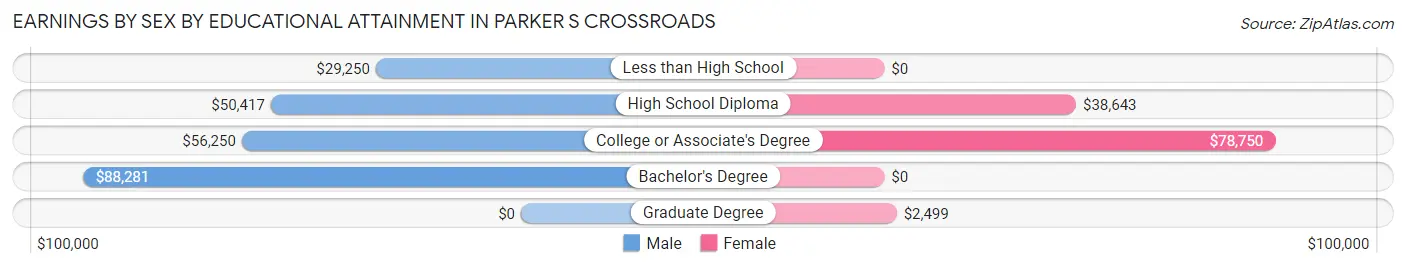
Earnings by Sex by Educational Attainment in Parker s Crossroads
Average earnings in Parker s Crossroads are $53,750 for men and $38,964 for women, a difference of 27.5%. Men with an educational attainment of bachelor's degree enjoy the highest average annual earnings of $88,281, while those with less than high school education earn the least with $29,250. Women with an educational attainment of college or associate's degree earn the most with the average annual earnings of $78,750, while those with graduate degree education have the smallest earnings of $2,499.
| Educational Attainment | Male Income | Female Income |
| Less than High School | $29,250 | $0 |
| High School Diploma | $50,417 | $38,643 |
| College or Associate's Degree | $56,250 | $78,750 |
| Bachelor's Degree | $88,281 | $0 |
| Graduate Degree | - | - |
| Total | $53,750 | $38,964 |
Family Income in Parker s Crossroads
Family Income Brackets in Parker s Crossroads
According to the Parker s Crossroads family income data, there are 60 families falling into the $50,000 to $74,999 income range, which is the most common income bracket and makes up 35.7% of all families.
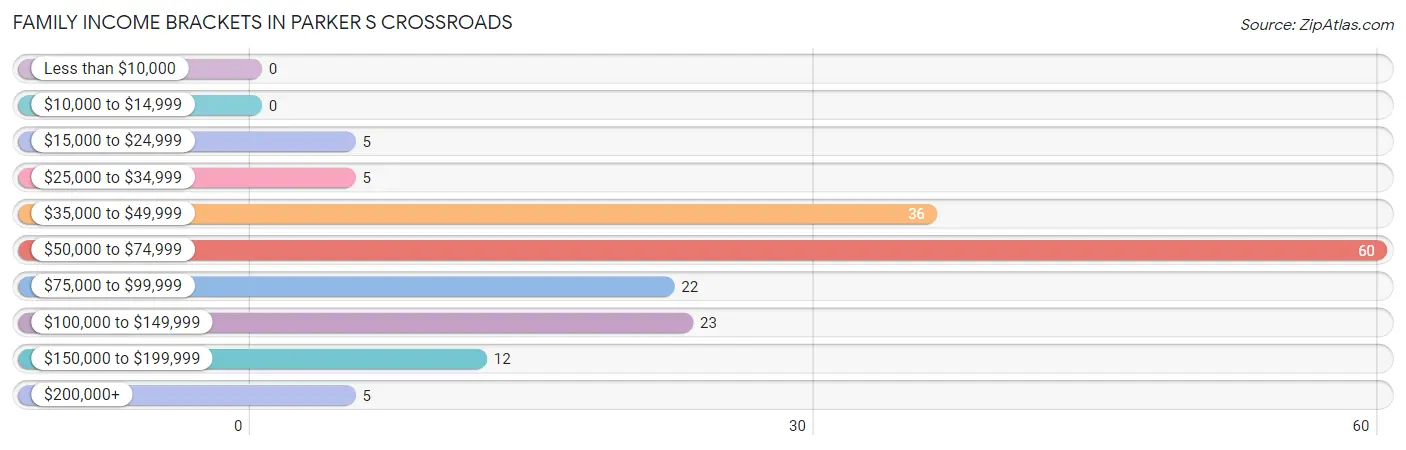
| Income Bracket | # Families | % Families |
| Less than $10,000 | 0 | 0.0% |
| $10,000 to $14,999 | 0 | 0.0% |
| $15,000 to $24,999 | 5 | 3.0% |
| $25,000 to $34,999 | 5 | 3.0% |
| $35,000 to $49,999 | 36 | 21.4% |
| $50,000 to $74,999 | 60 | 35.7% |
| $75,000 to $99,999 | 22 | 13.1% |
| $100,000 to $149,999 | 23 | 13.7% |
| $150,000 to $199,999 | 12 | 7.1% |
| $200,000+ | 5 | 3.0% |
Family Income by Famaliy Size in Parker s Crossroads
2-person families (73 | 43.4%) account for the highest median family income in Parker s Crossroads with $98,438 per family, while 2-person families (73 | 43.4%) have the highest median income of $49,219 per family member.
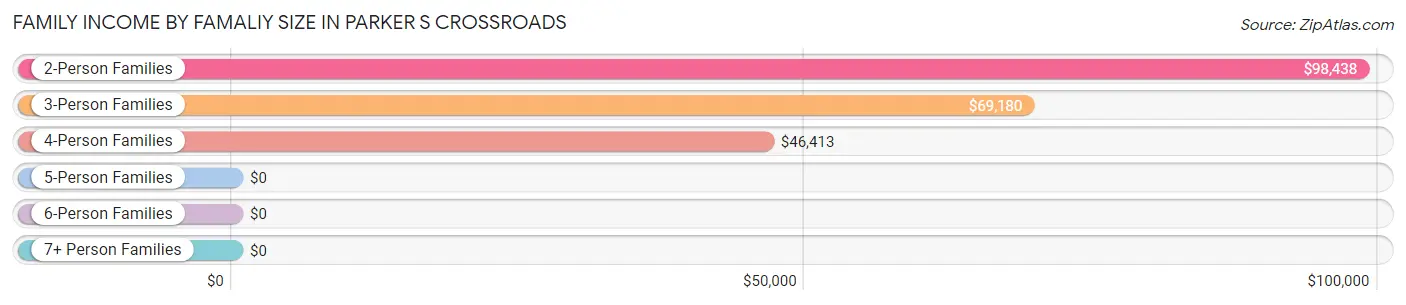
| Income Bracket | # Families | Median Income |
| 2-Person Families | 73 (43.4%) | $98,438 |
| 3-Person Families | 63 (37.5%) | $69,180 |
| 4-Person Families | 26 (15.5%) | $46,413 |
| 5-Person Families | 6 (3.6%) | $0 |
| 6-Person Families | 0 (0.0%) | $0 |
| 7+ Person Families | 0 (0.0%) | $0 |
| Total | 168 (100.0%) | $68,333 |
Family Income by Number of Earners in Parker s Crossroads
The median family income in Parker s Crossroads is $68,333, with families comprising 2 earners (22) having the highest median family income of $120,500, while families with no earners (70) have the lowest median family income of $47,174, accounting for 13.1% and 41.7% of families, respectively.
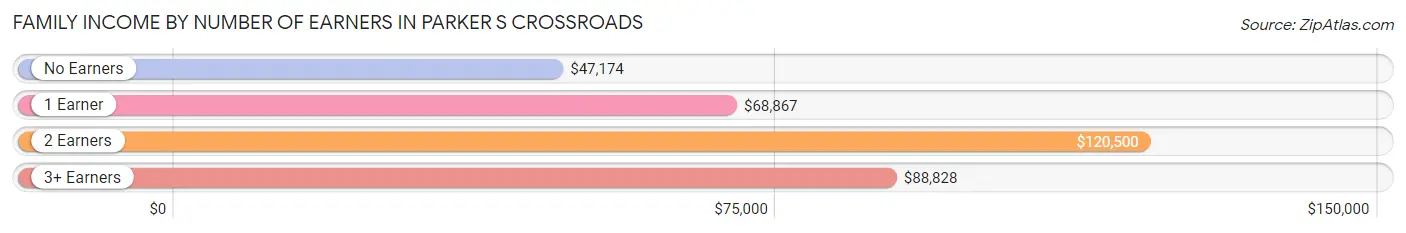
| Number of Earners | # Families | Median Income |
| No Earners | 70 (41.7%) | $47,174 |
| 1 Earner | 57 (33.9%) | $68,867 |
| 2 Earners | 22 (13.1%) | $120,500 |
| 3+ Earners | 19 (11.3%) | $88,828 |
| Total | 168 (100.0%) | $68,333 |
Household Income in Parker s Crossroads
Household Income Brackets in Parker s Crossroads
With 66 households falling in the category, the $50,000 to $74,999 income range is the most frequent in Parker s Crossroads, accounting for 31.6% of all households.
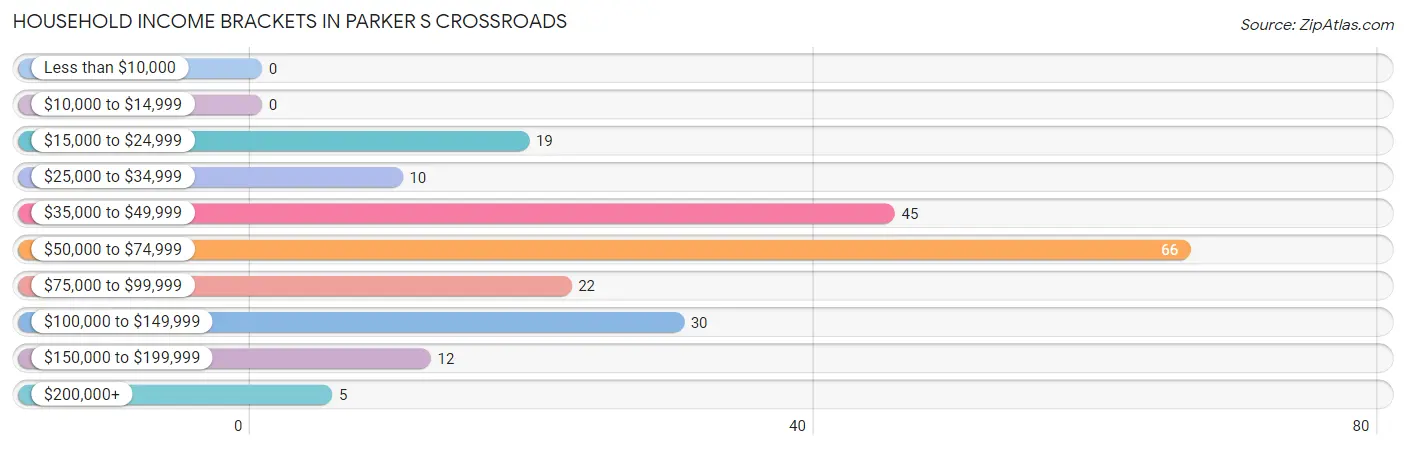
| Income Bracket | # Households | % Households |
| Less than $10,000 | 0 | 0.0% |
| $10,000 to $14,999 | 0 | 0.0% |
| $15,000 to $24,999 | 19 | 9.1% |
| $25,000 to $34,999 | 10 | 4.8% |
| $35,000 to $49,999 | 45 | 21.5% |
| $50,000 to $74,999 | 66 | 31.6% |
| $75,000 to $99,999 | 22 | 10.5% |
| $100,000 to $149,999 | 30 | 14.4% |
| $150,000 to $199,999 | 12 | 5.7% |
| $200,000+ | 5 | 2.4% |
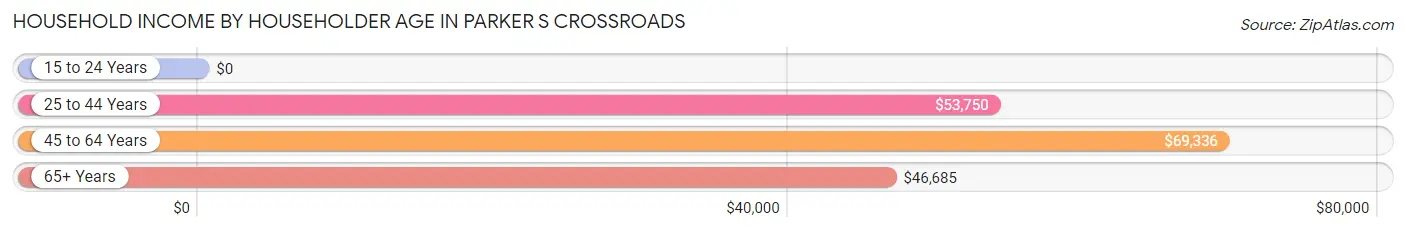
Household Income by Householder Age in Parker s Crossroads
The median household income in Parker s Crossroads is $67,440, with the highest median household income of $69,336 found in the 45 to 64 years age bracket for the primary householder. A total of 55 households (26.3%) fall into this category. Meanwhile, the 15 to 24 years age bracket for the primary householder has the lowest median household income of $0, with 21 households (10.1%) in this group.
| Income Bracket | # Households | Median Income |
| 15 to 24 Years | 21 (10.1%) | $0 |
| 25 to 44 Years | 30 (14.3%) | $53,750 |
| 45 to 64 Years | 55 (26.3%) | $69,336 |
| 65+ Years | 103 (49.3%) | $46,685 |
| Total | 209 (100.0%) | $67,440 |
Poverty in Parker s Crossroads
Income Below Poverty by Sex and Age in Parker s Crossroads
With 1.2% poverty level for males and 16.7% for females among the residents of Parker s Crossroads, 25 to 34 year old males and 6 to 11 year old females are the most vulnerable to poverty, with 2 males (15.4%) and 7 females (100.0%) in their respective age groups living below the poverty level.
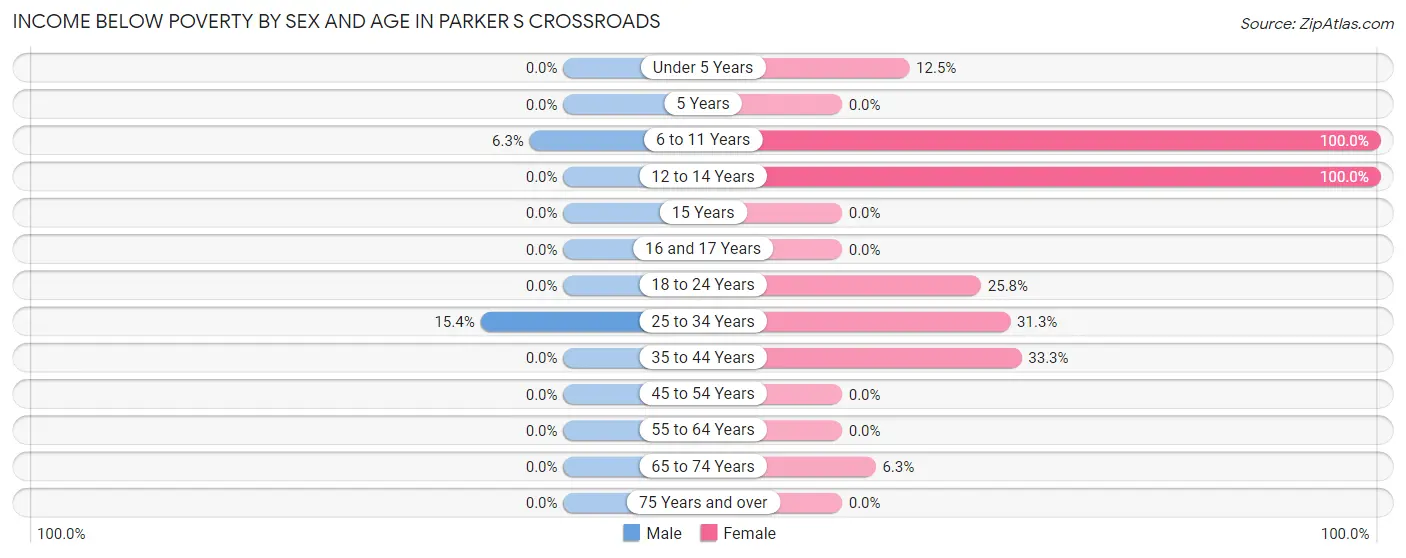
| Age Bracket | Male | Female |
| Under 5 Years | 0 (0.0%) | 2 (12.5%) |
| 5 Years | 0 (0.0%) | 0 (0.0%) |
| 6 to 11 Years | 2 (6.2%) | 7 (100.0%) |
| 12 to 14 Years | 0 (0.0%) | 4 (100.0%) |
| 15 Years | 0 (0.0%) | 0 (0.0%) |
| 16 and 17 Years | 0 (0.0%) | 0 (0.0%) |
| 18 to 24 Years | 0 (0.0%) | 16 (25.8%) |
| 25 to 34 Years | 2 (15.4%) | 5 (31.2%) |
| 35 to 44 Years | 0 (0.0%) | 5 (33.3%) |
| 45 to 54 Years | 0 (0.0%) | 0 (0.0%) |
| 55 to 64 Years | 0 (0.0%) | 0 (0.0%) |
| 65 to 74 Years | 0 (0.0%) | 3 (6.2%) |
| 75 Years and over | 0 (0.0%) | 0 (0.0%) |
| Total | 4 (1.2%) | 42 (16.7%) |
Income Above Poverty by Sex and Age in Parker s Crossroads
According to the poverty statistics in Parker s Crossroads, males aged 12 to 14 years and females aged 16 and 17 years are the age groups that are most secure financially, with 100.0% of males and 100.0% of females in these age groups living above the poverty line.
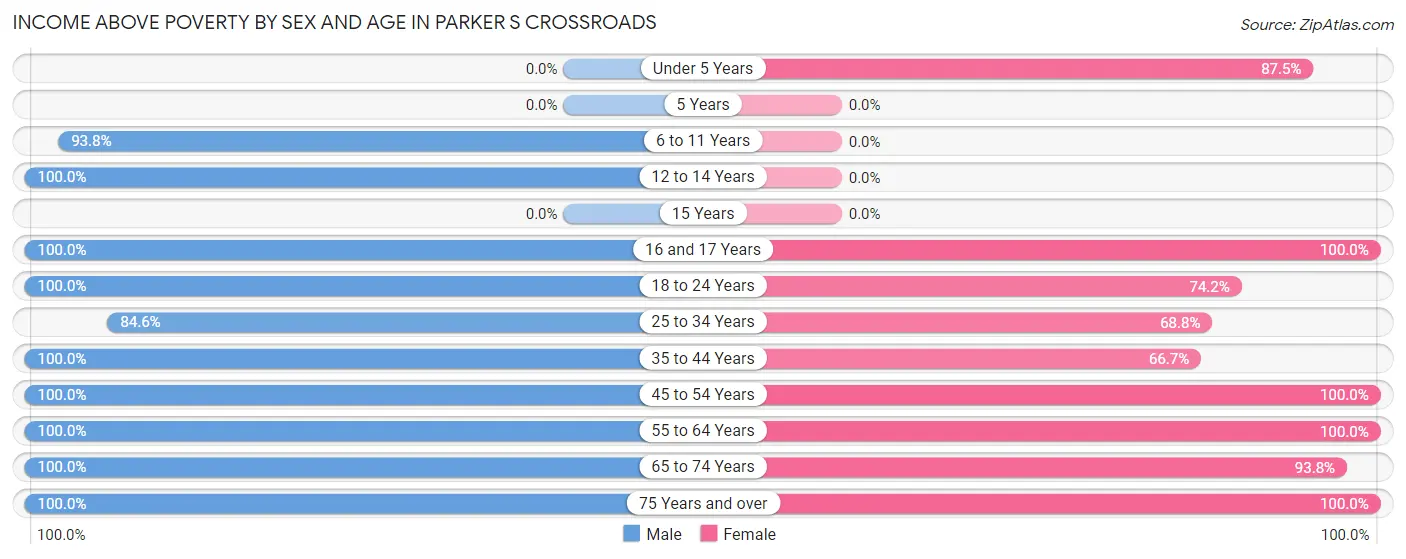
| Age Bracket | Male | Female |
| Under 5 Years | 0 (0.0%) | 14 (87.5%) |
| 5 Years | 0 (0.0%) | 0 (0.0%) |
| 6 to 11 Years | 30 (93.8%) | 0 (0.0%) |
| 12 to 14 Years | 5 (100.0%) | 0 (0.0%) |
| 15 Years | 0 (0.0%) | 0 (0.0%) |
| 16 and 17 Years | 19 (100.0%) | 1 (100.0%) |
| 18 to 24 Years | 29 (100.0%) | 46 (74.2%) |
| 25 to 34 Years | 11 (84.6%) | 11 (68.8%) |
| 35 to 44 Years | 77 (100.0%) | 10 (66.7%) |
| 45 to 54 Years | 11 (100.0%) | 44 (100.0%) |
| 55 to 64 Years | 46 (100.0%) | 9 (100.0%) |
| 65 to 74 Years | 42 (100.0%) | 45 (93.8%) |
| 75 Years and over | 60 (100.0%) | 29 (100.0%) |
| Total | 330 (98.8%) | 209 (83.3%) |
Income Below Poverty Among Married-Couple Families in Parker s Crossroads
The poverty statistics for married-couple families in Parker s Crossroads show that 1.4% or 2 of the total 145 families live below the poverty line. Families with 3 or 4 children have the highest poverty rate of 66.7%, comprising of 2 families. On the other hand, families with no children have the lowest poverty rate of 0.0%, which includes 0 families.
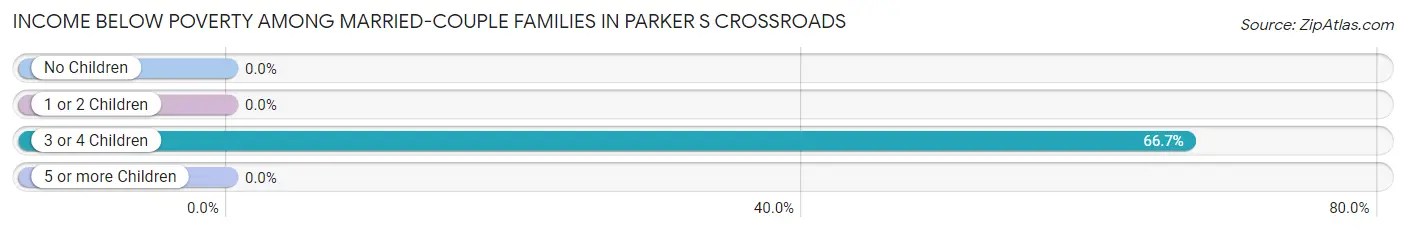
| Children | Above Poverty | Below Poverty |
| No Children | 75 (100.0%) | 0 (0.0%) |
| 1 or 2 Children | 67 (100.0%) | 0 (0.0%) |
| 3 or 4 Children | 1 (33.3%) | 2 (66.7%) |
| 5 or more Children | 0 (0.0%) | 0 (0.0%) |
| Total | 143 (98.6%) | 2 (1.4%) |
Income Below Poverty Among Single-Parent Households in Parker s Crossroads
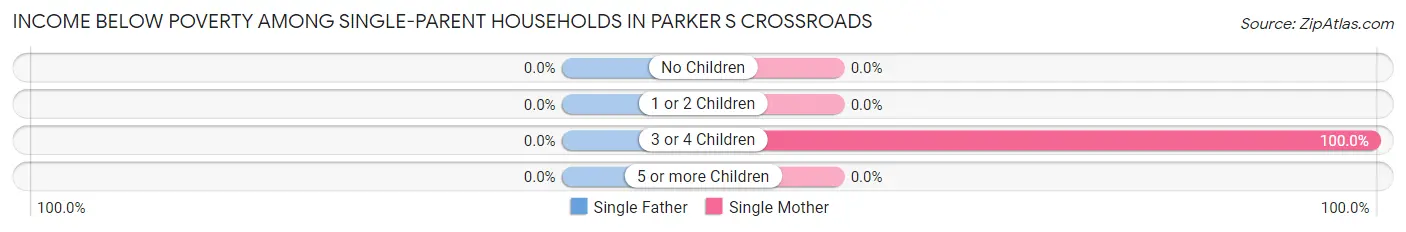
| Children | Single Father | Single Mother |
| No Children | 0 (0.0%) | 0 (0.0%) |
| 1 or 2 Children | 0 (0.0%) | 0 (0.0%) |
| 3 or 4 Children | 0 (0.0%) | 3 (100.0%) |
| 5 or more Children | 0 (0.0%) | 0 (0.0%) |
| Total | 0 (0.0%) | 3 (60.0%) |
Income Below Poverty Among Married-Couple vs Single-Parent Households in Parker s Crossroads
The poverty data for Parker s Crossroads shows that 2 of the married-couple family households (1.4%) and 3 of the single-parent households (13.0%) are living below the poverty level. Within the married-couple family households, those with 3 or 4 children have the highest poverty rate, with 2 households (66.7%) falling below the poverty line. Among the single-parent households, those with 3 or 4 children have the highest poverty rate, with 3 household (100.0%) living below poverty.
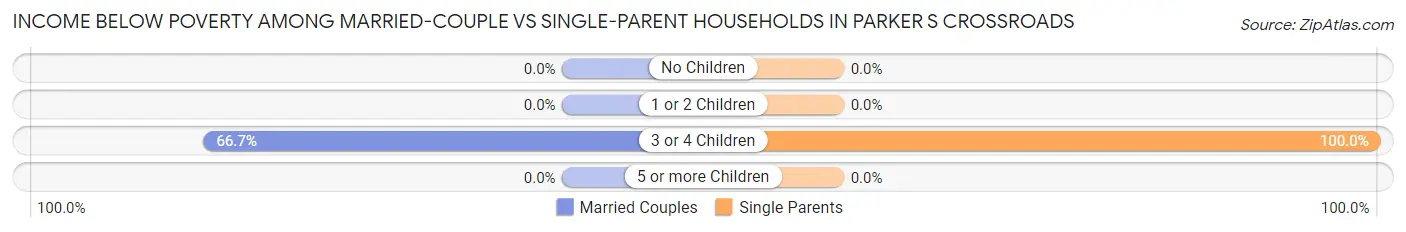
| Children | Married-Couple Families | Single-Parent Households |
| No Children | 0 (0.0%) | 0 (0.0%) |
| 1 or 2 Children | 0 (0.0%) | 0 (0.0%) |
| 3 or 4 Children | 2 (66.7%) | 3 (100.0%) |
| 5 or more Children | 0 (0.0%) | 0 (0.0%) |
| Total | 2 (1.4%) | 3 (13.0%) |
Race in Parker s Crossroads
The most populous races in Parker s Crossroads are White / Caucasian (348 | 58.2%), Black / African American (235 | 39.3%), and Hispanic or Latino (21 | 3.5%).
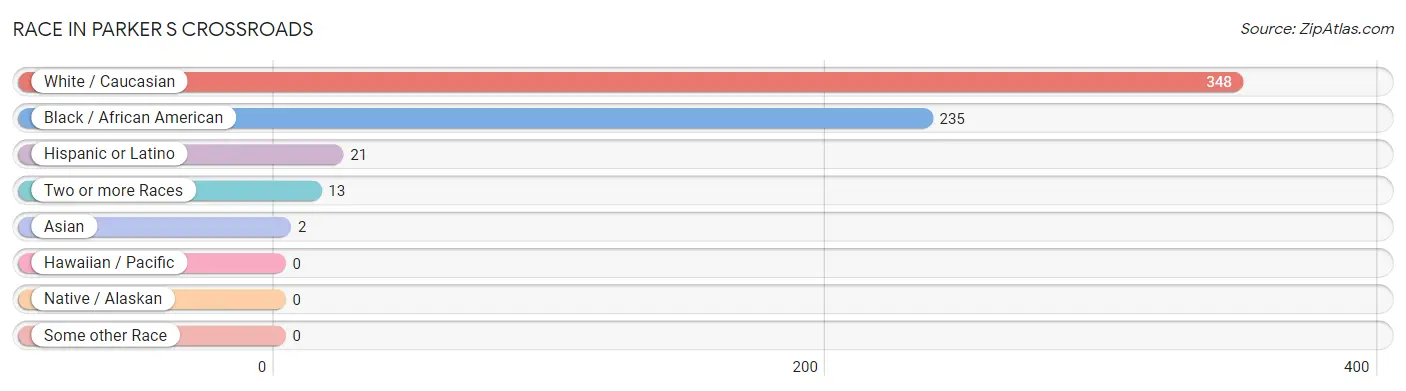
| Race | # Population | % Population |
| Asian | 2 | 0.3% |
| Black / African American | 235 | 39.3% |
| Hawaiian / Pacific | 0 | 0.0% |
| Hispanic or Latino | 21 | 3.5% |
| Native / Alaskan | 0 | 0.0% |
| White / Caucasian | 348 | 58.2% |
| Two or more Races | 13 | 2.2% |
| Some other Race | 0 | 0.0% |
| Total | 598 | 100.0% |
Ancestry in Parker s Crossroads
The most populous ancestries reported in Parker s Crossroads are American (106 | 17.7%), German (34 | 5.7%), English (24 | 4.0%), Mexican (21 | 3.5%), and Irish (18 | 3.0%), together accounting for 34.0% of all Parker s Crossroads residents.
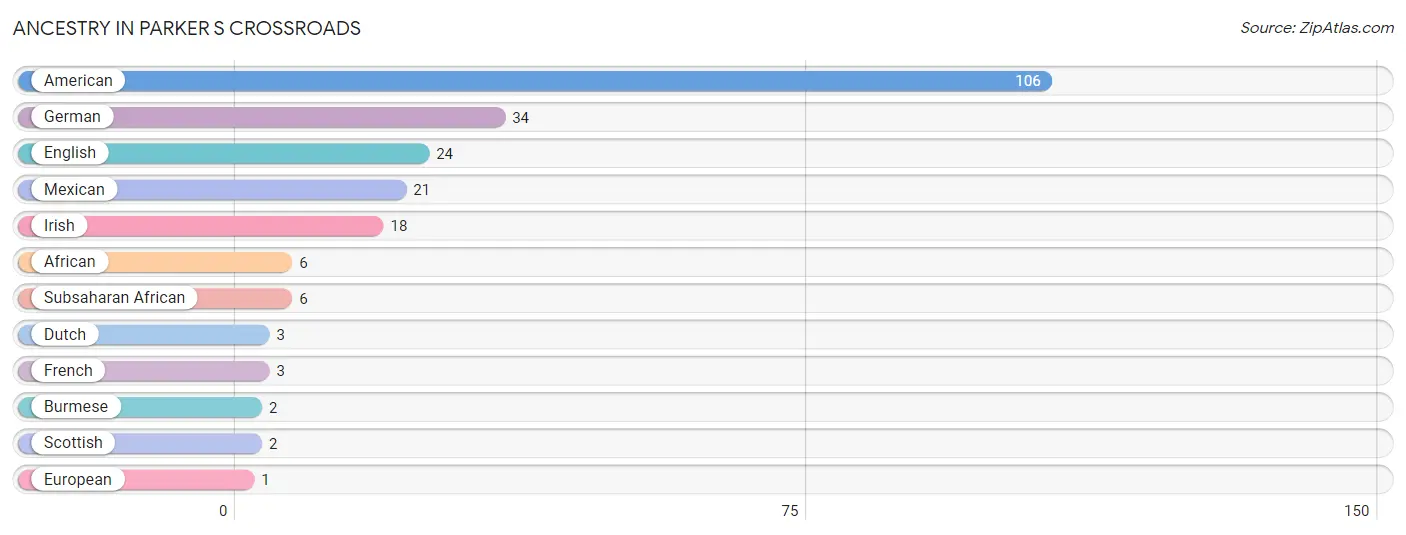
| Ancestry | # Population | % Population |
| African | 6 | 1.0% |
| American | 106 | 17.7% |
| Burmese | 2 | 0.3% |
| Dutch | 3 | 0.5% |
| English | 24 | 4.0% |
| European | 1 | 0.2% |
| French | 3 | 0.5% |
| German | 34 | 5.7% |
| Irish | 18 | 3.0% |
| Mexican | 21 | 3.5% |
| Scottish | 2 | 0.3% |
| Subsaharan African | 6 | 1.0% | View All 12 Rows |
Immigrants in Parker s Crossroads
The most numerous immigrant groups reported in Parker s Crossroads came from Central America (5 | 0.8%), Latin America (5 | 0.8%), Mexico (5 | 0.8%), Asia (2 | 0.3%), and Eastern Asia (2 | 0.3%), together accounting for 3.2% of all Parker s Crossroads residents.
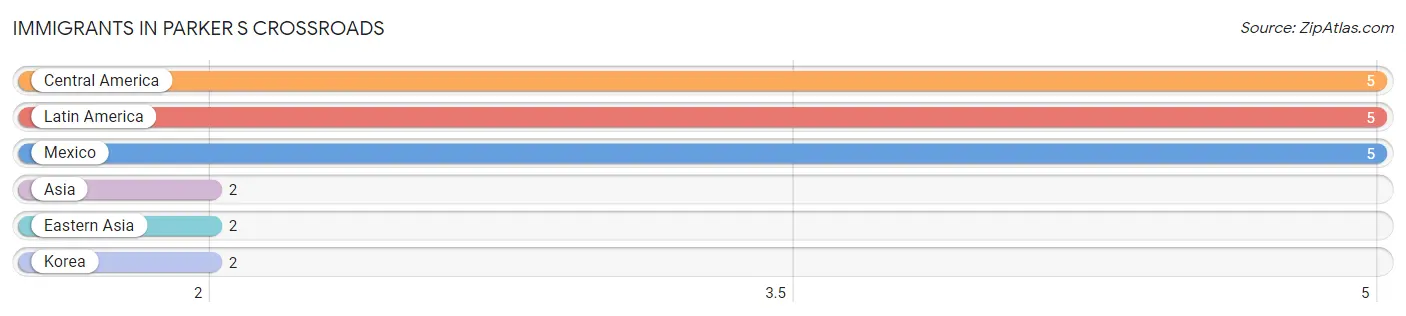
| Immigration Origin | # Population | % Population |
| Asia | 2 | 0.3% |
| Central America | 5 | 0.8% |
| Eastern Asia | 2 | 0.3% |
| Korea | 2 | 0.3% |
| Latin America | 5 | 0.8% |
| Mexico | 5 | 0.8% | View All 6 Rows |
Sex and Age in Parker s Crossroads
Sex and Age in Parker s Crossroads
The most populous age groups in Parker s Crossroads are 35 to 39 Years (72 | 21.1%) for men and 20 to 24 Years (60 | 23.4%) for women.
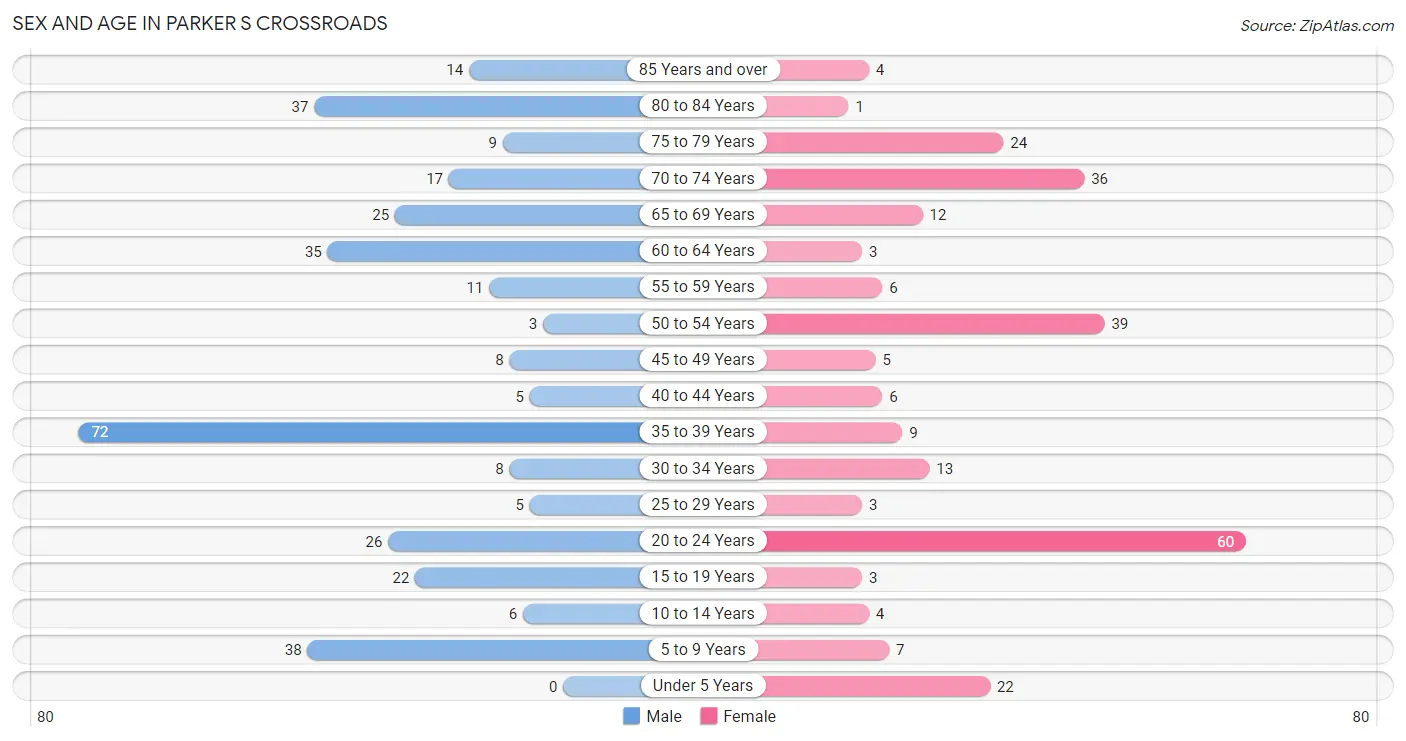
| Age Bracket | Male | Female |
| Under 5 Years | 0 (0.0%) | 22 (8.6%) |
| 5 to 9 Years | 38 (11.1%) | 7 (2.7%) |
| 10 to 14 Years | 6 (1.8%) | 4 (1.6%) |
| 15 to 19 Years | 22 (6.5%) | 3 (1.2%) |
| 20 to 24 Years | 26 (7.6%) | 60 (23.4%) |
| 25 to 29 Years | 5 (1.5%) | 3 (1.2%) |
| 30 to 34 Years | 8 (2.4%) | 13 (5.1%) |
| 35 to 39 Years | 72 (21.1%) | 9 (3.5%) |
| 40 to 44 Years | 5 (1.5%) | 6 (2.3%) |
| 45 to 49 Years | 8 (2.4%) | 5 (1.9%) |
| 50 to 54 Years | 3 (0.9%) | 39 (15.2%) |
| 55 to 59 Years | 11 (3.2%) | 6 (2.3%) |
| 60 to 64 Years | 35 (10.3%) | 3 (1.2%) |
| 65 to 69 Years | 25 (7.3%) | 12 (4.7%) |
| 70 to 74 Years | 17 (5.0%) | 36 (14.0%) |
| 75 to 79 Years | 9 (2.6%) | 24 (9.3%) |
| 80 to 84 Years | 37 (10.8%) | 1 (0.4%) |
| 85 Years and over | 14 (4.1%) | 4 (1.6%) |
| Total | 341 (100.0%) | 257 (100.0%) |
Families and Households in Parker s Crossroads
Median Family Size in Parker s Crossroads
The median family size in Parker s Crossroads is 3.08 persons per family, with single female/mother families (5 | 3.0%) accounting for the largest median family size of 6.2 persons per family. On the other hand, married-couple families (145 | 86.3%) represent the smallest median family size with 2.98 persons per family.
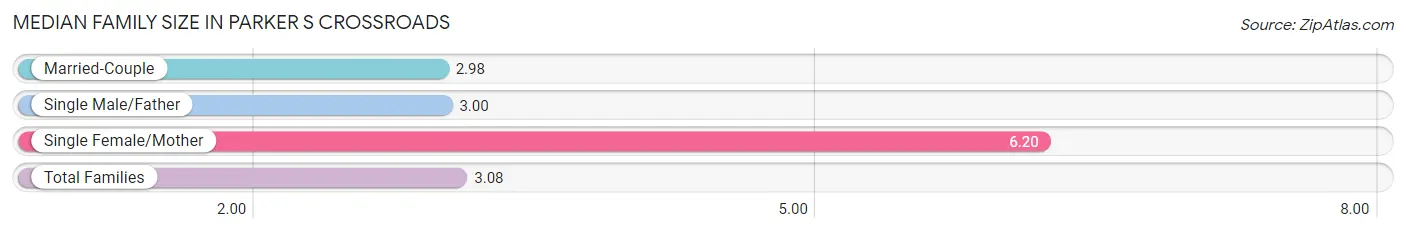
| Family Type | # Families | Family Size |
| Married-Couple | 145 (86.3%) | 2.98 |
| Single Male/Father | 18 (10.7%) | 3.00 |
| Single Female/Mother | 5 (3.0%) | 6.20 |
| Total Families | 168 (100.0%) | 3.08 |
Median Household Size in Parker s Crossroads
The median household size in Parker s Crossroads is 2.86 persons per household, with single female/mother households (5 | 2.4%) accounting for the largest median household size of 6.4 persons per household. non-family households (41 | 19.6%) represent the smallest median household size with 1.56 persons per household.
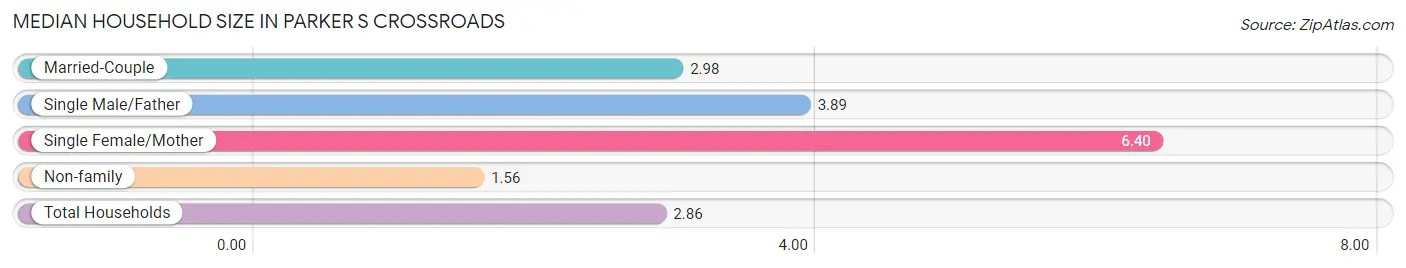
| Household Type | # Households | Household Size |
| Married-Couple | 145 (69.4%) | 2.98 |
| Single Male/Father | 18 (8.6%) | 3.89 |
| Single Female/Mother | 5 (2.4%) | 6.40 |
| Non-family | 41 (19.6%) | 1.56 |
| Total Households | 209 (100.0%) | 2.86 |
Household Size by Marriage Status in Parker s Crossroads
Out of a total of 209 households in Parker s Crossroads, 168 (80.4%) are family households, while 41 (19.6%) are nonfamily households. The most numerous type of family households are 2-person households, comprising 73, and the most common type of nonfamily households are 1-person households, comprising 31.
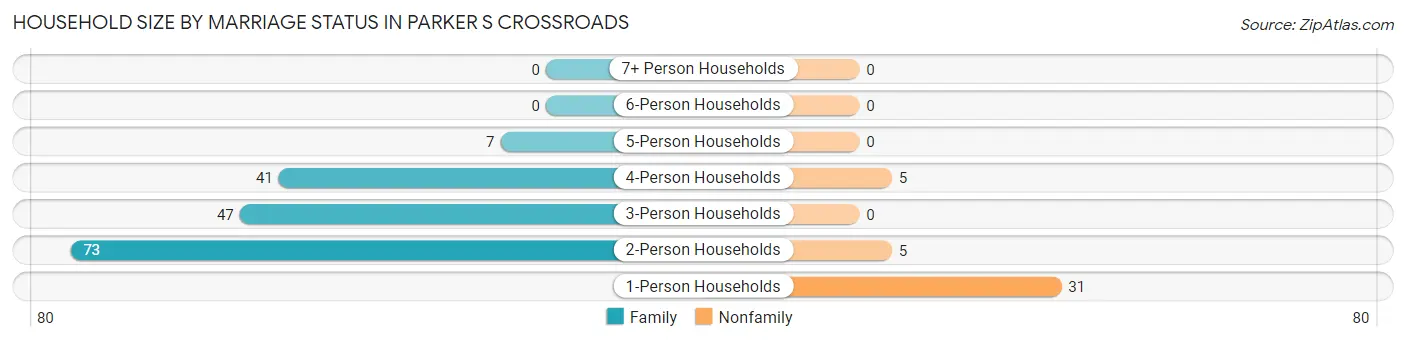
| Household Size | Family Households | Nonfamily Households |
| 1-Person Households | - | 31 (14.8%) |
| 2-Person Households | 73 (34.9%) | 5 (2.4%) |
| 3-Person Households | 47 (22.5%) | 0 (0.0%) |
| 4-Person Households | 41 (19.6%) | 5 (2.4%) |
| 5-Person Households | 7 (3.4%) | 0 (0.0%) |
| 6-Person Households | 0 (0.0%) | 0 (0.0%) |
| 7+ Person Households | 0 (0.0%) | 0 (0.0%) |
| Total | 168 (80.4%) | 41 (19.6%) |
Female Fertility in Parker s Crossroads
Fertility by Age in Parker s Crossroads
Average fertility rate in Parker s Crossroads is 10.0 births per 1,000 women. Women in the age bracket of 35 to 50 years have the highest fertility rate with 48.0 births per 1,000 women. Women in the age bracket of 35 to 50 years acount for 100.0% of all women with births.
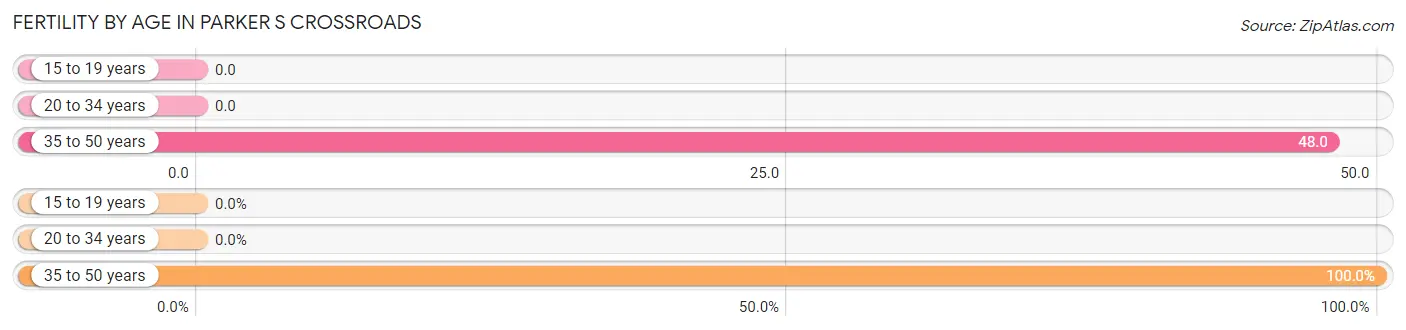
| Age Bracket | Women with Births | Births / 1,000 Women |
| 15 to 19 years | 0 (0.0%) | 0.0 |
| 20 to 34 years | 0 (0.0%) | 0.0 |
| 35 to 50 years | 1 (100.0%) | 48.0 |
| Total | 1 (100.0%) | 10.0 |
Fertility by Age by Marriage Status in Parker s Crossroads
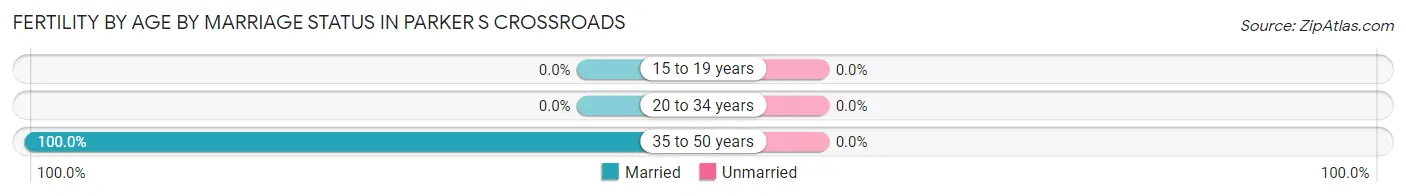
| Age Bracket | Married | Unmarried |
| 15 to 19 years | 0 (0.0%) | 0 (0.0%) |
| 20 to 34 years | 0 (0.0%) | 0 (0.0%) |
| 35 to 50 years | 1 (100.0%) | 0 (0.0%) |
| Total | 1 (100.0%) | 0 (0.0%) |
Fertility by Education in Parker s Crossroads
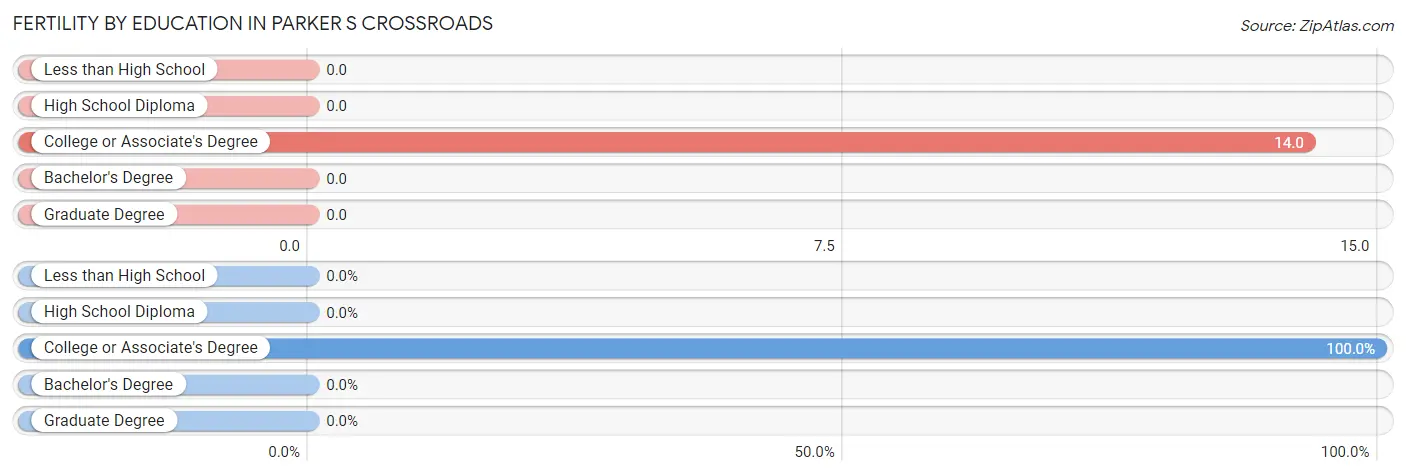
| Educational Attainment | Women with Births | Births / 1,000 Women |
| Less than High School | 0 (0.0%) | 0.0 |
| High School Diploma | 0 (0.0%) | 0.0 |
| College or Associate's Degree | 1 (100.0%) | 14.0 |
| Bachelor's Degree | 0 (0.0%) | 0.0 |
| Graduate Degree | 0 (0.0%) | 0.0 |
| Total | 1 (100.0%) | 10.0 |
Fertility by Education by Marriage Status in Parker s Crossroads
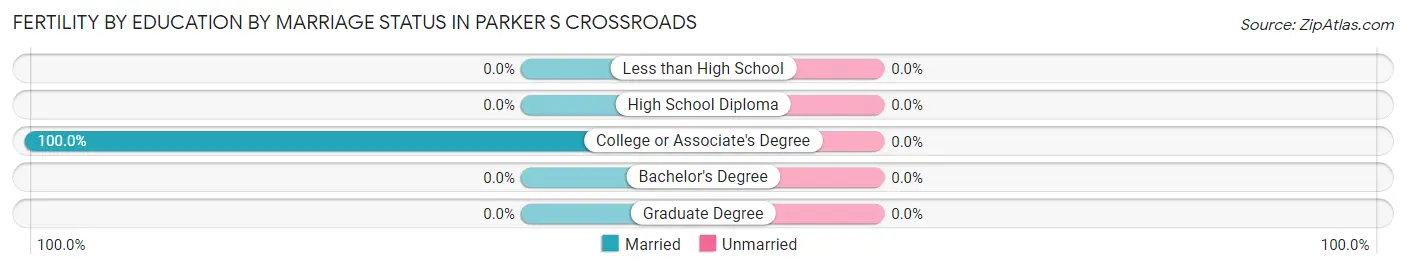
| Educational Attainment | Married | Unmarried |
| Less than High School | 0 (0.0%) | 0 (0.0%) |
| High School Diploma | 0 (0.0%) | 0 (0.0%) |
| College or Associate's Degree | 1 (100.0%) | 0 (0.0%) |
| Bachelor's Degree | 0 (0.0%) | 0 (0.0%) |
| Graduate Degree | 0 (0.0%) | 0 (0.0%) |
| Total | 1 (100.0%) | 0 (0.0%) |
Employment Characteristics in Parker s Crossroads
Employment by Class of Employer in Parker s Crossroads
Among the 185 employed individuals in Parker s Crossroads, private company employees (98 | 53.0%), self-employed (not incorporated) (51 | 27.6%), and local government employees (24 | 13.0%) make up the most common classes of employment.
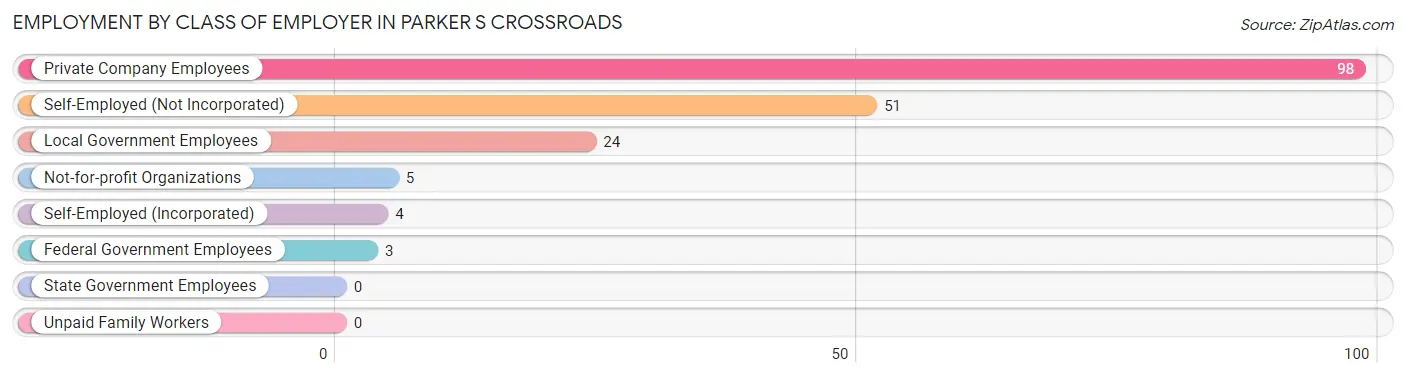
| Employer Class | # Employees | % Employees |
| Private Company Employees | 98 | 53.0% |
| Self-Employed (Incorporated) | 4 | 2.2% |
| Self-Employed (Not Incorporated) | 51 | 27.6% |
| Not-for-profit Organizations | 5 | 2.7% |
| Local Government Employees | 24 | 13.0% |
| State Government Employees | 0 | 0.0% |
| Federal Government Employees | 3 | 1.6% |
| Unpaid Family Workers | 0 | 0.0% |
| Total | 185 | 100.0% |
Employment Status by Age in Parker s Crossroads
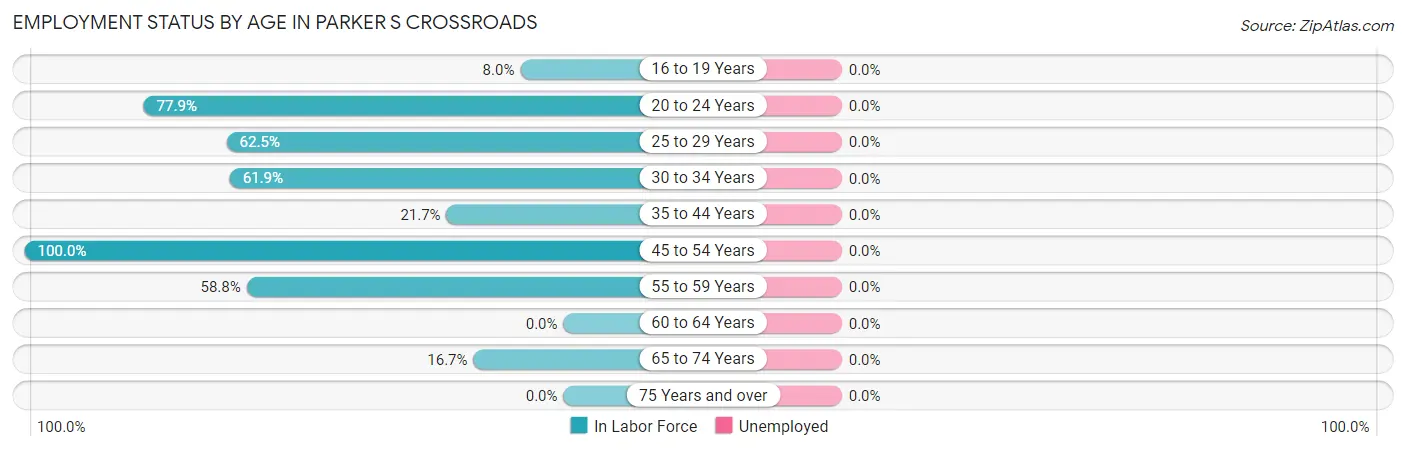
| Age Bracket | In Labor Force | Unemployed |
| 16 to 19 Years | 2 (8.0%) | 0 (0.0%) |
| 20 to 24 Years | 67 (77.9%) | 0 (0.0%) |
| 25 to 29 Years | 5 (62.5%) | 0 (0.0%) |
| 30 to 34 Years | 13 (61.9%) | 0 (0.0%) |
| 35 to 44 Years | 20 (21.7%) | 0 (0.0%) |
| 45 to 54 Years | 55 (100.0%) | 0 (0.0%) |
| 55 to 59 Years | 10 (58.8%) | 0 (0.0%) |
| 60 to 64 Years | 0 (0.0%) | 0 (0.0%) |
| 65 to 74 Years | 15 (16.7%) | 0 (0.0%) |
| 75 Years and over | 0 (0.0%) | 0 (0.0%) |
| Total | 187 (35.9%) | 0 (0.0%) |
Employment Status by Educational Attainment in Parker s Crossroads
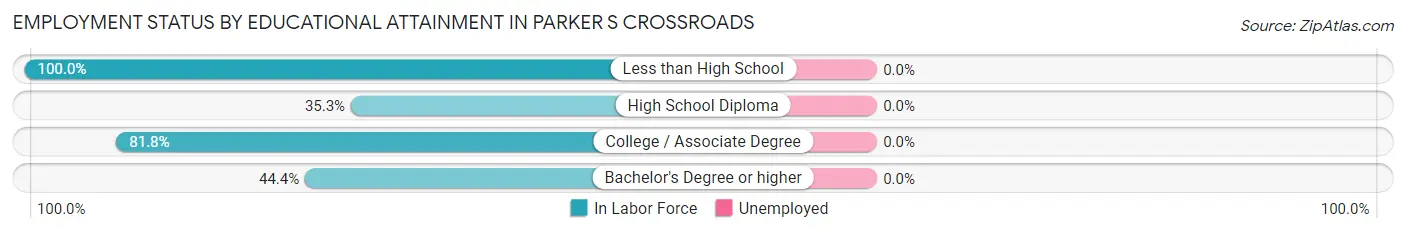
| Educational Attainment | In Labor Force | Unemployed |
| Less than High School | 7 (100.0%) | 0 (0.0%) |
| High School Diploma | 61 (35.3%) | 0 (0.0%) |
| College / Associate Degree | 27 (81.8%) | 0 (0.0%) |
| Bachelor's Degree or higher | 8 (44.4%) | 0 (0.0%) |
| Total | 103 (44.6%) | 0 (0.0%) |
Employment Occupations by Sex in Parker s Crossroads
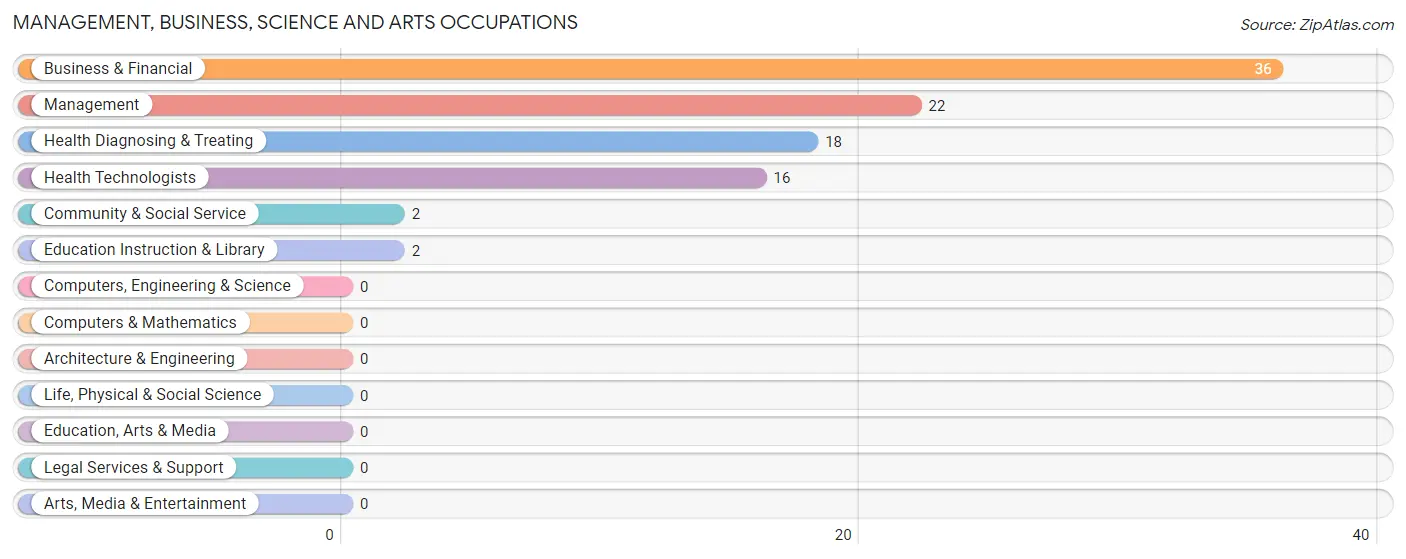
Management, Business, Science and Arts Occupations
The most common Management, Business, Science and Arts occupations in Parker s Crossroads are Business & Financial (36 | 19.3%), Management (22 | 11.8%), Health Diagnosing & Treating (18 | 9.6%), Health Technologists (16 | 8.6%), and Community & Social Service (2 | 1.1%).
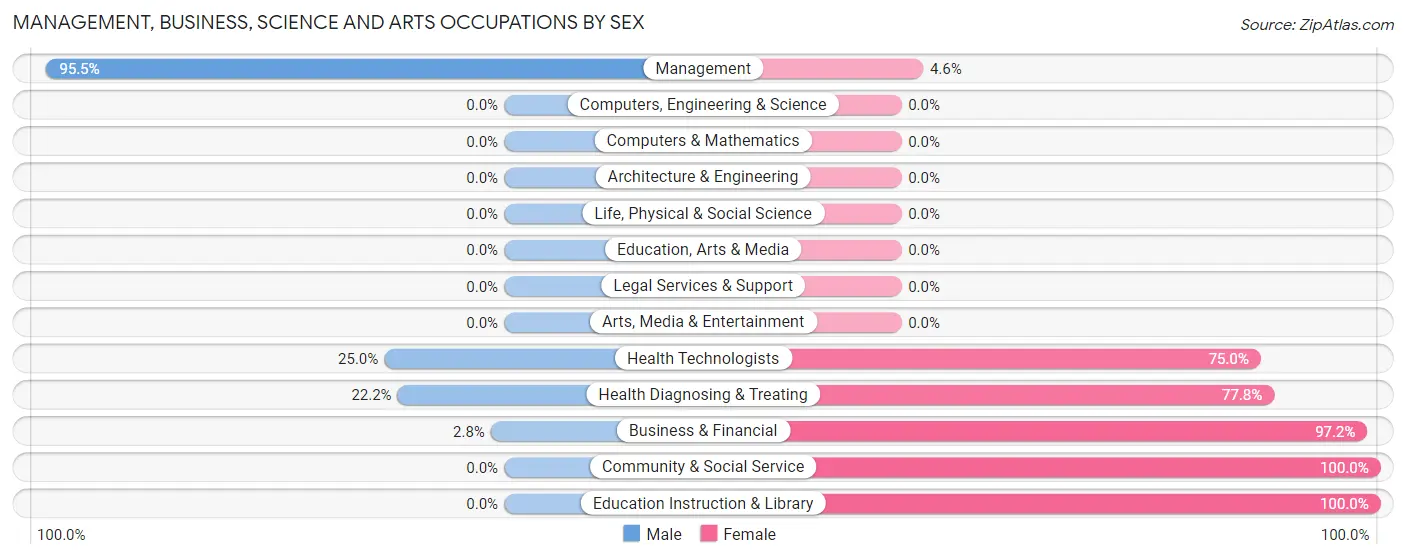
Management, Business, Science and Arts Occupations by Sex
Within the Management, Business, Science and Arts occupations in Parker s Crossroads, the most male-oriented occupations are Management (95.5%), Health Technologists (25.0%), and Health Diagnosing & Treating (22.2%), while the most female-oriented occupations are Community & Social Service (100.0%), Education Instruction & Library (100.0%), and Business & Financial (97.2%).
| Occupation | Male | Female |
| Management | 21 (95.5%) | 1 (4.5%) |
| Business & Financial | 1 (2.8%) | 35 (97.2%) |
| Computers, Engineering & Science | 0 (0.0%) | 0 (0.0%) |
| Computers & Mathematics | 0 (0.0%) | 0 (0.0%) |
| Architecture & Engineering | 0 (0.0%) | 0 (0.0%) |
| Life, Physical & Social Science | 0 (0.0%) | 0 (0.0%) |
| Community & Social Service | 0 (0.0%) | 2 (100.0%) |
| Education, Arts & Media | 0 (0.0%) | 0 (0.0%) |
| Legal Services & Support | 0 (0.0%) | 0 (0.0%) |
| Education Instruction & Library | 0 (0.0%) | 2 (100.0%) |
| Arts, Media & Entertainment | 0 (0.0%) | 0 (0.0%) |
| Health Diagnosing & Treating | 4 (22.2%) | 14 (77.8%) |
| Health Technologists | 4 (25.0%) | 12 (75.0%) |
| Total (Category) | 26 (33.3%) | 52 (66.7%) |
| Total (Overall) | 85 (45.5%) | 102 (54.5%) |
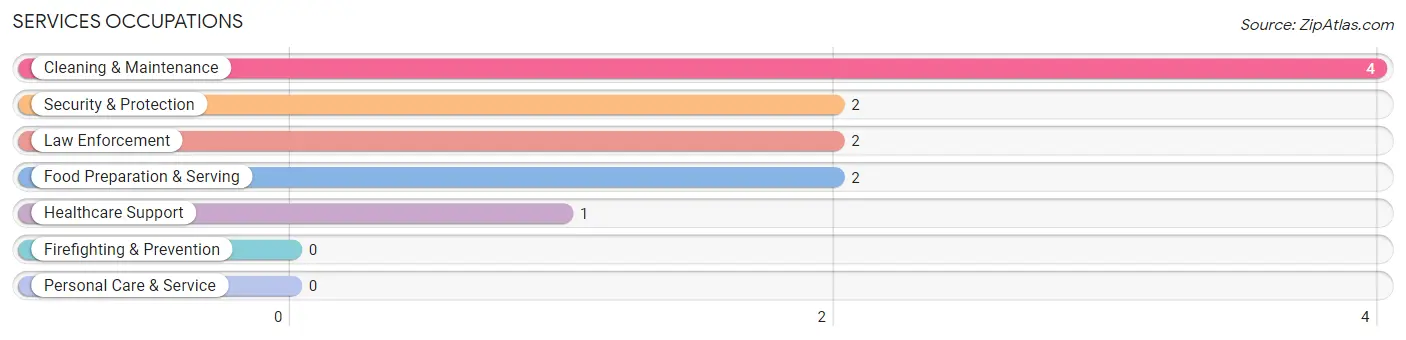
Services Occupations
The most common Services occupations in Parker s Crossroads are Cleaning & Maintenance (4 | 2.1%), Security & Protection (2 | 1.1%), Law Enforcement (2 | 1.1%), Food Preparation & Serving (2 | 1.1%), and Healthcare Support (1 | 0.5%).
Services Occupations by Sex
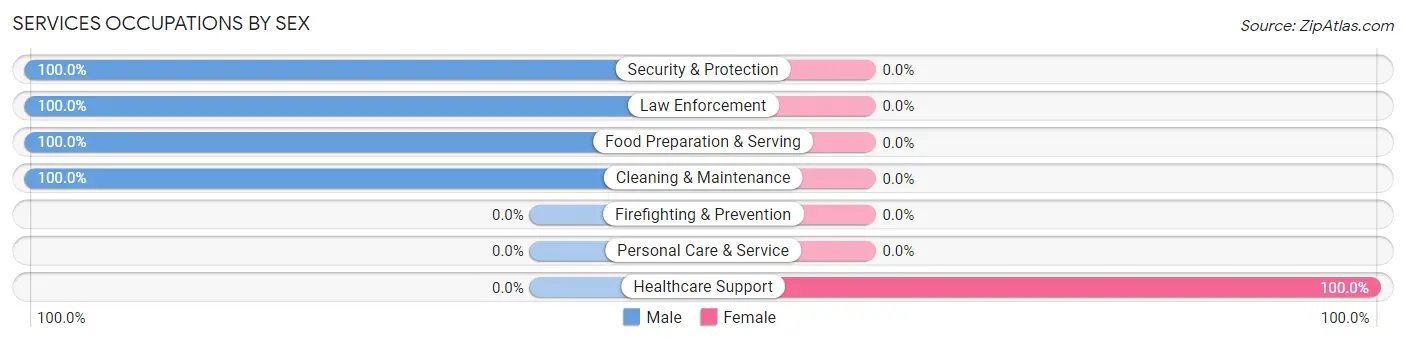
| Occupation | Male | Female |
| Healthcare Support | 0 (0.0%) | 1 (100.0%) |
| Security & Protection | 2 (100.0%) | 0 (0.0%) |
| Firefighting & Prevention | 0 (0.0%) | 0 (0.0%) |
| Law Enforcement | 2 (100.0%) | 0 (0.0%) |
| Food Preparation & Serving | 2 (100.0%) | 0 (0.0%) |
| Cleaning & Maintenance | 4 (100.0%) | 0 (0.0%) |
| Personal Care & Service | 0 (0.0%) | 0 (0.0%) |
| Total (Category) | 8 (88.9%) | 1 (11.1%) |
| Total (Overall) | 85 (45.5%) | 102 (54.5%) |
Sales and Office Occupations
The most common Sales and Office occupations in Parker s Crossroads are Office & Administration (26 | 13.9%), and Sales & Related (19 | 10.2%).
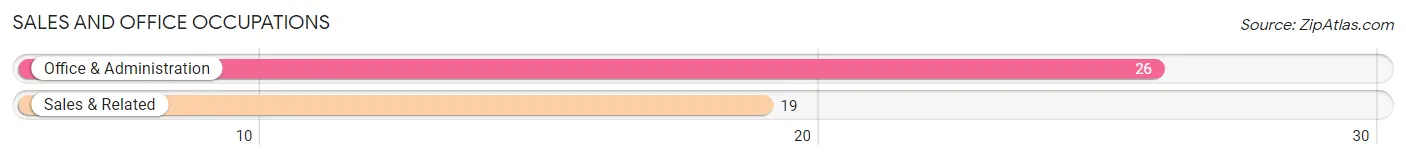
Sales and Office Occupations by Sex
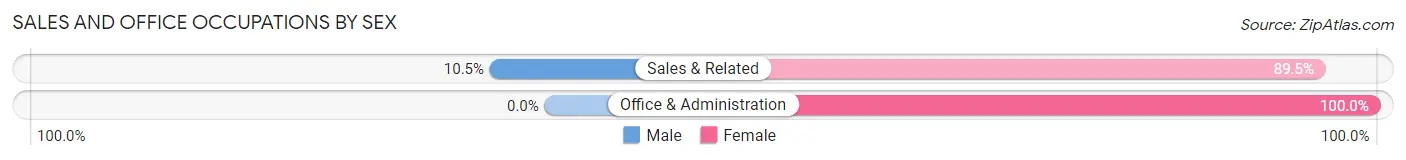
| Occupation | Male | Female |
| Sales & Related | 2 (10.5%) | 17 (89.5%) |
| Office & Administration | 0 (0.0%) | 26 (100.0%) |
| Total (Category) | 2 (4.4%) | 43 (95.6%) |
| Total (Overall) | 85 (45.5%) | 102 (54.5%) |
Natural Resources, Construction and Maintenance Occupations
The most common Natural Resources, Construction and Maintenance occupations in Parker s Crossroads are Construction & Extraction (16 | 8.6%), and Installation, Maintenance & Repair (6 | 3.2%).
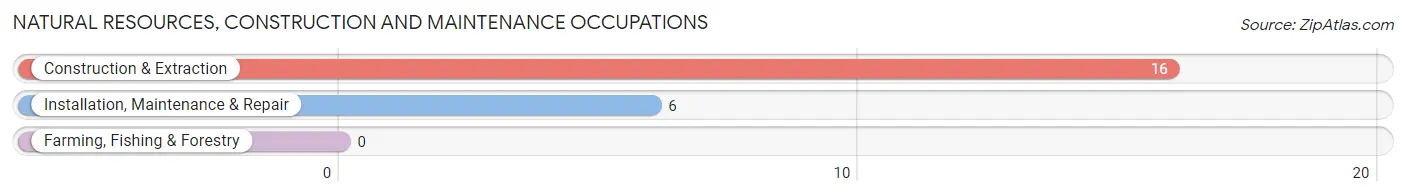
Natural Resources, Construction and Maintenance Occupations by Sex
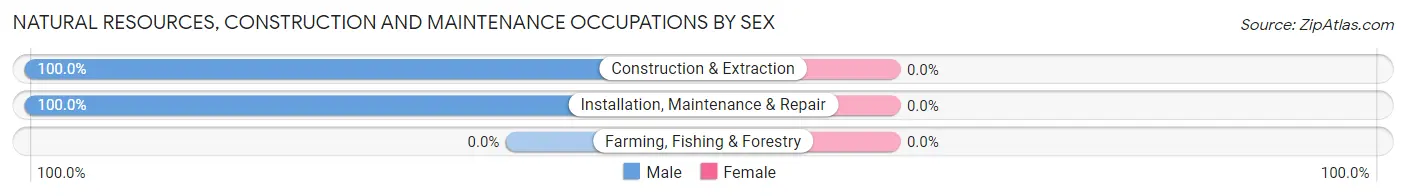
| Occupation | Male | Female |
| Farming, Fishing & Forestry | 0 (0.0%) | 0 (0.0%) |
| Construction & Extraction | 16 (100.0%) | 0 (0.0%) |
| Installation, Maintenance & Repair | 6 (100.0%) | 0 (0.0%) |
| Total (Category) | 22 (100.0%) | 0 (0.0%) |
| Total (Overall) | 85 (45.5%) | 102 (54.5%) |
Production, Transportation and Moving Occupations
The most common Production, Transportation and Moving occupations in Parker s Crossroads are Transportation (19 | 10.2%), Production (11 | 5.9%), and Material Moving (3 | 1.6%).
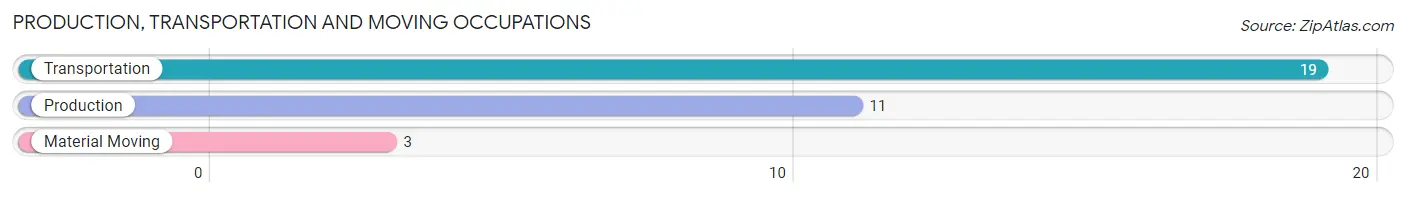
Production, Transportation and Moving Occupations by Sex
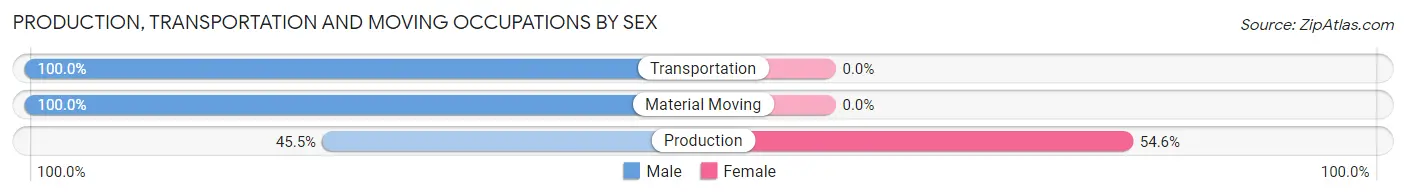
| Occupation | Male | Female |
| Production | 5 (45.5%) | 6 (54.5%) |
| Transportation | 19 (100.0%) | 0 (0.0%) |
| Material Moving | 3 (100.0%) | 0 (0.0%) |
| Total (Category) | 27 (81.8%) | 6 (18.2%) |
| Total (Overall) | 85 (45.5%) | 102 (54.5%) |
Employment Industries by Sex in Parker s Crossroads
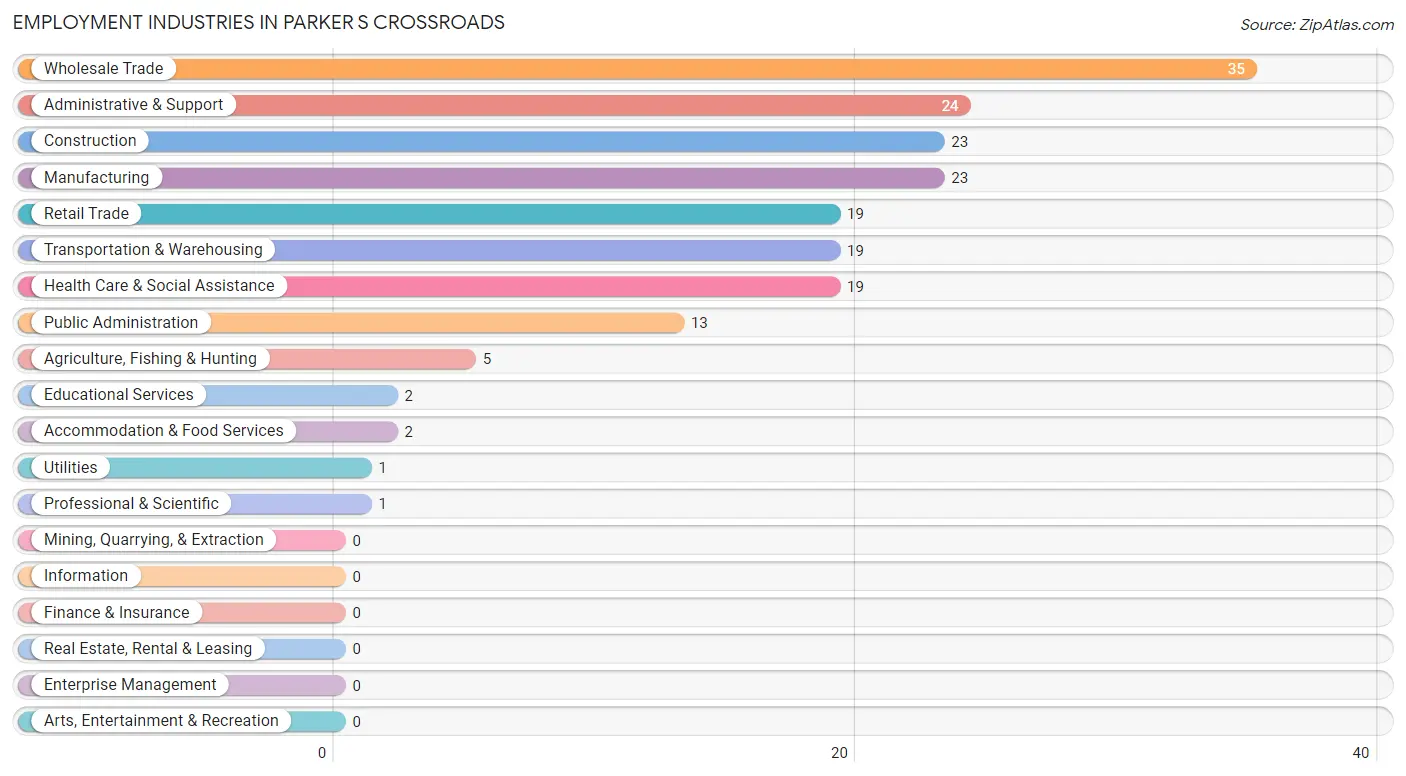
Employment Industries in Parker s Crossroads
The major employment industries in Parker s Crossroads include Wholesale Trade (35 | 18.7%), Administrative & Support (24 | 12.8%), Construction (23 | 12.3%), Manufacturing (23 | 12.3%), and Retail Trade (19 | 10.2%).
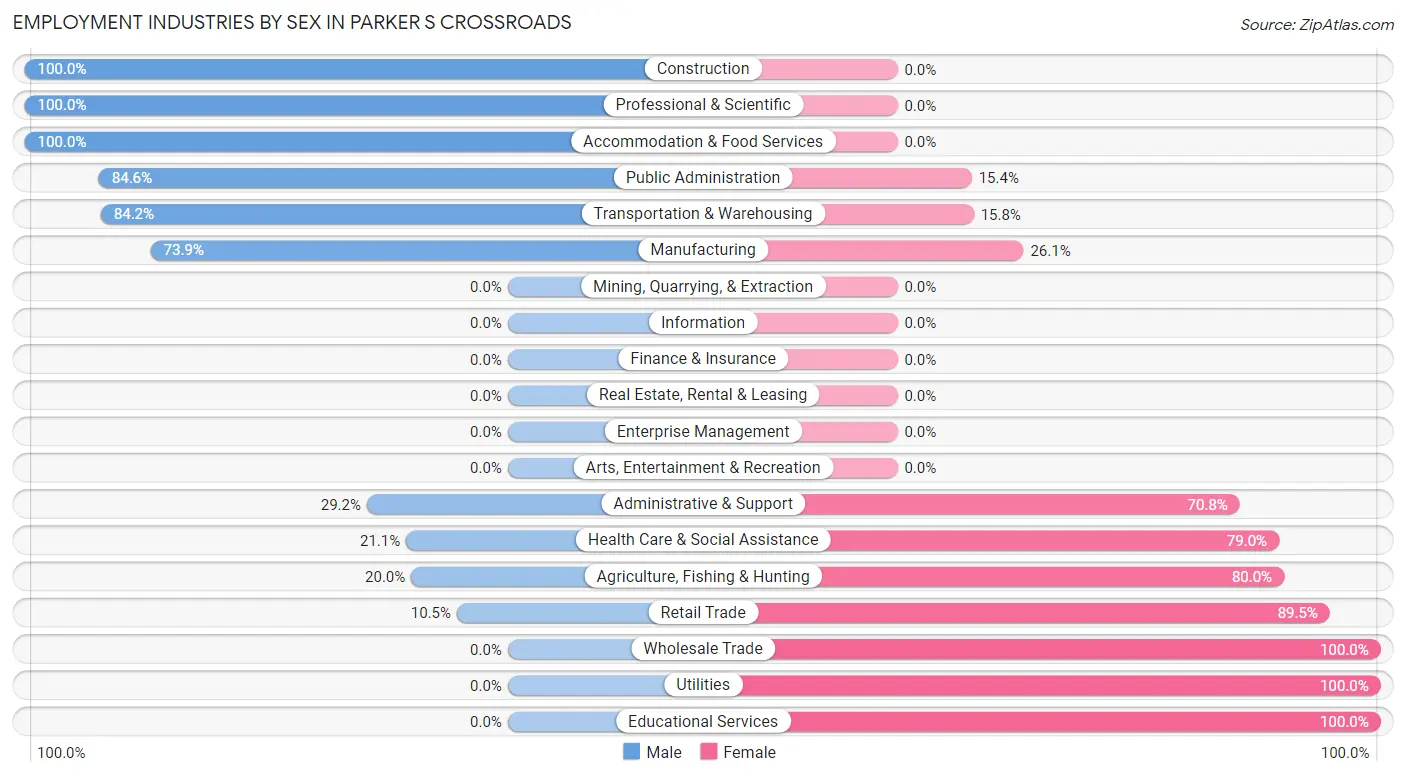
Employment Industries by Sex in Parker s Crossroads
The Parker s Crossroads industries that see more men than women are Construction (100.0%), Professional & Scientific (100.0%), and Accommodation & Food Services (100.0%), whereas the industries that tend to have a higher number of women are Wholesale Trade (100.0%), Utilities (100.0%), and Educational Services (100.0%).
| Industry | Male | Female |
| Agriculture, Fishing & Hunting | 1 (20.0%) | 4 (80.0%) |
| Mining, Quarrying, & Extraction | 0 (0.0%) | 0 (0.0%) |
| Construction | 23 (100.0%) | 0 (0.0%) |
| Manufacturing | 17 (73.9%) | 6 (26.1%) |
| Wholesale Trade | 0 (0.0%) | 35 (100.0%) |
| Retail Trade | 2 (10.5%) | 17 (89.5%) |
| Transportation & Warehousing | 16 (84.2%) | 3 (15.8%) |
| Utilities | 0 (0.0%) | 1 (100.0%) |
| Information | 0 (0.0%) | 0 (0.0%) |
| Finance & Insurance | 0 (0.0%) | 0 (0.0%) |
| Real Estate, Rental & Leasing | 0 (0.0%) | 0 (0.0%) |
| Professional & Scientific | 1 (100.0%) | 0 (0.0%) |
| Enterprise Management | 0 (0.0%) | 0 (0.0%) |
| Administrative & Support | 7 (29.2%) | 17 (70.8%) |
| Educational Services | 0 (0.0%) | 2 (100.0%) |
| Health Care & Social Assistance | 4 (21.0%) | 15 (78.9%) |
| Arts, Entertainment & Recreation | 0 (0.0%) | 0 (0.0%) |
| Accommodation & Food Services | 2 (100.0%) | 0 (0.0%) |
| Public Administration | 11 (84.6%) | 2 (15.4%) |
| Total | 85 (45.5%) | 102 (54.5%) |
Education in Parker s Crossroads
School Enrollment in Parker s Crossroads
The most common levels of schooling among the 119 students in Parker s Crossroads are elementary school (44 | 37.0%), college / undergraduate (36 | 30.2%), and high school (25 | 21.0%).
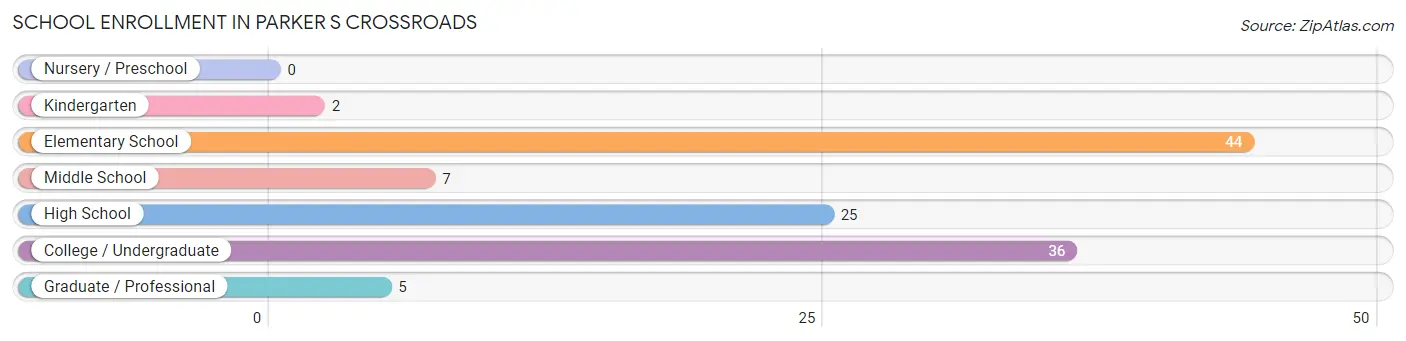
| School Level | # Students | % Students |
| Nursery / Preschool | 0 | 0.0% |
| Kindergarten | 2 | 1.7% |
| Elementary School | 44 | 37.0% |
| Middle School | 7 | 5.9% |
| High School | 25 | 21.0% |
| College / Undergraduate | 36 | 30.2% |
| Graduate / Professional | 5 | 4.2% |
| Total | 119 | 100.0% |
School Enrollment by Age by Funding Source in Parker s Crossroads
Out of a total of 119 students who are enrolled in schools in Parker s Crossroads, 42 (35.3%) attend a private institution, while the remaining 77 (64.7%) are enrolled in public schools. The age group of 35 years and over has the highest likelihood of being enrolled in private schools, with 5 (100.0% in the age bracket) enrolled. Conversely, the age group of 5 to 9 year old has the lowest likelihood of being enrolled in a private school, with 45 (100.0% in the age bracket) attending a public institution.
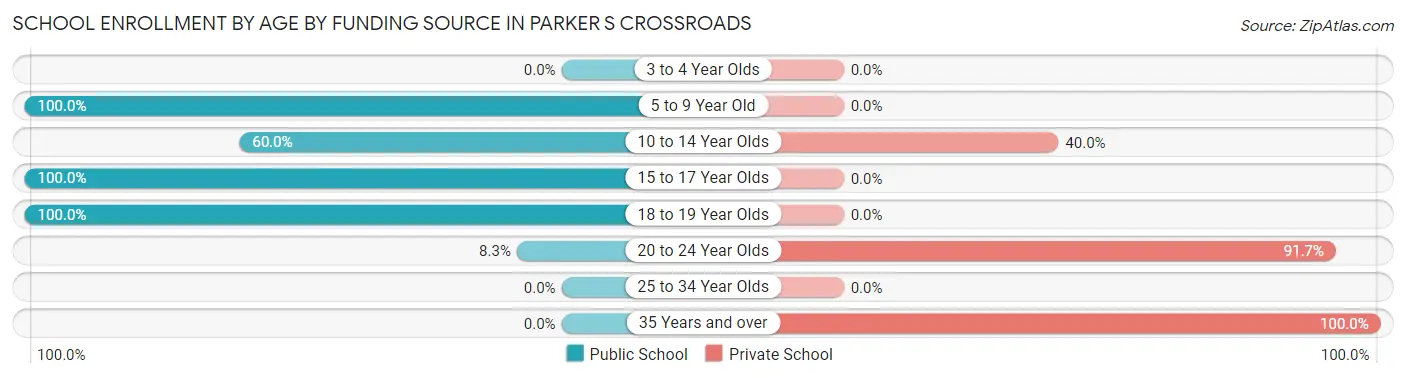
| Age Bracket | Public School | Private School |
| 3 to 4 Year Olds | 0 (0.0%) | 0 (0.0%) |
| 5 to 9 Year Old | 45 (100.0%) | 0 (0.0%) |
| 10 to 14 Year Olds | 6 (60.0%) | 4 (40.0%) |
| 15 to 17 Year Olds | 20 (100.0%) | 0 (0.0%) |
| 18 to 19 Year Olds | 3 (100.0%) | 0 (0.0%) |
| 20 to 24 Year Olds | 3 (8.3%) | 33 (91.7%) |
| 25 to 34 Year Olds | 0 (0.0%) | 0 (0.0%) |
| 35 Years and over | 0 (0.0%) | 5 (100.0%) |
| Total | 77 (64.7%) | 42 (35.3%) |
Educational Attainment by Field of Study in Parker s Crossroads
Arts & humanities (14 | 30.4%), education (12 | 26.1%), business (8 | 17.4%), engineering (5 | 10.9%), and science & technology (4 | 8.7%) are the most common fields of study among 46 individuals in Parker s Crossroads who have obtained a bachelor's degree or higher.
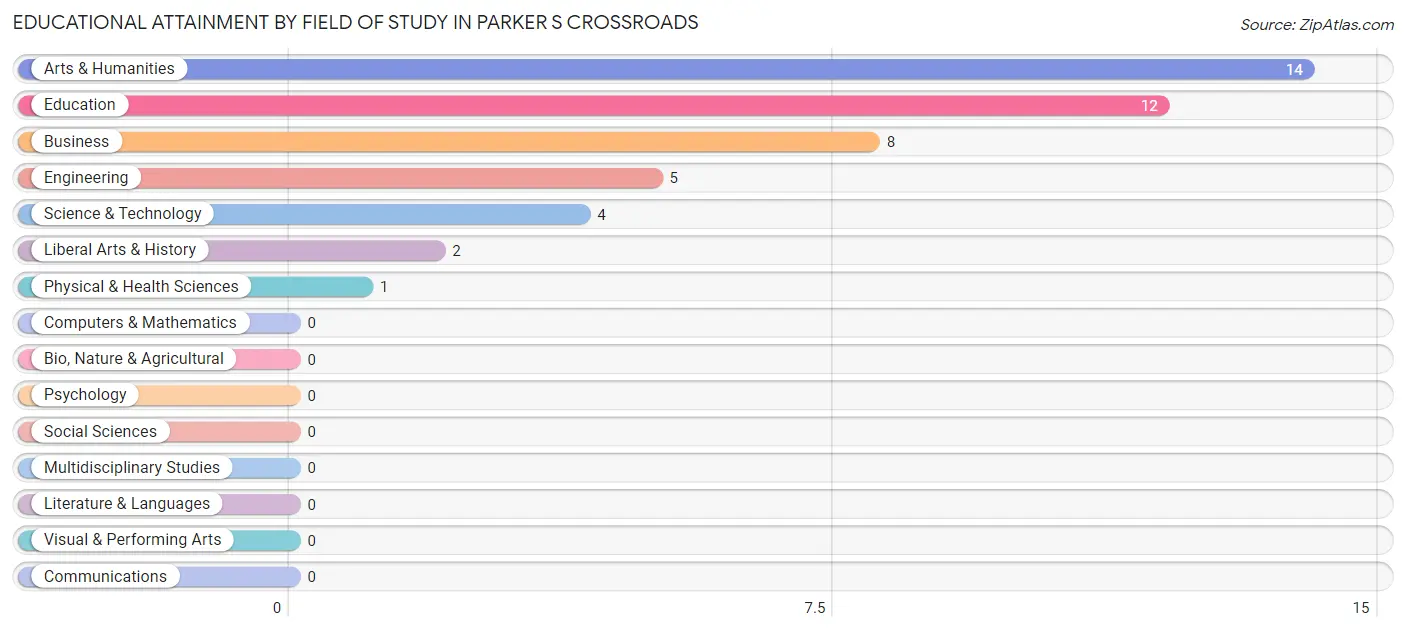
| Field of Study | # Graduates | % Graduates |
| Computers & Mathematics | 0 | 0.0% |
| Bio, Nature & Agricultural | 0 | 0.0% |
| Physical & Health Sciences | 1 | 2.2% |
| Psychology | 0 | 0.0% |
| Social Sciences | 0 | 0.0% |
| Engineering | 5 | 10.9% |
| Multidisciplinary Studies | 0 | 0.0% |
| Science & Technology | 4 | 8.7% |
| Business | 8 | 17.4% |
| Education | 12 | 26.1% |
| Literature & Languages | 0 | 0.0% |
| Liberal Arts & History | 2 | 4.3% |
| Visual & Performing Arts | 0 | 0.0% |
| Communications | 0 | 0.0% |
| Arts & Humanities | 14 | 30.4% |
| Total | 46 | 100.0% |
Transportation & Commute in Parker s Crossroads
Vehicle Availability by Sex in Parker s Crossroads
The most prevalent vehicle ownership categories in Parker s Crossroads are males with 2 vehicles (27, accounting for 32.5%) and females with 2 vehicles (19, making up 26.5%).
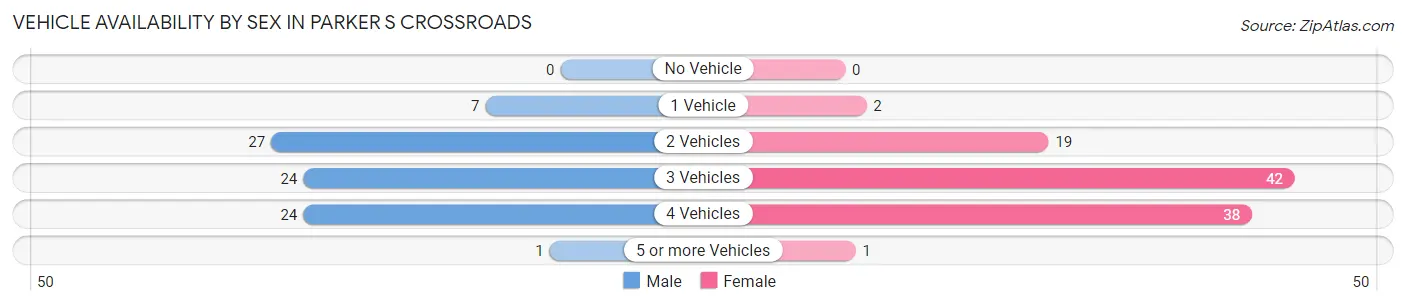
| Vehicles Available | Male | Female |
| No Vehicle | 0 (0.0%) | 0 (0.0%) |
| 1 Vehicle | 7 (8.4%) | 2 (2.0%) |
| 2 Vehicles | 27 (32.5%) | 19 (18.6%) |
| 3 Vehicles | 24 (28.9%) | 42 (41.2%) |
| 4 Vehicles | 24 (28.9%) | 38 (37.2%) |
| 5 or more Vehicles | 1 (1.2%) | 1 (1.0%) |
| Total | 83 (100.0%) | 102 (100.0%) |
Commute Time in Parker s Crossroads
The most frequently occuring commute durations in Parker s Crossroads are 60 to 89 minutes (36 commuters, 22.4%), less than 5 minutes (24 commuters, 14.9%), and 15 to 19 minutes (24 commuters, 14.9%).
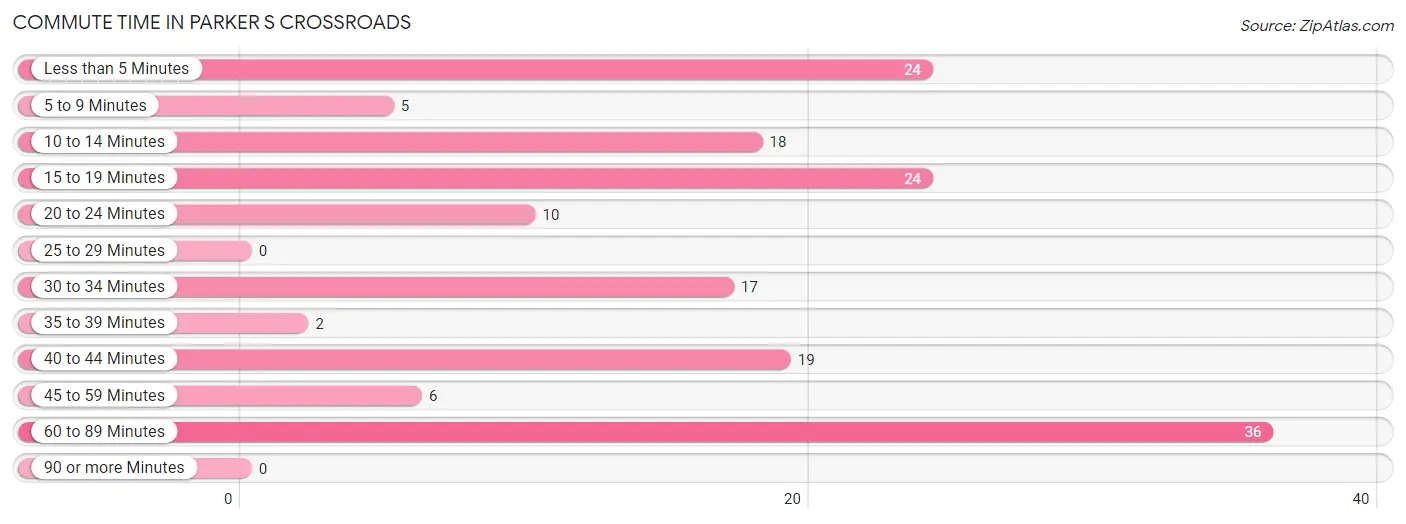
| Commute Time | # Commuters | % Commuters |
| Less than 5 Minutes | 24 | 14.9% |
| 5 to 9 Minutes | 5 | 3.1% |
| 10 to 14 Minutes | 18 | 11.2% |
| 15 to 19 Minutes | 24 | 14.9% |
| 20 to 24 Minutes | 10 | 6.2% |
| 25 to 29 Minutes | 0 | 0.0% |
| 30 to 34 Minutes | 17 | 10.6% |
| 35 to 39 Minutes | 2 | 1.2% |
| 40 to 44 Minutes | 19 | 11.8% |
| 45 to 59 Minutes | 6 | 3.7% |
| 60 to 89 Minutes | 36 | 22.4% |
| 90 or more Minutes | 0 | 0.0% |
Commute Time by Sex in Parker s Crossroads
The most common commute times in Parker s Crossroads are 15 to 19 minutes (21 commuters, 26.9%) for males and 60 to 89 minutes (35 commuters, 42.2%) for females.
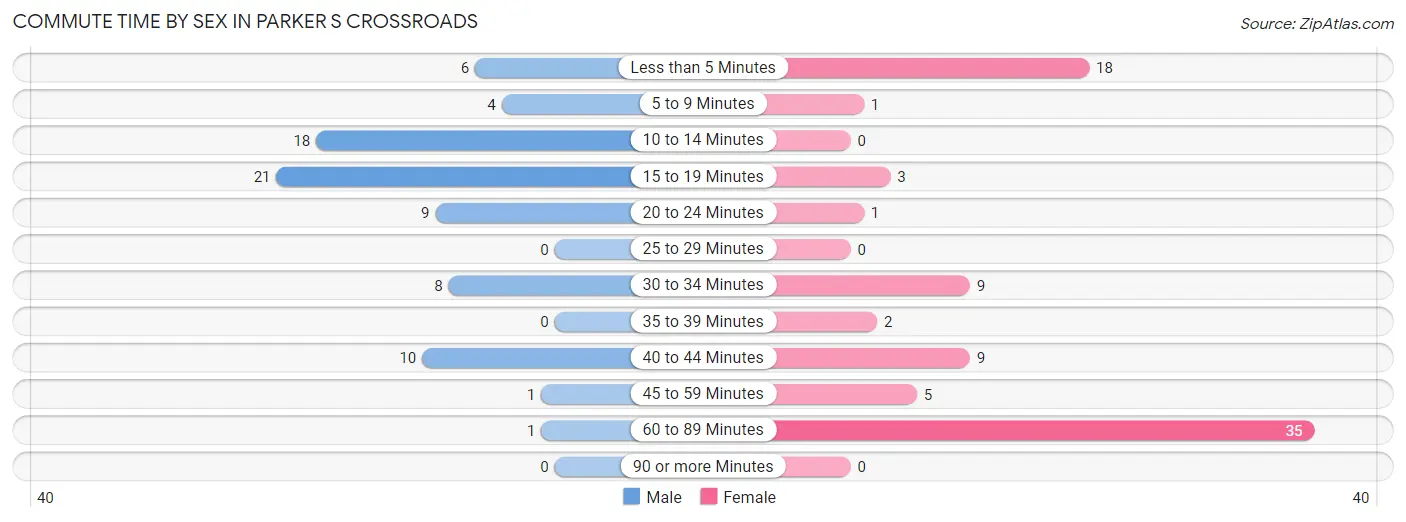
| Commute Time | Male | Female |
| Less than 5 Minutes | 6 (7.7%) | 18 (21.7%) |
| 5 to 9 Minutes | 4 (5.1%) | 1 (1.2%) |
| 10 to 14 Minutes | 18 (23.1%) | 0 (0.0%) |
| 15 to 19 Minutes | 21 (26.9%) | 3 (3.6%) |
| 20 to 24 Minutes | 9 (11.5%) | 1 (1.2%) |
| 25 to 29 Minutes | 0 (0.0%) | 0 (0.0%) |
| 30 to 34 Minutes | 8 (10.3%) | 9 (10.8%) |
| 35 to 39 Minutes | 0 (0.0%) | 2 (2.4%) |
| 40 to 44 Minutes | 10 (12.8%) | 9 (10.8%) |
| 45 to 59 Minutes | 1 (1.3%) | 5 (6.0%) |
| 60 to 89 Minutes | 1 (1.3%) | 35 (42.2%) |
| 90 or more Minutes | 0 (0.0%) | 0 (0.0%) |
Time of Departure to Work by Sex in Parker s Crossroads
The most frequent times of departure to work in Parker s Crossroads are 7:00 AM to 7:29 AM (25, 32.1%) for males and 7:00 AM to 7:29 AM (37, 44.6%) for females.
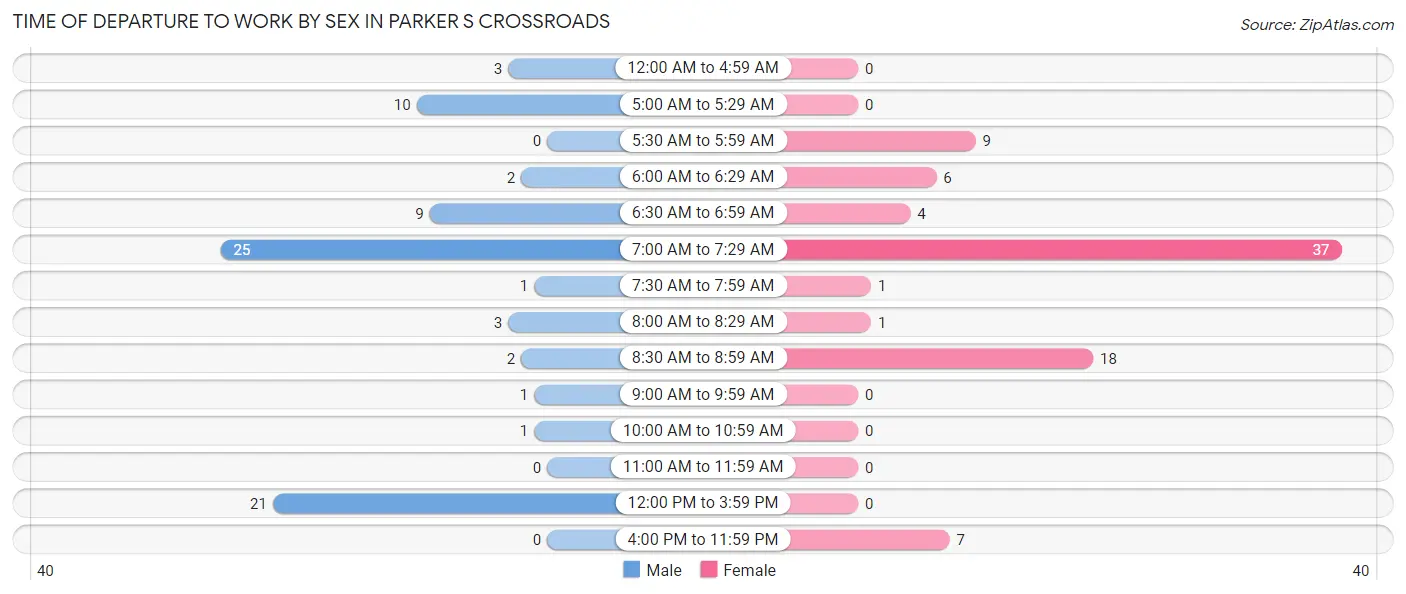
| Time of Departure | Male | Female |
| 12:00 AM to 4:59 AM | 3 (3.8%) | 0 (0.0%) |
| 5:00 AM to 5:29 AM | 10 (12.8%) | 0 (0.0%) |
| 5:30 AM to 5:59 AM | 0 (0.0%) | 9 (10.8%) |
| 6:00 AM to 6:29 AM | 2 (2.6%) | 6 (7.2%) |
| 6:30 AM to 6:59 AM | 9 (11.5%) | 4 (4.8%) |
| 7:00 AM to 7:29 AM | 25 (32.1%) | 37 (44.6%) |
| 7:30 AM to 7:59 AM | 1 (1.3%) | 1 (1.2%) |
| 8:00 AM to 8:29 AM | 3 (3.8%) | 1 (1.2%) |
| 8:30 AM to 8:59 AM | 2 (2.6%) | 18 (21.7%) |
| 9:00 AM to 9:59 AM | 1 (1.3%) | 0 (0.0%) |
| 10:00 AM to 10:59 AM | 1 (1.3%) | 0 (0.0%) |
| 11:00 AM to 11:59 AM | 0 (0.0%) | 0 (0.0%) |
| 12:00 PM to 3:59 PM | 21 (26.9%) | 0 (0.0%) |
| 4:00 PM to 11:59 PM | 0 (0.0%) | 7 (8.4%) |
| Total | 78 (100.0%) | 83 (100.0%) |
Housing Occupancy in Parker s Crossroads
Occupancy by Ownership in Parker s Crossroads
Of the total 209 dwellings in Parker s Crossroads, owner-occupied units account for 190 (90.9%), while renter-occupied units make up 19 (9.1%).
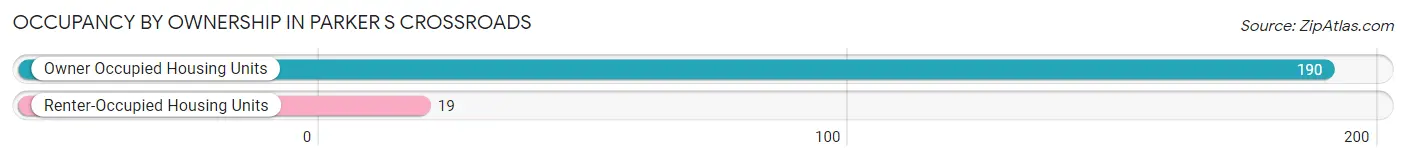
| Occupancy | # Housing Units | % Housing Units |
| Owner Occupied Housing Units | 190 | 90.9% |
| Renter-Occupied Housing Units | 19 | 9.1% |
| Total Occupied Housing Units | 209 | 100.0% |
Occupancy by Household Size in Parker s Crossroads
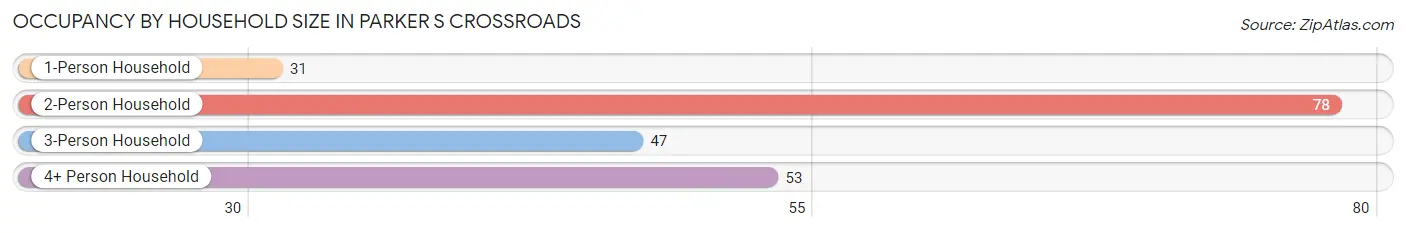
| Household Size | # Housing Units | % Housing Units |
| 1-Person Household | 31 | 14.8% |
| 2-Person Household | 78 | 37.3% |
| 3-Person Household | 47 | 22.5% |
| 4+ Person Household | 53 | 25.4% |
| Total Housing Units | 209 | 100.0% |
Occupancy by Ownership by Household Size in Parker s Crossroads
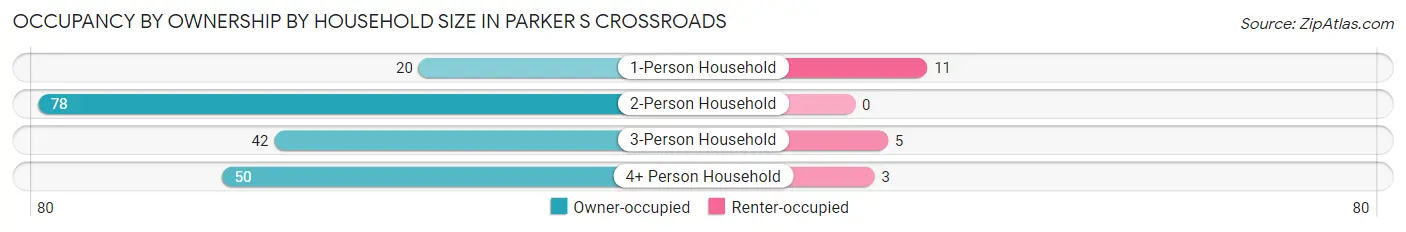
| Household Size | Owner-occupied | Renter-occupied |
| 1-Person Household | 20 (64.5%) | 11 (35.5%) |
| 2-Person Household | 78 (100.0%) | 0 (0.0%) |
| 3-Person Household | 42 (89.4%) | 5 (10.6%) |
| 4+ Person Household | 50 (94.3%) | 3 (5.7%) |
| Total Housing Units | 190 (90.9%) | 19 (9.1%) |
Occupancy by Educational Attainment in Parker s Crossroads
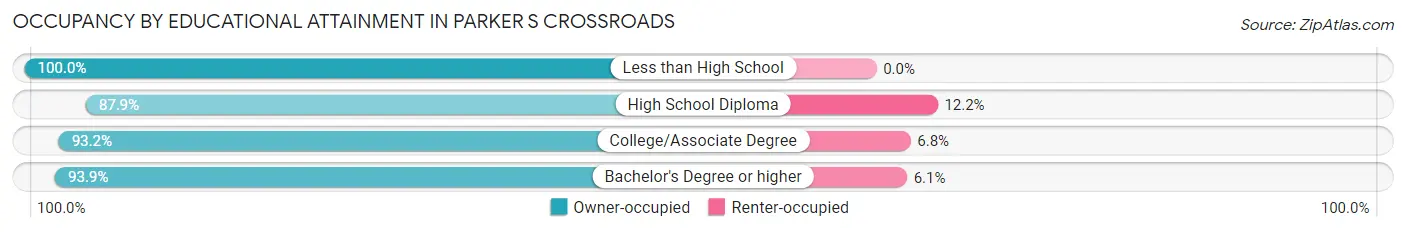
| Household Size | Owner-occupied | Renter-occupied |
| Less than High School | 10 (100.0%) | 0 (0.0%) |
| High School Diploma | 94 (87.8%) | 13 (12.1%) |
| College/Associate Degree | 55 (93.2%) | 4 (6.8%) |
| Bachelor's Degree or higher | 31 (93.9%) | 2 (6.1%) |
Occupancy by Age of Householder in Parker s Crossroads
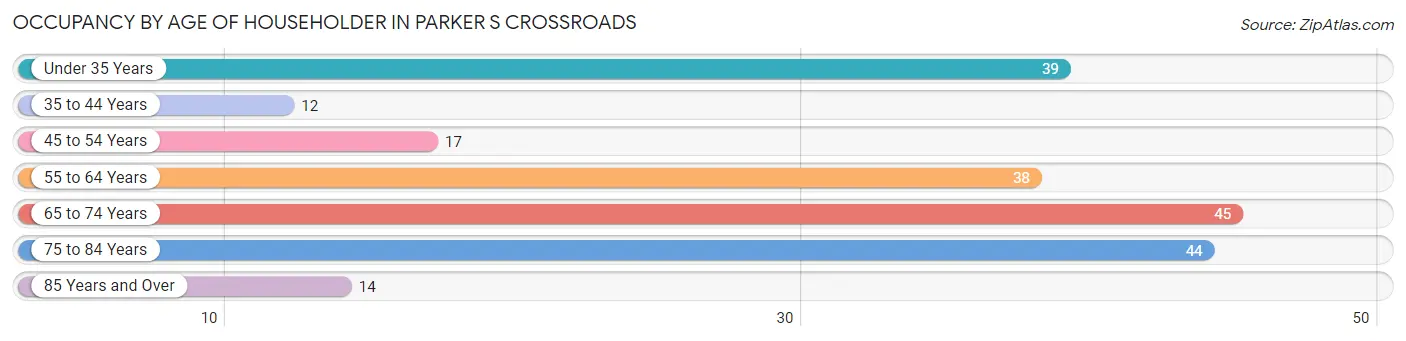
| Age Bracket | # Households | % Households |
| Under 35 Years | 39 | 18.7% |
| 35 to 44 Years | 12 | 5.7% |
| 45 to 54 Years | 17 | 8.1% |
| 55 to 64 Years | 38 | 18.2% |
| 65 to 74 Years | 45 | 21.5% |
| 75 to 84 Years | 44 | 21.0% |
| 85 Years and Over | 14 | 6.7% |
| Total | 209 | 100.0% |
Housing Finances in Parker s Crossroads
Median Income by Occupancy in Parker s Crossroads
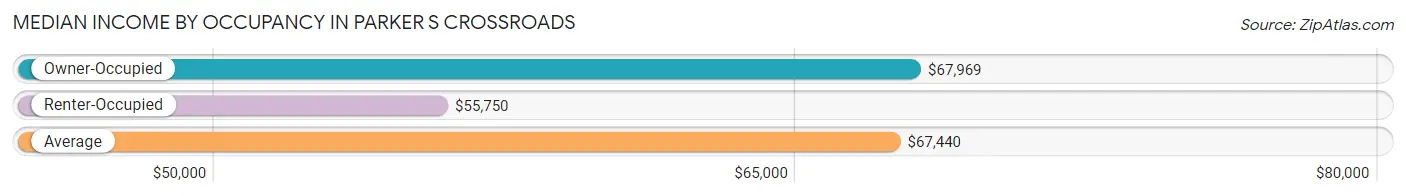
| Occupancy Type | # Households | Median Income |
| Owner-Occupied | 190 (90.9%) | $67,969 |
| Renter-Occupied | 19 (9.1%) | $55,750 |
| Average | 209 (100.0%) | $67,440 |
Occupancy by Householder Income Bracket in Parker s Crossroads
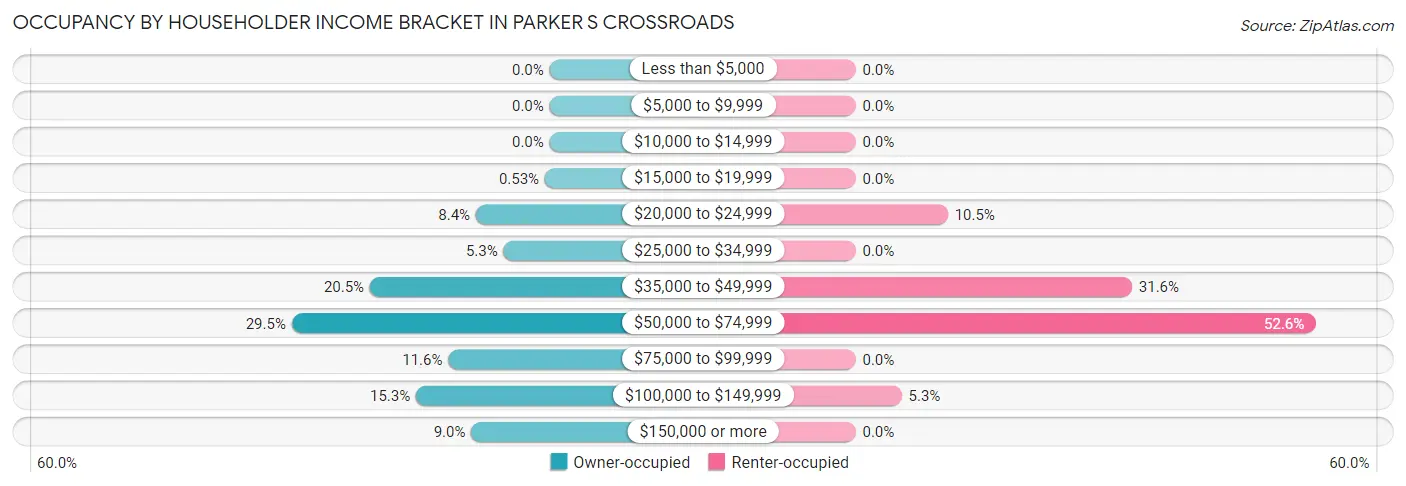
| Income Bracket | Owner-occupied | Renter-occupied |
| Less than $5,000 | 0 (0.0%) | 0 (0.0%) |
| $5,000 to $9,999 | 0 (0.0%) | 0 (0.0%) |
| $10,000 to $14,999 | 0 (0.0%) | 0 (0.0%) |
| $15,000 to $19,999 | 1 (0.5%) | 0 (0.0%) |
| $20,000 to $24,999 | 16 (8.4%) | 2 (10.5%) |
| $25,000 to $34,999 | 10 (5.3%) | 0 (0.0%) |
| $35,000 to $49,999 | 39 (20.5%) | 6 (31.6%) |
| $50,000 to $74,999 | 56 (29.5%) | 10 (52.6%) |
| $75,000 to $99,999 | 22 (11.6%) | 0 (0.0%) |
| $100,000 to $149,999 | 29 (15.3%) | 1 (5.3%) |
| $150,000 or more | 17 (8.9%) | 0 (0.0%) |
| Total | 190 (100.0%) | 19 (100.0%) |
Monthly Housing Cost Tiers in Parker s Crossroads
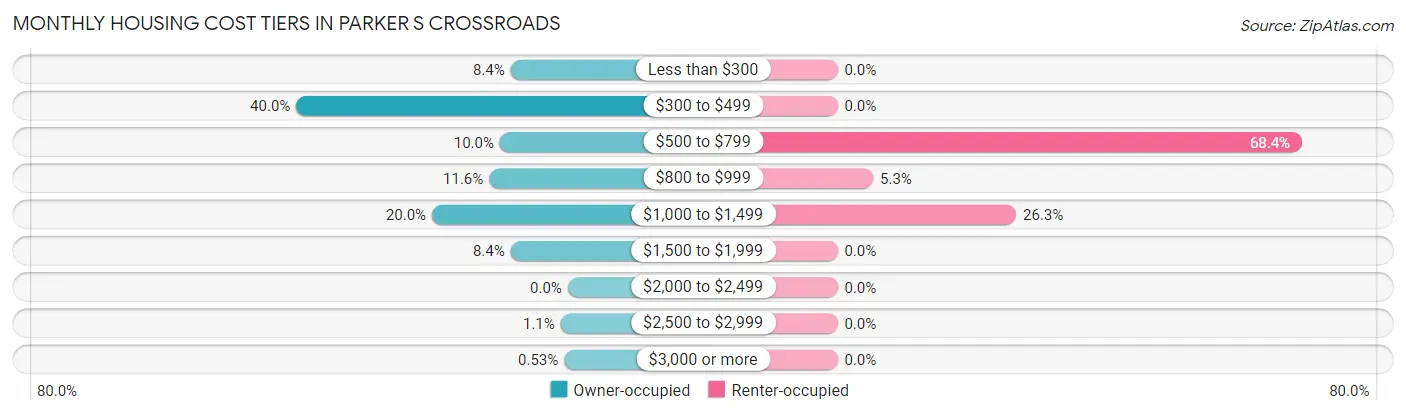
| Monthly Cost | Owner-occupied | Renter-occupied |
| Less than $300 | 16 (8.4%) | 0 (0.0%) |
| $300 to $499 | 76 (40.0%) | 0 (0.0%) |
| $500 to $799 | 19 (10.0%) | 13 (68.4%) |
| $800 to $999 | 22 (11.6%) | 1 (5.3%) |
| $1,000 to $1,499 | 38 (20.0%) | 5 (26.3%) |
| $1,500 to $1,999 | 16 (8.4%) | 0 (0.0%) |
| $2,000 to $2,499 | 0 (0.0%) | 0 (0.0%) |
| $2,500 to $2,999 | 2 (1.1%) | 0 (0.0%) |
| $3,000 or more | 1 (0.5%) | 0 (0.0%) |
| Total | 190 (100.0%) | 19 (100.0%) |
Physical Housing Characteristics in Parker s Crossroads
Housing Structures in Parker s Crossroads
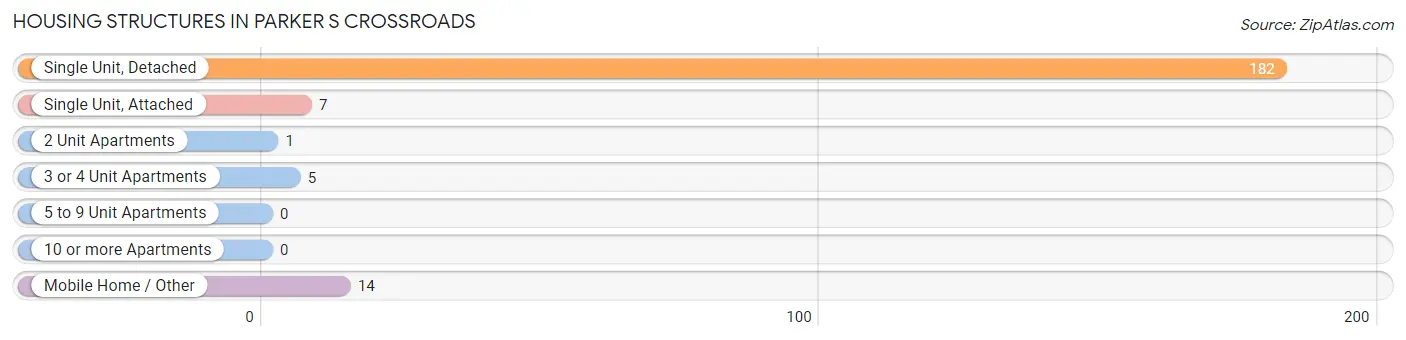
| Structure Type | # Housing Units | % Housing Units |
| Single Unit, Detached | 182 | 87.1% |
| Single Unit, Attached | 7 | 3.4% |
| 2 Unit Apartments | 1 | 0.5% |
| 3 or 4 Unit Apartments | 5 | 2.4% |
| 5 to 9 Unit Apartments | 0 | 0.0% |
| 10 or more Apartments | 0 | 0.0% |
| Mobile Home / Other | 14 | 6.7% |
| Total | 209 | 100.0% |
Housing Structures by Occupancy in Parker s Crossroads
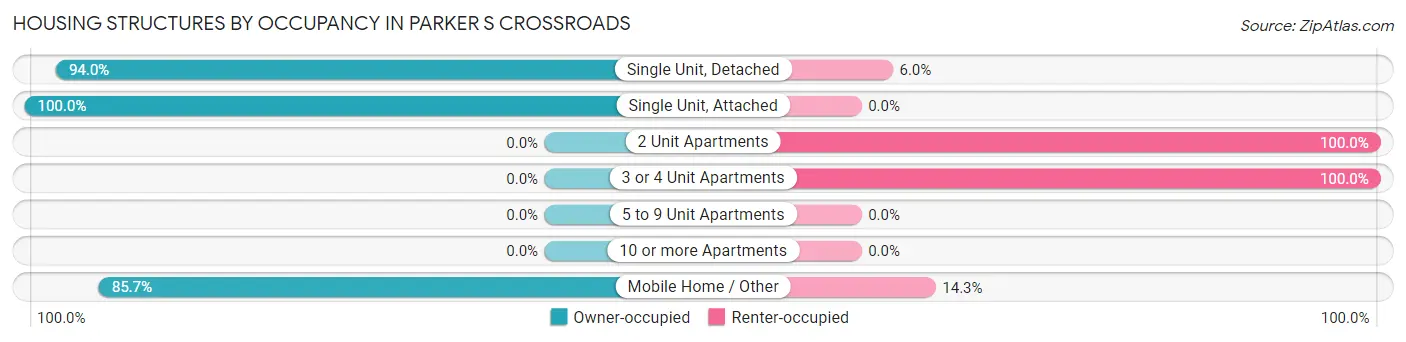
| Structure Type | Owner-occupied | Renter-occupied |
| Single Unit, Detached | 171 (94.0%) | 11 (6.0%) |
| Single Unit, Attached | 7 (100.0%) | 0 (0.0%) |
| 2 Unit Apartments | 0 (0.0%) | 1 (100.0%) |
| 3 or 4 Unit Apartments | 0 (0.0%) | 5 (100.0%) |
| 5 to 9 Unit Apartments | 0 (0.0%) | 0 (0.0%) |
| 10 or more Apartments | 0 (0.0%) | 0 (0.0%) |
| Mobile Home / Other | 12 (85.7%) | 2 (14.3%) |
| Total | 190 (90.9%) | 19 (9.1%) |
Housing Structures by Number of Rooms in Parker s Crossroads
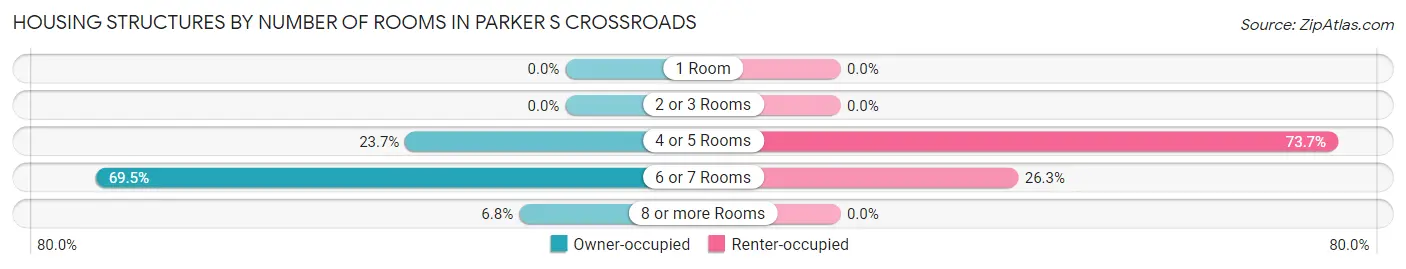
| Number of Rooms | Owner-occupied | Renter-occupied |
| 1 Room | 0 (0.0%) | 0 (0.0%) |
| 2 or 3 Rooms | 0 (0.0%) | 0 (0.0%) |
| 4 or 5 Rooms | 45 (23.7%) | 14 (73.7%) |
| 6 or 7 Rooms | 132 (69.5%) | 5 (26.3%) |
| 8 or more Rooms | 13 (6.8%) | 0 (0.0%) |
| Total | 190 (100.0%) | 19 (100.0%) |
Housing Structure by Heating Type in Parker s Crossroads
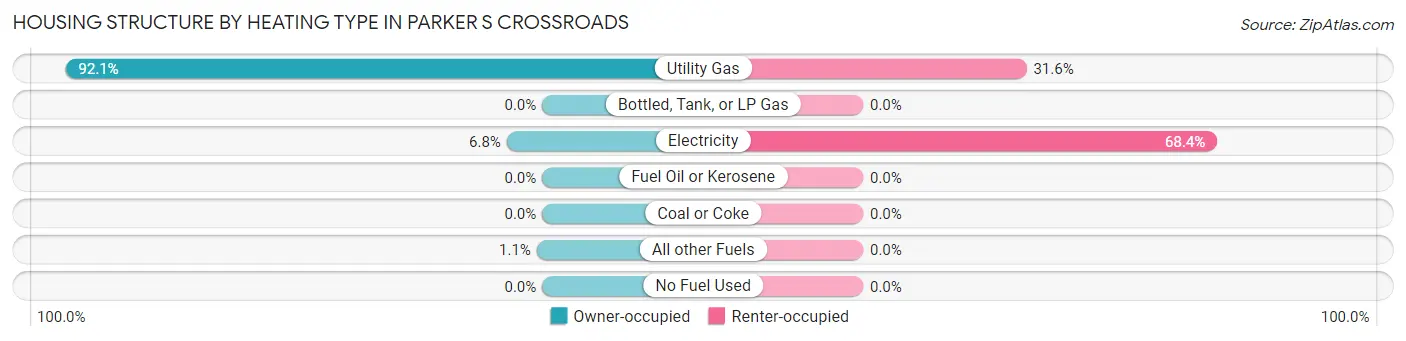
| Heating Type | Owner-occupied | Renter-occupied |
| Utility Gas | 175 (92.1%) | 6 (31.6%) |
| Bottled, Tank, or LP Gas | 0 (0.0%) | 0 (0.0%) |
| Electricity | 13 (6.8%) | 13 (68.4%) |
| Fuel Oil or Kerosene | 0 (0.0%) | 0 (0.0%) |
| Coal or Coke | 0 (0.0%) | 0 (0.0%) |
| All other Fuels | 2 (1.1%) | 0 (0.0%) |
| No Fuel Used | 0 (0.0%) | 0 (0.0%) |
| Total | 190 (100.0%) | 19 (100.0%) |
Household Vehicle Usage in Parker s Crossroads
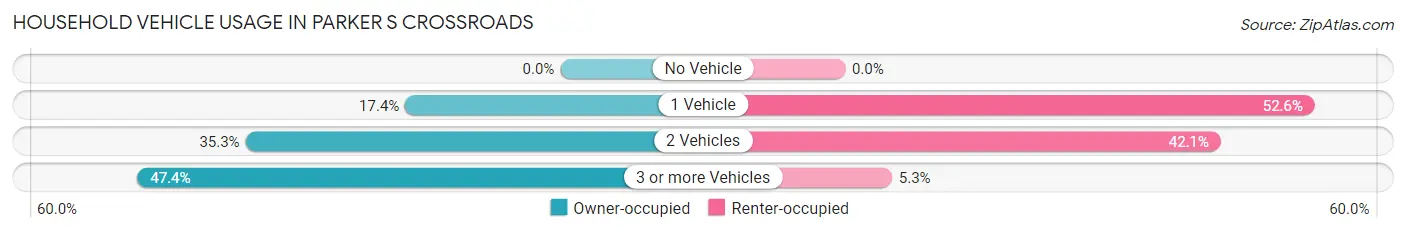
| Vehicles per Household | Owner-occupied | Renter-occupied |
| No Vehicle | 0 (0.0%) | 0 (0.0%) |
| 1 Vehicle | 33 (17.4%) | 10 (52.6%) |
| 2 Vehicles | 67 (35.3%) | 8 (42.1%) |
| 3 or more Vehicles | 90 (47.4%) | 1 (5.3%) |
| Total | 190 (100.0%) | 19 (100.0%) |
Real Estate & Mortgages in Parker s Crossroads
Real Estate and Mortgage Overview in Parker s Crossroads
| Characteristic | Without Mortgage | With Mortgage |
| Housing Units | 99 | 91 |
| Median Property Value | $113,000 | $209,600 |
| Median Household Income | $47,446 | $7 |
| Monthly Housing Costs | $421 | $1 |
| Real Estate Taxes | $552 | $3 |
Property Value by Mortgage Status in Parker s Crossroads
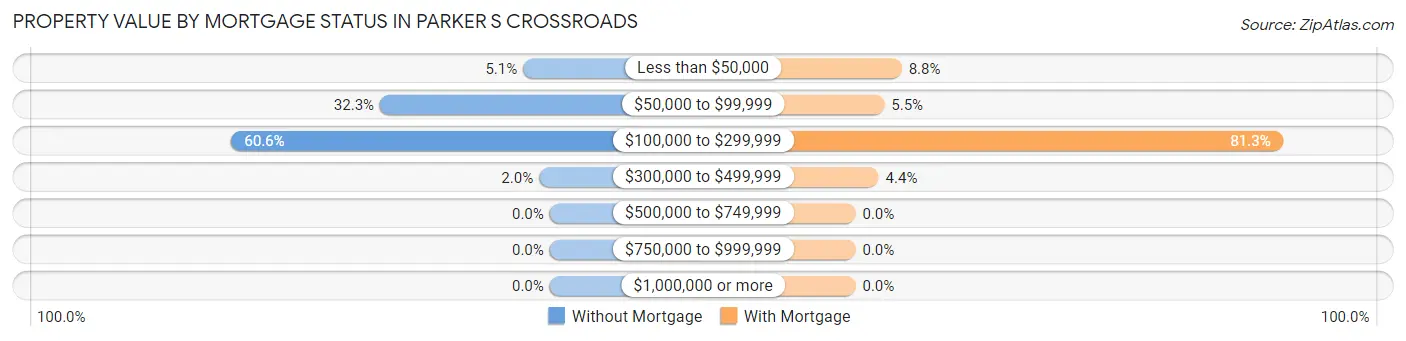
| Property Value | Without Mortgage | With Mortgage |
| Less than $50,000 | 5 (5.1%) | 8 (8.8%) |
| $50,000 to $99,999 | 32 (32.3%) | 5 (5.5%) |
| $100,000 to $299,999 | 60 (60.6%) | 74 (81.3%) |
| $300,000 to $499,999 | 2 (2.0%) | 4 (4.4%) |
| $500,000 to $749,999 | 0 (0.0%) | 0 (0.0%) |
| $750,000 to $999,999 | 0 (0.0%) | 0 (0.0%) |
| $1,000,000 or more | 0 (0.0%) | 0 (0.0%) |
| Total | 99 (100.0%) | 91 (100.0%) |
Household Income by Mortgage Status in Parker s Crossroads
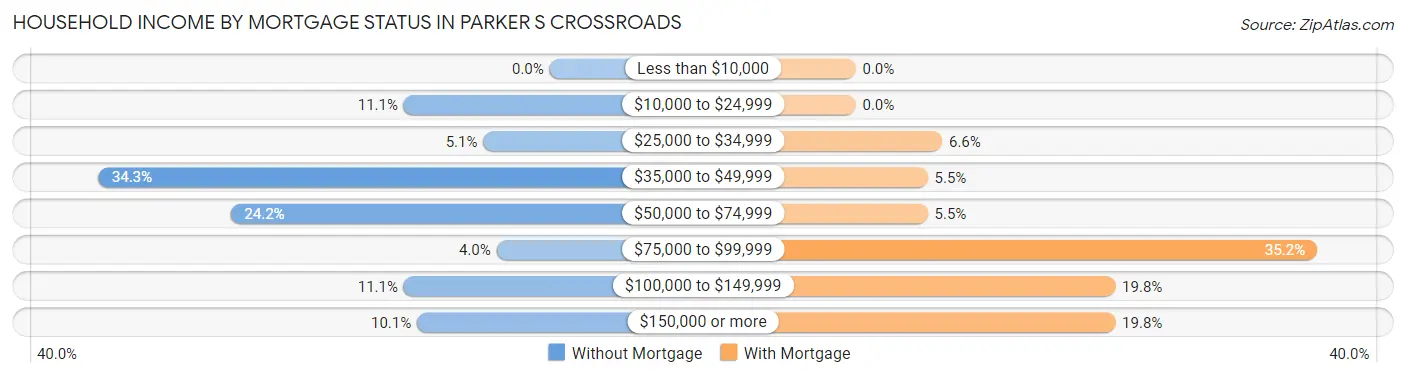
| Household Income | Without Mortgage | With Mortgage |
| Less than $10,000 | 0 (0.0%) | 0 (0.0%) |
| $10,000 to $24,999 | 11 (11.1%) | 0 (0.0%) |
| $25,000 to $34,999 | 5 (5.1%) | 6 (6.6%) |
| $35,000 to $49,999 | 34 (34.3%) | 5 (5.5%) |
| $50,000 to $74,999 | 24 (24.2%) | 5 (5.5%) |
| $75,000 to $99,999 | 4 (4.0%) | 32 (35.2%) |
| $100,000 to $149,999 | 11 (11.1%) | 18 (19.8%) |
| $150,000 or more | 10 (10.1%) | 18 (19.8%) |
| Total | 99 (100.0%) | 91 (100.0%) |
Property Value to Household Income Ratio in Parker s Crossroads
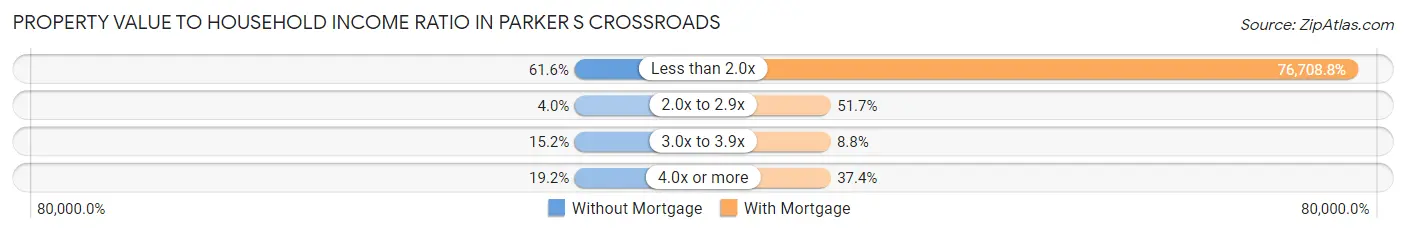
| Value-to-Income Ratio | Without Mortgage | With Mortgage |
| Less than 2.0x | 61 (61.6%) | 69,805 (76,708.8%) |
| 2.0x to 2.9x | 4 (4.0%) | 47 (51.6%) |
| 3.0x to 3.9x | 15 (15.1%) | 8 (8.8%) |
| 4.0x or more | 19 (19.2%) | 34 (37.4%) |
| Total | 99 (100.0%) | 91 (100.0%) |
Real Estate Taxes by Mortgage Status in Parker s Crossroads
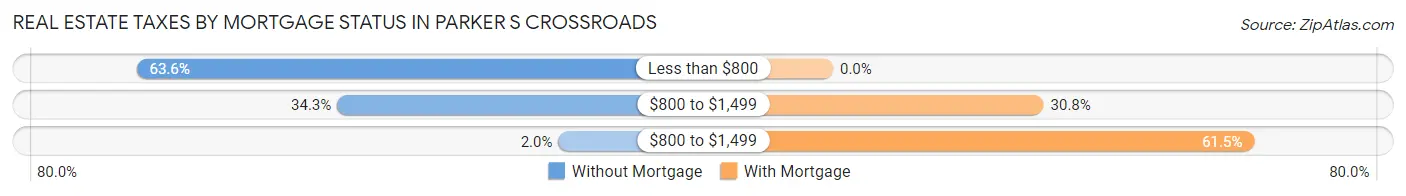
| Property Taxes | Without Mortgage | With Mortgage |
| Less than $800 | 63 (63.6%) | 0 (0.0%) |
| $800 to $1,499 | 34 (34.3%) | 28 (30.8%) |
| $800 to $1,499 | 2 (2.0%) | 56 (61.5%) |
| Total | 99 (100.0%) | 91 (100.0%) |
Health & Disability in Parker s Crossroads
Health Insurance Coverage by Age in Parker s Crossroads
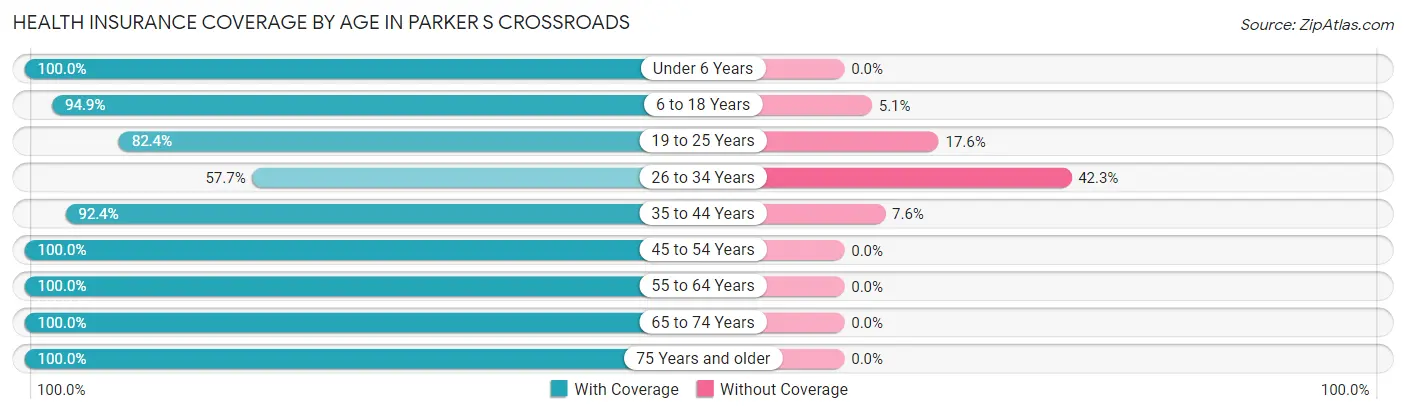
| Age Bracket | With Coverage | Without Coverage |
| Under 6 Years | 22 (100.0%) | 0 (0.0%) |
| 6 to 18 Years | 74 (94.9%) | 4 (5.1%) |
| 19 to 25 Years | 75 (82.4%) | 16 (17.6%) |
| 26 to 34 Years | 15 (57.7%) | 11 (42.3%) |
| 35 to 44 Years | 85 (92.4%) | 7 (7.6%) |
| 45 to 54 Years | 55 (100.0%) | 0 (0.0%) |
| 55 to 64 Years | 55 (100.0%) | 0 (0.0%) |
| 65 to 74 Years | 90 (100.0%) | 0 (0.0%) |
| 75 Years and older | 89 (100.0%) | 0 (0.0%) |
| Total | 560 (93.6%) | 38 (6.4%) |
Health Insurance Coverage by Citizenship Status in Parker s Crossroads
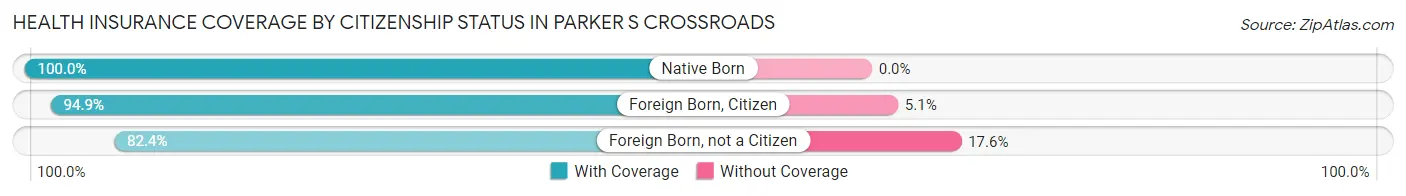
| Citizenship Status | With Coverage | Without Coverage |
| Native Born | 22 (100.0%) | 0 (0.0%) |
| Foreign Born, Citizen | 74 (94.9%) | 4 (5.1%) |
| Foreign Born, not a Citizen | 75 (82.4%) | 16 (17.6%) |
Health Insurance Coverage by Household Income in Parker s Crossroads
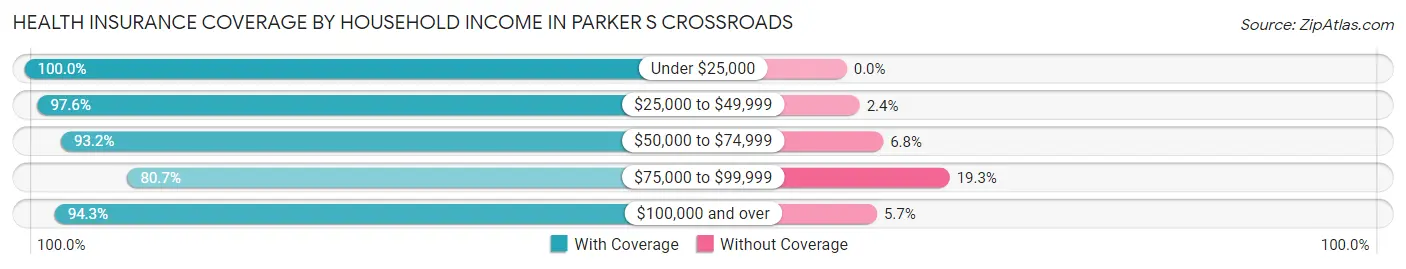
| Household Income | With Coverage | Without Coverage |
| Under $25,000 | 41 (100.0%) | 0 (0.0%) |
| $25,000 to $49,999 | 202 (97.6%) | 5 (2.4%) |
| $50,000 to $74,999 | 150 (93.2%) | 11 (6.8%) |
| $75,000 to $99,999 | 67 (80.7%) | 16 (19.3%) |
| $100,000 and over | 100 (94.3%) | 6 (5.7%) |
Public vs Private Health Insurance Coverage by Age in Parker s Crossroads
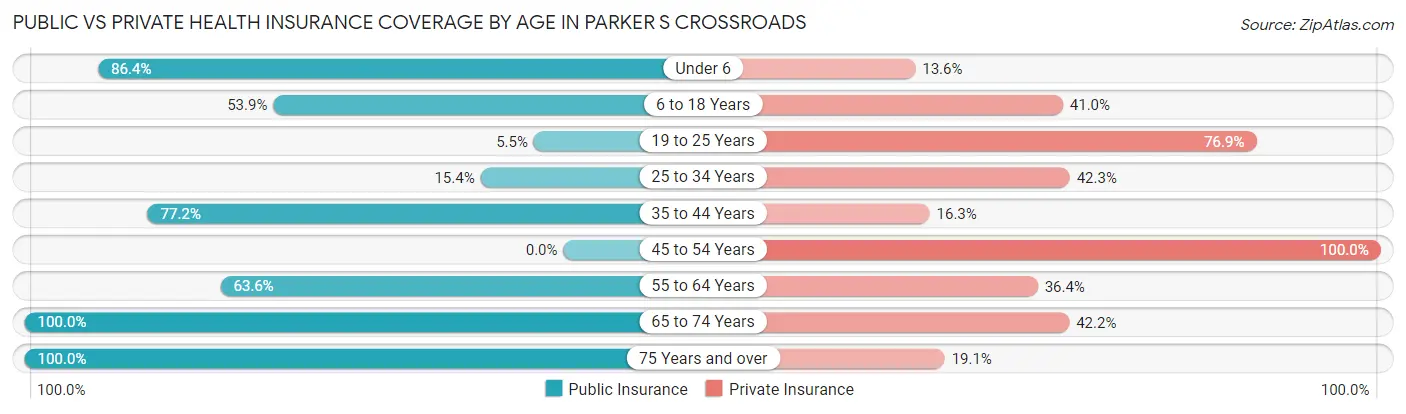
| Age Bracket | Public Insurance | Private Insurance |
| Under 6 | 19 (86.4%) | 3 (13.6%) |
| 6 to 18 Years | 42 (53.8%) | 32 (41.0%) |
| 19 to 25 Years | 5 (5.5%) | 70 (76.9%) |
| 25 to 34 Years | 4 (15.4%) | 11 (42.3%) |
| 35 to 44 Years | 71 (77.2%) | 15 (16.3%) |
| 45 to 54 Years | 0 (0.0%) | 55 (100.0%) |
| 55 to 64 Years | 35 (63.6%) | 20 (36.4%) |
| 65 to 74 Years | 90 (100.0%) | 38 (42.2%) |
| 75 Years and over | 89 (100.0%) | 17 (19.1%) |
| Total | 355 (59.4%) | 261 (43.6%) |
Disability Status by Sex by Age in Parker s Crossroads
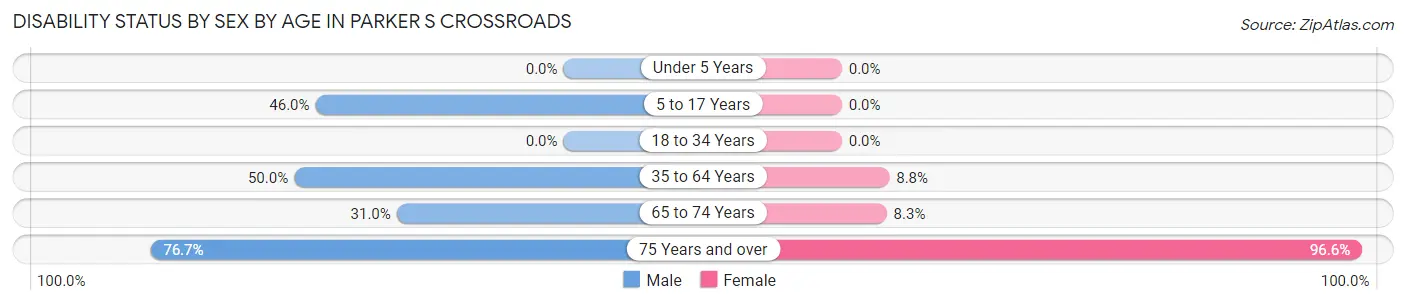
| Age Bracket | Male | Female |
| Under 5 Years | 0 (0.0%) | 0 (0.0%) |
| 5 to 17 Years | 29 (46.0%) | 0 (0.0%) |
| 18 to 34 Years | 0 (0.0%) | 0 (0.0%) |
| 35 to 64 Years | 67 (50.0%) | 6 (8.8%) |
| 65 to 74 Years | 13 (30.9%) | 4 (8.3%) |
| 75 Years and over | 46 (76.7%) | 28 (96.6%) |
Disability Class by Sex by Age in Parker s Crossroads
Disability Class: Hearing Difficulty
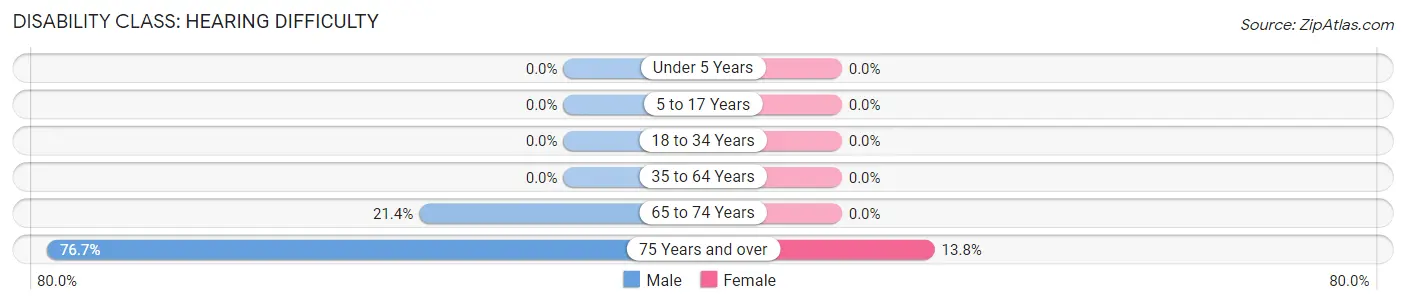
| Age Bracket | Male | Female |
| Under 5 Years | 0 (0.0%) | 0 (0.0%) |
| 5 to 17 Years | 0 (0.0%) | 0 (0.0%) |
| 18 to 34 Years | 0 (0.0%) | 0 (0.0%) |
| 35 to 64 Years | 0 (0.0%) | 0 (0.0%) |
| 65 to 74 Years | 9 (21.4%) | 0 (0.0%) |
| 75 Years and over | 46 (76.7%) | 4 (13.8%) |
Disability Class: Vision Difficulty
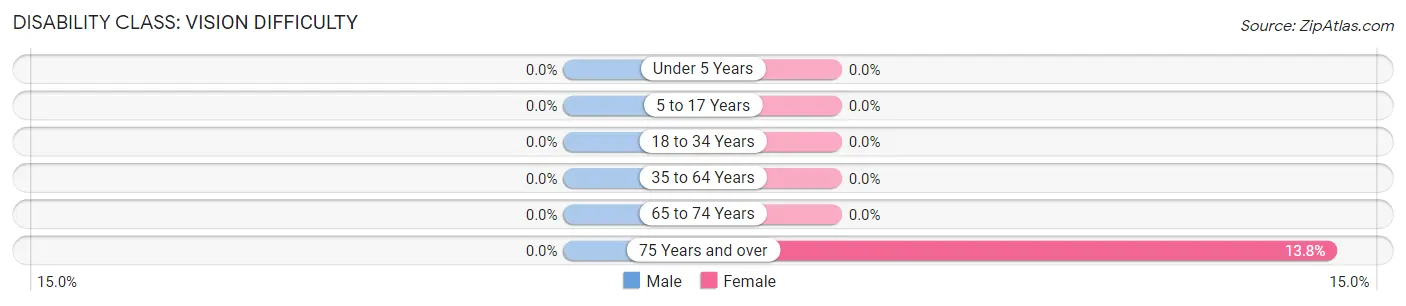
| Age Bracket | Male | Female |
| Under 5 Years | 0 (0.0%) | 0 (0.0%) |
| 5 to 17 Years | 0 (0.0%) | 0 (0.0%) |
| 18 to 34 Years | 0 (0.0%) | 0 (0.0%) |
| 35 to 64 Years | 0 (0.0%) | 0 (0.0%) |
| 65 to 74 Years | 0 (0.0%) | 0 (0.0%) |
| 75 Years and over | 0 (0.0%) | 4 (13.8%) |
Disability Class: Cognitive Difficulty
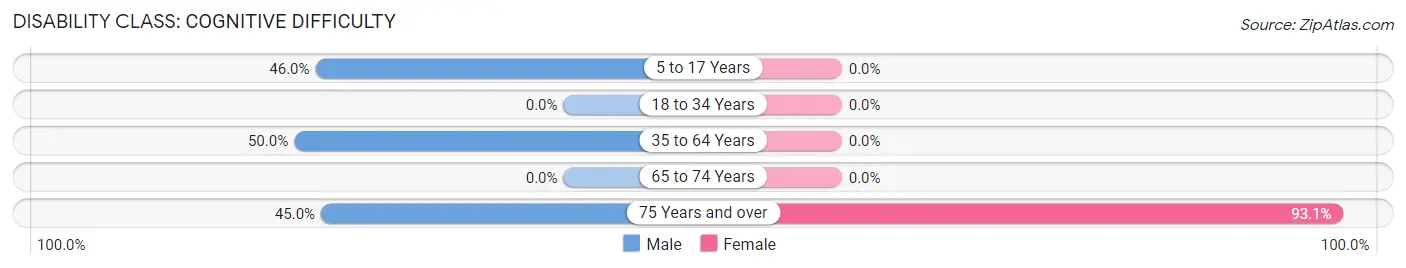
| Age Bracket | Male | Female |
| 5 to 17 Years | 29 (46.0%) | 0 (0.0%) |
| 18 to 34 Years | 0 (0.0%) | 0 (0.0%) |
| 35 to 64 Years | 67 (50.0%) | 0 (0.0%) |
| 65 to 74 Years | 0 (0.0%) | 0 (0.0%) |
| 75 Years and over | 27 (45.0%) | 27 (93.1%) |
Disability Class: Ambulatory Difficulty
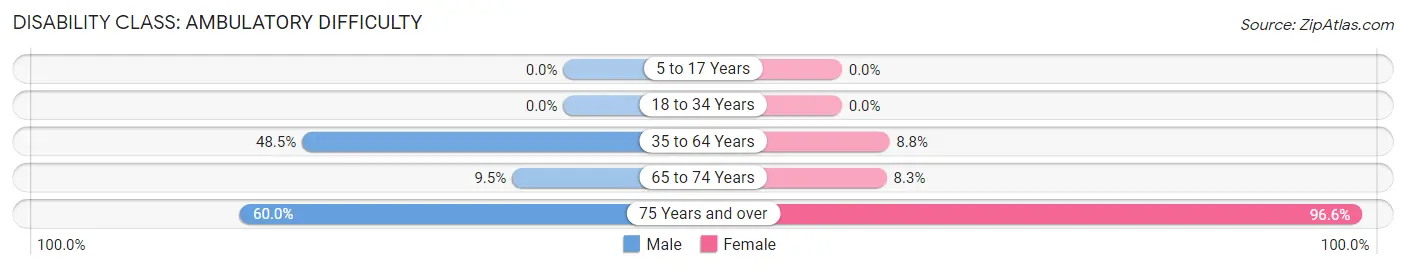
| Age Bracket | Male | Female |
| 5 to 17 Years | 0 (0.0%) | 0 (0.0%) |
| 18 to 34 Years | 0 (0.0%) | 0 (0.0%) |
| 35 to 64 Years | 65 (48.5%) | 6 (8.8%) |
| 65 to 74 Years | 4 (9.5%) | 4 (8.3%) |
| 75 Years and over | 36 (60.0%) | 28 (96.6%) |
Disability Class: Self-Care Difficulty
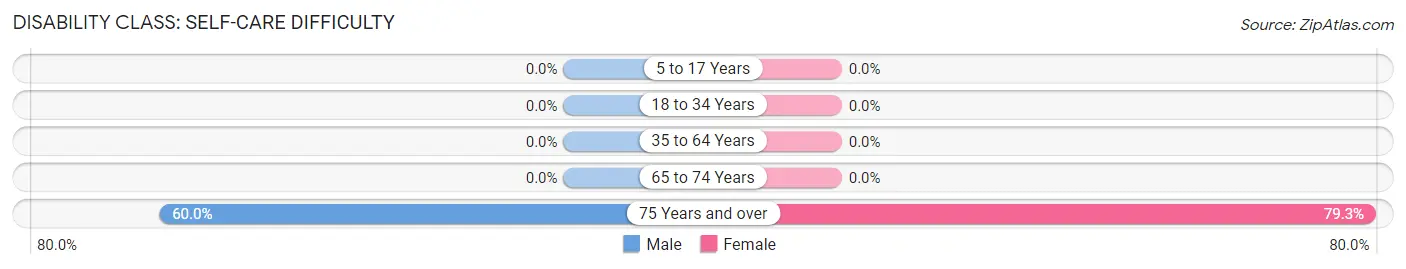
| Age Bracket | Male | Female |
| 5 to 17 Years | 0 (0.0%) | 0 (0.0%) |
| 18 to 34 Years | 0 (0.0%) | 0 (0.0%) |
| 35 to 64 Years | 0 (0.0%) | 0 (0.0%) |
| 65 to 74 Years | 0 (0.0%) | 0 (0.0%) |
| 75 Years and over | 36 (60.0%) | 23 (79.3%) |
Technology Access in Parker s Crossroads
Computing Device Access in Parker s Crossroads
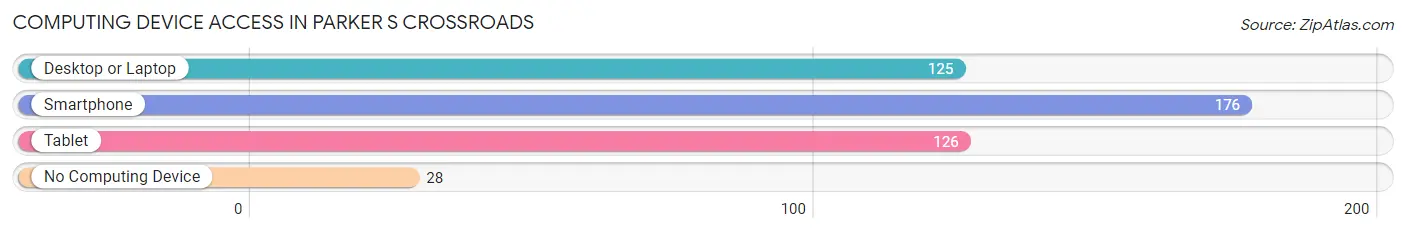
| Device Type | # Households | % Households |
| Desktop or Laptop | 125 | 59.8% |
| Smartphone | 176 | 84.2% |
| Tablet | 126 | 60.3% |
| No Computing Device | 28 | 13.4% |
| Total | 209 | 100.0% |
Internet Access in Parker s Crossroads
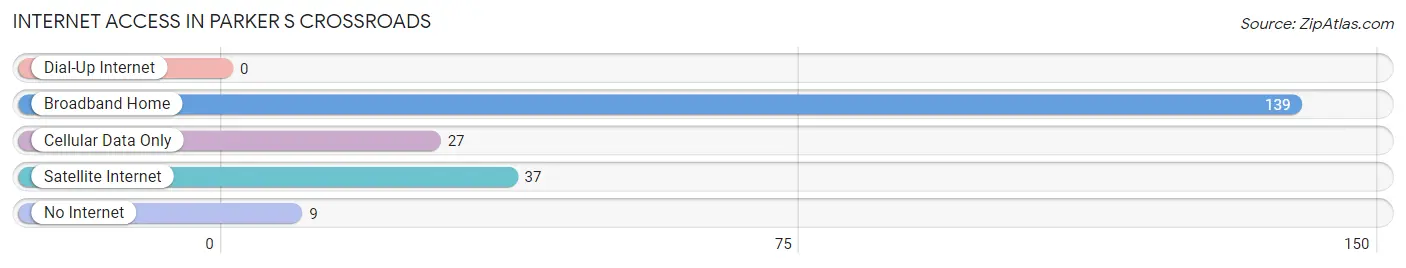
| Internet Type | # Households | % Households |
| Dial-Up Internet | 0 | 0.0% |
| Broadband Home | 139 | 66.5% |
| Cellular Data Only | 27 | 12.9% |
| Satellite Internet | 37 | 17.7% |
| No Internet | 9 | 4.3% |
| Total | 209 | 100.0% |
Parker s Crossroads Summary
Parker’s Crossroads is a small unincorporated community located in Henderson County, Tennessee. It is situated at the intersection of U.S. Route 45 and State Route 22, approximately 10 miles north of Lexington and 25 miles south of Jackson. The community is named after the Civil War battle that took place there in December 1862.
History
The area around Parker’s Crossroads was first settled in the early 1800s by families of European descent. The community was named after the Civil War battle that took place there in December 1862. The battle was fought between Confederate forces under the command of General Nathan Bedford Forrest and Union forces under the command of General Jeremiah C. Sullivan. The battle resulted in a Confederate victory, and the area has since been known as Parker’s Crossroads.
In the late 1800s, the community began to grow and develop. A post office was established in 1887, and a school was built in 1895. The community also had a general store, a blacksmith shop, and a cotton gin.
Geography
Parker’s Crossroads is located in Henderson County, Tennessee. It is situated at the intersection of U.S. Route 45 and State Route 22, approximately 10 miles north of Lexington and 25 miles south of Jackson. The community is located in a rural area, surrounded by farmland and forests. The area is characterized by rolling hills and valleys, with the highest point being the summit of Parker’s Crossroads Mountain, which is located just south of the community.
Economy
The economy of Parker’s Crossroads is largely based on agriculture. The area is home to several farms, which produce a variety of crops, including corn, soybeans, wheat, and hay. The community also has a few small businesses, including a general store, a gas station, and a restaurant.
Demographics
As of the 2010 census, the population of Parker’s Crossroads was 1,092. The racial makeup of the community was 97.3% White, 0.9% African American, 0.2% Native American, 0.2% Asian, and 1.4% from other races. The median household income was $37,917, and the median family income was $45,625. The per capita income was $18,945.
Conclusion
Parker’s Crossroads is a small unincorporated community located in Henderson County, Tennessee. It is situated at the intersection of U.S. Route 45 and State Route 22, approximately 10 miles north of Lexington and 25 miles south of Jackson. The community is named after the Civil War battle that took place there in December 1862. The economy of Parker’s Crossroads is largely based on agriculture, and the population of the community was 1,092 as of the 2010 census.
Common Questions
What is Per Capita Income in Parker s Crossroads?
Per Capita income in Parker s Crossroads is $28,561.
What is the Median Family Income in Parker s Crossroads?
Median Family Income in Parker s Crossroads is $68,333.
What is the Median Household income in Parker s Crossroads?
Median Household Income in Parker s Crossroads is $67,440.
What is Income or Wage Gap in Parker s Crossroads?
Income or Wage Gap in Parker s Crossroads is 33.6%.
Women in Parker s Crossroads earn 66.4 cents for every dollar earned by a man.
What is Inequality or Gini Index in Parker s Crossroads?
Inequality or Gini Index in Parker s Crossroads is 0.32.
What is the Total Population of Parker s Crossroads?
Total Population of Parker s Crossroads is 598.
What is the Total Male Population of Parker s Crossroads?
Total Male Population of Parker s Crossroads is 341.
What is the Total Female Population of Parker s Crossroads?
Total Female Population of Parker s Crossroads is 257.
What is the Ratio of Males per 100 Females in Parker s Crossroads?
There are 132.68 Males per 100 Females in Parker s Crossroads.
What is the Ratio of Females per 100 Males in Parker s Crossroads?
There are 75.37 Females per 100 Males in Parker s Crossroads.
What is the Median Population Age in Parker s Crossroads?
Median Population Age in Parker s Crossroads is 40.3 Years.
What is the Average Family Size in Parker s Crossroads
Average Family Size in Parker s Crossroads is 3.1 People.
What is the Average Household Size in Parker s Crossroads
Average Household Size in Parker s Crossroads is 2.9 People.
How Large is the Labor Force in Parker s Crossroads?
There are 187 People in the Labor Forcein in Parker s Crossroads.
What is the Percentage of People in the Labor Force in Parker s Crossroads?
35.9% of People are in the Labor Force in Parker s Crossroads.