Newbern, TN Map & Demographics
Newbern Map
Newbern Overview
$24,084
PER CAPITA INCOME
$56,423
AVG FAMILY INCOME
$44,526
AVG HOUSEHOLD INCOME
27.3%
WAGE / INCOME GAP [ % ]
72.7¢/ $1
WAGE / INCOME GAP [ $ ]
0.38
INEQUALITY / GINI INDEX
3,321
TOTAL POPULATION
1,554
MALE POPULATION
1,767
FEMALE POPULATION
87.95
MALES / 100 FEMALES
113.71
FEMALES / 100 MALES
33.3
MEDIAN AGE
3.1
AVG FAMILY SIZE
2.2
AVG HOUSEHOLD SIZE
1,399
LABOR FORCE [ PEOPLE ]
55.0%
PERCENT IN LABOR FORCE
2.7%
UNEMPLOYMENT RATE
Newbern Zip Codes
Newbern Area Codes
Income in Newbern
Income Overview in Newbern
Per Capita Income in Newbern is $24,084, while median incomes of families and households are $56,423 and $44,526 respectively.
| Characteristic | Number | Measure |
| Per Capita Income | 3,321 | $24,084 |
| Median Family Income | 812 | $56,423 |
| Mean Family Income | 812 | $63,452 |
| Median Household Income | 1,516 | $44,526 |
| Mean Household Income | 1,516 | $50,449 |
| Income Deficit | 812 | $0 |
| Wage / Income Gap (%) | 3,321 | 27.32% |
| Wage / Income Gap ($) | 3,321 | 72.68¢ per $1 |
| Gini / Inequality Index | 3,321 | 0.38 |
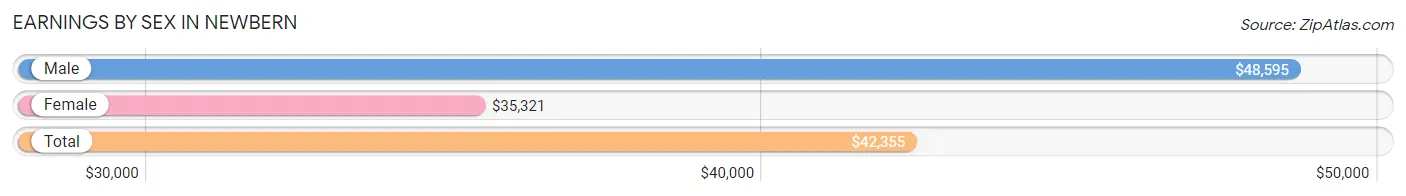
Earnings by Sex in Newbern
Average Earnings in Newbern are $42,355, $48,595 for men and $35,321 for women, a difference of 27.3%.
| Sex | Number | Average Earnings |
| Male | 686 (47.1%) | $48,595 |
| Female | 771 (52.9%) | $35,321 |
| Total | 1,457 (100.0%) | $42,355 |
Earnings by Sex by Income Bracket in Newbern
The most common earnings brackets in Newbern are $45,000 to $49,999 for men (158 | 23.0%) and $50,000 to $54,999 for women (146 | 18.9%).
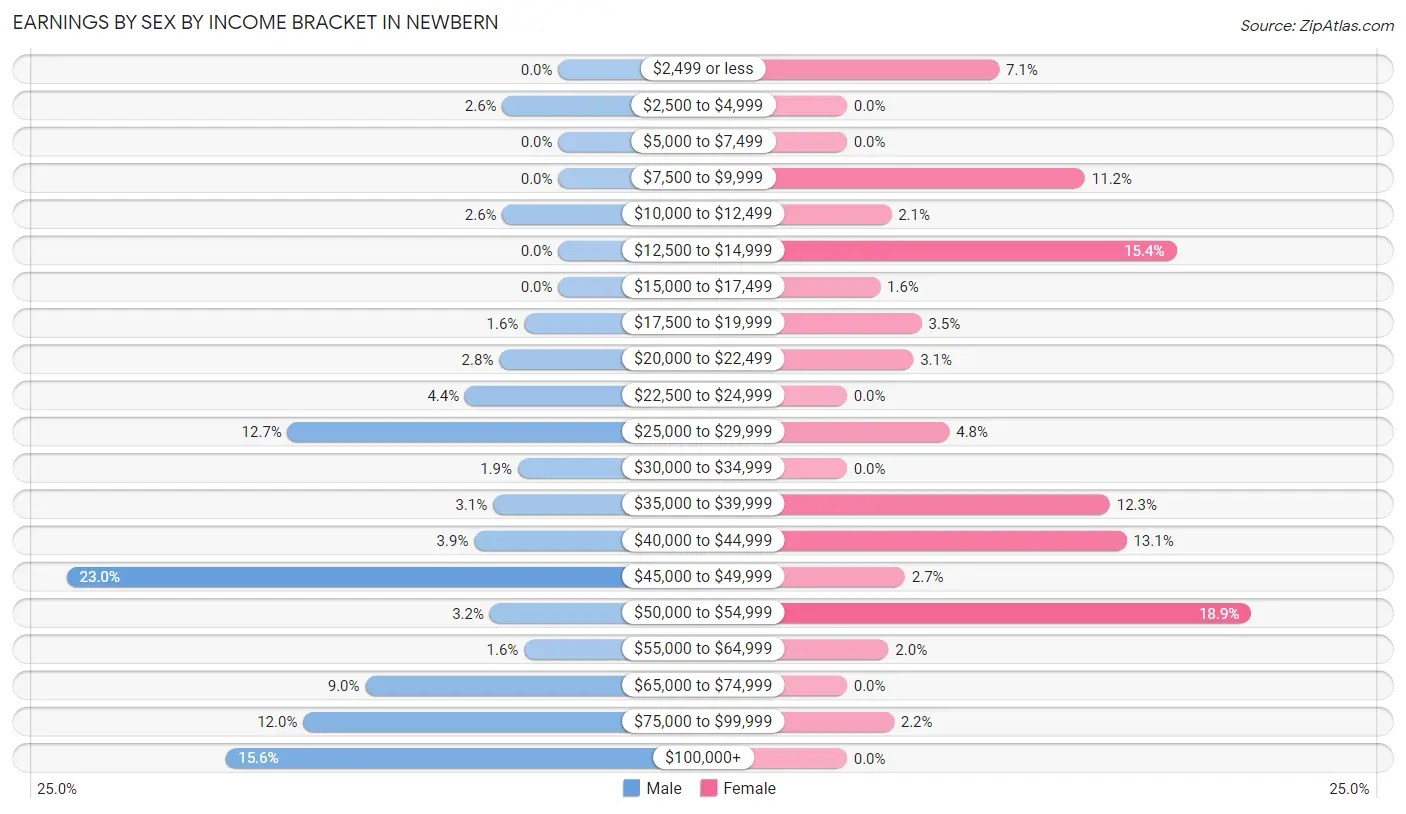
| Income | Male | Female |
| $2,499 or less | 0 (0.0%) | 55 (7.1%) |
| $2,500 to $4,999 | 18 (2.6%) | 0 (0.0%) |
| $5,000 to $7,499 | 0 (0.0%) | 0 (0.0%) |
| $7,500 to $9,999 | 0 (0.0%) | 86 (11.2%) |
| $10,000 to $12,499 | 18 (2.6%) | 16 (2.1%) |
| $12,500 to $14,999 | 0 (0.0%) | 119 (15.4%) |
| $15,000 to $17,499 | 0 (0.0%) | 12 (1.6%) |
| $17,500 to $19,999 | 11 (1.6%) | 27 (3.5%) |
| $20,000 to $22,499 | 19 (2.8%) | 24 (3.1%) |
| $22,500 to $24,999 | 30 (4.4%) | 0 (0.0%) |
| $25,000 to $29,999 | 87 (12.7%) | 37 (4.8%) |
| $30,000 to $34,999 | 13 (1.9%) | 0 (0.0%) |
| $35,000 to $39,999 | 21 (3.1%) | 95 (12.3%) |
| $40,000 to $44,999 | 27 (3.9%) | 101 (13.1%) |
| $45,000 to $49,999 | 158 (23.0%) | 21 (2.7%) |
| $50,000 to $54,999 | 22 (3.2%) | 146 (18.9%) |
| $55,000 to $64,999 | 11 (1.6%) | 15 (1.9%) |
| $65,000 to $74,999 | 62 (9.0%) | 0 (0.0%) |
| $75,000 to $99,999 | 82 (11.9%) | 17 (2.2%) |
| $100,000+ | 107 (15.6%) | 0 (0.0%) |
| Total | 686 (100.0%) | 771 (100.0%) |
Earnings by Sex by Educational Attainment in Newbern
Average earnings in Newbern are $48,525 for men and $36,503 for women, a difference of 24.8%. Men with an educational attainment of high school diploma enjoy the highest average annual earnings of $49,988, while those with high school diploma education earn the least with $49,988. Women with an educational attainment of high school diploma earn the most with the average annual earnings of $43,647, while those with college or associate's degree education have the smallest earnings of $35,034.
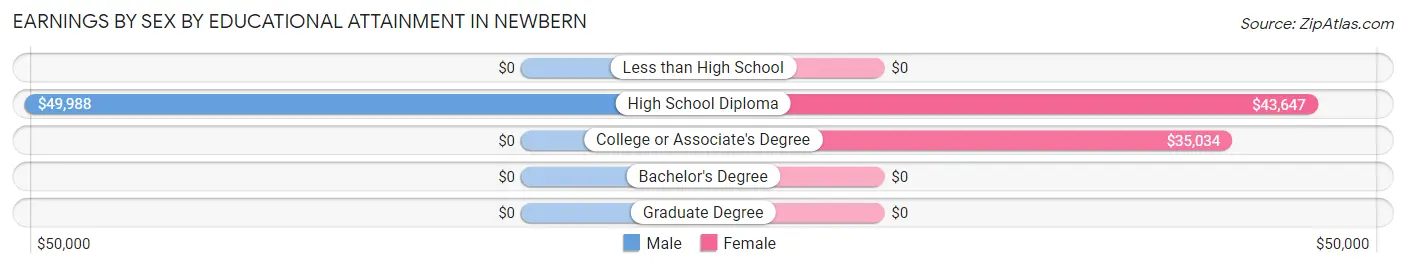
| Educational Attainment | Male Income | Female Income |
| Less than High School | - | - |
| High School Diploma | $49,988 | $43,647 |
| College or Associate's Degree | - | - |
| Bachelor's Degree | - | - |
| Graduate Degree | - | - |
| Total | $48,525 | $36,503 |
Family Income in Newbern
Family Income Brackets in Newbern
According to the Newbern family income data, there are 198 families falling into the $50,000 to $74,999 income range, which is the most common income bracket and makes up 24.4% of all families.
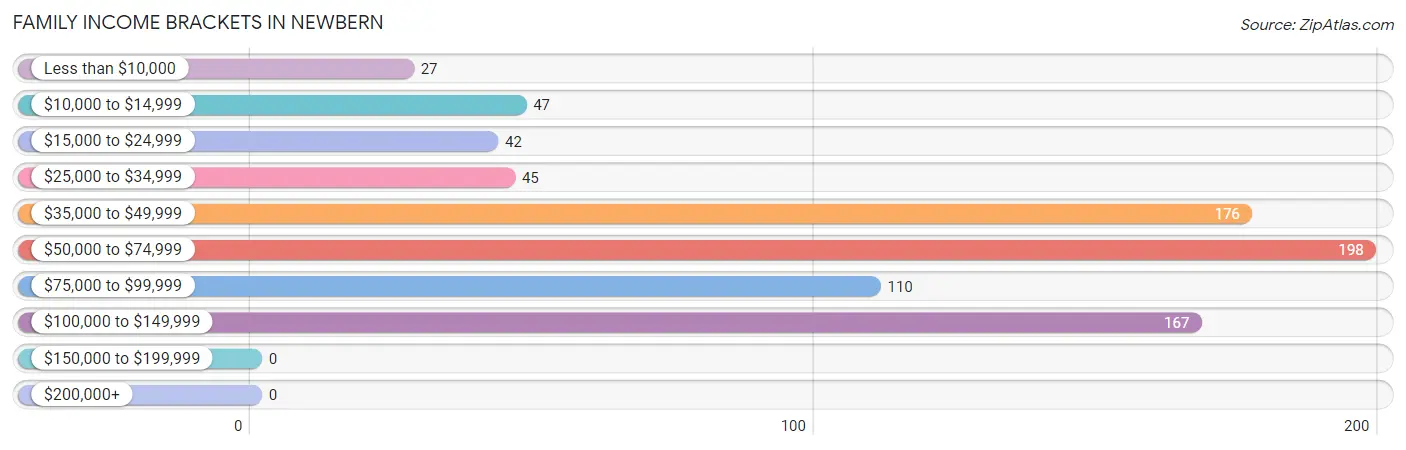
| Income Bracket | # Families | % Families |
| Less than $10,000 | 27 | 3.3% |
| $10,000 to $14,999 | 47 | 5.8% |
| $15,000 to $24,999 | 42 | 5.2% |
| $25,000 to $34,999 | 45 | 5.5% |
| $35,000 to $49,999 | 176 | 21.7% |
| $50,000 to $74,999 | 198 | 24.4% |
| $75,000 to $99,999 | 110 | 13.5% |
| $100,000 to $149,999 | 167 | 20.6% |
| $150,000 to $199,999 | 0 | 0.0% |
| $200,000+ | 0 | 0.0% |
Family Income by Famaliy Size in Newbern
2-person families (488 | 60.1%) account for the highest median family income in Newbern with $56,654 per family, while 2-person families (488 | 60.1%) have the highest median income of $28,327 per family member.
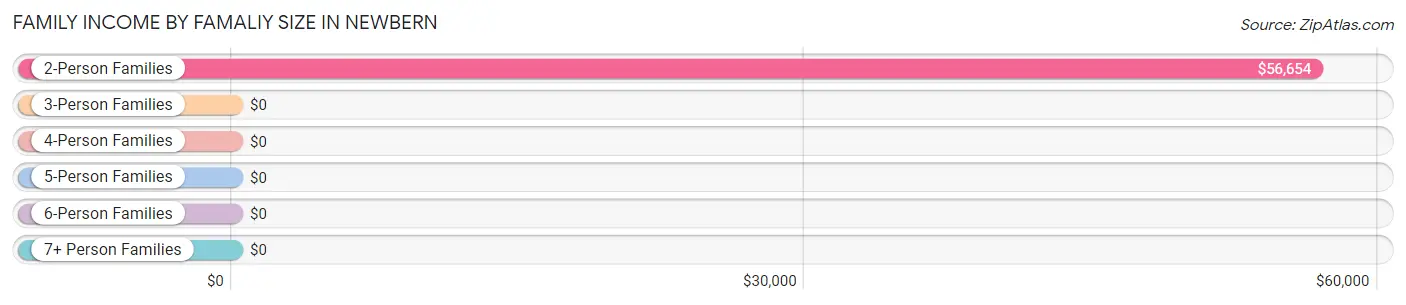
| Income Bracket | # Families | Median Income |
| 2-Person Families | 488 (60.1%) | $56,654 |
| 3-Person Families | 163 (20.1%) | $0 |
| 4-Person Families | 46 (5.7%) | $0 |
| 5-Person Families | 94 (11.6%) | $0 |
| 6-Person Families | 21 (2.6%) | $0 |
| 7+ Person Families | 0 (0.0%) | $0 |
| Total | 812 (100.0%) | $56,423 |
Family Income by Number of Earners in Newbern
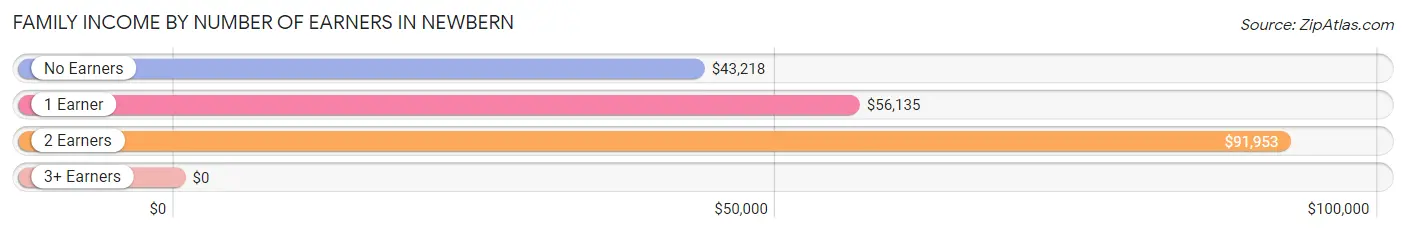
| Number of Earners | # Families | Median Income |
| No Earners | 178 (21.9%) | $43,218 |
| 1 Earner | 403 (49.6%) | $56,135 |
| 2 Earners | 207 (25.5%) | $91,953 |
| 3+ Earners | 24 (3.0%) | $0 |
| Total | 812 (100.0%) | $56,423 |
Household Income in Newbern
Household Income Brackets in Newbern
With 403 households falling in the category, the $35,000 to $49,999 income range is the most frequent in Newbern, accounting for 26.6% of all households.
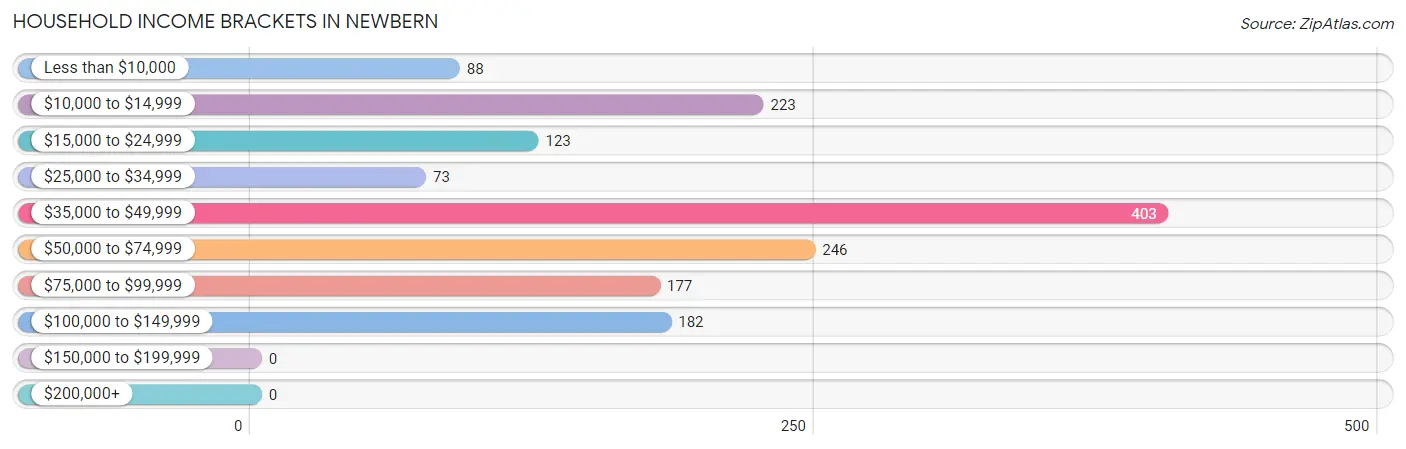
| Income Bracket | # Households | % Households |
| Less than $10,000 | 88 | 5.8% |
| $10,000 to $14,999 | 223 | 14.7% |
| $15,000 to $24,999 | 123 | 8.1% |
| $25,000 to $34,999 | 73 | 4.8% |
| $35,000 to $49,999 | 403 | 26.6% |
| $50,000 to $74,999 | 246 | 16.2% |
| $75,000 to $99,999 | 177 | 11.7% |
| $100,000 to $149,999 | 182 | 12.0% |
| $150,000 to $199,999 | 0 | 0.0% |
| $200,000+ | 0 | 0.0% |
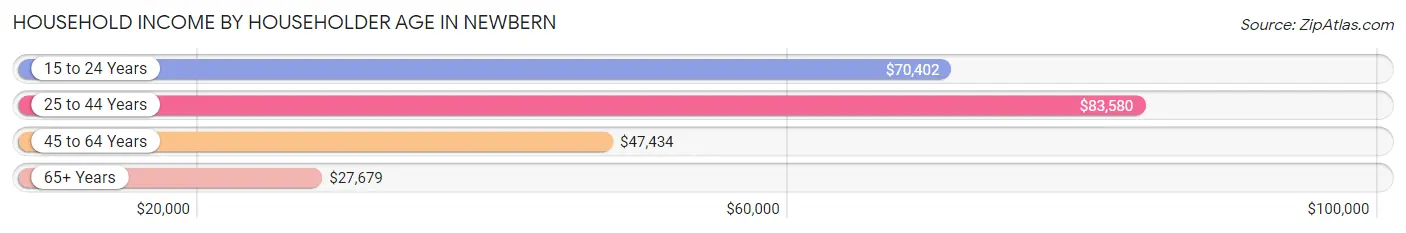
Household Income by Householder Age in Newbern
The median household income in Newbern is $44,526, with the highest median household income of $83,580 found in the 25 to 44 years age bracket for the primary householder. A total of 499 households (32.9%) fall into this category. Meanwhile, the 65+ years age bracket for the primary householder has the lowest median household income of $27,679, with 502 households (33.1%) in this group.
| Income Bracket | # Households | Median Income |
| 15 to 24 Years | 114 (7.5%) | $70,402 |
| 25 to 44 Years | 499 (32.9%) | $83,580 |
| 45 to 64 Years | 401 (26.5%) | $47,434 |
| 65+ Years | 502 (33.1%) | $27,679 |
| Total | 1,516 (100.0%) | $44,526 |
Poverty in Newbern
Income Below Poverty by Sex and Age in Newbern
With 20.9% poverty level for males and 14.3% for females among the residents of Newbern, 75 year old and over males and 55 to 64 year old females are the most vulnerable to poverty, with 159 males (88.3%) and 57 females (50.9%) in their respective age groups living below the poverty level.
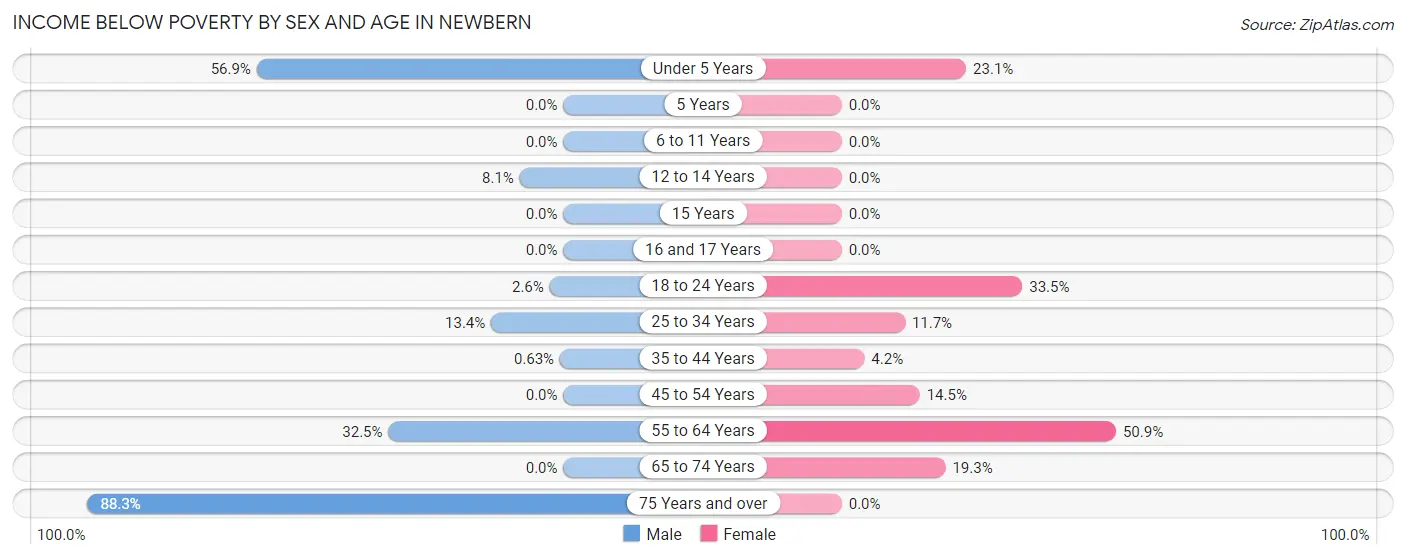
| Age Bracket | Male | Female |
| Under 5 Years | 74 (56.9%) | 24 (23.1%) |
| 5 Years | 0 (0.0%) | 0 (0.0%) |
| 6 to 11 Years | 0 (0.0%) | 0 (0.0%) |
| 12 to 14 Years | 12 (8.1%) | 0 (0.0%) |
| 15 Years | 0 (0.0%) | 0 (0.0%) |
| 16 and 17 Years | 0 (0.0%) | 0 (0.0%) |
| 18 to 24 Years | 4 (2.5%) | 63 (33.5%) |
| 25 to 34 Years | 37 (13.4%) | 43 (11.7%) |
| 35 to 44 Years | 1 (0.6%) | 12 (4.2%) |
| 45 to 54 Years | 0 (0.0%) | 23 (14.5%) |
| 55 to 64 Years | 38 (32.5%) | 57 (50.9%) |
| 65 to 74 Years | 0 (0.0%) | 31 (19.3%) |
| 75 Years and over | 159 (88.3%) | 0 (0.0%) |
| Total | 325 (20.9%) | 253 (14.3%) |
Income Above Poverty by Sex and Age in Newbern
According to the poverty statistics in Newbern, males aged 6 to 11 years and females aged 6 to 11 years are the age groups that are most secure financially, with 100.0% of males and 100.0% of females in these age groups living above the poverty line.
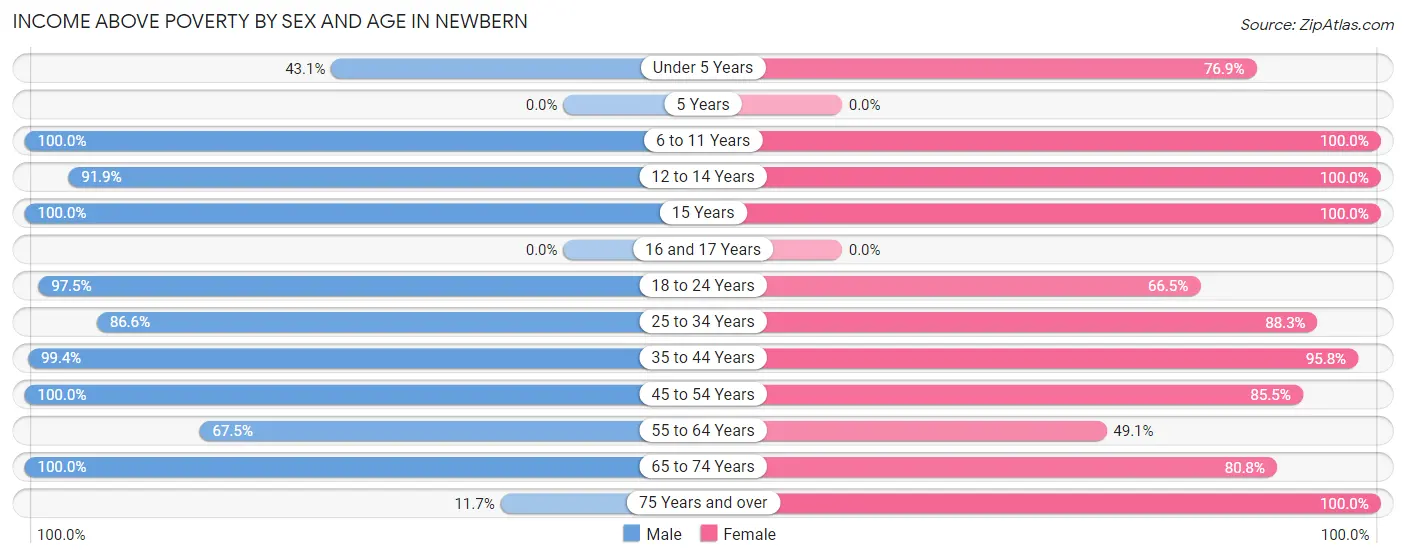
| Age Bracket | Male | Female |
| Under 5 Years | 56 (43.1%) | 80 (76.9%) |
| 5 Years | 0 (0.0%) | 0 (0.0%) |
| 6 to 11 Years | 49 (100.0%) | 94 (100.0%) |
| 12 to 14 Years | 136 (91.9%) | 122 (100.0%) |
| 15 Years | 108 (100.0%) | 23 (100.0%) |
| 16 and 17 Years | 0 (0.0%) | 0 (0.0%) |
| 18 to 24 Years | 153 (97.5%) | 125 (66.5%) |
| 25 to 34 Years | 239 (86.6%) | 324 (88.3%) |
| 35 to 44 Years | 158 (99.4%) | 274 (95.8%) |
| 45 to 54 Years | 139 (100.0%) | 136 (85.5%) |
| 55 to 64 Years | 79 (67.5%) | 55 (49.1%) |
| 65 to 74 Years | 91 (100.0%) | 130 (80.7%) |
| 75 Years and over | 21 (11.7%) | 151 (100.0%) |
| Total | 1,229 (79.1%) | 1,514 (85.7%) |
Income Below Poverty Among Married-Couple Families in Newbern
The poverty statistics for married-couple families in Newbern show that 8.0% or 42 of the total 524 families live below the poverty line. Families with 1 or 2 children have the highest poverty rate of 10.9%, comprising of 19 families. On the other hand, families with 3 or 4 children have the lowest poverty rate of 0.0%, which includes 0 families.
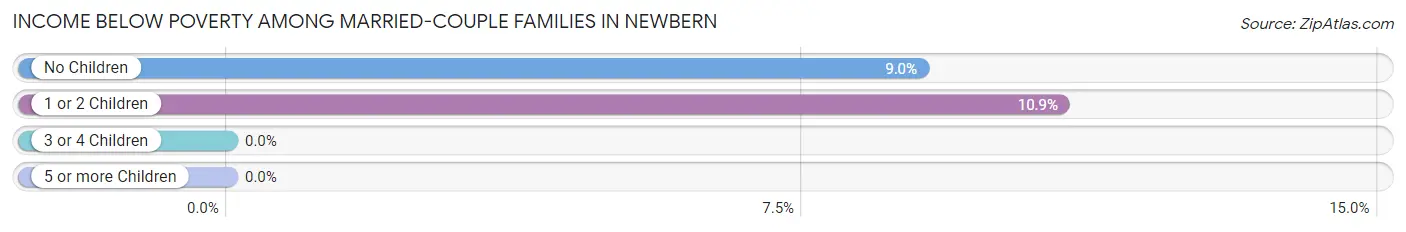
| Children | Above Poverty | Below Poverty |
| No Children | 232 (91.0%) | 23 (9.0%) |
| 1 or 2 Children | 156 (89.1%) | 19 (10.9%) |
| 3 or 4 Children | 94 (100.0%) | 0 (0.0%) |
| 5 or more Children | 0 (0.0%) | 0 (0.0%) |
| Total | 482 (92.0%) | 42 (8.0%) |
Income Below Poverty Among Single-Parent Households in Newbern
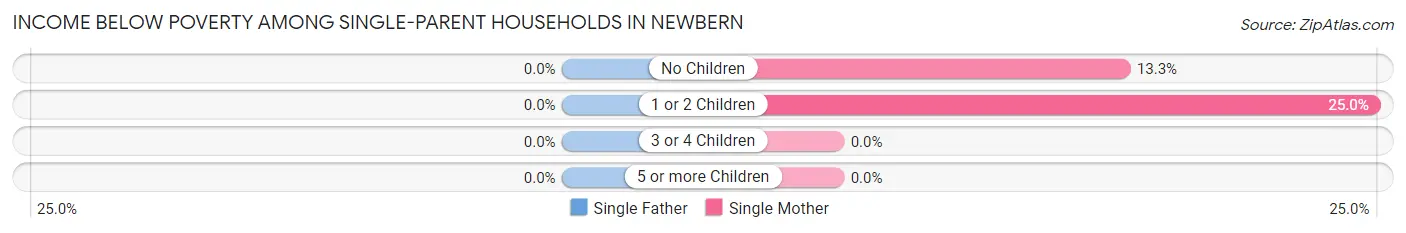
| Children | Single Father | Single Mother |
| No Children | 0 (0.0%) | 10 (13.3%) |
| 1 or 2 Children | 0 (0.0%) | 41 (25.0%) |
| 3 or 4 Children | 0 (0.0%) | 0 (0.0%) |
| 5 or more Children | 0 (0.0%) | 0 (0.0%) |
| Total | 0 (0.0%) | 51 (21.3%) |
Income Below Poverty Among Married-Couple vs Single-Parent Households in Newbern
The poverty data for Newbern shows that 42 of the married-couple family households (8.0%) and 51 of the single-parent households (17.7%) are living below the poverty level. Within the married-couple family households, those with 1 or 2 children have the highest poverty rate, with 19 households (10.9%) falling below the poverty line. Among the single-parent households, those with 1 or 2 children have the highest poverty rate, with 41 household (22.4%) living below poverty.
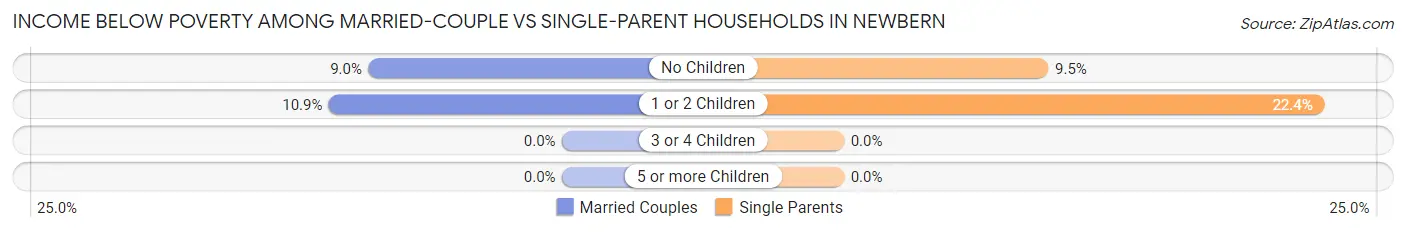
| Children | Married-Couple Families | Single-Parent Households |
| No Children | 23 (9.0%) | 10 (9.5%) |
| 1 or 2 Children | 19 (10.9%) | 41 (22.4%) |
| 3 or 4 Children | 0 (0.0%) | 0 (0.0%) |
| 5 or more Children | 0 (0.0%) | 0 (0.0%) |
| Total | 42 (8.0%) | 51 (17.7%) |
Race in Newbern
The most populous races in Newbern are White / Caucasian (2,511 | 75.6%), Black / African American (466 | 14.0%), and Two or more Races (265 | 8.0%).
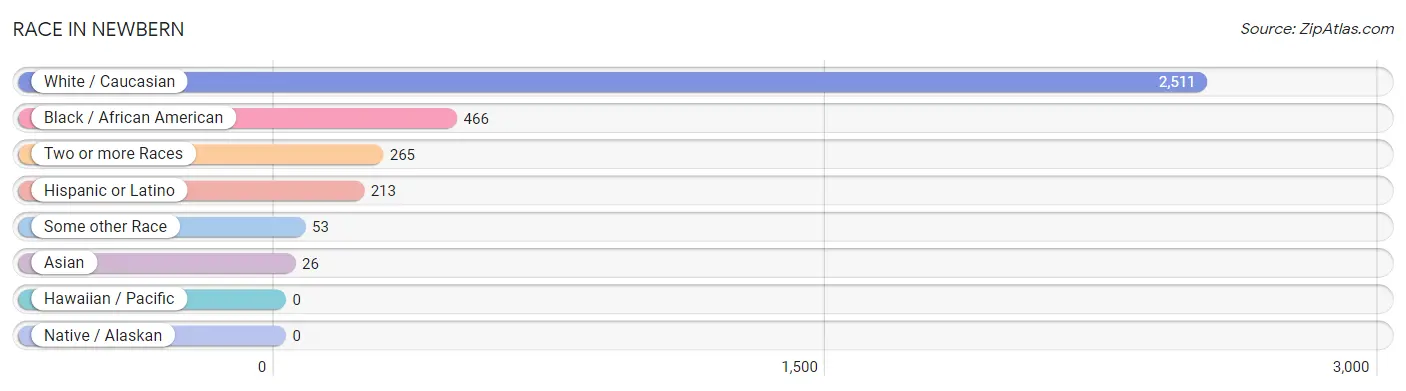
| Race | # Population | % Population |
| Asian | 26 | 0.8% |
| Black / African American | 466 | 14.0% |
| Hawaiian / Pacific | 0 | 0.0% |
| Hispanic or Latino | 213 | 6.4% |
| Native / Alaskan | 0 | 0.0% |
| White / Caucasian | 2,511 | 75.6% |
| Two or more Races | 265 | 8.0% |
| Some other Race | 53 | 1.6% |
| Total | 3,321 | 100.0% |
Ancestry in Newbern
The most populous ancestries reported in Newbern are Irish (309 | 9.3%), German (290 | 8.7%), American (285 | 8.6%), Mexican (189 | 5.7%), and English (183 | 5.5%), together accounting for 37.8% of all Newbern residents.
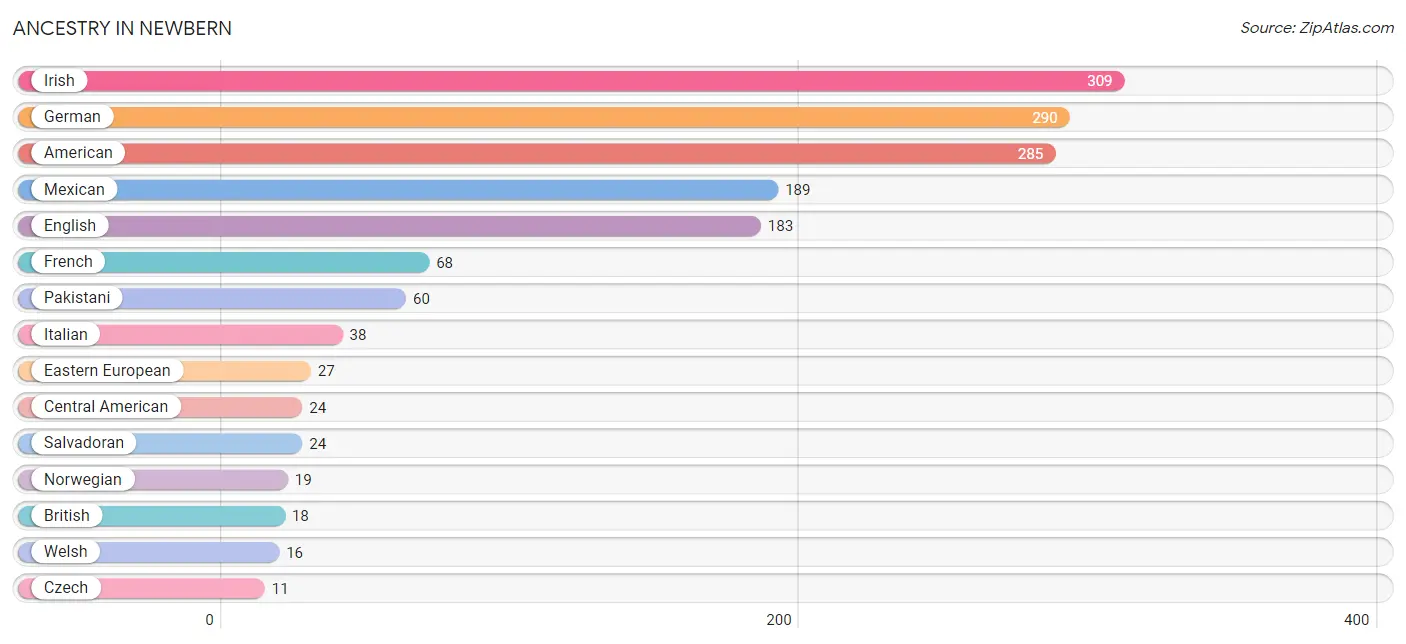
| Ancestry | # Population | % Population |
| American | 285 | 8.6% |
| British | 18 | 0.5% |
| Central American | 24 | 0.7% |
| Czech | 11 | 0.3% |
| Dutch | 11 | 0.3% |
| Eastern European | 27 | 0.8% |
| English | 183 | 5.5% |
| French | 68 | 2.1% |
| German | 290 | 8.7% |
| Irish | 309 | 9.3% |
| Italian | 38 | 1.1% |
| Mexican | 189 | 5.7% |
| Norwegian | 19 | 0.6% |
| Pakistani | 60 | 1.8% |
| Polish | 11 | 0.3% |
| Salvadoran | 24 | 0.7% |
| Scotch-Irish | 10 | 0.3% |
| Welsh | 16 | 0.5% | View All 18 Rows |
Immigrants in Newbern
The most numerous immigrant groups reported in Newbern came from Central America (53 | 1.6%), Latin America (53 | 1.6%), Mexico (53 | 1.6%), Asia (26 | 0.8%), and South Eastern Asia (26 | 0.8%), together accounting for 6.4% of all Newbern residents.
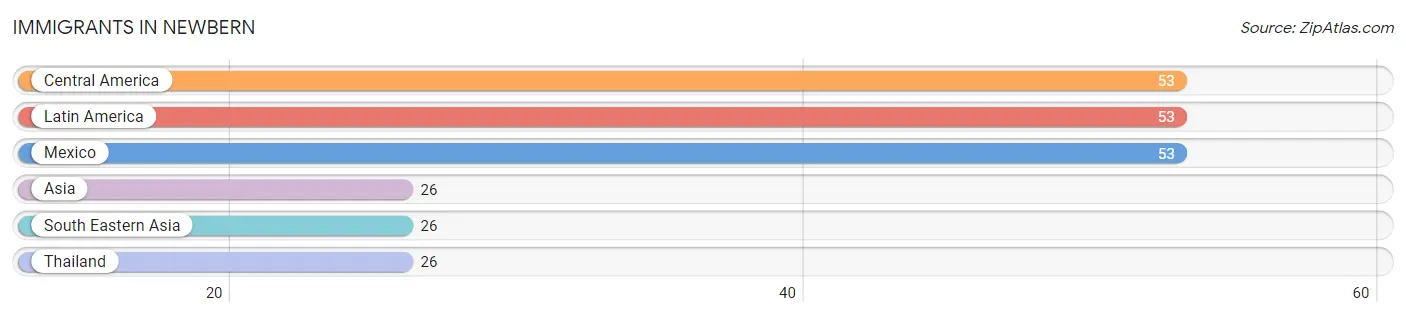
| Immigration Origin | # Population | % Population |
| Asia | 26 | 0.8% |
| Central America | 53 | 1.6% |
| Latin America | 53 | 1.6% |
| Mexico | 53 | 1.6% |
| South Eastern Asia | 26 | 0.8% |
| Thailand | 26 | 0.8% | View All 6 Rows |
Sex and Age in Newbern
Sex and Age in Newbern
The most populous age groups in Newbern are 30 to 34 Years (223 | 14.3%) for men and 10 to 14 Years (216 | 12.2%) for women.
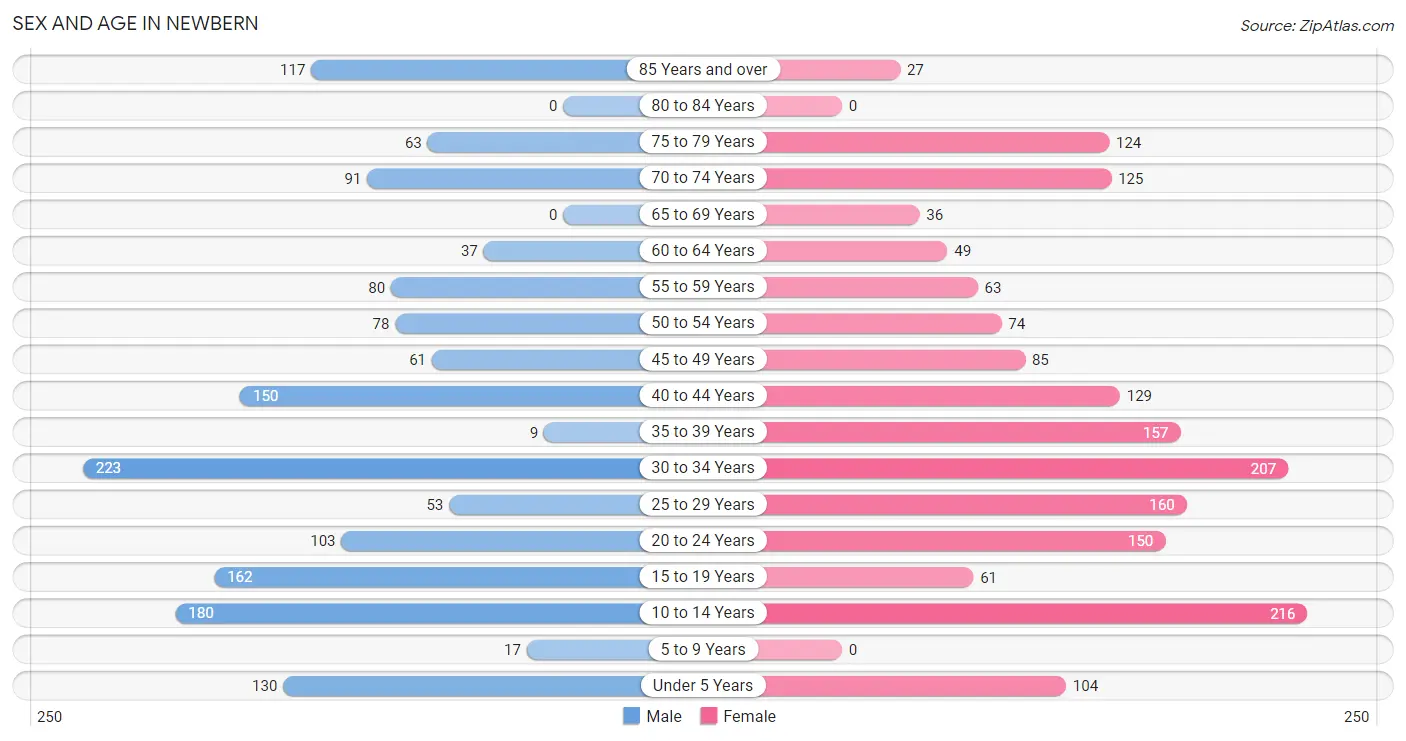
| Age Bracket | Male | Female |
| Under 5 Years | 130 (8.4%) | 104 (5.9%) |
| 5 to 9 Years | 17 (1.1%) | 0 (0.0%) |
| 10 to 14 Years | 180 (11.6%) | 216 (12.2%) |
| 15 to 19 Years | 162 (10.4%) | 61 (3.5%) |
| 20 to 24 Years | 103 (6.6%) | 150 (8.5%) |
| 25 to 29 Years | 53 (3.4%) | 160 (9.0%) |
| 30 to 34 Years | 223 (14.3%) | 207 (11.7%) |
| 35 to 39 Years | 9 (0.6%) | 157 (8.9%) |
| 40 to 44 Years | 150 (9.7%) | 129 (7.3%) |
| 45 to 49 Years | 61 (3.9%) | 85 (4.8%) |
| 50 to 54 Years | 78 (5.0%) | 74 (4.2%) |
| 55 to 59 Years | 80 (5.1%) | 63 (3.6%) |
| 60 to 64 Years | 37 (2.4%) | 49 (2.8%) |
| 65 to 69 Years | 0 (0.0%) | 36 (2.0%) |
| 70 to 74 Years | 91 (5.9%) | 125 (7.1%) |
| 75 to 79 Years | 63 (4.1%) | 124 (7.0%) |
| 80 to 84 Years | 0 (0.0%) | 0 (0.0%) |
| 85 Years and over | 117 (7.5%) | 27 (1.5%) |
| Total | 1,554 (100.0%) | 1,767 (100.0%) |
Families and Households in Newbern
Median Family Size in Newbern
The median family size in Newbern is 3.07 persons per family, with married-couple families (524 | 64.5%) accounting for the largest median family size of 3.19 persons per family. On the other hand, single female/mother families (239 | 29.4%) represent the smallest median family size with 2.81 persons per family.
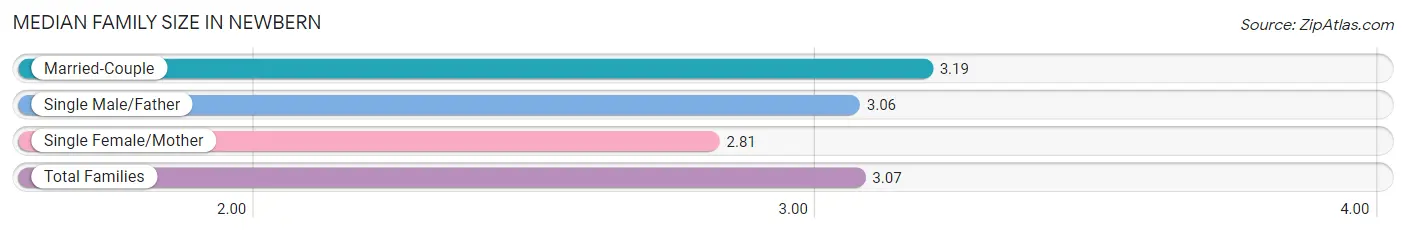
| Family Type | # Families | Family Size |
| Married-Couple | 524 (64.5%) | 3.19 |
| Single Male/Father | 49 (6.0%) | 3.06 |
| Single Female/Mother | 239 (29.4%) | 2.81 |
| Total Families | 812 (100.0%) | 3.07 |
Median Household Size in Newbern
The median household size in Newbern is 2.18 persons per household, with married-couple households (524 | 34.6%) accounting for the largest median household size of 3.19 persons per household. non-family households (704 | 46.4%) represent the smallest median household size with 1.10 persons per household.
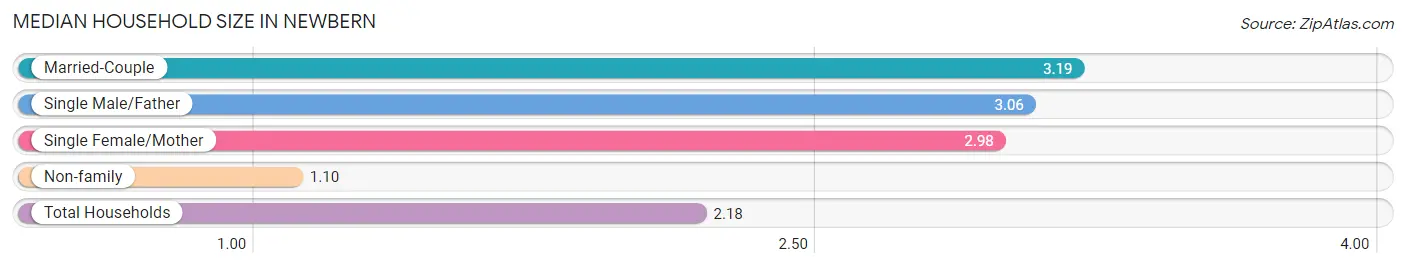
| Household Type | # Households | Household Size |
| Married-Couple | 524 (34.6%) | 3.19 |
| Single Male/Father | 49 (3.2%) | 3.06 |
| Single Female/Mother | 239 (15.8%) | 2.98 |
| Non-family | 704 (46.4%) | 1.10 |
| Total Households | 1,516 (100.0%) | 2.18 |
Household Size by Marriage Status in Newbern
Out of a total of 1,516 households in Newbern, 812 (53.6%) are family households, while 704 (46.4%) are nonfamily households. The most numerous type of family households are 2-person households, comprising 433, and the most common type of nonfamily households are 1-person households, comprising 590.
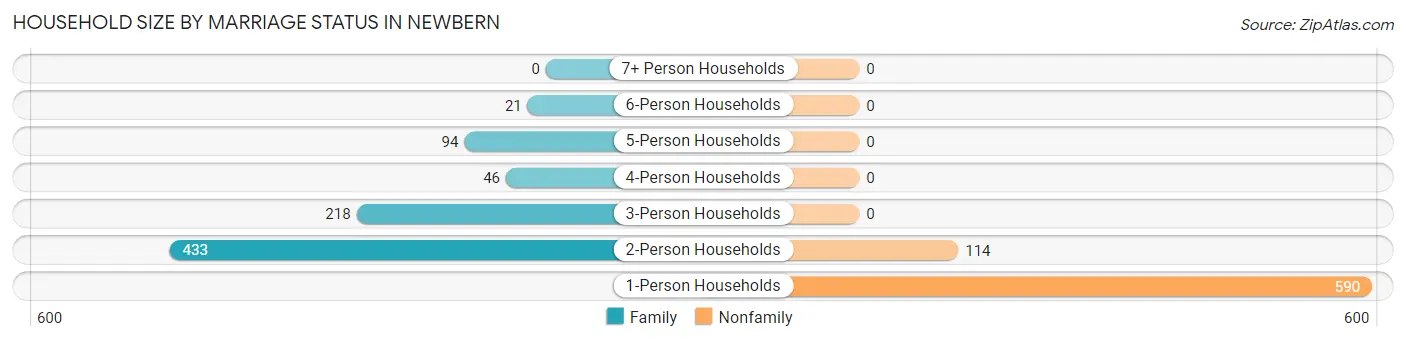
| Household Size | Family Households | Nonfamily Households |
| 1-Person Households | - | 590 (38.9%) |
| 2-Person Households | 433 (28.6%) | 114 (7.5%) |
| 3-Person Households | 218 (14.4%) | 0 (0.0%) |
| 4-Person Households | 46 (3.0%) | 0 (0.0%) |
| 5-Person Households | 94 (6.2%) | 0 (0.0%) |
| 6-Person Households | 21 (1.4%) | 0 (0.0%) |
| 7+ Person Households | 0 (0.0%) | 0 (0.0%) |
| Total | 812 (53.6%) | 704 (46.4%) |
Female Fertility in Newbern
Fertility by Age in Newbern
Average fertility rate in Newbern is 43.0 births per 1,000 women. Women in the age bracket of 20 to 34 years have the highest fertility rate with 83.0 births per 1,000 women. Women in the age bracket of 20 to 34 years acount for 100.0% of all women with births.
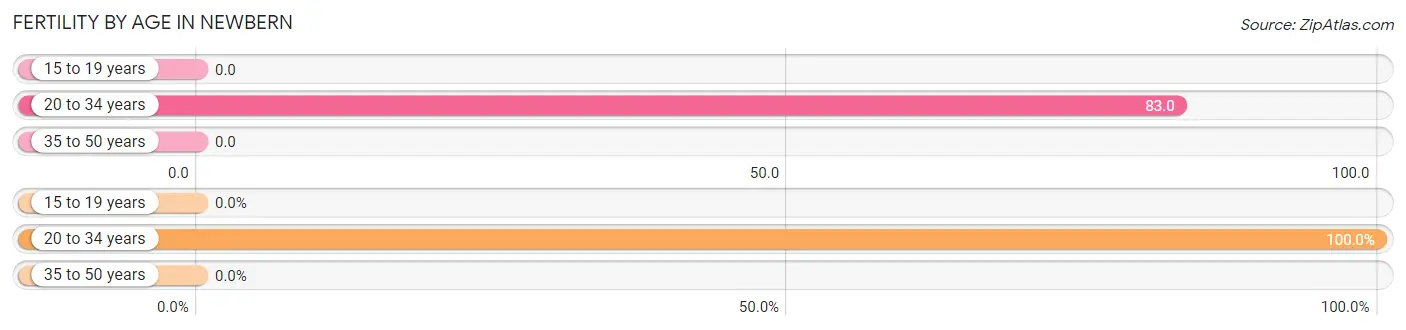
| Age Bracket | Women with Births | Births / 1,000 Women |
| 15 to 19 years | 0 (0.0%) | 0.0 |
| 20 to 34 years | 43 (100.0%) | 83.0 |
| 35 to 50 years | 0 (0.0%) | 0.0 |
| Total | 43 (100.0%) | 43.0 |
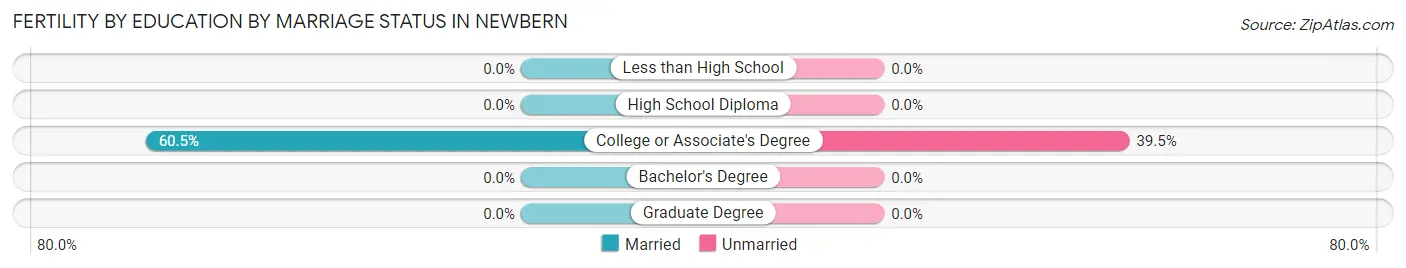
Fertility by Age by Marriage Status in Newbern
60.5% of women with births (43) in Newbern are married. The highest percentage of unmarried women with births falls into 20 to 34 years age bracket with 39.5% of them unmarried at the time of birth, while the lowest percentage of unmarried women with births belong to 20 to 34 years age bracket with 39.5% of them unmarried.
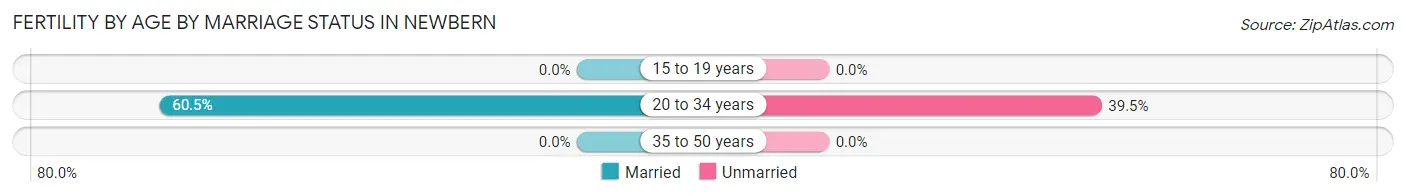
| Age Bracket | Married | Unmarried |
| 15 to 19 years | 0 (0.0%) | 0 (0.0%) |
| 20 to 34 years | 26 (60.5%) | 17 (39.5%) |
| 35 to 50 years | 0 (0.0%) | 0 (0.0%) |
| Total | 26 (60.5%) | 17 (39.5%) |
Fertility by Education in Newbern
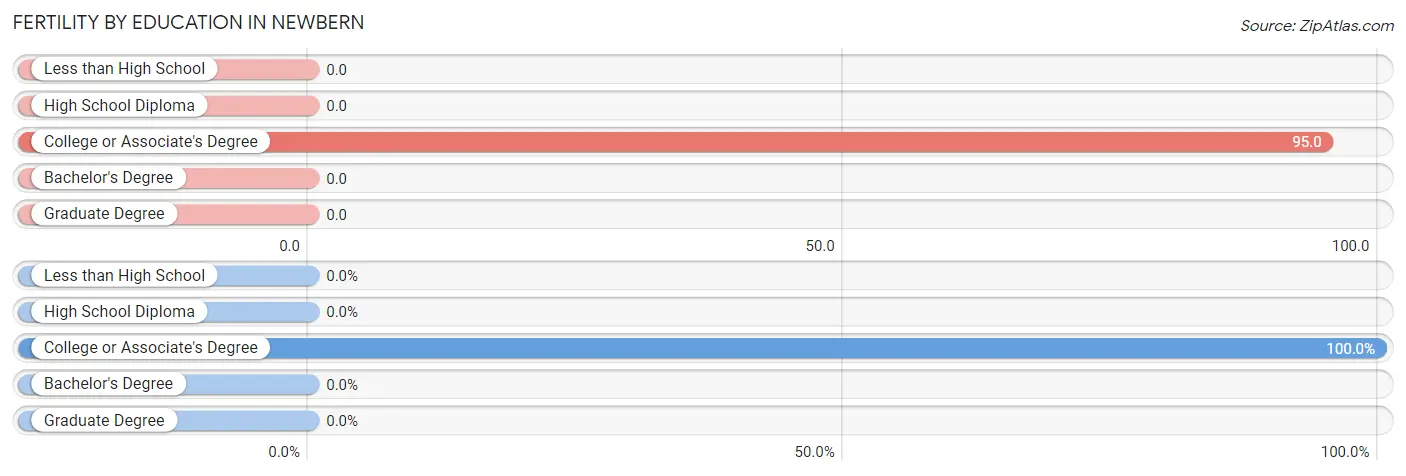
| Educational Attainment | Women with Births | Births / 1,000 Women |
| Less than High School | 0 (0.0%) | 0.0 |
| High School Diploma | 0 (0.0%) | 0.0 |
| College or Associate's Degree | 43 (100.0%) | 95.0 |
| Bachelor's Degree | 0 (0.0%) | 0.0 |
| Graduate Degree | 0 (0.0%) | 0.0 |
| Total | 43 (100.0%) | 43.0 |
Fertility by Education by Marriage Status in Newbern
39.5% of women with births in Newbern are unmarried. Women with the educational attainment of college or associate's degree are most likely to be married with 60.5% of them married at childbirth, while women with the educational attainment of college or associate's degree are least likely to be married with 39.5% of them unmarried at childbirth.
| Educational Attainment | Married | Unmarried |
| Less than High School | 0 (0.0%) | 0 (0.0%) |
| High School Diploma | 0 (0.0%) | 0 (0.0%) |
| College or Associate's Degree | 26 (60.5%) | 17 (39.5%) |
| Bachelor's Degree | 0 (0.0%) | 0 (0.0%) |
| Graduate Degree | 0 (0.0%) | 0 (0.0%) |
| Total | 26 (60.5%) | 17 (39.5%) |
Employment Characteristics in Newbern
Employment by Class of Employer in Newbern
Among the 1,344 employed individuals in Newbern, private company employees (1,151 | 85.6%), self-employed (incorporated) (59 | 4.4%), and state government employees (55 | 4.1%) make up the most common classes of employment.
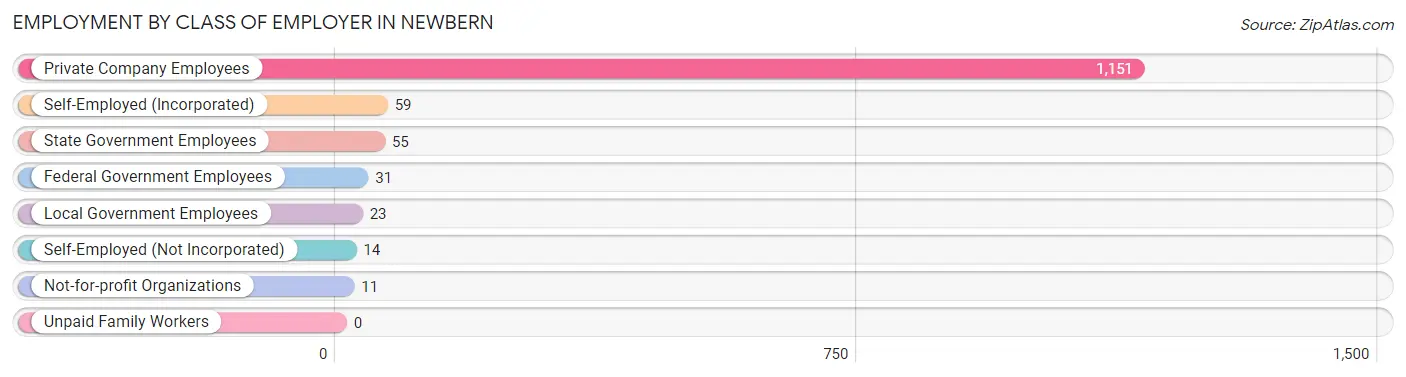
| Employer Class | # Employees | % Employees |
| Private Company Employees | 1,151 | 85.6% |
| Self-Employed (Incorporated) | 59 | 4.4% |
| Self-Employed (Not Incorporated) | 14 | 1.0% |
| Not-for-profit Organizations | 11 | 0.8% |
| Local Government Employees | 23 | 1.7% |
| State Government Employees | 55 | 4.1% |
| Federal Government Employees | 31 | 2.3% |
| Unpaid Family Workers | 0 | 0.0% |
| Total | 1,344 | 100.0% |
Employment Status by Age in Newbern
According to the labor force statistics for Newbern, out of the total population over 16 years of age (2,543), 55.0% or 1,399 individuals are in the labor force, with 2.7% or 38 of them unemployed. The age group with the highest labor force participation rate is 45 to 54 years, with 84.2% or 251 individuals in the labor force. Within the labor force, the 45 to 54 years age range has the highest percentage of unemployed individuals, with 14.7% or 37 of them being unemployed.
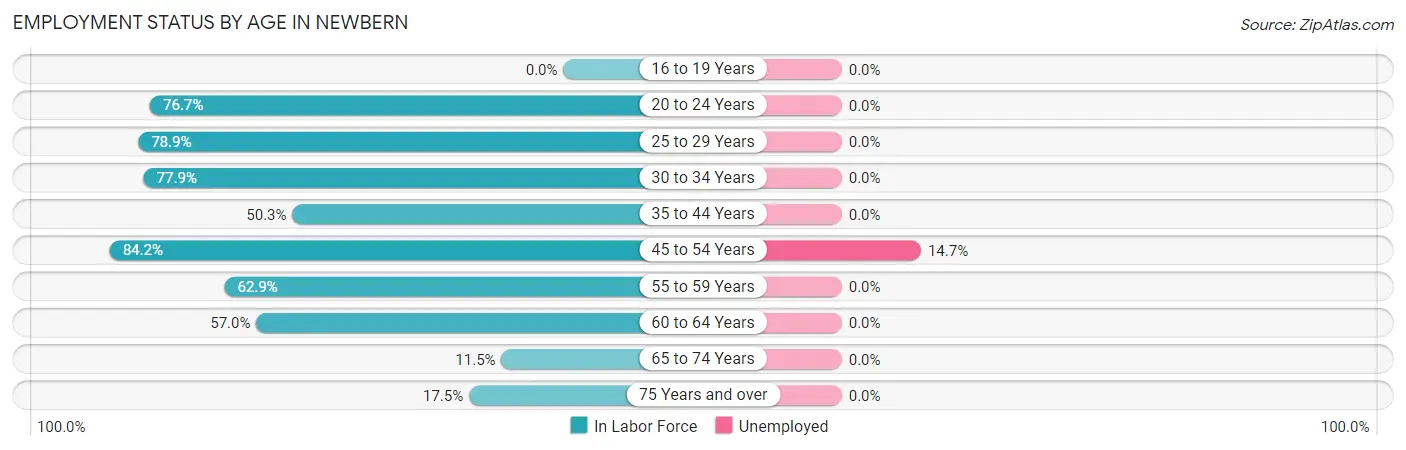
| Age Bracket | In Labor Force | Unemployed |
| 16 to 19 Years | 0 (0.0%) | 0 (0.0%) |
| 20 to 24 Years | 194 (76.7%) | 0 (0.0%) |
| 25 to 29 Years | 168 (78.9%) | 0 (0.0%) |
| 30 to 34 Years | 335 (77.9%) | 0 (0.0%) |
| 35 to 44 Years | 224 (50.3%) | 0 (0.0%) |
| 45 to 54 Years | 251 (84.2%) | 37 (14.7%) |
| 55 to 59 Years | 90 (62.9%) | 0 (0.0%) |
| 60 to 64 Years | 49 (57.0%) | 0 (0.0%) |
| 65 to 74 Years | 29 (11.5%) | 0 (0.0%) |
| 75 Years and over | 58 (17.5%) | 0 (0.0%) |
| Total | 1,399 (55.0%) | 38 (2.7%) |
Employment Status by Educational Attainment in Newbern
According to labor force statistics for Newbern, 69.2% of individuals (1,118) out of the total population between 25 and 64 years of age (1,615) are in the labor force, with 3.4% or 38 of them being unemployed. The group with the highest labor force participation rate are those with the educational attainment of bachelor's degree or higher, with 94.5% or 359 individuals in the labor force. Within the labor force, individuals with less than high school education have the highest percentage of unemployment, with 60.0% or 21 of them being unemployed.
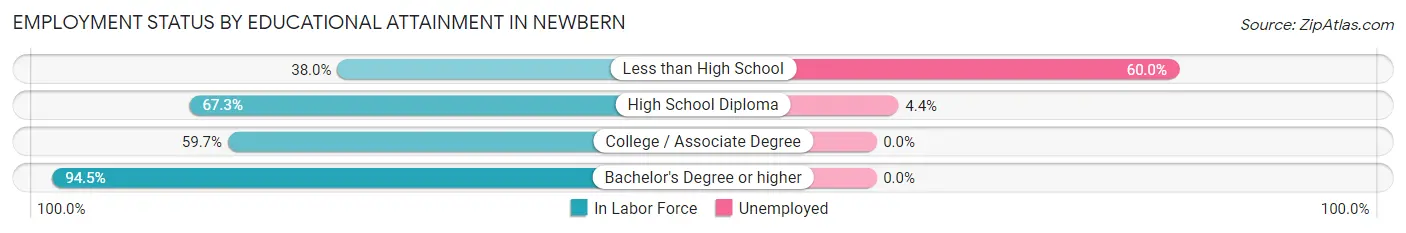
| Educational Attainment | In Labor Force | Unemployed |
| Less than High School | 35 (38.0%) | 55 (60.0%) |
| High School Diploma | 360 (67.3%) | 24 (4.4%) |
| College / Associate Degree | 363 (59.7%) | 0 (0.0%) |
| Bachelor's Degree or higher | 359 (94.5%) | 0 (0.0%) |
| Total | 1,118 (69.2%) | 55 (3.4%) |
Employment Occupations by Sex in Newbern
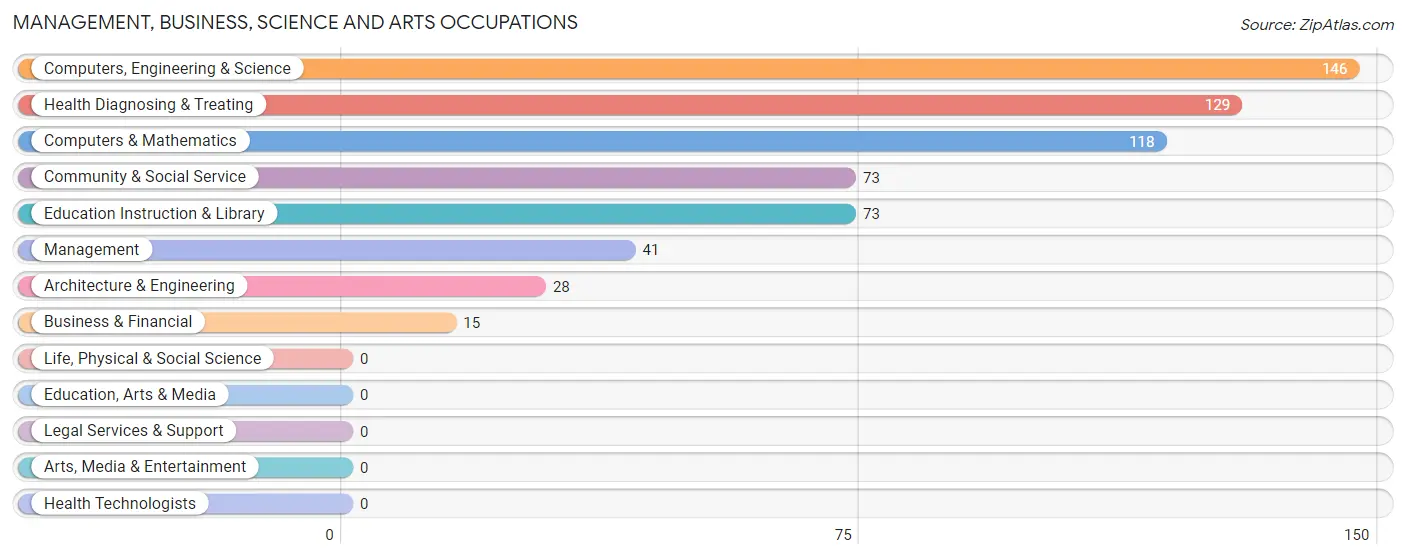
Management, Business, Science and Arts Occupations
The most common Management, Business, Science and Arts occupations in Newbern are Computers, Engineering & Science (146 | 10.9%), Health Diagnosing & Treating (129 | 9.6%), Computers & Mathematics (118 | 8.8%), Community & Social Service (73 | 5.4%), and Education Instruction & Library (73 | 5.4%).
Management, Business, Science and Arts Occupations by Sex
Within the Management, Business, Science and Arts occupations in Newbern, the most male-oriented occupations are Business & Financial (100.0%), Architecture & Engineering (100.0%), and Management (75.6%), while the most female-oriented occupations are Computers & Mathematics (100.0%), Health Diagnosing & Treating (100.0%), and Computers, Engineering & Science (80.8%).
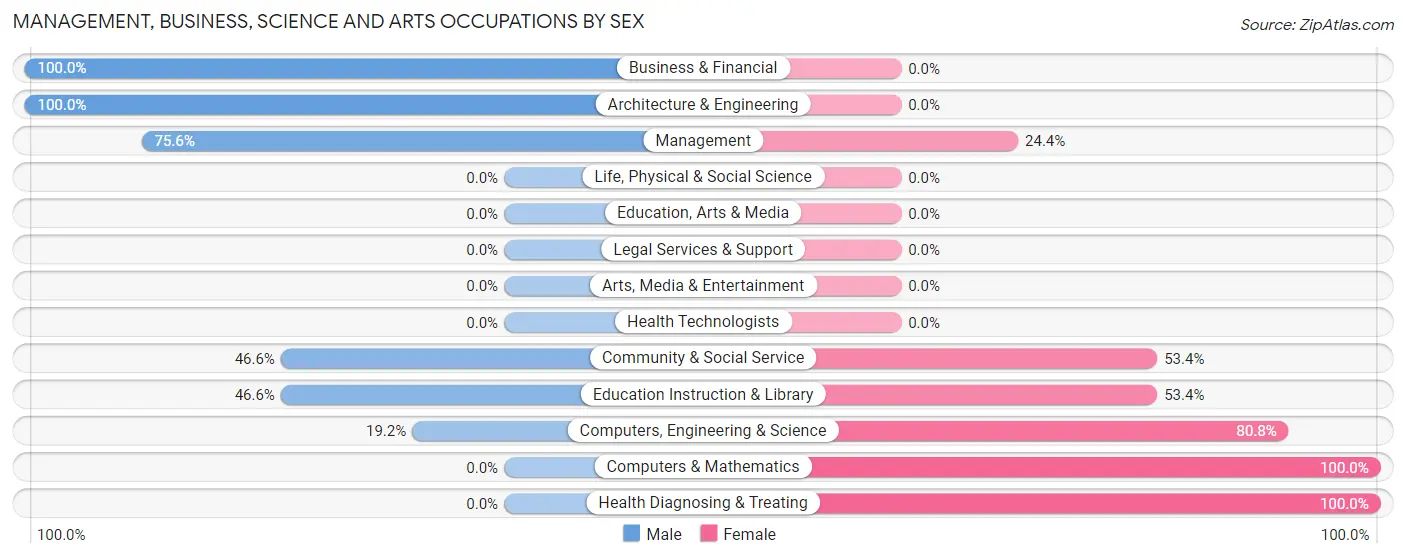
| Occupation | Male | Female |
| Management | 31 (75.6%) | 10 (24.4%) |
| Business & Financial | 15 (100.0%) | 0 (0.0%) |
| Computers, Engineering & Science | 28 (19.2%) | 118 (80.8%) |
| Computers & Mathematics | 0 (0.0%) | 118 (100.0%) |
| Architecture & Engineering | 28 (100.0%) | 0 (0.0%) |
| Life, Physical & Social Science | 0 (0.0%) | 0 (0.0%) |
| Community & Social Service | 34 (46.6%) | 39 (53.4%) |
| Education, Arts & Media | 0 (0.0%) | 0 (0.0%) |
| Legal Services & Support | 0 (0.0%) | 0 (0.0%) |
| Education Instruction & Library | 34 (46.6%) | 39 (53.4%) |
| Arts, Media & Entertainment | 0 (0.0%) | 0 (0.0%) |
| Health Diagnosing & Treating | 0 (0.0%) | 129 (100.0%) |
| Health Technologists | 0 (0.0%) | 0 (0.0%) |
| Total (Category) | 108 (26.7%) | 296 (73.3%) |
| Total (Overall) | 644 (48.1%) | 696 (51.9%) |
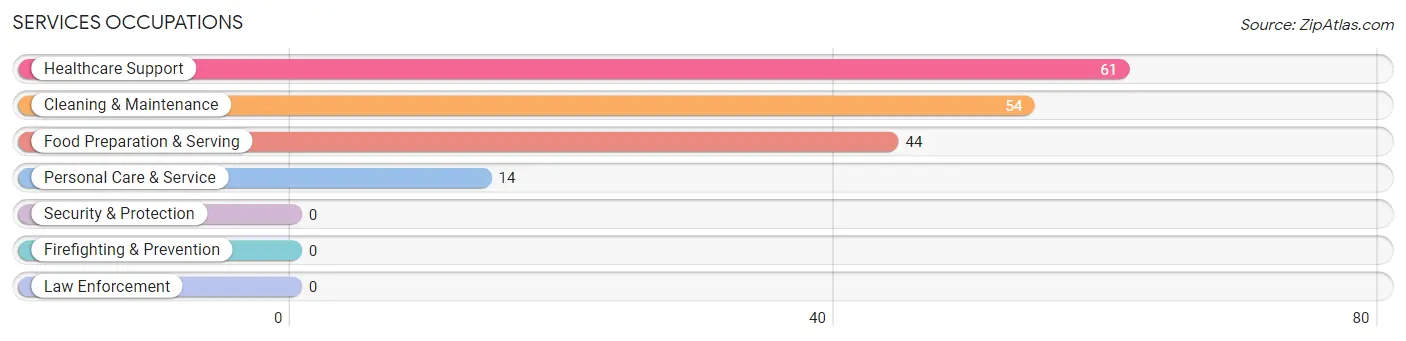
Services Occupations
The most common Services occupations in Newbern are Healthcare Support (61 | 4.5%), Cleaning & Maintenance (54 | 4.0%), Food Preparation & Serving (44 | 3.3%), and Personal Care & Service (14 | 1.0%).
Services Occupations by Sex
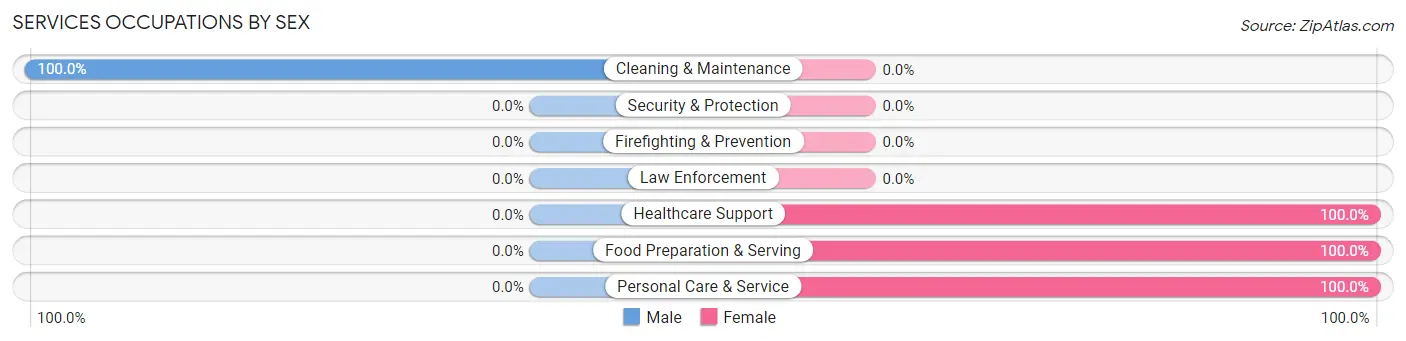
| Occupation | Male | Female |
| Healthcare Support | 0 (0.0%) | 61 (100.0%) |
| Security & Protection | 0 (0.0%) | 0 (0.0%) |
| Firefighting & Prevention | 0 (0.0%) | 0 (0.0%) |
| Law Enforcement | 0 (0.0%) | 0 (0.0%) |
| Food Preparation & Serving | 0 (0.0%) | 44 (100.0%) |
| Cleaning & Maintenance | 54 (100.0%) | 0 (0.0%) |
| Personal Care & Service | 0 (0.0%) | 14 (100.0%) |
| Total (Category) | 54 (31.2%) | 119 (68.8%) |
| Total (Overall) | 644 (48.1%) | 696 (51.9%) |
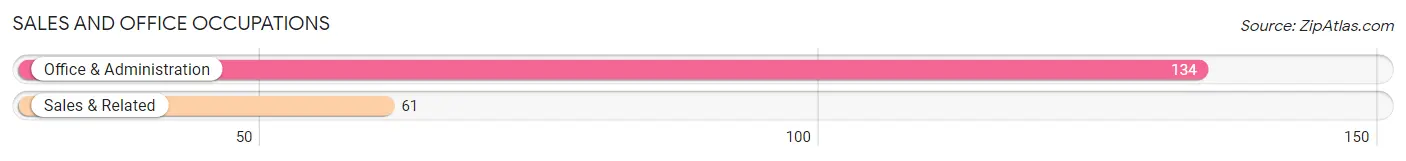
Sales and Office Occupations
The most common Sales and Office occupations in Newbern are Office & Administration (134 | 10.0%), and Sales & Related (61 | 4.5%).
Sales and Office Occupations by Sex
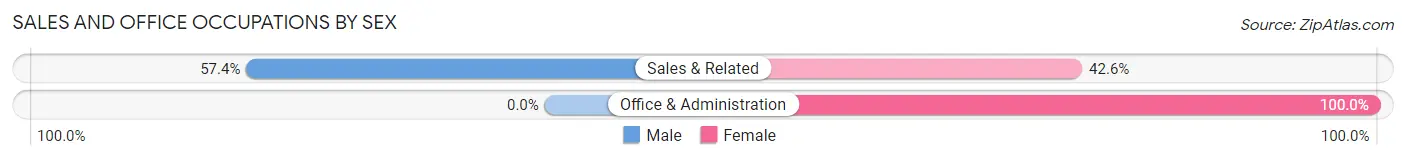
| Occupation | Male | Female |
| Sales & Related | 35 (57.4%) | 26 (42.6%) |
| Office & Administration | 0 (0.0%) | 134 (100.0%) |
| Total (Category) | 35 (17.9%) | 160 (82.1%) |
| Total (Overall) | 644 (48.1%) | 696 (51.9%) |
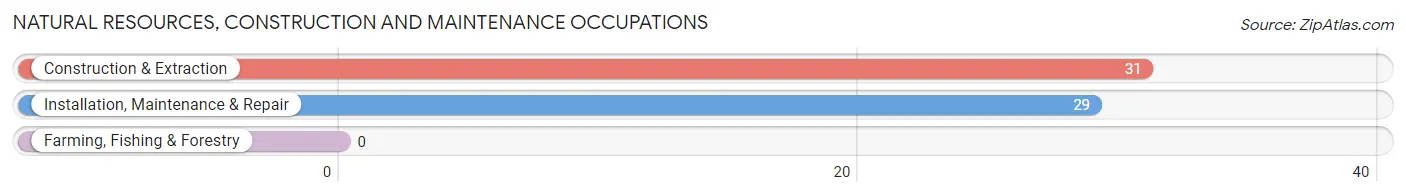
Natural Resources, Construction and Maintenance Occupations
The most common Natural Resources, Construction and Maintenance occupations in Newbern are Construction & Extraction (31 | 2.3%), and Installation, Maintenance & Repair (29 | 2.2%).
Natural Resources, Construction and Maintenance Occupations by Sex
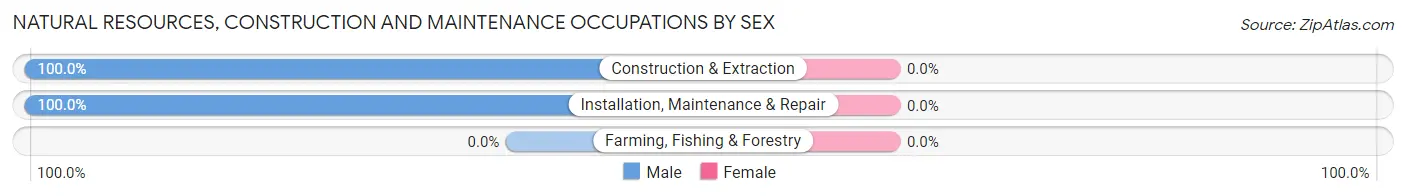
| Occupation | Male | Female |
| Farming, Fishing & Forestry | 0 (0.0%) | 0 (0.0%) |
| Construction & Extraction | 31 (100.0%) | 0 (0.0%) |
| Installation, Maintenance & Repair | 29 (100.0%) | 0 (0.0%) |
| Total (Category) | 60 (100.0%) | 0 (0.0%) |
| Total (Overall) | 644 (48.1%) | 696 (51.9%) |
Production, Transportation and Moving Occupations
The most common Production, Transportation and Moving occupations in Newbern are Material Moving (211 | 15.8%), Production (195 | 14.5%), and Transportation (102 | 7.6%).
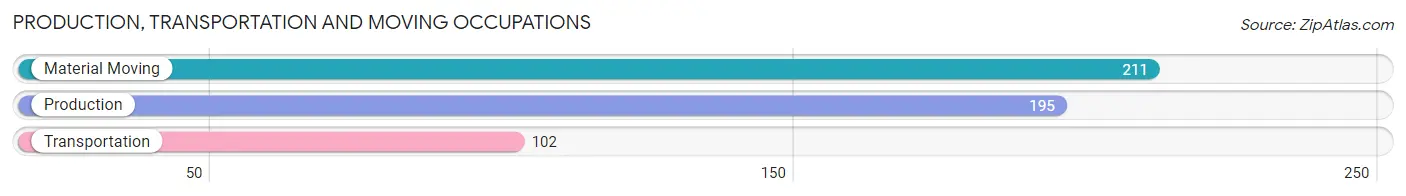
Production, Transportation and Moving Occupations by Sex
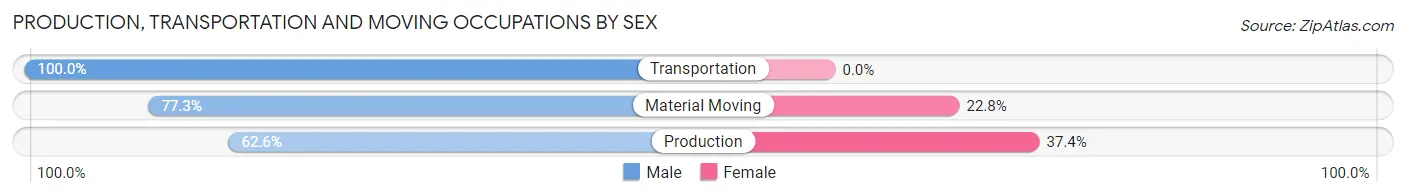
| Occupation | Male | Female |
| Production | 122 (62.6%) | 73 (37.4%) |
| Transportation | 102 (100.0%) | 0 (0.0%) |
| Material Moving | 163 (77.2%) | 48 (22.8%) |
| Total (Category) | 387 (76.2%) | 121 (23.8%) |
| Total (Overall) | 644 (48.1%) | 696 (51.9%) |
Employment Industries by Sex in Newbern
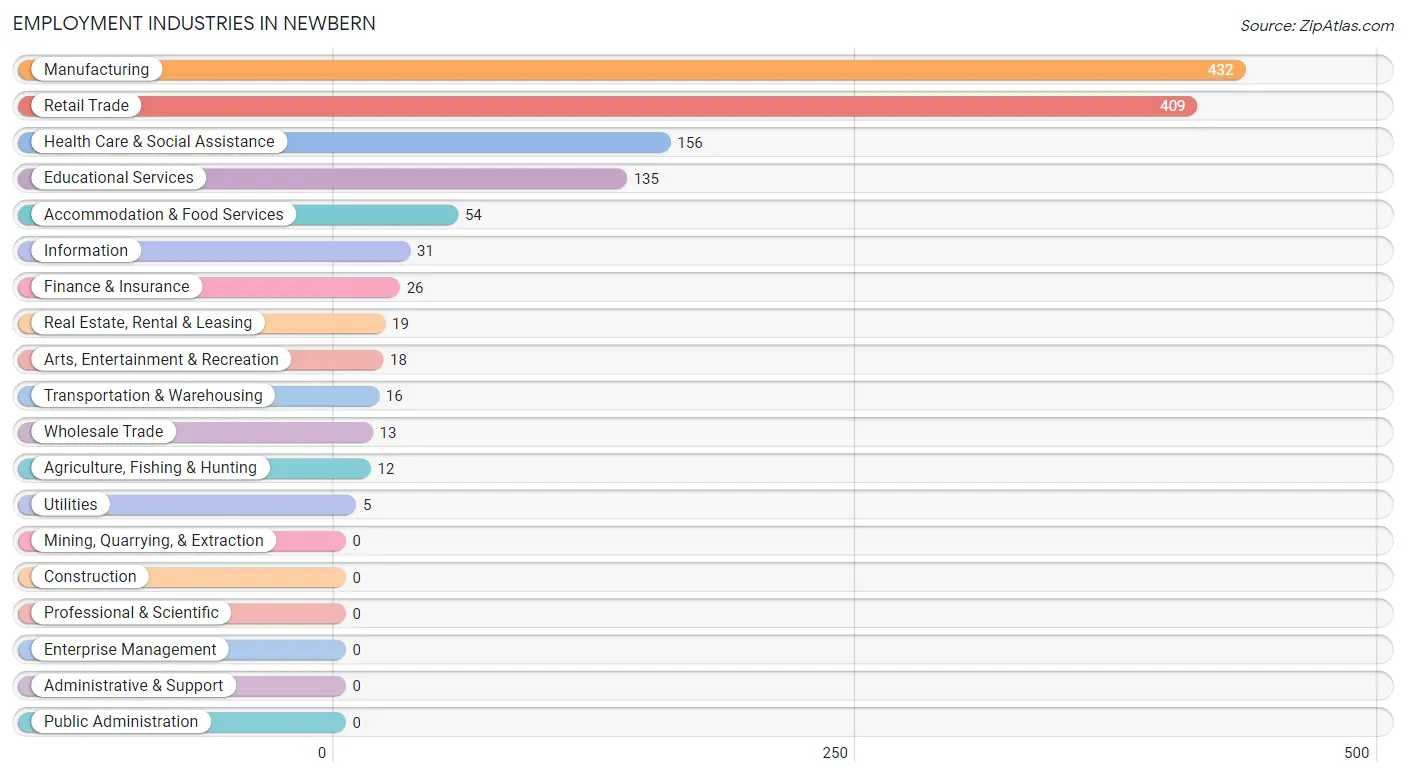
Employment Industries in Newbern
The major employment industries in Newbern include Manufacturing (432 | 32.2%), Retail Trade (409 | 30.5%), Health Care & Social Assistance (156 | 11.6%), Educational Services (135 | 10.1%), and Accommodation & Food Services (54 | 4.0%).
Employment Industries by Sex in Newbern
The Newbern industries that see more men than women are Agriculture, Fishing & Hunting (100.0%), Wholesale Trade (100.0%), and Utilities (100.0%), whereas the industries that tend to have a higher number of women are Information (100.0%), Health Care & Social Assistance (100.0%), and Accommodation & Food Services (100.0%).
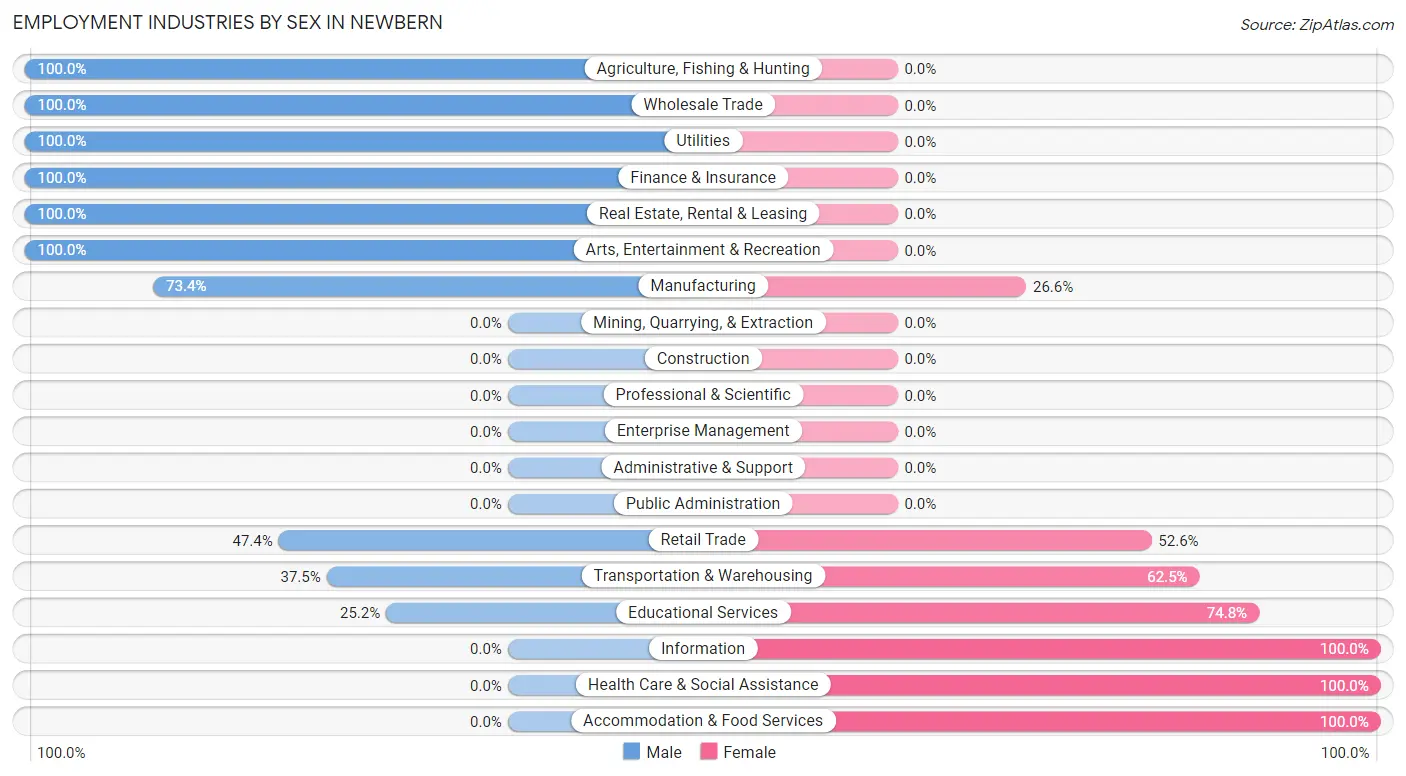
| Industry | Male | Female |
| Agriculture, Fishing & Hunting | 12 (100.0%) | 0 (0.0%) |
| Mining, Quarrying, & Extraction | 0 (0.0%) | 0 (0.0%) |
| Construction | 0 (0.0%) | 0 (0.0%) |
| Manufacturing | 317 (73.4%) | 115 (26.6%) |
| Wholesale Trade | 13 (100.0%) | 0 (0.0%) |
| Retail Trade | 194 (47.4%) | 215 (52.6%) |
| Transportation & Warehousing | 6 (37.5%) | 10 (62.5%) |
| Utilities | 5 (100.0%) | 0 (0.0%) |
| Information | 0 (0.0%) | 31 (100.0%) |
| Finance & Insurance | 26 (100.0%) | 0 (0.0%) |
| Real Estate, Rental & Leasing | 19 (100.0%) | 0 (0.0%) |
| Professional & Scientific | 0 (0.0%) | 0 (0.0%) |
| Enterprise Management | 0 (0.0%) | 0 (0.0%) |
| Administrative & Support | 0 (0.0%) | 0 (0.0%) |
| Educational Services | 34 (25.2%) | 101 (74.8%) |
| Health Care & Social Assistance | 0 (0.0%) | 156 (100.0%) |
| Arts, Entertainment & Recreation | 18 (100.0%) | 0 (0.0%) |
| Accommodation & Food Services | 0 (0.0%) | 54 (100.0%) |
| Public Administration | 0 (0.0%) | 0 (0.0%) |
| Total | 644 (48.1%) | 696 (51.9%) |
Education in Newbern
School Enrollment in Newbern
The most common levels of schooling among the 767 students in Newbern are middle school (301 | 39.2%), high school (243 | 31.7%), and elementary school (92 | 12.0%).
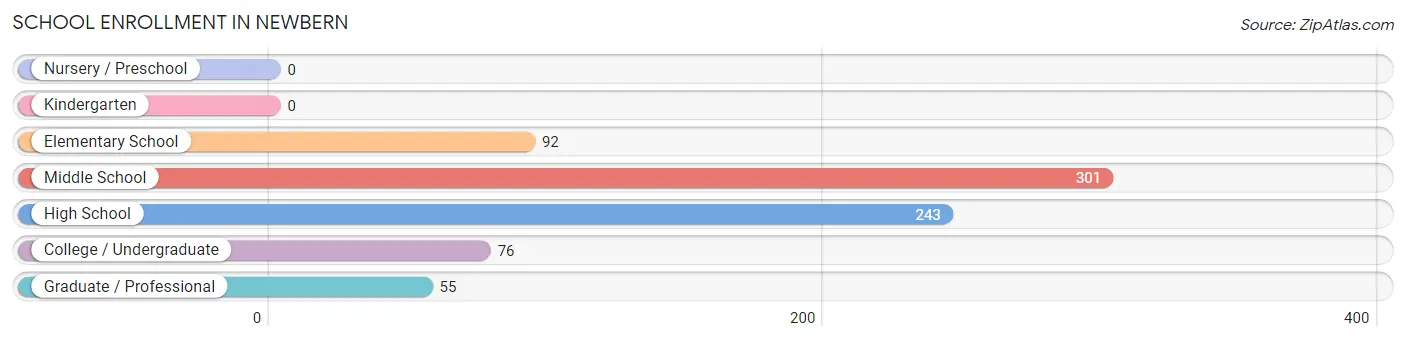
| School Level | # Students | % Students |
| Nursery / Preschool | 0 | 0.0% |
| Kindergarten | 0 | 0.0% |
| Elementary School | 92 | 12.0% |
| Middle School | 301 | 39.2% |
| High School | 243 | 31.7% |
| College / Undergraduate | 76 | 9.9% |
| Graduate / Professional | 55 | 7.2% |
| Total | 767 | 100.0% |
School Enrollment by Age by Funding Source in Newbern
Out of a total of 767 students who are enrolled in schools in Newbern, 18 (2.3%) attend a private institution, while the remaining 749 (97.7%) are enrolled in public schools. The age group of 35 years and over has the highest likelihood of being enrolled in private schools, with 17 (17.5% in the age bracket) enrolled. Conversely, the age group of 5 to 9 year old has the lowest likelihood of being enrolled in a private school, with 17 (100.0% in the age bracket) attending a public institution.
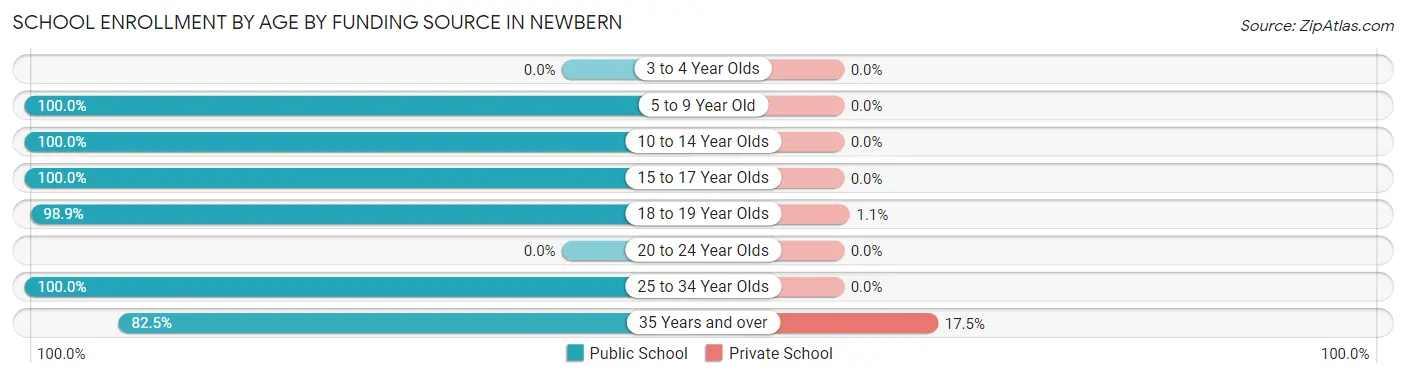
| Age Bracket | Public School | Private School |
| 3 to 4 Year Olds | 0 (0.0%) | 0 (0.0%) |
| 5 to 9 Year Old | 17 (100.0%) | 0 (0.0%) |
| 10 to 14 Year Olds | 396 (100.0%) | 0 (0.0%) |
| 15 to 17 Year Olds | 131 (100.0%) | 0 (0.0%) |
| 18 to 19 Year Olds | 91 (98.9%) | 1 (1.1%) |
| 20 to 24 Year Olds | 0 (0.0%) | 0 (0.0%) |
| 25 to 34 Year Olds | 34 (100.0%) | 0 (0.0%) |
| 35 Years and over | 80 (82.5%) | 17 (17.5%) |
| Total | 749 (97.7%) | 18 (2.3%) |
Educational Attainment by Field of Study in Newbern
Business (187 | 36.9%), science & technology (96 | 18.9%), arts & humanities (88 | 17.4%), bio, nature & agricultural (74 | 14.6%), and physical & health sciences (34 | 6.7%) are the most common fields of study among 507 individuals in Newbern who have obtained a bachelor's degree or higher.
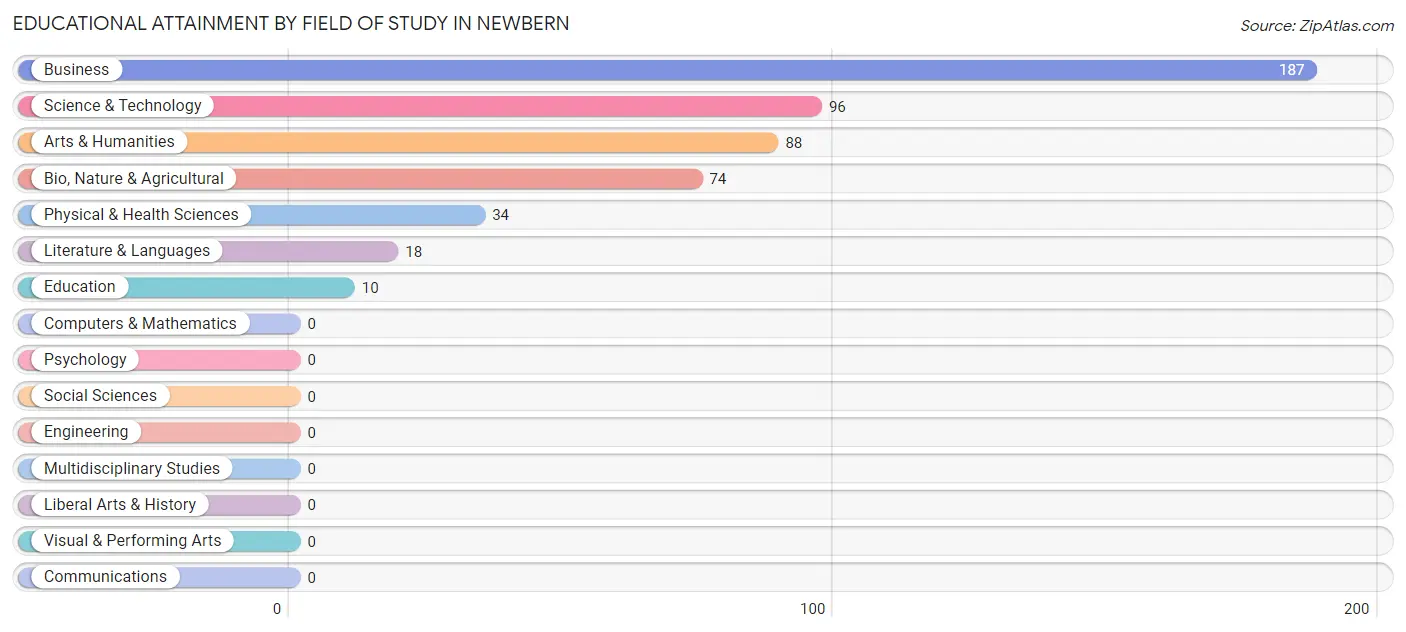
| Field of Study | # Graduates | % Graduates |
| Computers & Mathematics | 0 | 0.0% |
| Bio, Nature & Agricultural | 74 | 14.6% |
| Physical & Health Sciences | 34 | 6.7% |
| Psychology | 0 | 0.0% |
| Social Sciences | 0 | 0.0% |
| Engineering | 0 | 0.0% |
| Multidisciplinary Studies | 0 | 0.0% |
| Science & Technology | 96 | 18.9% |
| Business | 187 | 36.9% |
| Education | 10 | 2.0% |
| Literature & Languages | 18 | 3.5% |
| Liberal Arts & History | 0 | 0.0% |
| Visual & Performing Arts | 0 | 0.0% |
| Communications | 0 | 0.0% |
| Arts & Humanities | 88 | 17.4% |
| Total | 507 | 100.0% |
Transportation & Commute in Newbern
Vehicle Availability by Sex in Newbern
The most prevalent vehicle ownership categories in Newbern are males with 2 vehicles (346, accounting for 52.1%) and females with 2 vehicles (467, making up 51.0%).
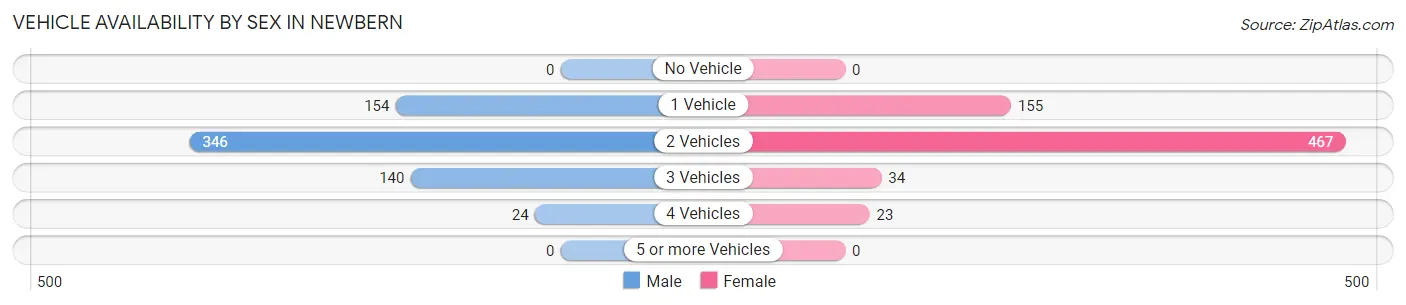
| Vehicles Available | Male | Female |
| No Vehicle | 0 (0.0%) | 0 (0.0%) |
| 1 Vehicle | 154 (23.2%) | 155 (22.8%) |
| 2 Vehicles | 346 (52.1%) | 467 (68.8%) |
| 3 Vehicles | 140 (21.1%) | 34 (5.0%) |
| 4 Vehicles | 24 (3.6%) | 23 (3.4%) |
| 5 or more Vehicles | 0 (0.0%) | 0 (0.0%) |
| Total | 664 (100.0%) | 679 (100.0%) |
Commute Time in Newbern
The most frequently occuring commute durations in Newbern are 10 to 14 minutes (318 commuters, 23.9%), 15 to 19 minutes (227 commuters, 17.1%), and 5 to 9 minutes (222 commuters, 16.7%).
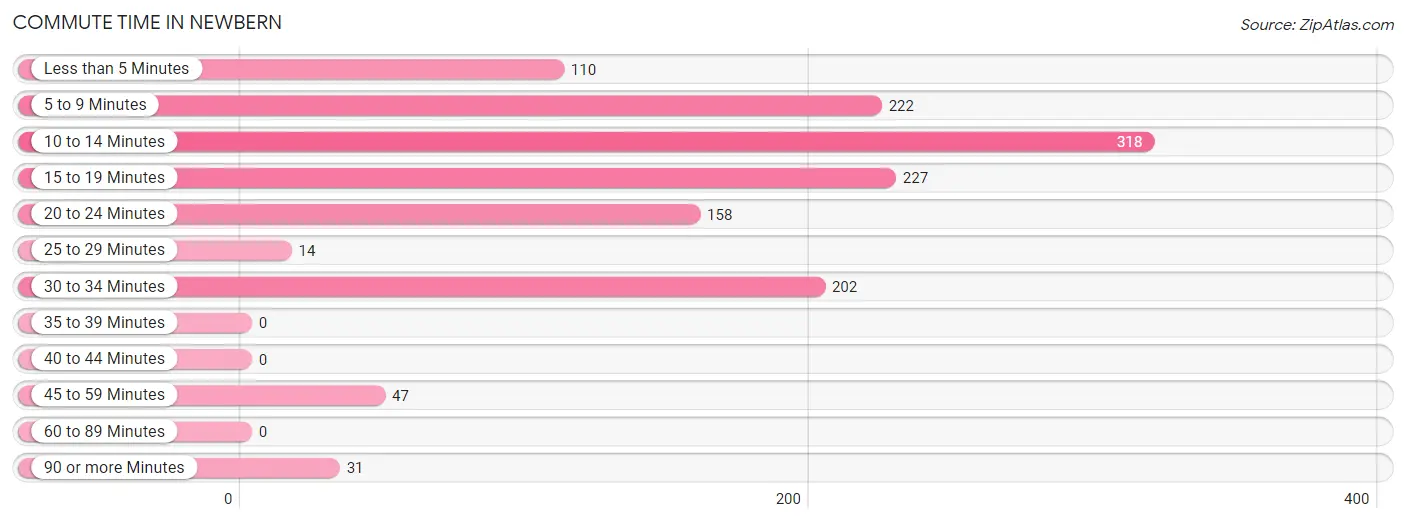
| Commute Time | # Commuters | % Commuters |
| Less than 5 Minutes | 110 | 8.3% |
| 5 to 9 Minutes | 222 | 16.7% |
| 10 to 14 Minutes | 318 | 23.9% |
| 15 to 19 Minutes | 227 | 17.1% |
| 20 to 24 Minutes | 158 | 11.9% |
| 25 to 29 Minutes | 14 | 1.1% |
| 30 to 34 Minutes | 202 | 15.2% |
| 35 to 39 Minutes | 0 | 0.0% |
| 40 to 44 Minutes | 0 | 0.0% |
| 45 to 59 Minutes | 47 | 3.5% |
| 60 to 89 Minutes | 0 | 0.0% |
| 90 or more Minutes | 31 | 2.3% |
Commute Time by Sex in Newbern
The most common commute times in Newbern are 15 to 19 minutes (180 commuters, 27.7%) for males and 10 to 14 minutes (169 commuters, 24.9%) for females.
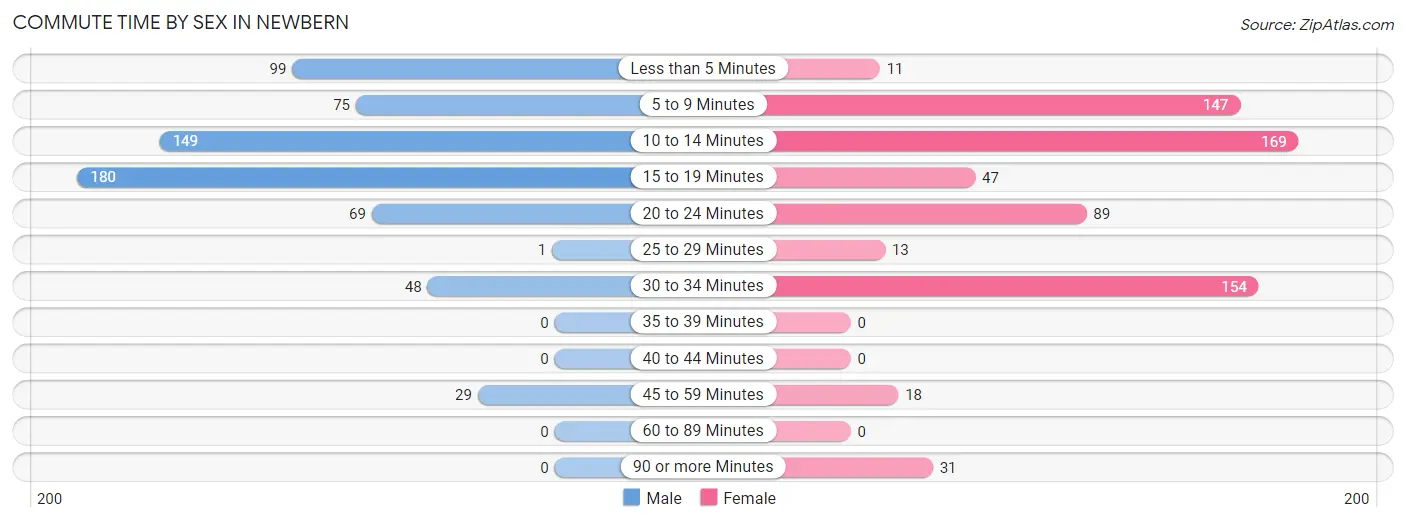
| Commute Time | Male | Female |
| Less than 5 Minutes | 99 (15.2%) | 11 (1.6%) |
| 5 to 9 Minutes | 75 (11.5%) | 147 (21.6%) |
| 10 to 14 Minutes | 149 (22.9%) | 169 (24.9%) |
| 15 to 19 Minutes | 180 (27.7%) | 47 (6.9%) |
| 20 to 24 Minutes | 69 (10.6%) | 89 (13.1%) |
| 25 to 29 Minutes | 1 (0.2%) | 13 (1.9%) |
| 30 to 34 Minutes | 48 (7.4%) | 154 (22.7%) |
| 35 to 39 Minutes | 0 (0.0%) | 0 (0.0%) |
| 40 to 44 Minutes | 0 (0.0%) | 0 (0.0%) |
| 45 to 59 Minutes | 29 (4.5%) | 18 (2.6%) |
| 60 to 89 Minutes | 0 (0.0%) | 0 (0.0%) |
| 90 or more Minutes | 0 (0.0%) | 31 (4.6%) |
Time of Departure to Work by Sex in Newbern
The most frequent times of departure to work in Newbern are 4:00 PM to 11:59 PM (185, 28.5%) for males and 7:00 AM to 7:29 AM (226, 33.3%) for females.
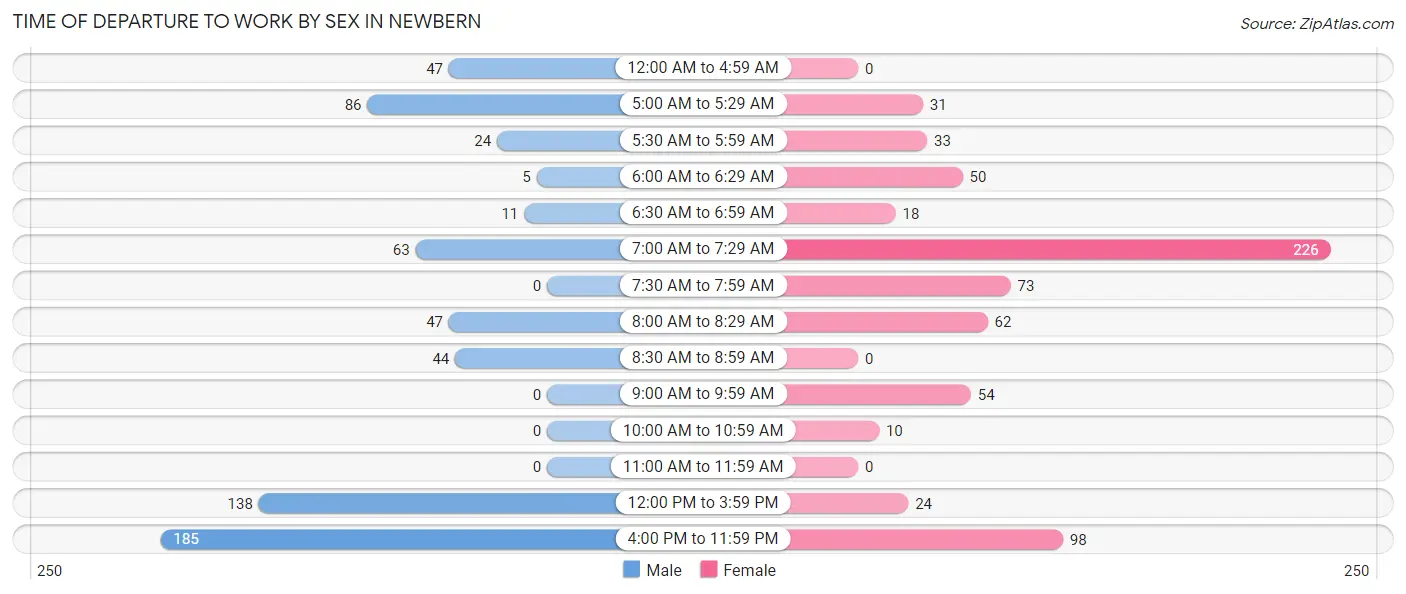
| Time of Departure | Male | Female |
| 12:00 AM to 4:59 AM | 47 (7.2%) | 0 (0.0%) |
| 5:00 AM to 5:29 AM | 86 (13.2%) | 31 (4.6%) |
| 5:30 AM to 5:59 AM | 24 (3.7%) | 33 (4.9%) |
| 6:00 AM to 6:29 AM | 5 (0.8%) | 50 (7.4%) |
| 6:30 AM to 6:59 AM | 11 (1.7%) | 18 (2.6%) |
| 7:00 AM to 7:29 AM | 63 (9.7%) | 226 (33.3%) |
| 7:30 AM to 7:59 AM | 0 (0.0%) | 73 (10.7%) |
| 8:00 AM to 8:29 AM | 47 (7.2%) | 62 (9.1%) |
| 8:30 AM to 8:59 AM | 44 (6.8%) | 0 (0.0%) |
| 9:00 AM to 9:59 AM | 0 (0.0%) | 54 (8.0%) |
| 10:00 AM to 10:59 AM | 0 (0.0%) | 10 (1.5%) |
| 11:00 AM to 11:59 AM | 0 (0.0%) | 0 (0.0%) |
| 12:00 PM to 3:59 PM | 138 (21.2%) | 24 (3.5%) |
| 4:00 PM to 11:59 PM | 185 (28.5%) | 98 (14.4%) |
| Total | 650 (100.0%) | 679 (100.0%) |
Housing Occupancy in Newbern
Occupancy by Ownership in Newbern
Of the total 1,516 dwellings in Newbern, owner-occupied units account for 904 (59.6%), while renter-occupied units make up 612 (40.4%).
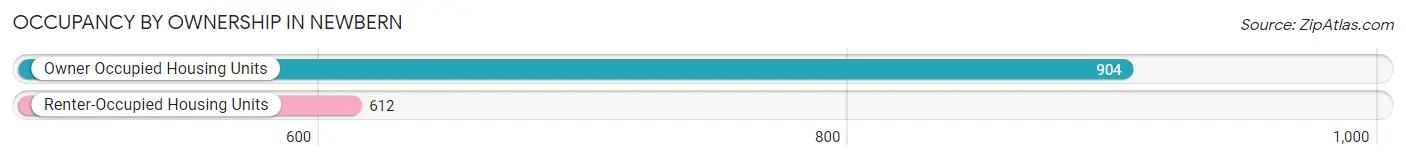
| Occupancy | # Housing Units | % Housing Units |
| Owner Occupied Housing Units | 904 | 59.6% |
| Renter-Occupied Housing Units | 612 | 40.4% |
| Total Occupied Housing Units | 1,516 | 100.0% |
Occupancy by Household Size in Newbern
| Household Size | # Housing Units | % Housing Units |
| 1-Person Household | 590 | 38.9% |
| 2-Person Household | 547 | 36.1% |
| 3-Person Household | 218 | 14.4% |
| 4+ Person Household | 161 | 10.6% |
| Total Housing Units | 1,516 | 100.0% |
Occupancy by Ownership by Household Size in Newbern
| Household Size | Owner-occupied | Renter-occupied |
| 1-Person Household | 381 (64.6%) | 209 (35.4%) |
| 2-Person Household | 354 (64.7%) | 193 (35.3%) |
| 3-Person Household | 123 (56.4%) | 95 (43.6%) |
| 4+ Person Household | 46 (28.6%) | 115 (71.4%) |
| Total Housing Units | 904 (59.6%) | 612 (40.4%) |
Occupancy by Educational Attainment in Newbern
| Household Size | Owner-occupied | Renter-occupied |
| Less than High School | 191 (84.5%) | 35 (15.5%) |
| High School Diploma | 238 (51.2%) | 227 (48.8%) |
| College/Associate Degree | 242 (41.6%) | 339 (58.4%) |
| Bachelor's Degree or higher | 233 (95.5%) | 11 (4.5%) |
Occupancy by Age of Householder in Newbern
| Age Bracket | # Households | % Households |
| Under 35 Years | 418 | 27.6% |
| 35 to 44 Years | 195 | 12.9% |
| 45 to 54 Years | 248 | 16.4% |
| 55 to 64 Years | 153 | 10.1% |
| 65 to 74 Years | 229 | 15.1% |
| 75 to 84 Years | 129 | 8.5% |
| 85 Years and Over | 144 | 9.5% |
| Total | 1,516 | 100.0% |
Housing Finances in Newbern
Median Income by Occupancy in Newbern
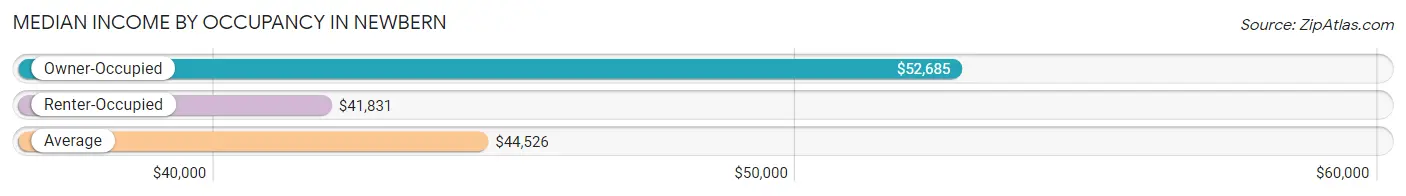
| Occupancy Type | # Households | Median Income |
| Owner-Occupied | 904 (59.6%) | $52,685 |
| Renter-Occupied | 612 (40.4%) | $41,831 |
| Average | 1,516 (100.0%) | $44,526 |
Occupancy by Householder Income Bracket in Newbern
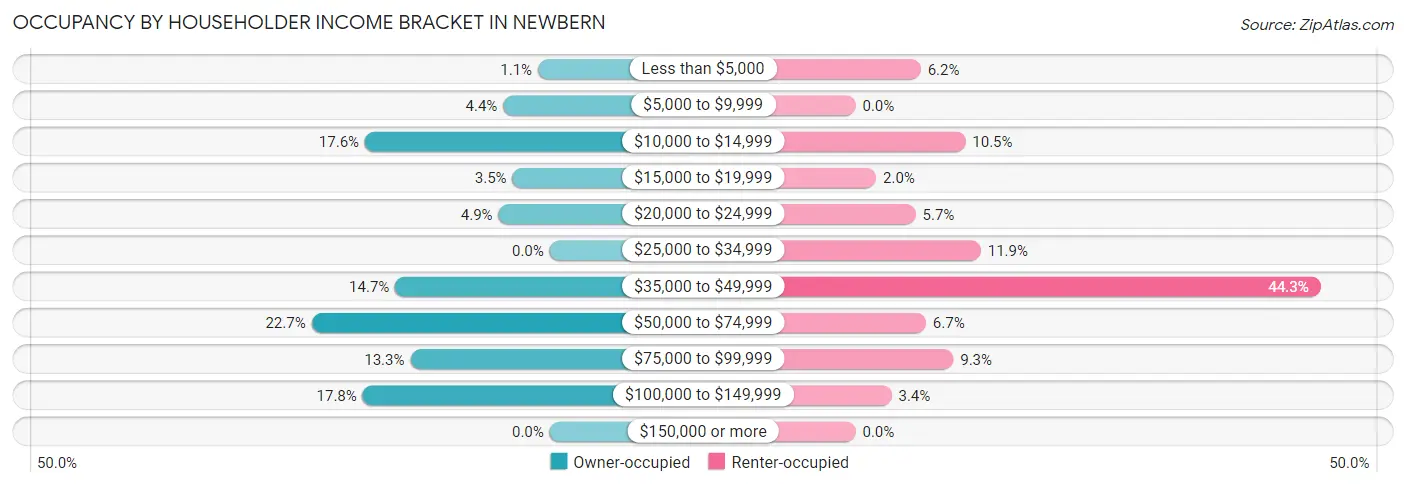
| Income Bracket | Owner-occupied | Renter-occupied |
| Less than $5,000 | 10 (1.1%) | 38 (6.2%) |
| $5,000 to $9,999 | 40 (4.4%) | 0 (0.0%) |
| $10,000 to $14,999 | 159 (17.6%) | 64 (10.5%) |
| $15,000 to $19,999 | 32 (3.5%) | 12 (2.0%) |
| $20,000 to $24,999 | 44 (4.9%) | 35 (5.7%) |
| $25,000 to $34,999 | 0 (0.0%) | 73 (11.9%) |
| $35,000 to $49,999 | 133 (14.7%) | 271 (44.3%) |
| $50,000 to $74,999 | 205 (22.7%) | 41 (6.7%) |
| $75,000 to $99,999 | 120 (13.3%) | 57 (9.3%) |
| $100,000 to $149,999 | 161 (17.8%) | 21 (3.4%) |
| $150,000 or more | 0 (0.0%) | 0 (0.0%) |
| Total | 904 (100.0%) | 612 (100.0%) |
Monthly Housing Cost Tiers in Newbern
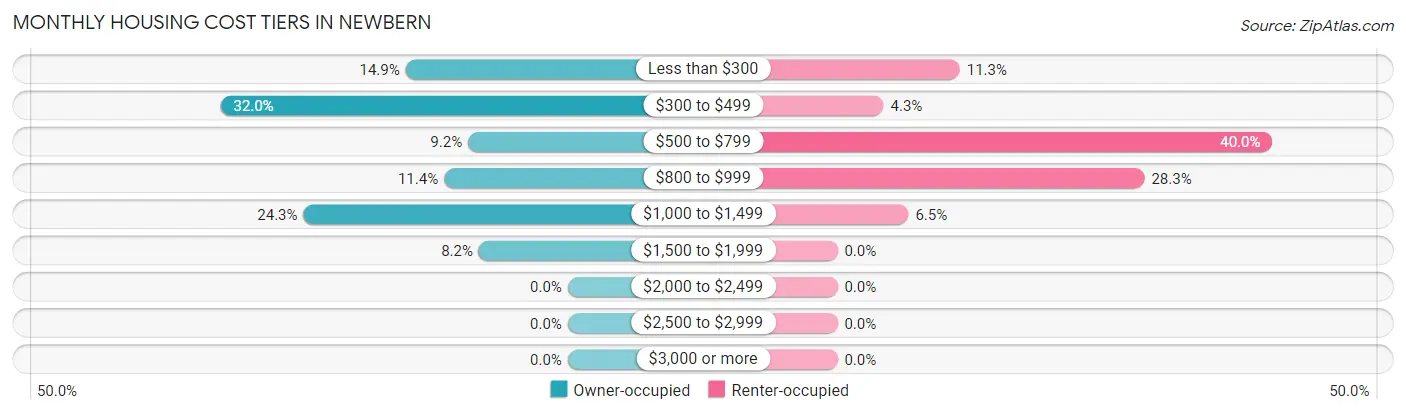
| Monthly Cost | Owner-occupied | Renter-occupied |
| Less than $300 | 135 (14.9%) | 69 (11.3%) |
| $300 to $499 | 289 (32.0%) | 26 (4.3%) |
| $500 to $799 | 83 (9.2%) | 245 (40.0%) |
| $800 to $999 | 103 (11.4%) | 173 (28.3%) |
| $1,000 to $1,499 | 220 (24.3%) | 40 (6.5%) |
| $1,500 to $1,999 | 74 (8.2%) | 0 (0.0%) |
| $2,000 to $2,499 | 0 (0.0%) | 0 (0.0%) |
| $2,500 to $2,999 | 0 (0.0%) | 0 (0.0%) |
| $3,000 or more | 0 (0.0%) | 0 (0.0%) |
| Total | 904 (100.0%) | 612 (100.0%) |
Physical Housing Characteristics in Newbern
Housing Structures in Newbern
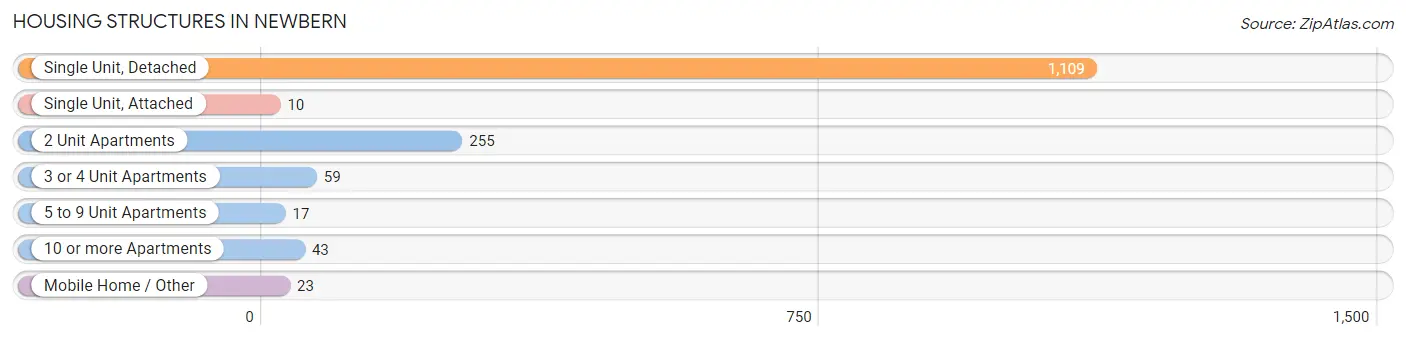
| Structure Type | # Housing Units | % Housing Units |
| Single Unit, Detached | 1,109 | 73.2% |
| Single Unit, Attached | 10 | 0.7% |
| 2 Unit Apartments | 255 | 16.8% |
| 3 or 4 Unit Apartments | 59 | 3.9% |
| 5 to 9 Unit Apartments | 17 | 1.1% |
| 10 or more Apartments | 43 | 2.8% |
| Mobile Home / Other | 23 | 1.5% |
| Total | 1,516 | 100.0% |
Housing Structures by Occupancy in Newbern
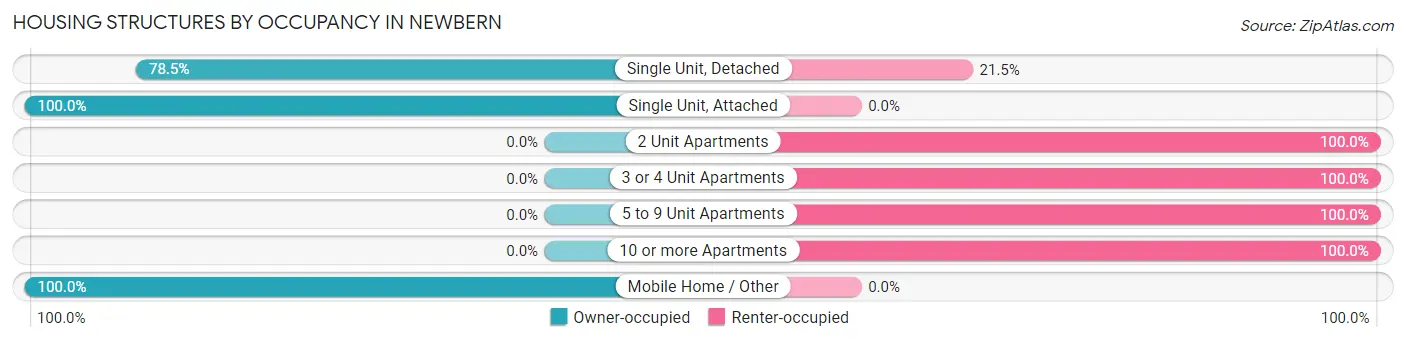
| Structure Type | Owner-occupied | Renter-occupied |
| Single Unit, Detached | 871 (78.5%) | 238 (21.5%) |
| Single Unit, Attached | 10 (100.0%) | 0 (0.0%) |
| 2 Unit Apartments | 0 (0.0%) | 255 (100.0%) |
| 3 or 4 Unit Apartments | 0 (0.0%) | 59 (100.0%) |
| 5 to 9 Unit Apartments | 0 (0.0%) | 17 (100.0%) |
| 10 or more Apartments | 0 (0.0%) | 43 (100.0%) |
| Mobile Home / Other | 23 (100.0%) | 0 (0.0%) |
| Total | 904 (59.6%) | 612 (40.4%) |
Housing Structures by Number of Rooms in Newbern
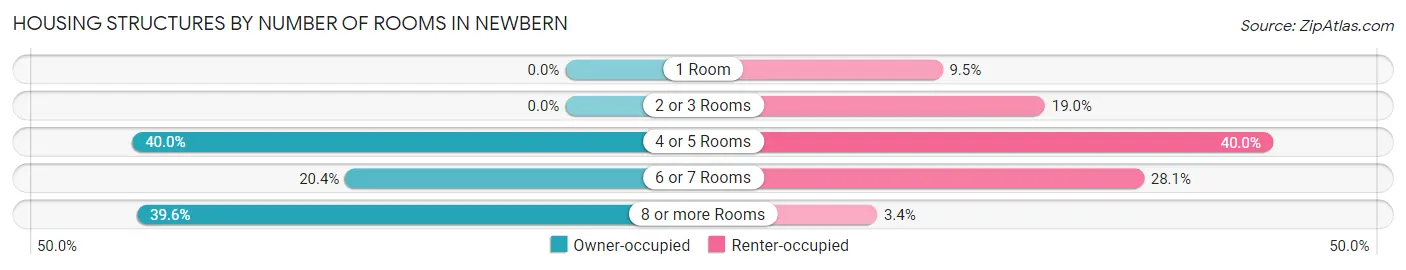
| Number of Rooms | Owner-occupied | Renter-occupied |
| 1 Room | 0 (0.0%) | 58 (9.5%) |
| 2 or 3 Rooms | 0 (0.0%) | 116 (19.0%) |
| 4 or 5 Rooms | 362 (40.0%) | 245 (40.0%) |
| 6 or 7 Rooms | 184 (20.3%) | 172 (28.1%) |
| 8 or more Rooms | 358 (39.6%) | 21 (3.4%) |
| Total | 904 (100.0%) | 612 (100.0%) |
Housing Structure by Heating Type in Newbern
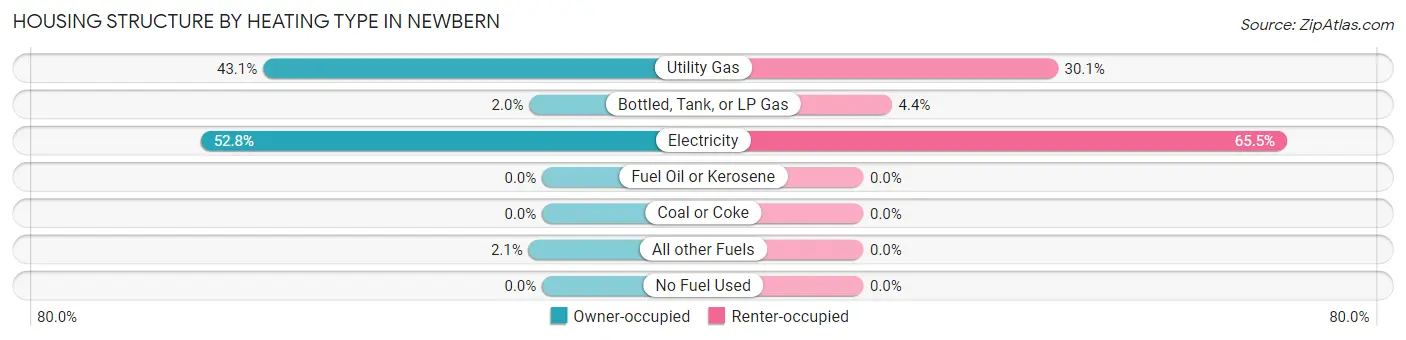
| Heating Type | Owner-occupied | Renter-occupied |
| Utility Gas | 390 (43.1%) | 184 (30.1%) |
| Bottled, Tank, or LP Gas | 18 (2.0%) | 27 (4.4%) |
| Electricity | 477 (52.8%) | 401 (65.5%) |
| Fuel Oil or Kerosene | 0 (0.0%) | 0 (0.0%) |
| Coal or Coke | 0 (0.0%) | 0 (0.0%) |
| All other Fuels | 19 (2.1%) | 0 (0.0%) |
| No Fuel Used | 0 (0.0%) | 0 (0.0%) |
| Total | 904 (100.0%) | 612 (100.0%) |
Household Vehicle Usage in Newbern
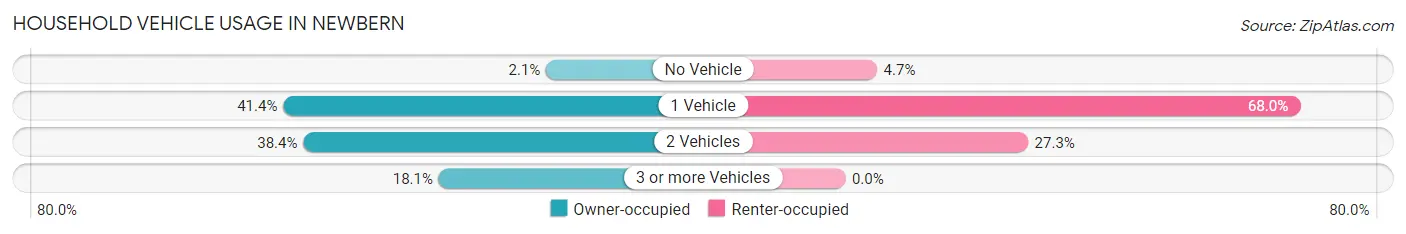
| Vehicles per Household | Owner-occupied | Renter-occupied |
| No Vehicle | 19 (2.1%) | 29 (4.7%) |
| 1 Vehicle | 374 (41.4%) | 416 (68.0%) |
| 2 Vehicles | 347 (38.4%) | 167 (27.3%) |
| 3 or more Vehicles | 164 (18.1%) | 0 (0.0%) |
| Total | 904 (100.0%) | 612 (100.0%) |
Real Estate & Mortgages in Newbern
Real Estate and Mortgage Overview in Newbern
| Characteristic | Without Mortgage | With Mortgage |
| Housing Units | 421 | 483 |
| Median Property Value | $90,600 | $138,900 |
| Median Household Income | - | - |
| Monthly Housing Costs | $325 | $0 |
| Real Estate Taxes | $594 | $155 |
Property Value by Mortgage Status in Newbern
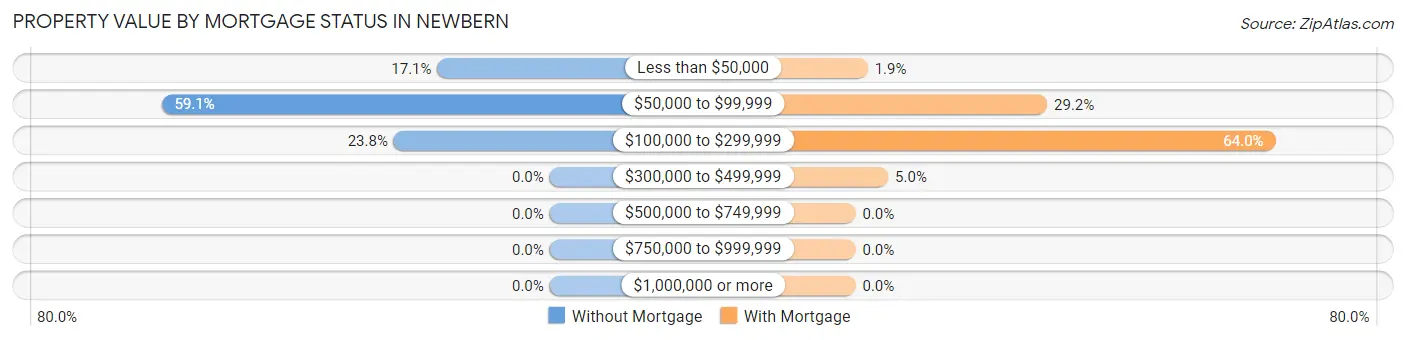
| Property Value | Without Mortgage | With Mortgage |
| Less than $50,000 | 72 (17.1%) | 9 (1.9%) |
| $50,000 to $99,999 | 249 (59.1%) | 141 (29.2%) |
| $100,000 to $299,999 | 100 (23.7%) | 309 (64.0%) |
| $300,000 to $499,999 | 0 (0.0%) | 24 (5.0%) |
| $500,000 to $749,999 | 0 (0.0%) | 0 (0.0%) |
| $750,000 to $999,999 | 0 (0.0%) | 0 (0.0%) |
| $1,000,000 or more | 0 (0.0%) | 0 (0.0%) |
| Total | 421 (100.0%) | 483 (100.0%) |
Household Income by Mortgage Status in Newbern
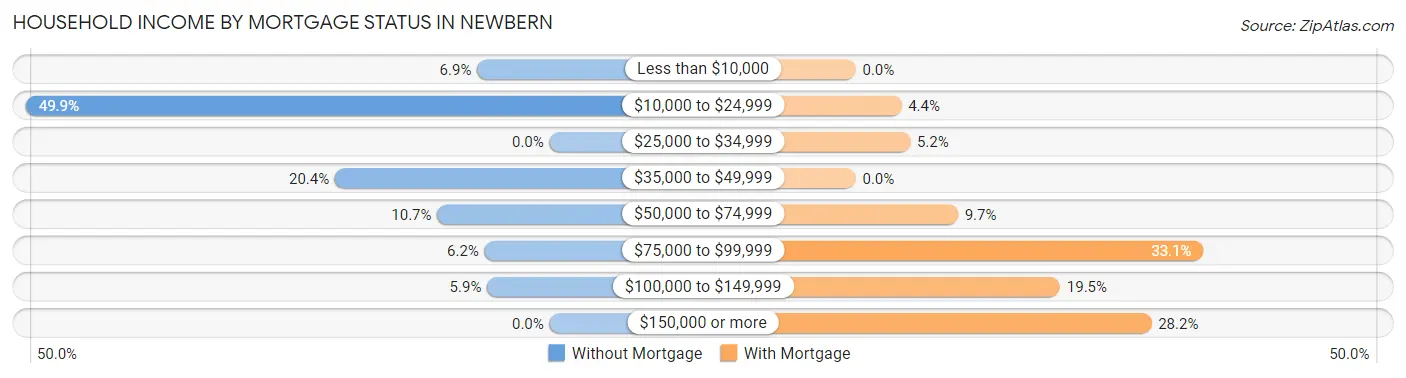
| Household Income | Without Mortgage | With Mortgage |
| Less than $10,000 | 29 (6.9%) | 0 (0.0%) |
| $10,000 to $24,999 | 210 (49.9%) | 21 (4.3%) |
| $25,000 to $34,999 | 0 (0.0%) | 25 (5.2%) |
| $35,000 to $49,999 | 86 (20.4%) | 0 (0.0%) |
| $50,000 to $74,999 | 45 (10.7%) | 47 (9.7%) |
| $75,000 to $99,999 | 26 (6.2%) | 160 (33.1%) |
| $100,000 to $149,999 | 25 (5.9%) | 94 (19.5%) |
| $150,000 or more | 0 (0.0%) | 136 (28.2%) |
| Total | 421 (100.0%) | 483 (100.0%) |
Property Value to Household Income Ratio in Newbern
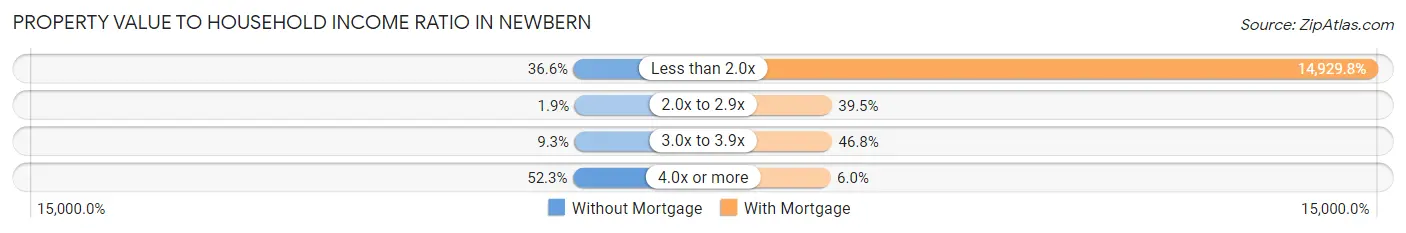
| Value-to-Income Ratio | Without Mortgage | With Mortgage |
| Less than 2.0x | 154 (36.6%) | 72,111 (14,929.8%) |
| 2.0x to 2.9x | 8 (1.9%) | 191 (39.5%) |
| 3.0x to 3.9x | 39 (9.3%) | 226 (46.8%) |
| 4.0x or more | 220 (52.3%) | 29 (6.0%) |
| Total | 421 (100.0%) | 483 (100.0%) |
Real Estate Taxes by Mortgage Status in Newbern
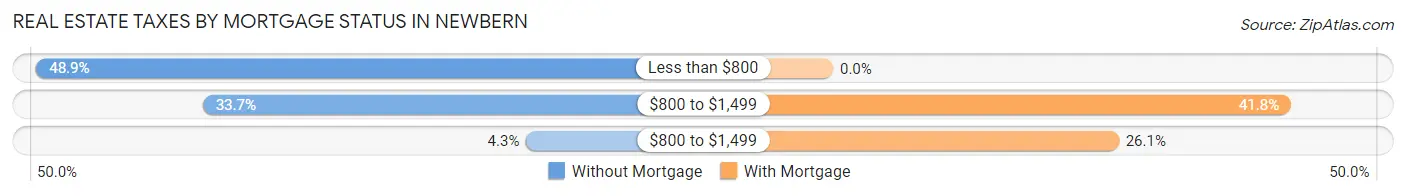
| Property Taxes | Without Mortgage | With Mortgage |
| Less than $800 | 206 (48.9%) | 0 (0.0%) |
| $800 to $1,499 | 142 (33.7%) | 202 (41.8%) |
| $800 to $1,499 | 18 (4.3%) | 126 (26.1%) |
| Total | 421 (100.0%) | 483 (100.0%) |
Health & Disability in Newbern
Health Insurance Coverage by Age in Newbern
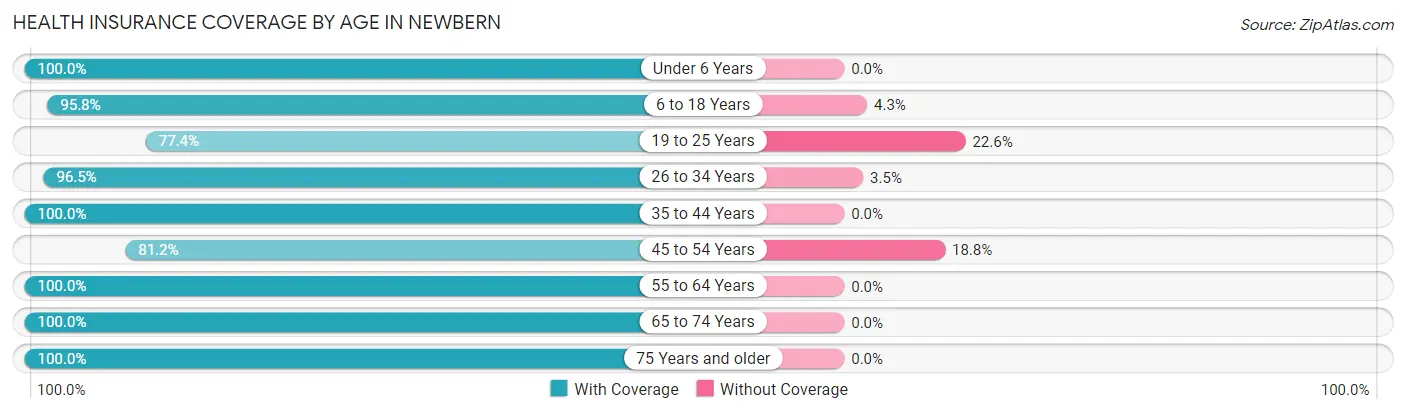
| Age Bracket | With Coverage | Without Coverage |
| Under 6 Years | 234 (100.0%) | 0 (0.0%) |
| 6 to 18 Years | 609 (95.8%) | 27 (4.3%) |
| 19 to 25 Years | 298 (77.4%) | 87 (22.6%) |
| 26 to 34 Years | 493 (96.5%) | 18 (3.5%) |
| 35 to 44 Years | 424 (100.0%) | 0 (0.0%) |
| 45 to 54 Years | 242 (81.2%) | 56 (18.8%) |
| 55 to 64 Years | 229 (100.0%) | 0 (0.0%) |
| 65 to 74 Years | 252 (100.0%) | 0 (0.0%) |
| 75 Years and older | 331 (100.0%) | 0 (0.0%) |
| Total | 3,112 (94.3%) | 188 (5.7%) |
Health Insurance Coverage by Citizenship Status in Newbern
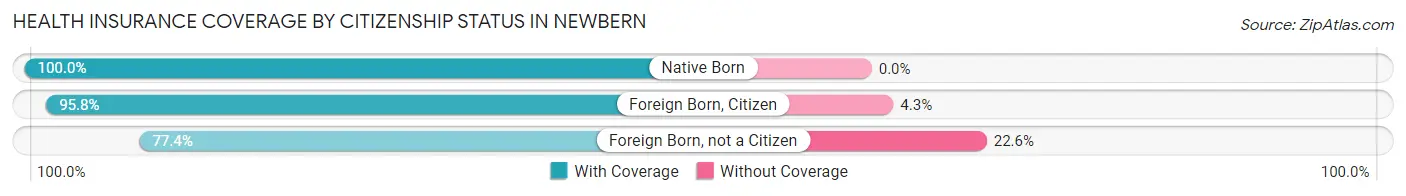
| Citizenship Status | With Coverage | Without Coverage |
| Native Born | 234 (100.0%) | 0 (0.0%) |
| Foreign Born, Citizen | 609 (95.8%) | 27 (4.3%) |
| Foreign Born, not a Citizen | 298 (77.4%) | 87 (22.6%) |
Health Insurance Coverage by Household Income in Newbern
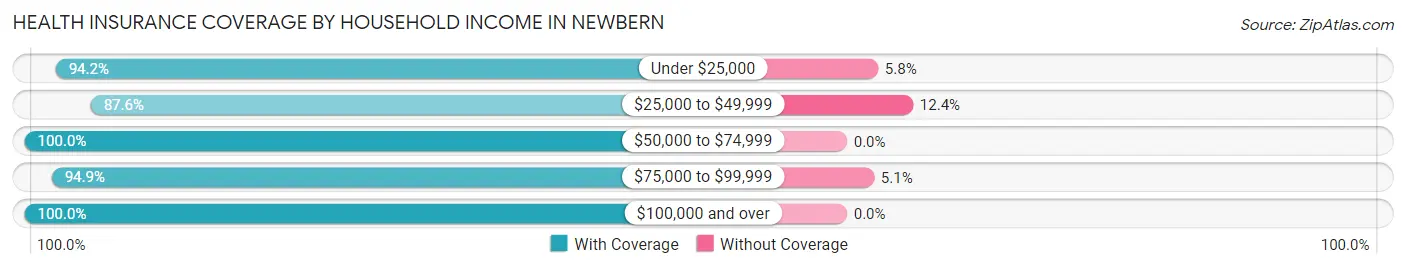
| Household Income | With Coverage | Without Coverage |
| Under $25,000 | 598 (94.2%) | 37 (5.8%) |
| $25,000 to $49,999 | 912 (87.6%) | 129 (12.4%) |
| $50,000 to $74,999 | 614 (100.0%) | 0 (0.0%) |
| $75,000 to $99,999 | 411 (94.9%) | 22 (5.1%) |
| $100,000 and over | 567 (100.0%) | 0 (0.0%) |
Public vs Private Health Insurance Coverage by Age in Newbern
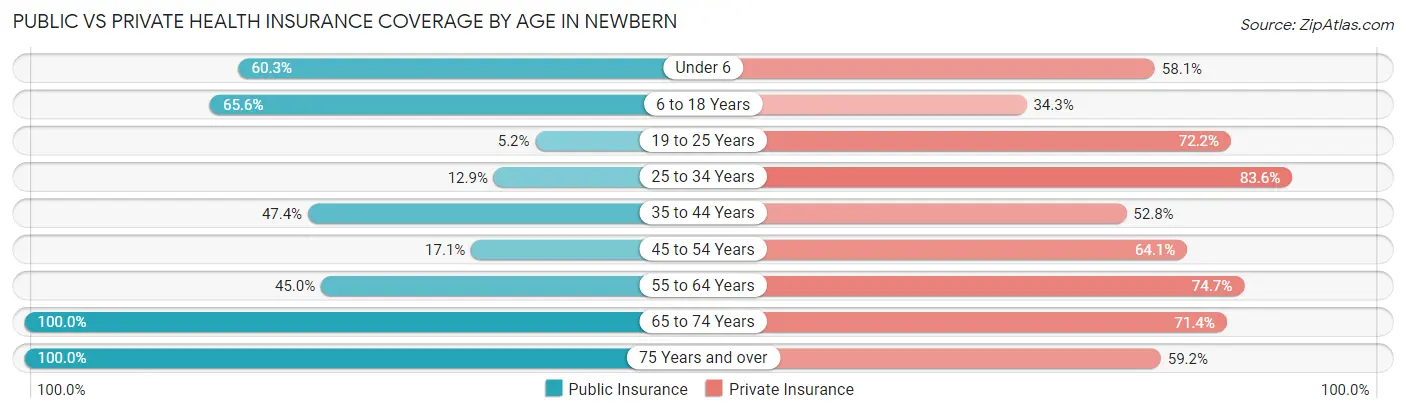
| Age Bracket | Public Insurance | Private Insurance |
| Under 6 | 141 (60.3%) | 136 (58.1%) |
| 6 to 18 Years | 417 (65.6%) | 218 (34.3%) |
| 19 to 25 Years | 20 (5.2%) | 278 (72.2%) |
| 25 to 34 Years | 66 (12.9%) | 427 (83.6%) |
| 35 to 44 Years | 201 (47.4%) | 224 (52.8%) |
| 45 to 54 Years | 51 (17.1%) | 191 (64.1%) |
| 55 to 64 Years | 103 (45.0%) | 171 (74.7%) |
| 65 to 74 Years | 252 (100.0%) | 180 (71.4%) |
| 75 Years and over | 331 (100.0%) | 196 (59.2%) |
| Total | 1,582 (47.9%) | 2,021 (61.2%) |
Disability Status by Sex by Age in Newbern
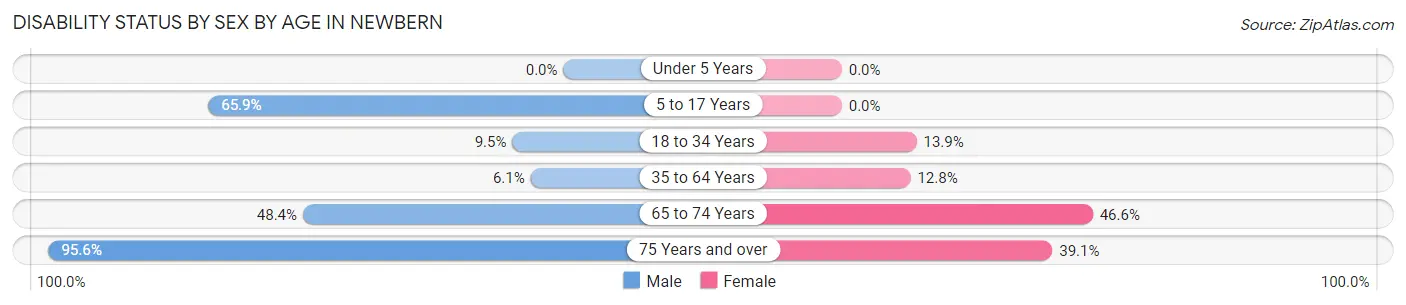
| Age Bracket | Male | Female |
| Under 5 Years | 0 (0.0%) | 0 (0.0%) |
| 5 to 17 Years | 201 (65.9%) | 0 (0.0%) |
| 18 to 34 Years | 41 (9.5%) | 77 (13.9%) |
| 35 to 64 Years | 24 (6.1%) | 71 (12.8%) |
| 65 to 74 Years | 44 (48.3%) | 75 (46.6%) |
| 75 Years and over | 172 (95.6%) | 59 (39.1%) |
Disability Class by Sex by Age in Newbern
Disability Class: Hearing Difficulty
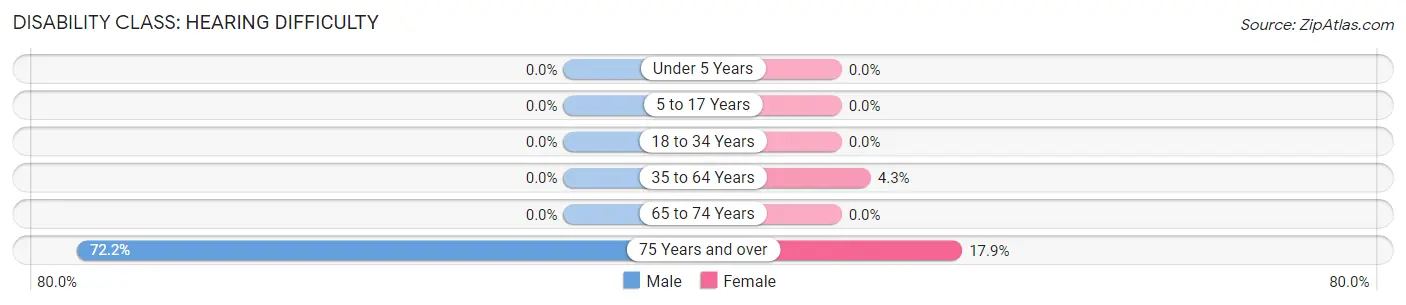
| Age Bracket | Male | Female |
| Under 5 Years | 0 (0.0%) | 0 (0.0%) |
| 5 to 17 Years | 0 (0.0%) | 0 (0.0%) |
| 18 to 34 Years | 0 (0.0%) | 0 (0.0%) |
| 35 to 64 Years | 0 (0.0%) | 24 (4.3%) |
| 65 to 74 Years | 0 (0.0%) | 0 (0.0%) |
| 75 Years and over | 130 (72.2%) | 27 (17.9%) |
Disability Class: Vision Difficulty
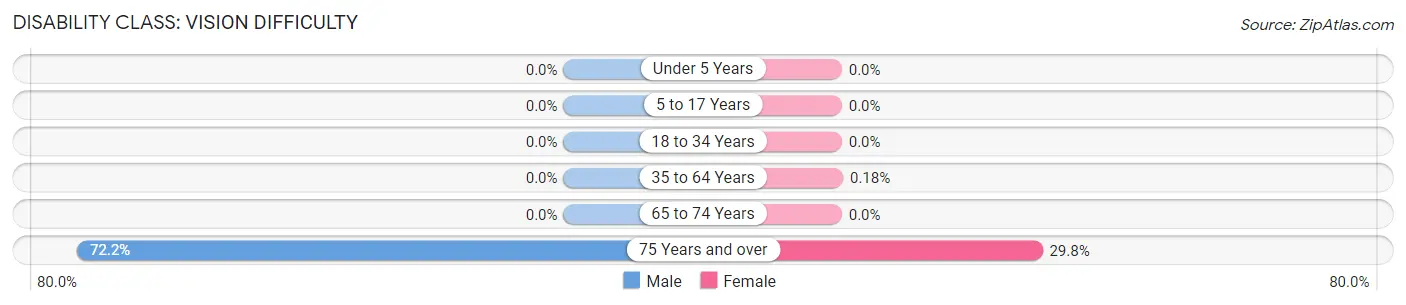
| Age Bracket | Male | Female |
| Under 5 Years | 0 (0.0%) | 0 (0.0%) |
| 5 to 17 Years | 0 (0.0%) | 0 (0.0%) |
| 18 to 34 Years | 0 (0.0%) | 0 (0.0%) |
| 35 to 64 Years | 0 (0.0%) | 1 (0.2%) |
| 65 to 74 Years | 0 (0.0%) | 0 (0.0%) |
| 75 Years and over | 130 (72.2%) | 45 (29.8%) |
Disability Class: Cognitive Difficulty
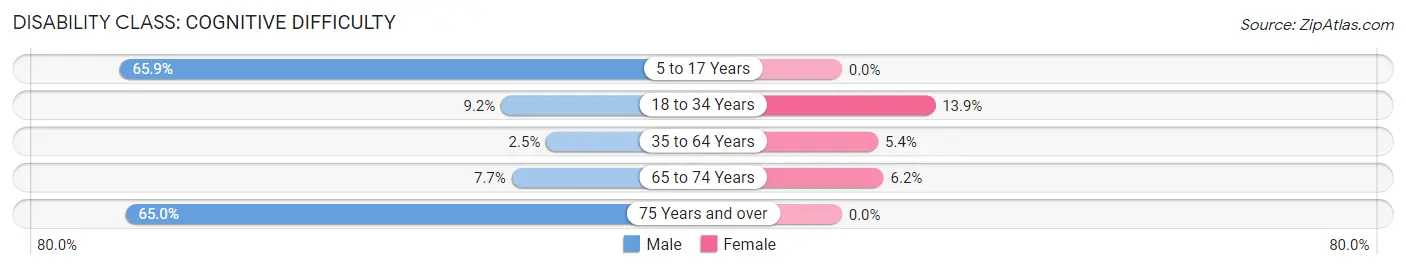
| Age Bracket | Male | Female |
| 5 to 17 Years | 201 (65.9%) | 0 (0.0%) |
| 18 to 34 Years | 40 (9.2%) | 77 (13.9%) |
| 35 to 64 Years | 10 (2.5%) | 30 (5.4%) |
| 65 to 74 Years | 7 (7.7%) | 10 (6.2%) |
| 75 Years and over | 117 (65.0%) | 0 (0.0%) |
Disability Class: Ambulatory Difficulty
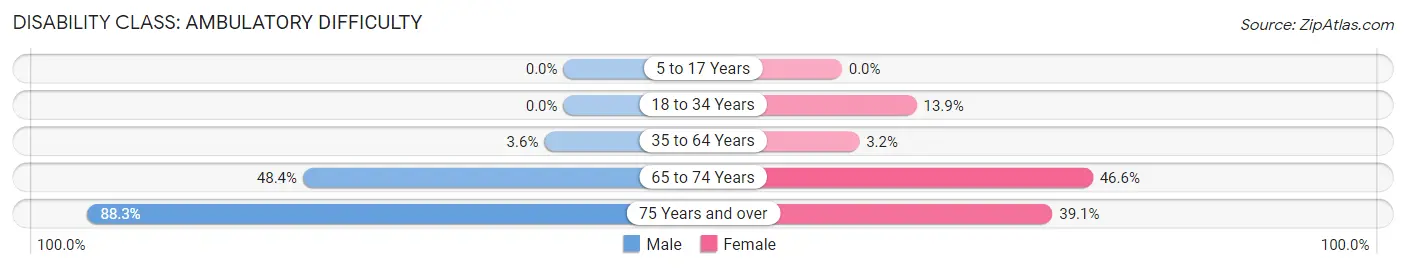
| Age Bracket | Male | Female |
| 5 to 17 Years | 0 (0.0%) | 0 (0.0%) |
| 18 to 34 Years | 0 (0.0%) | 77 (13.9%) |
| 35 to 64 Years | 14 (3.5%) | 18 (3.2%) |
| 65 to 74 Years | 44 (48.3%) | 75 (46.6%) |
| 75 Years and over | 159 (88.3%) | 59 (39.1%) |
Disability Class: Self-Care Difficulty
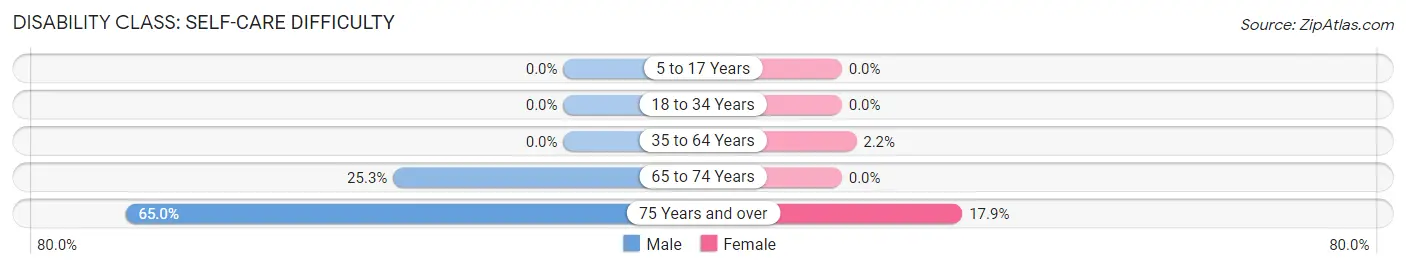
| Age Bracket | Male | Female |
| 5 to 17 Years | 0 (0.0%) | 0 (0.0%) |
| 18 to 34 Years | 0 (0.0%) | 0 (0.0%) |
| 35 to 64 Years | 0 (0.0%) | 12 (2.1%) |
| 65 to 74 Years | 23 (25.3%) | 0 (0.0%) |
| 75 Years and over | 117 (65.0%) | 27 (17.9%) |
Technology Access in Newbern
Computing Device Access in Newbern
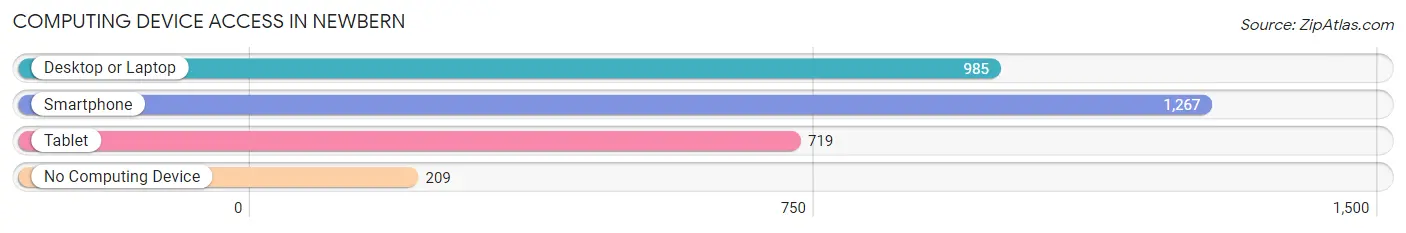
| Device Type | # Households | % Households |
| Desktop or Laptop | 985 | 65.0% |
| Smartphone | 1,267 | 83.6% |
| Tablet | 719 | 47.4% |
| No Computing Device | 209 | 13.8% |
| Total | 1,516 | 100.0% |
Internet Access in Newbern
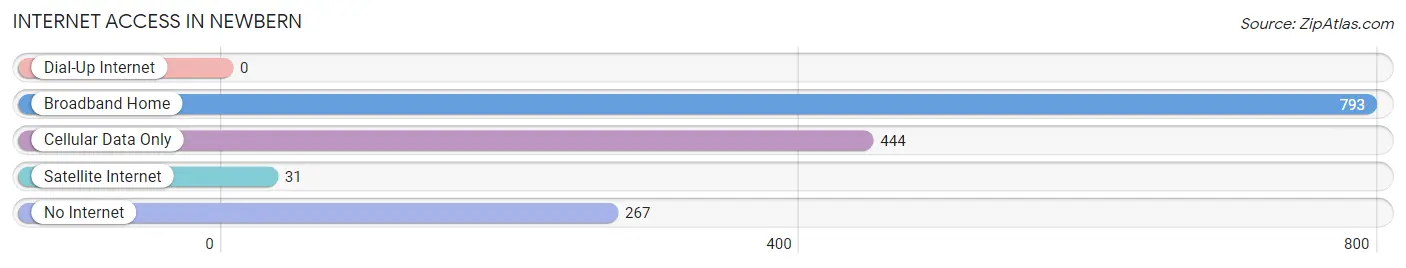
| Internet Type | # Households | % Households |
| Dial-Up Internet | 0 | 0.0% |
| Broadband Home | 793 | 52.3% |
| Cellular Data Only | 444 | 29.3% |
| Satellite Internet | 31 | 2.0% |
| No Internet | 267 | 17.6% |
| Total | 1,516 | 100.0% |
Newbern Summary
Newbern is a small town located in Dyer County, Tennessee. It is situated on the banks of the Forked Deer River, about halfway between Memphis and Nashville. The town was founded in 1823 and has a population of approximately 2,000 people.
History
Newbern was founded in 1823 by a group of settlers from North Carolina. The town was named after the North Carolina town of New Bern. The settlers were attracted to the area due to its fertile soil and abundant natural resources. The town quickly grew and by the mid-1800s, it was a thriving agricultural center.
The town was also a major stop on the Memphis and Ohio Railroad, which connected Memphis to Nashville. This allowed the town to become a major shipping center for the region. The railroad also helped to bring new businesses and industries to the area.
In the late 1800s, the town was home to several cotton mills and other industries. The town also had a thriving business district, with several stores, banks, and other businesses.
Geography
Newbern is located in the western part of Dyer County, Tennessee. It is situated on the banks of the Forked Deer River, about halfway between Memphis and Nashville. The town is surrounded by rolling hills and farmland. The climate is mild and humid, with hot summers and mild winters.
Economy
The economy of Newbern is largely based on agriculture. The town is home to several farms, which produce a variety of crops, including corn, soybeans, cotton, and wheat. The town also has several manufacturing plants, which produce a variety of products, including furniture, clothing, and automotive parts.
The town also has a thriving business district, with several stores, banks, and other businesses. The town is also home to several restaurants, bars, and other entertainment venues.
Demographics
As of the 2010 census, the population of Newbern was 2,000. The racial makeup of the town was 95.2% White, 2.2% African American, 0.2% Native American, 0.2% Asian, 0.2% from other races, and 1.9% from two or more races. Hispanic or Latino of any race were 1.2% of the population.
The median income for a household in Newbern was $35,000, and the median income for a family was $41,000. The per capita income for the town was $17,000. About 15.2% of families and 17.2% of the population were below the poverty line, including 25.2% of those under age 18 and 8.2% of those age 65 or over.
Common Questions
What is Per Capita Income in Newbern?
Per Capita income in Newbern is $24,084.
What is the Median Family Income in Newbern?
Median Family Income in Newbern is $56,423.
What is the Median Household income in Newbern?
Median Household Income in Newbern is $44,526.
What is Income or Wage Gap in Newbern?
Income or Wage Gap in Newbern is 27.3%.
Women in Newbern earn 72.7 cents for every dollar earned by a man.
What is Inequality or Gini Index in Newbern?
Inequality or Gini Index in Newbern is 0.38.
What is the Total Population of Newbern?
Total Population of Newbern is 3,321.
What is the Total Male Population of Newbern?
Total Male Population of Newbern is 1,554.
What is the Total Female Population of Newbern?
Total Female Population of Newbern is 1,767.
What is the Ratio of Males per 100 Females in Newbern?
There are 87.95 Males per 100 Females in Newbern.
What is the Ratio of Females per 100 Males in Newbern?
There are 113.71 Females per 100 Males in Newbern.
What is the Median Population Age in Newbern?
Median Population Age in Newbern is 33.3 Years.
What is the Average Family Size in Newbern
Average Family Size in Newbern is 3.1 People.
What is the Average Household Size in Newbern
Average Household Size in Newbern is 2.2 People.
How Large is the Labor Force in Newbern?
There are 1,399 People in the Labor Forcein in Newbern.
What is the Percentage of People in the Labor Force in Newbern?
55.0% of People are in the Labor Force in Newbern.
What is the Unemployment Rate in Newbern?
Unemployment Rate in Newbern is 2.7%.