Moscow, TN Map & Demographics
Moscow Map
Moscow Overview
$23,334
PER CAPITA INCOME
$48,333
AVG FAMILY INCOME
$45,938
AVG HOUSEHOLD INCOME
16.2%
WAGE / INCOME GAP [ % ]
83.8¢/ $1
WAGE / INCOME GAP [ $ ]
0.38
INEQUALITY / GINI INDEX
832
TOTAL POPULATION
367
MALE POPULATION
465
FEMALE POPULATION
78.92
MALES / 100 FEMALES
126.70
FEMALES / 100 MALES
35.4
MEDIAN AGE
3.8
AVG FAMILY SIZE
2.8
AVG HOUSEHOLD SIZE
422
LABOR FORCE [ PEOPLE ]
60.0%
PERCENT IN LABOR FORCE
9.7%
UNEMPLOYMENT RATE
Moscow Zip Codes
Moscow Area Codes
Income in Moscow
Income Overview in Moscow
Per Capita Income in Moscow is $23,334, while median incomes of families and households are $48,333 and $45,938 respectively.
| Characteristic | Number | Measure |
| Per Capita Income | 832 | $23,334 |
| Median Family Income | 150 | $48,333 |
| Mean Family Income | 150 | $62,245 |
| Median Household Income | 294 | $45,938 |
| Mean Household Income | 294 | $56,679 |
| Income Deficit | 150 | $0 |
| Wage / Income Gap (%) | 832 | 16.21% |
| Wage / Income Gap ($) | 832 | 83.79¢ per $1 |
| Gini / Inequality Index | 832 | 0.38 |
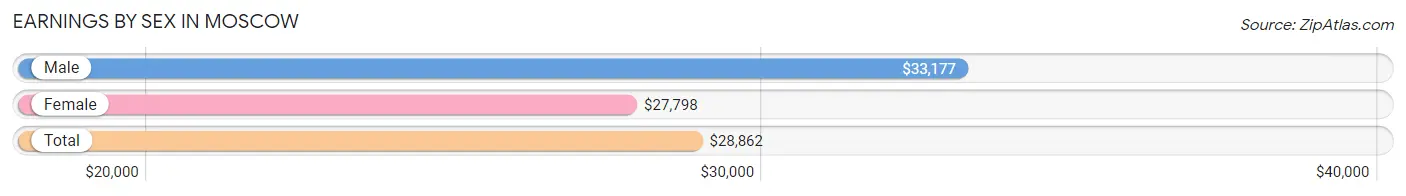
Earnings by Sex in Moscow
Average Earnings in Moscow are $28,862, $33,177 for men and $27,798 for women, a difference of 16.2%.
| Sex | Number | Average Earnings |
| Male | 203 (46.2%) | $33,177 |
| Female | 236 (53.8%) | $27,798 |
| Total | 439 (100.0%) | $28,862 |
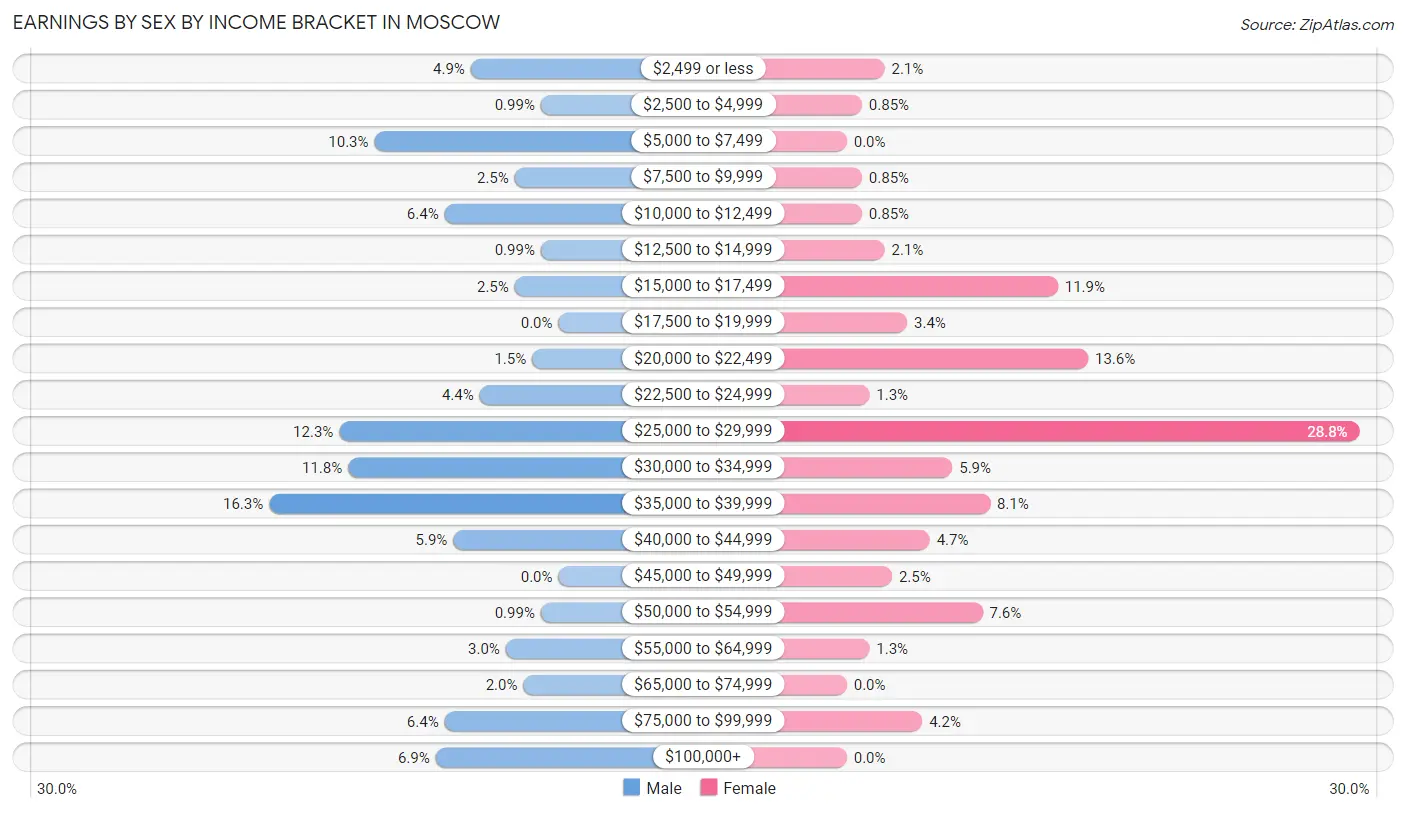
Earnings by Sex by Income Bracket in Moscow
The most common earnings brackets in Moscow are $35,000 to $39,999 for men (33 | 16.3%) and $25,000 to $29,999 for women (68 | 28.8%).
| Income | Male | Female |
| $2,499 or less | 10 (4.9%) | 5 (2.1%) |
| $2,500 to $4,999 | 2 (1.0%) | 2 (0.9%) |
| $5,000 to $7,499 | 21 (10.3%) | 0 (0.0%) |
| $7,500 to $9,999 | 5 (2.5%) | 2 (0.9%) |
| $10,000 to $12,499 | 13 (6.4%) | 2 (0.9%) |
| $12,500 to $14,999 | 2 (1.0%) | 5 (2.1%) |
| $15,000 to $17,499 | 5 (2.5%) | 28 (11.9%) |
| $17,500 to $19,999 | 0 (0.0%) | 8 (3.4%) |
| $20,000 to $22,499 | 3 (1.5%) | 32 (13.6%) |
| $22,500 to $24,999 | 9 (4.4%) | 3 (1.3%) |
| $25,000 to $29,999 | 25 (12.3%) | 68 (28.8%) |
| $30,000 to $34,999 | 24 (11.8%) | 14 (5.9%) |
| $35,000 to $39,999 | 33 (16.3%) | 19 (8.1%) |
| $40,000 to $44,999 | 12 (5.9%) | 11 (4.7%) |
| $45,000 to $49,999 | 0 (0.0%) | 6 (2.5%) |
| $50,000 to $54,999 | 2 (1.0%) | 18 (7.6%) |
| $55,000 to $64,999 | 6 (3.0%) | 3 (1.3%) |
| $65,000 to $74,999 | 4 (2.0%) | 0 (0.0%) |
| $75,000 to $99,999 | 13 (6.4%) | 10 (4.2%) |
| $100,000+ | 14 (6.9%) | 0 (0.0%) |
| Total | 203 (100.0%) | 236 (100.0%) |
Earnings by Sex by Educational Attainment in Moscow
Average earnings in Moscow are $34,271 for men and $27,813 for women, a difference of 18.8%. Men with an educational attainment of high school diploma enjoy the highest average annual earnings of $35,288, while those with college or associate's degree education earn the least with $29,706. Women with an educational attainment of college or associate's degree earn the most with the average annual earnings of $28,854, while those with bachelor's degree education have the smallest earnings of $27,019.
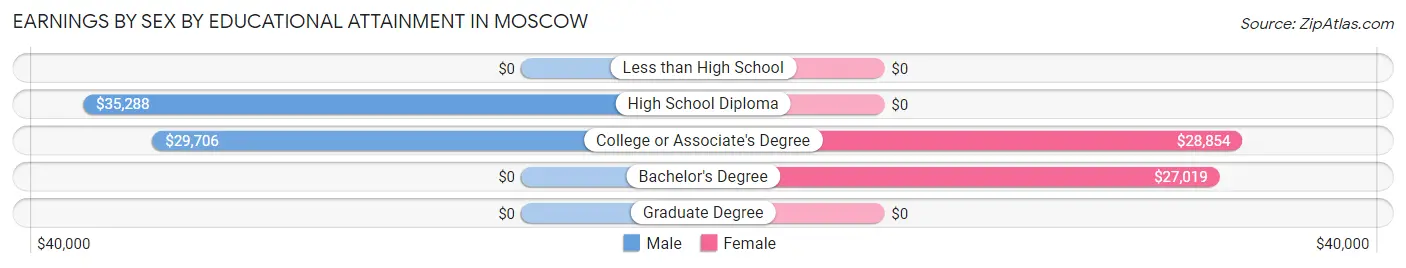
| Educational Attainment | Male Income | Female Income |
| Less than High School | - | - |
| High School Diploma | $35,288 | $0 |
| College or Associate's Degree | $29,706 | $28,854 |
| Bachelor's Degree | - | - |
| Graduate Degree | - | - |
| Total | $34,271 | $27,813 |
Family Income in Moscow
Family Income Brackets in Moscow
According to the Moscow family income data, there are 54 families falling into the $35,000 to $49,999 income range, which is the most common income bracket and makes up 36.0% of all families.
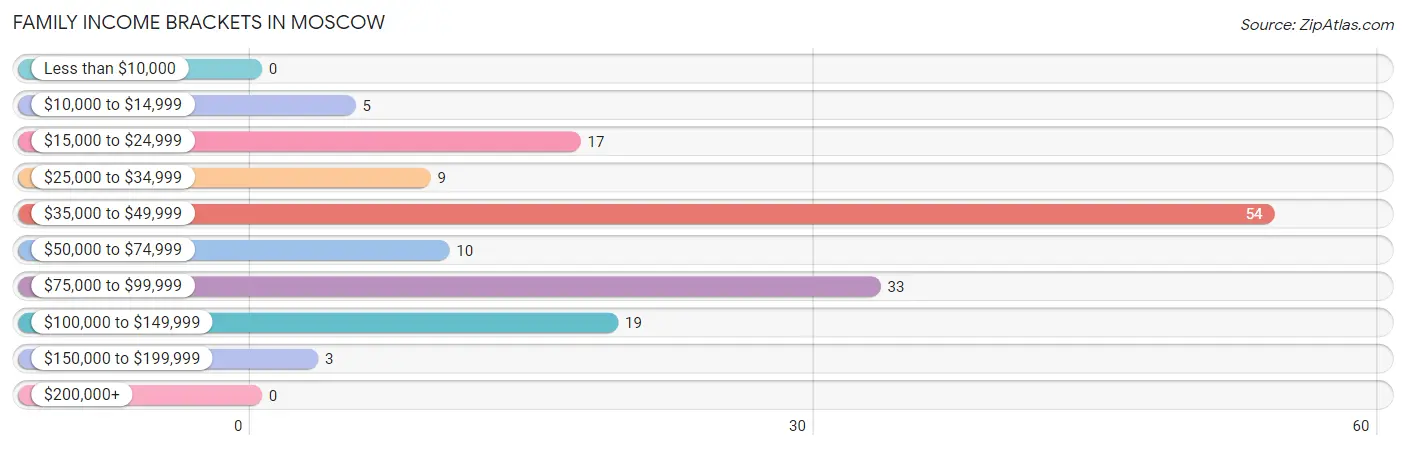
| Income Bracket | # Families | % Families |
| Less than $10,000 | 0 | 0.0% |
| $10,000 to $14,999 | 5 | 3.3% |
| $15,000 to $24,999 | 17 | 11.3% |
| $25,000 to $34,999 | 9 | 6.0% |
| $35,000 to $49,999 | 54 | 36.0% |
| $50,000 to $74,999 | 10 | 6.7% |
| $75,000 to $99,999 | 33 | 22.0% |
| $100,000 to $149,999 | 19 | 12.7% |
| $150,000 to $199,999 | 3 | 2.0% |
| $200,000+ | 0 | 0.0% |
Family Income by Famaliy Size in Moscow
4-person families (32 | 21.3%) account for the highest median family income in Moscow with $48,500 per family, while 4-person families (32 | 21.3%) have the highest median income of $12,125 per family member.
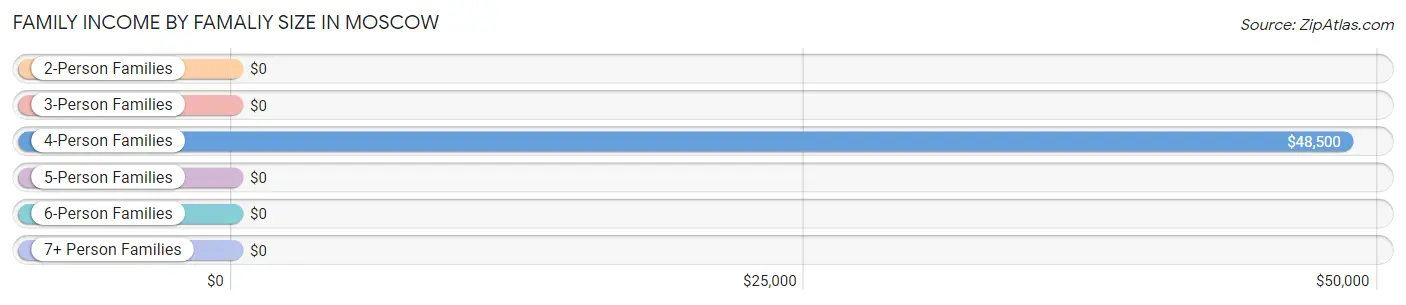
| Income Bracket | # Families | Median Income |
| 2-Person Families | 58 (38.7%) | $0 |
| 3-Person Families | 45 (30.0%) | $0 |
| 4-Person Families | 32 (21.3%) | $48,500 |
| 5-Person Families | 5 (3.3%) | $0 |
| 6-Person Families | 2 (1.3%) | $0 |
| 7+ Person Families | 8 (5.3%) | $0 |
| Total | 150 (100.0%) | $48,333 |
Family Income by Number of Earners in Moscow
The median family income in Moscow is $48,333, with families comprising 3+ earners (9) having the highest median family income of $138,750, while families with 1 earner (57) have the lowest median family income of $36,583, accounting for 6.0% and 38.0% of families, respectively.
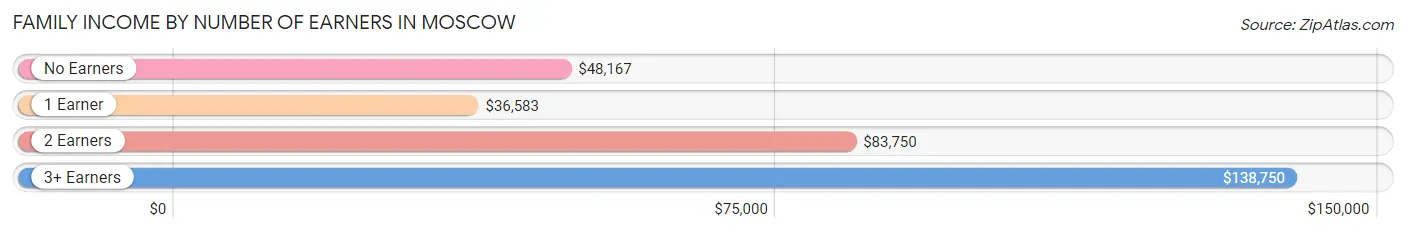
| Number of Earners | # Families | Median Income |
| No Earners | 22 (14.7%) | $48,167 |
| 1 Earner | 57 (38.0%) | $36,583 |
| 2 Earners | 62 (41.3%) | $83,750 |
| 3+ Earners | 9 (6.0%) | $138,750 |
| Total | 150 (100.0%) | $48,333 |
Household Income in Moscow
Household Income Brackets in Moscow
With 96 households falling in the category, the $35,000 to $49,999 income range is the most frequent in Moscow, accounting for 32.7% of all households.
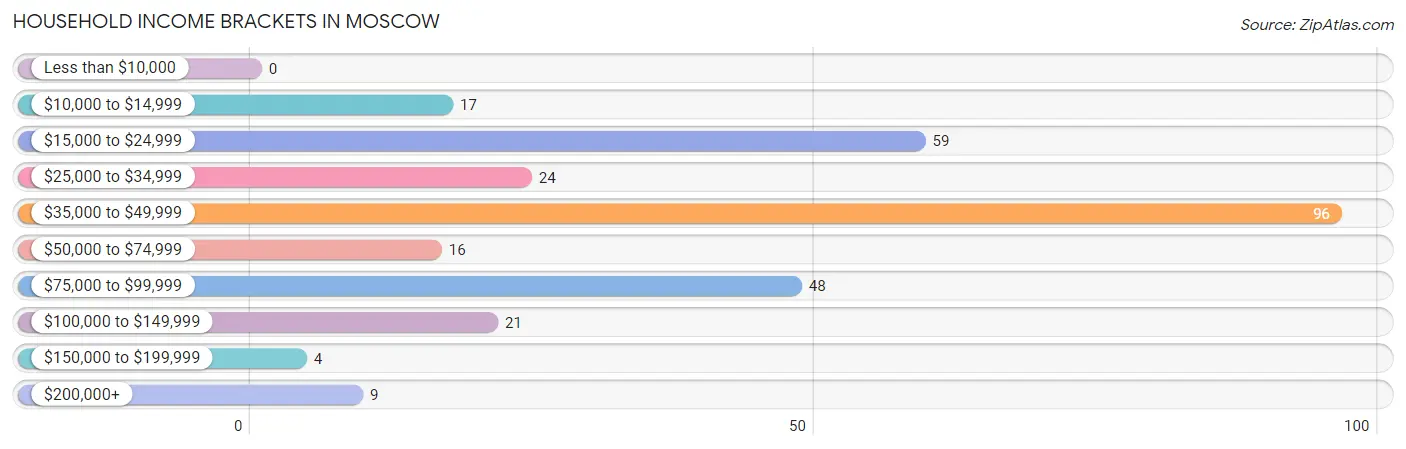
| Income Bracket | # Households | % Households |
| Less than $10,000 | 0 | 0.0% |
| $10,000 to $14,999 | 17 | 5.8% |
| $15,000 to $24,999 | 59 | 20.1% |
| $25,000 to $34,999 | 24 | 8.2% |
| $35,000 to $49,999 | 96 | 32.7% |
| $50,000 to $74,999 | 16 | 5.4% |
| $75,000 to $99,999 | 48 | 16.3% |
| $100,000 to $149,999 | 21 | 7.1% |
| $150,000 to $199,999 | 4 | 1.4% |
| $200,000+ | 9 | 3.1% |
Household Income by Householder Age in Moscow
The median household income in Moscow is $45,938, with the highest median household income of $48,664 found in the 45 to 64 years age bracket for the primary householder. A total of 85 households (28.9%) fall into this category. Meanwhile, the 15 to 24 years age bracket for the primary householder has the lowest median household income of $0, with 2 households (0.7%) in this group.
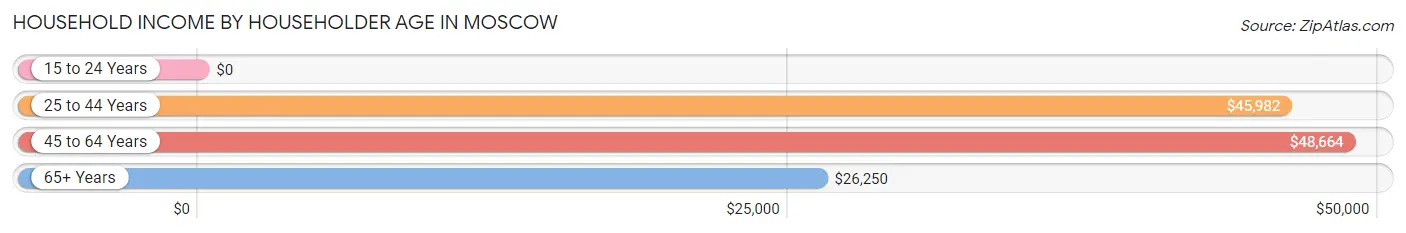
| Income Bracket | # Households | Median Income |
| 15 to 24 Years | 2 (0.7%) | $0 |
| 25 to 44 Years | 136 (46.3%) | $45,982 |
| 45 to 64 Years | 85 (28.9%) | $48,664 |
| 65+ Years | 71 (24.1%) | $26,250 |
| Total | 294 (100.0%) | $45,938 |
Poverty in Moscow
Income Below Poverty by Sex and Age in Moscow
With 22.3% poverty level for males and 14.4% for females among the residents of Moscow, 15 year old males and 16 and 17 year old females are the most vulnerable to poverty, with 6 males (100.0%) and 4 females (100.0%) in their respective age groups living below the poverty level.
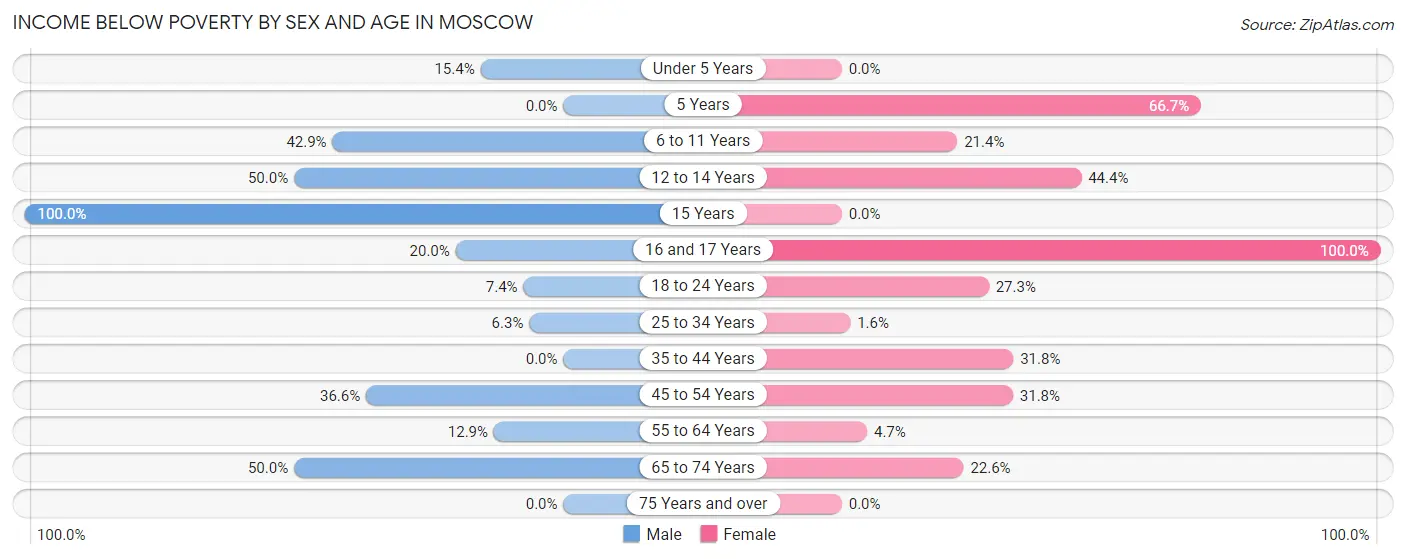
| Age Bracket | Male | Female |
| Under 5 Years | 2 (15.4%) | 0 (0.0%) |
| 5 Years | 0 (0.0%) | 4 (66.7%) |
| 6 to 11 Years | 15 (42.9%) | 3 (21.4%) |
| 12 to 14 Years | 9 (50.0%) | 4 (44.4%) |
| 15 Years | 6 (100.0%) | 0 (0.0%) |
| 16 and 17 Years | 4 (20.0%) | 4 (100.0%) |
| 18 to 24 Years | 2 (7.4%) | 6 (27.3%) |
| 25 to 34 Years | 5 (6.3%) | 2 (1.6%) |
| 35 to 44 Years | 0 (0.0%) | 14 (31.8%) |
| 45 to 54 Years | 26 (36.6%) | 20 (31.8%) |
| 55 to 64 Years | 4 (12.9%) | 3 (4.7%) |
| 65 to 74 Years | 9 (50.0%) | 7 (22.6%) |
| 75 Years and over | 0 (0.0%) | 0 (0.0%) |
| Total | 82 (22.3%) | 67 (14.4%) |
Income Above Poverty by Sex and Age in Moscow
According to the poverty statistics in Moscow, males aged 5 years and females aged under 5 years are the age groups that are most secure financially, with 100.0% of males and 100.0% of females in these age groups living above the poverty line.
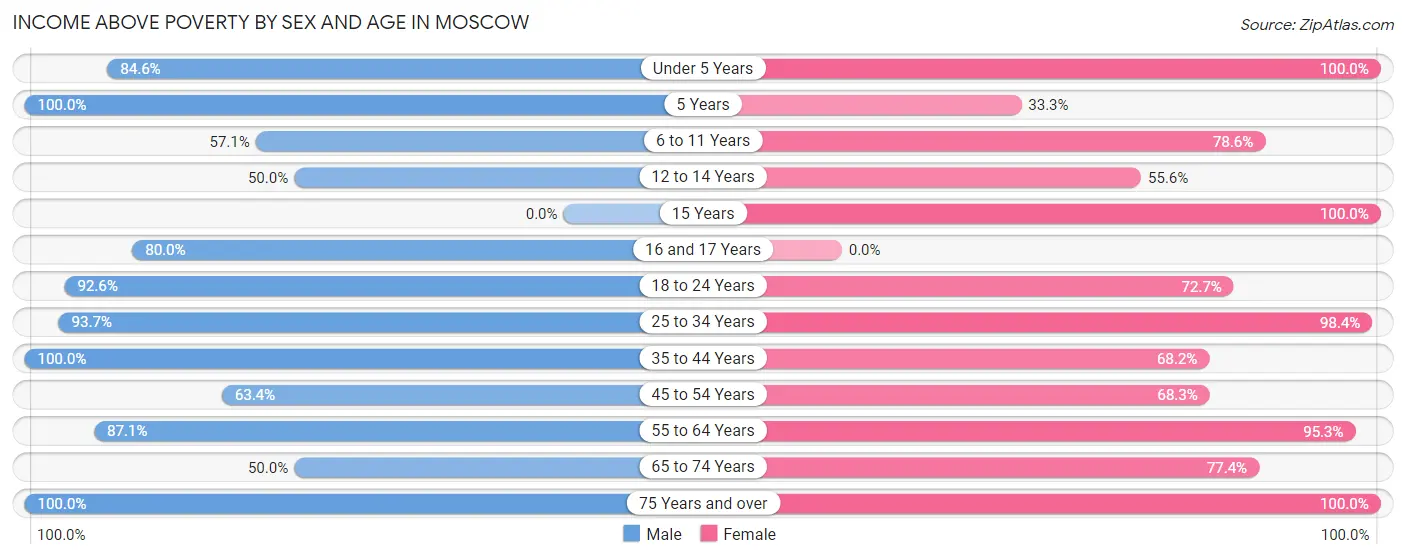
| Age Bracket | Male | Female |
| Under 5 Years | 11 (84.6%) | 23 (100.0%) |
| 5 Years | 2 (100.0%) | 2 (33.3%) |
| 6 to 11 Years | 20 (57.1%) | 11 (78.6%) |
| 12 to 14 Years | 9 (50.0%) | 5 (55.6%) |
| 15 Years | 0 (0.0%) | 3 (100.0%) |
| 16 and 17 Years | 16 (80.0%) | 0 (0.0%) |
| 18 to 24 Years | 25 (92.6%) | 16 (72.7%) |
| 25 to 34 Years | 74 (93.7%) | 126 (98.4%) |
| 35 to 44 Years | 41 (100.0%) | 30 (68.2%) |
| 45 to 54 Years | 45 (63.4%) | 43 (68.2%) |
| 55 to 64 Years | 27 (87.1%) | 61 (95.3%) |
| 65 to 74 Years | 9 (50.0%) | 24 (77.4%) |
| 75 Years and over | 6 (100.0%) | 54 (100.0%) |
| Total | 285 (77.7%) | 398 (85.6%) |
Income Below Poverty Among Married-Couple Families in Moscow
The poverty statistics for married-couple families in Moscow show that 1.3% or 1 of the total 75 families live below the poverty line. Families with no children have the highest poverty rate of 2.9%, comprising of 1 families. On the other hand, families with 1 or 2 children have the lowest poverty rate of 0.0%, which includes 0 families.
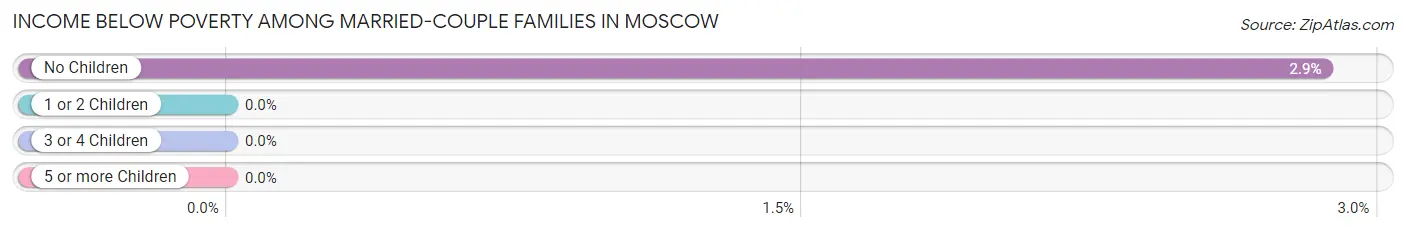
| Children | Above Poverty | Below Poverty |
| No Children | 34 (97.1%) | 1 (2.9%) |
| 1 or 2 Children | 40 (100.0%) | 0 (0.0%) |
| 3 or 4 Children | 0 (0.0%) | 0 (0.0%) |
| 5 or more Children | 0 (0.0%) | 0 (0.0%) |
| Total | 74 (98.7%) | 1 (1.3%) |
Income Below Poverty Among Single-Parent Households in Moscow
According to the poverty data in Moscow, 38.9% or 7 single-father households and 24.6% or 14 single-mother households are living below the poverty line. Among single-father households, those with 5 or more children have the highest poverty rate, with 5 households (100.0%) experiencing poverty. Likewise, among single-mother households, those with 3 or 4 children have the highest poverty rate, with 2 households (50.0%) falling below the poverty line.
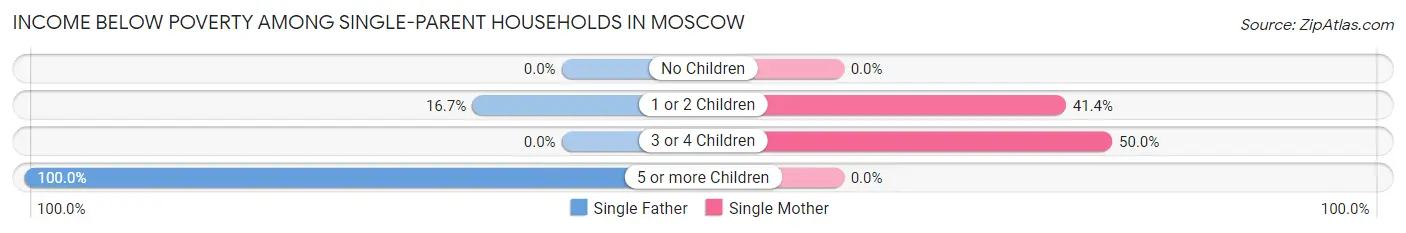
| Children | Single Father | Single Mother |
| No Children | 0 (0.0%) | 0 (0.0%) |
| 1 or 2 Children | 2 (16.7%) | 12 (41.4%) |
| 3 or 4 Children | 0 (0.0%) | 2 (50.0%) |
| 5 or more Children | 5 (100.0%) | 0 (0.0%) |
| Total | 7 (38.9%) | 14 (24.6%) |
Income Below Poverty Among Married-Couple vs Single-Parent Households in Moscow
The poverty data for Moscow shows that 1 of the married-couple family households (1.3%) and 21 of the single-parent households (28.0%) are living below the poverty level. Within the married-couple family households, those with no children have the highest poverty rate, with 1 households (2.9%) falling below the poverty line. Among the single-parent households, those with 5 or more children have the highest poverty rate, with 5 household (100.0%) living below poverty.
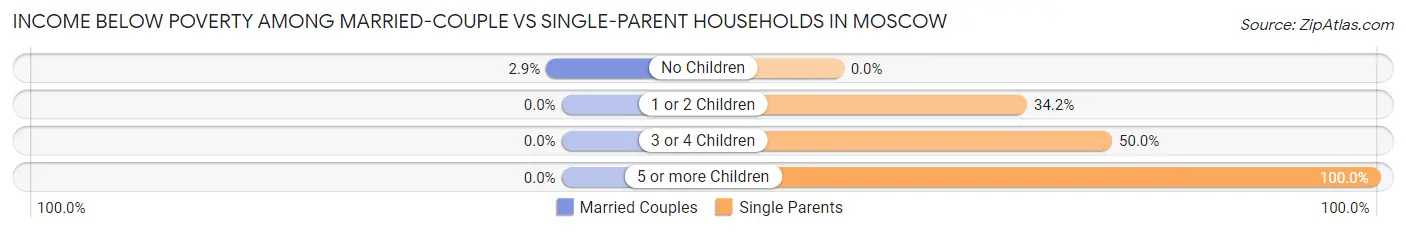
| Children | Married-Couple Families | Single-Parent Households |
| No Children | 1 (2.9%) | 0 (0.0%) |
| 1 or 2 Children | 0 (0.0%) | 14 (34.2%) |
| 3 or 4 Children | 0 (0.0%) | 2 (50.0%) |
| 5 or more Children | 0 (0.0%) | 5 (100.0%) |
| Total | 1 (1.3%) | 21 (28.0%) |
Race in Moscow
The most populous races in Moscow are Black / African American (485 | 58.3%), White / Caucasian (321 | 38.6%), and Hispanic or Latino (33 | 4.0%).
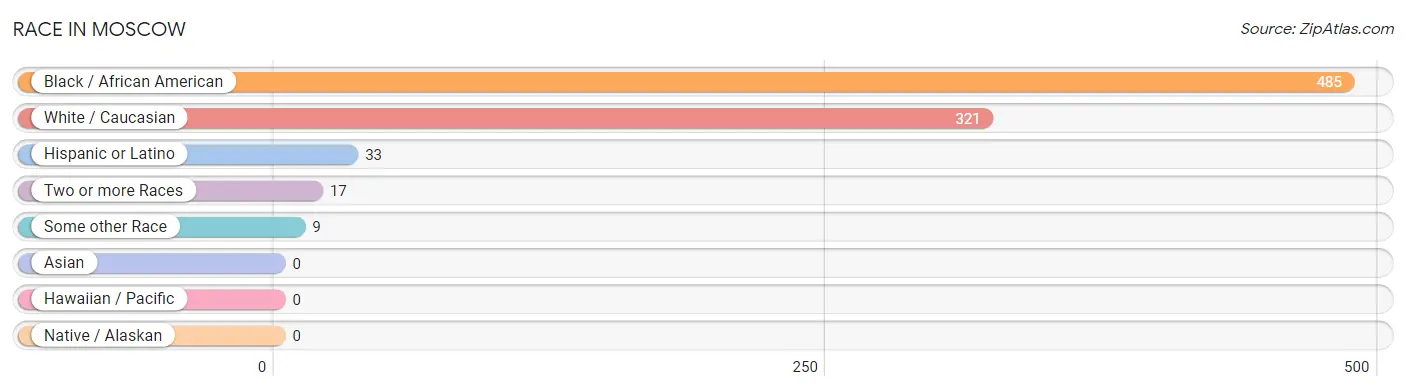
| Race | # Population | % Population |
| Asian | 0 | 0.0% |
| Black / African American | 485 | 58.3% |
| Hawaiian / Pacific | 0 | 0.0% |
| Hispanic or Latino | 33 | 4.0% |
| Native / Alaskan | 0 | 0.0% |
| White / Caucasian | 321 | 38.6% |
| Two or more Races | 17 | 2.0% |
| Some other Race | 9 | 1.1% |
| Total | 832 | 100.0% |
Ancestry in Moscow
The most populous ancestries reported in Moscow are German (45 | 5.4%), Puerto Rican (29 | 3.5%), American (28 | 3.4%), English (23 | 2.8%), and Italian (20 | 2.4%), together accounting for 17.4% of all Moscow residents.
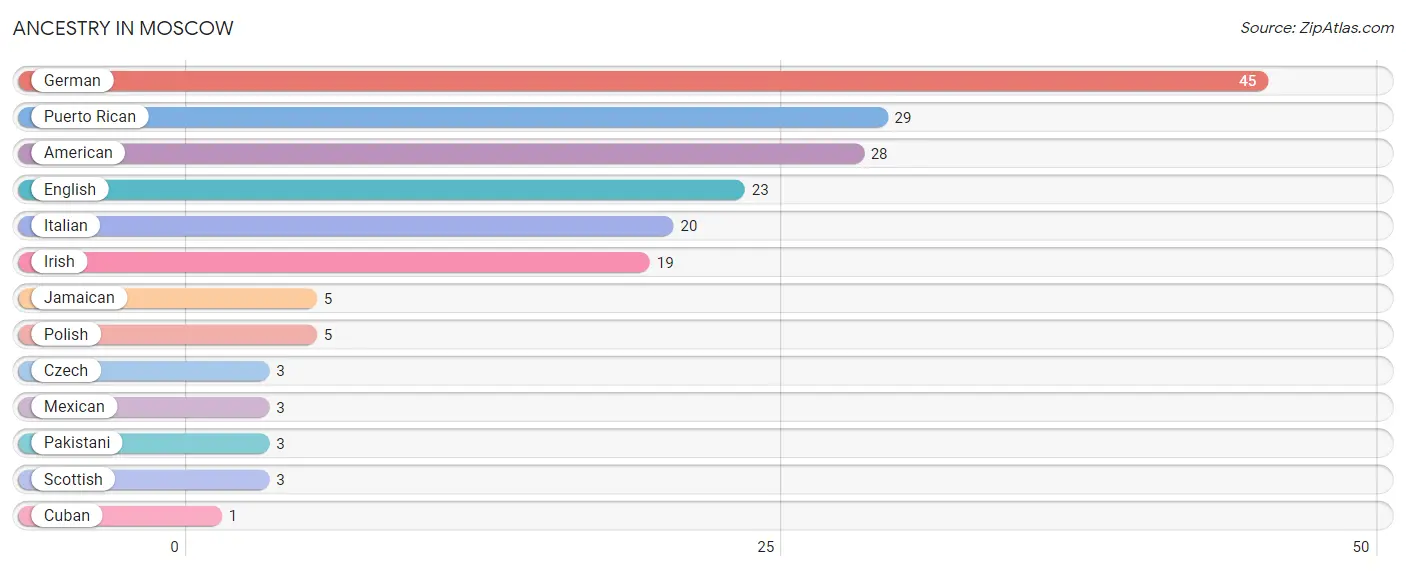
| Ancestry | # Population | % Population |
| American | 28 | 3.4% |
| Cuban | 1 | 0.1% |
| Czech | 3 | 0.4% |
| English | 23 | 2.8% |
| German | 45 | 5.4% |
| Irish | 19 | 2.3% |
| Italian | 20 | 2.4% |
| Jamaican | 5 | 0.6% |
| Mexican | 3 | 0.4% |
| Pakistani | 3 | 0.4% |
| Polish | 5 | 0.6% |
| Puerto Rican | 29 | 3.5% |
| Scottish | 3 | 0.4% | View All 13 Rows |
Immigrants in Moscow

| Immigration Origin | # Population | % Population | View All 0 Rows |
Sex and Age in Moscow
Sex and Age in Moscow
The most populous age groups in Moscow are 45 to 49 Years (68 | 18.5%) for men and 25 to 29 Years (95 | 20.4%) for women.
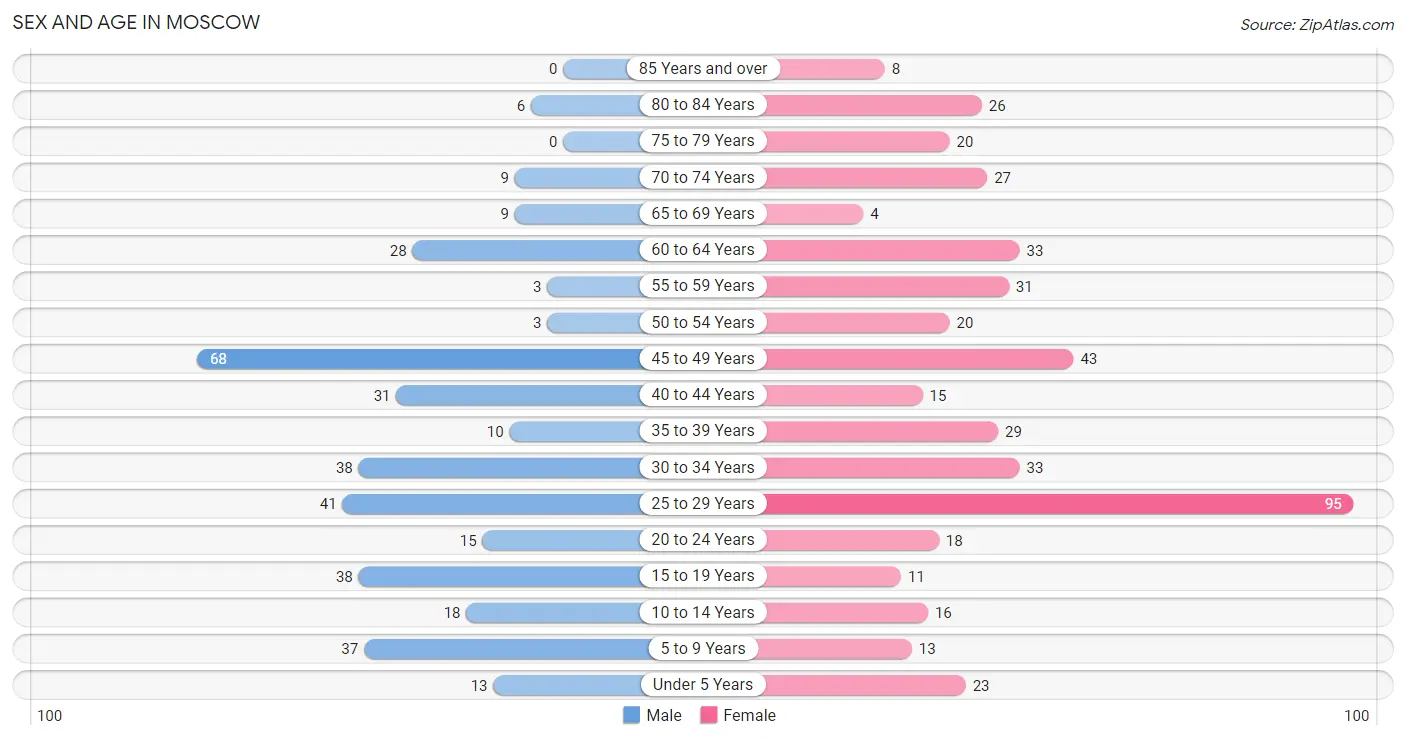
| Age Bracket | Male | Female |
| Under 5 Years | 13 (3.5%) | 23 (5.0%) |
| 5 to 9 Years | 37 (10.1%) | 13 (2.8%) |
| 10 to 14 Years | 18 (4.9%) | 16 (3.4%) |
| 15 to 19 Years | 38 (10.3%) | 11 (2.4%) |
| 20 to 24 Years | 15 (4.1%) | 18 (3.9%) |
| 25 to 29 Years | 41 (11.2%) | 95 (20.4%) |
| 30 to 34 Years | 38 (10.3%) | 33 (7.1%) |
| 35 to 39 Years | 10 (2.7%) | 29 (6.2%) |
| 40 to 44 Years | 31 (8.5%) | 15 (3.2%) |
| 45 to 49 Years | 68 (18.5%) | 43 (9.2%) |
| 50 to 54 Years | 3 (0.8%) | 20 (4.3%) |
| 55 to 59 Years | 3 (0.8%) | 31 (6.7%) |
| 60 to 64 Years | 28 (7.6%) | 33 (7.1%) |
| 65 to 69 Years | 9 (2.5%) | 4 (0.9%) |
| 70 to 74 Years | 9 (2.5%) | 27 (5.8%) |
| 75 to 79 Years | 0 (0.0%) | 20 (4.3%) |
| 80 to 84 Years | 6 (1.6%) | 26 (5.6%) |
| 85 Years and over | 0 (0.0%) | 8 (1.7%) |
| Total | 367 (100.0%) | 465 (100.0%) |
Families and Households in Moscow
Median Family Size in Moscow
The median family size in Moscow is 3.75 persons per family, with married-couple families (75 | 50.0%) accounting for the largest median family size of 4.31 persons per family. On the other hand, single female/mother families (57 | 38.0%) represent the smallest median family size with 3.14 persons per family.
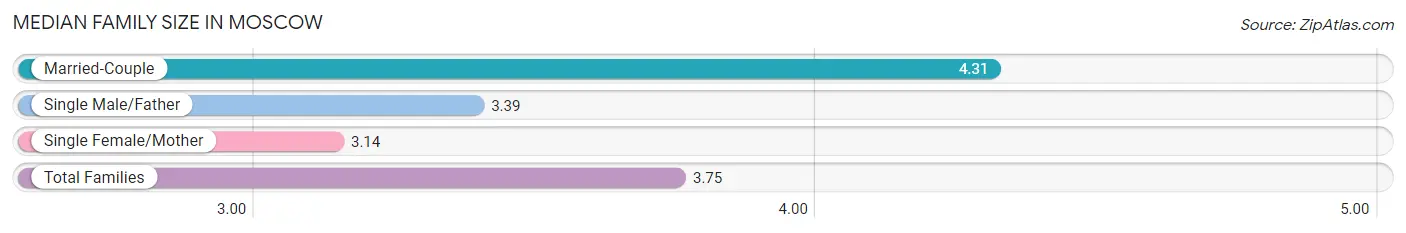
| Family Type | # Families | Family Size |
| Married-Couple | 75 (50.0%) | 4.31 |
| Single Male/Father | 18 (12.0%) | 3.39 |
| Single Female/Mother | 57 (38.0%) | 3.14 |
| Total Families | 150 (100.0%) | 3.75 |
Median Household Size in Moscow
The median household size in Moscow is 2.83 persons per household, with married-couple households (75 | 25.5%) accounting for the largest median household size of 4.75 persons per household. non-family households (144 | 49.0%) represent the smallest median household size with 1.49 persons per household.
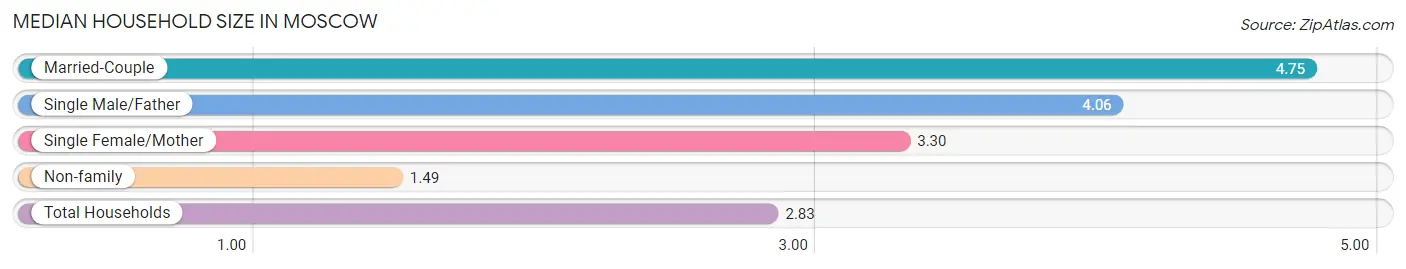
| Household Type | # Households | Household Size |
| Married-Couple | 75 (25.5%) | 4.75 |
| Single Male/Father | 18 (6.1%) | 4.06 |
| Single Female/Mother | 57 (19.4%) | 3.30 |
| Non-family | 144 (49.0%) | 1.49 |
| Total Households | 294 (100.0%) | 2.83 |
Household Size by Marriage Status in Moscow
Out of a total of 294 households in Moscow, 150 (51.0%) are family households, while 144 (49.0%) are nonfamily households. The most numerous type of family households are 3-person households, comprising 56, and the most common type of nonfamily households are 1-person households, comprising 99.
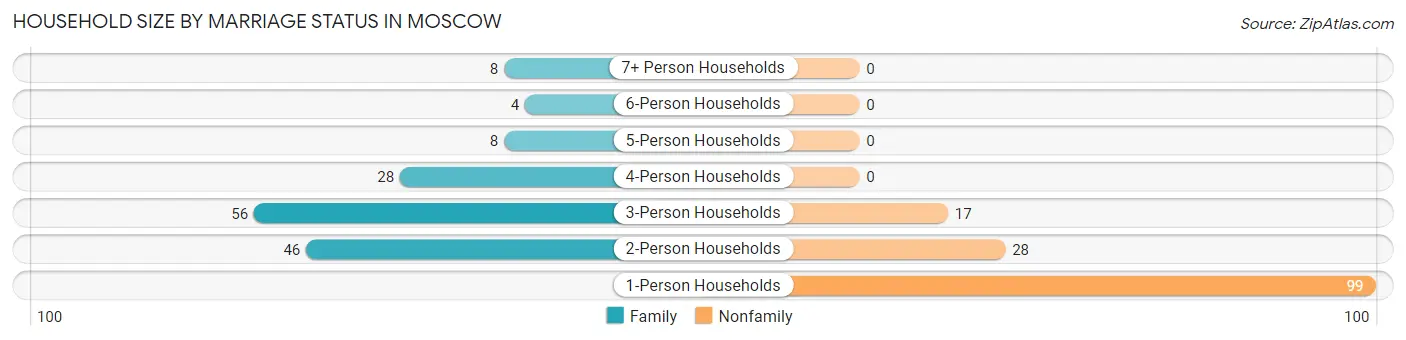
| Household Size | Family Households | Nonfamily Households |
| 1-Person Households | - | 99 (33.7%) |
| 2-Person Households | 46 (15.7%) | 28 (9.5%) |
| 3-Person Households | 56 (19.1%) | 17 (5.8%) |
| 4-Person Households | 28 (9.5%) | 0 (0.0%) |
| 5-Person Households | 8 (2.7%) | 0 (0.0%) |
| 6-Person Households | 4 (1.4%) | 0 (0.0%) |
| 7+ Person Households | 8 (2.7%) | 0 (0.0%) |
| Total | 150 (51.0%) | 144 (49.0%) |
Female Fertility in Moscow
Fertility by Age in Moscow
Average fertility rate in Moscow is 53.0 births per 1,000 women. Women in the age bracket of 20 to 34 years have the highest fertility rate with 68.0 births per 1,000 women. Women in the age bracket of 20 to 34 years acount for 76.9% of all women with births.
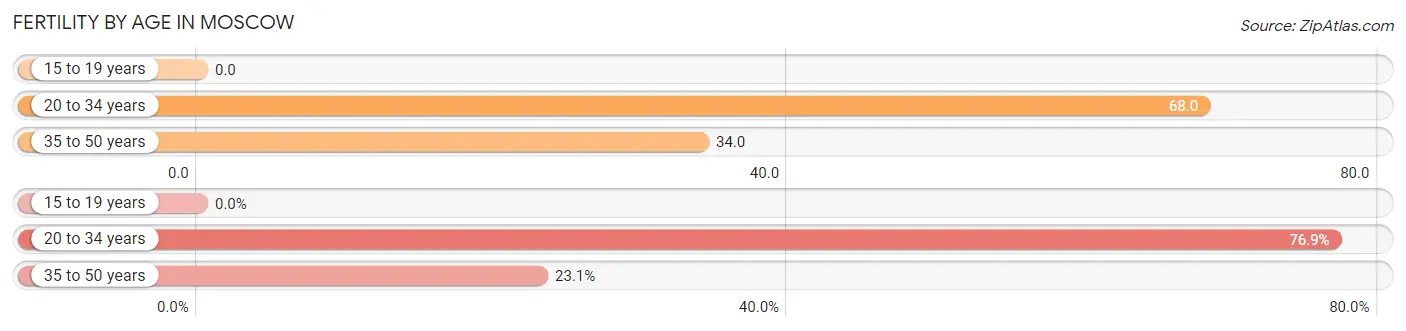
| Age Bracket | Women with Births | Births / 1,000 Women |
| 15 to 19 years | 0 (0.0%) | 0.0 |
| 20 to 34 years | 10 (76.9%) | 68.0 |
| 35 to 50 years | 3 (23.1%) | 34.0 |
| Total | 13 (100.0%) | 53.0 |
Fertility by Age by Marriage Status in Moscow
61.5% of women with births (13) in Moscow are married. The highest percentage of unmarried women with births falls into 35 to 50 years age bracket with 100.0% of them unmarried at the time of birth, while the lowest percentage of unmarried women with births belong to 20 to 34 years age bracket with 20.0% of them unmarried.
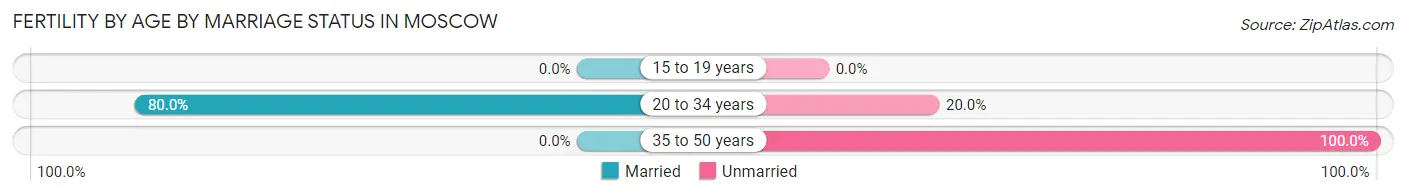
| Age Bracket | Married | Unmarried |
| 15 to 19 years | 0 (0.0%) | 0 (0.0%) |
| 20 to 34 years | 8 (80.0%) | 2 (20.0%) |
| 35 to 50 years | 0 (0.0%) | 3 (100.0%) |
| Total | 8 (61.5%) | 5 (38.5%) |
Fertility by Education in Moscow
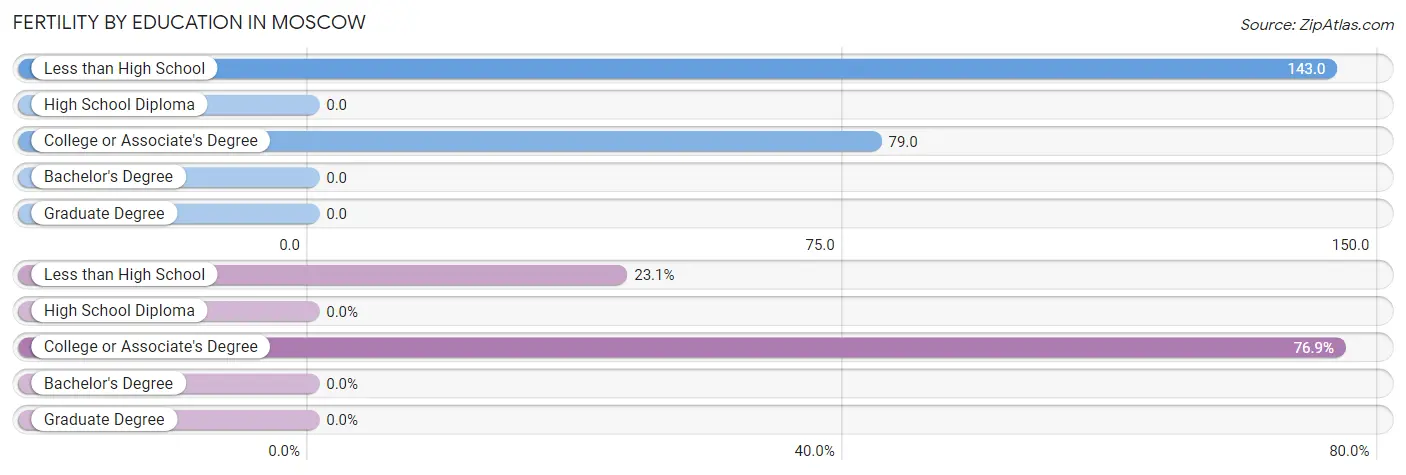
| Educational Attainment | Women with Births | Births / 1,000 Women |
| Less than High School | 3 (23.1%) | 143.0 |
| High School Diploma | 0 (0.0%) | 0.0 |
| College or Associate's Degree | 10 (76.9%) | 79.0 |
| Bachelor's Degree | 0 (0.0%) | 0.0 |
| Graduate Degree | 0 (0.0%) | 0.0 |
| Total | 13 (100.0%) | 53.0 |
Fertility by Education by Marriage Status in Moscow
38.5% of women with births in Moscow are unmarried. Women with the educational attainment of college or associate's degree are most likely to be married with 80.0% of them married at childbirth, while women with the educational attainment of less than high school are least likely to be married with 100.0% of them unmarried at childbirth.
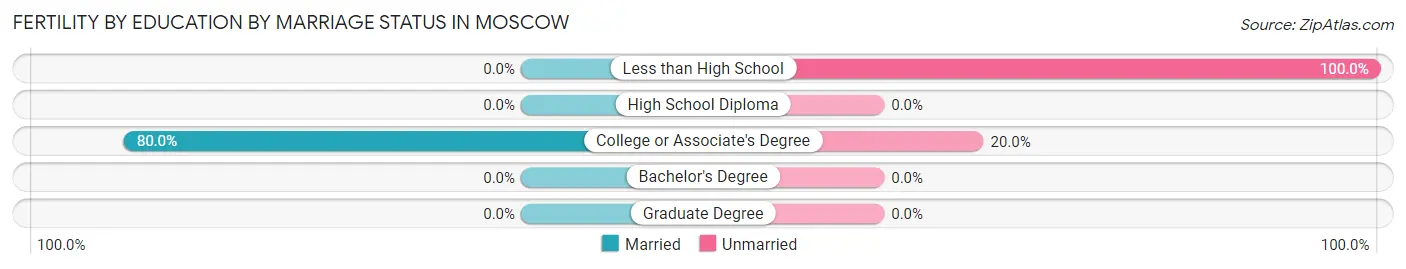
| Educational Attainment | Married | Unmarried |
| Less than High School | 0 (0.0%) | 3 (100.0%) |
| High School Diploma | 0 (0.0%) | 0 (0.0%) |
| College or Associate's Degree | 8 (80.0%) | 2 (20.0%) |
| Bachelor's Degree | 0 (0.0%) | 0 (0.0%) |
| Graduate Degree | 0 (0.0%) | 0 (0.0%) |
| Total | 8 (61.5%) | 5 (38.5%) |
Employment Characteristics in Moscow
Employment by Class of Employer in Moscow
Among the 360 employed individuals in Moscow, private company employees (285 | 79.2%), local government employees (51 | 14.2%), and not-for-profit organizations (13 | 3.6%) make up the most common classes of employment.
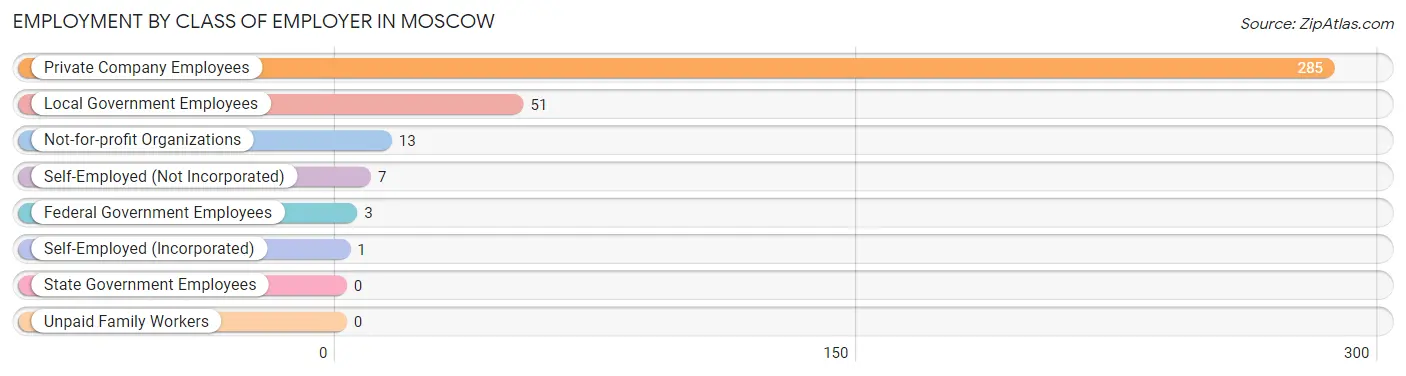
| Employer Class | # Employees | % Employees |
| Private Company Employees | 285 | 79.2% |
| Self-Employed (Incorporated) | 1 | 0.3% |
| Self-Employed (Not Incorporated) | 7 | 1.9% |
| Not-for-profit Organizations | 13 | 3.6% |
| Local Government Employees | 51 | 14.2% |
| State Government Employees | 0 | 0.0% |
| Federal Government Employees | 3 | 0.8% |
| Unpaid Family Workers | 0 | 0.0% |
| Total | 360 | 100.0% |
Employment Status by Age in Moscow
According to the labor force statistics for Moscow, out of the total population over 16 years of age (703), 60.0% or 422 individuals are in the labor force, with 9.7% or 41 of them unemployed. The age group with the highest labor force participation rate is 30 to 34 years, with 100.0% or 71 individuals in the labor force. Within the labor force, the 16 to 19 years age range has the highest percentage of unemployed individuals, with 50.0% or 4 of them being unemployed.
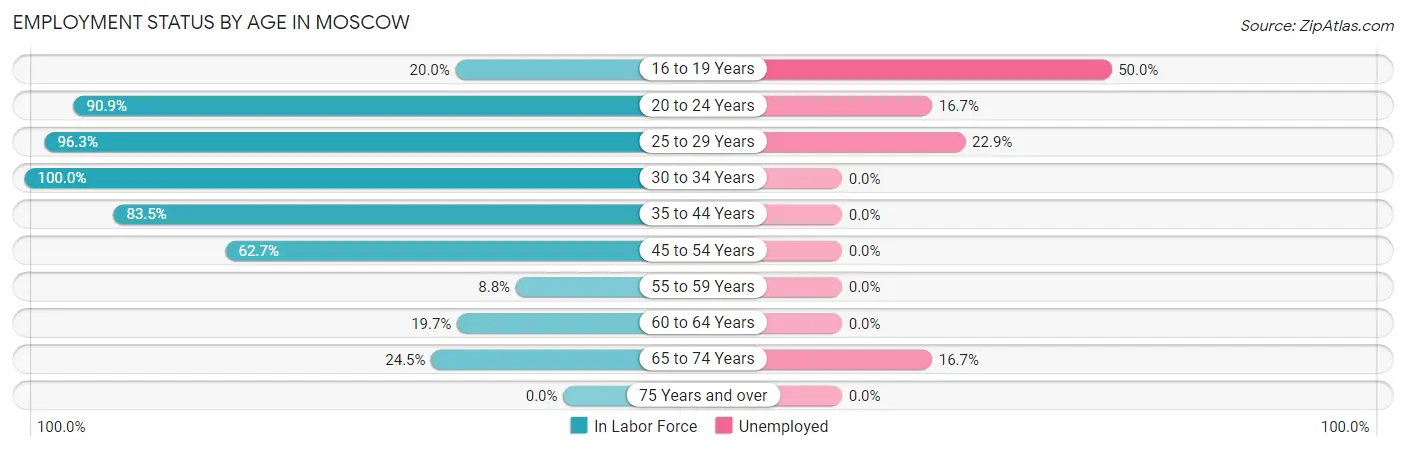
| Age Bracket | In Labor Force | Unemployed |
| 16 to 19 Years | 8 (20.0%) | 4 (50.0%) |
| 20 to 24 Years | 30 (90.9%) | 5 (16.7%) |
| 25 to 29 Years | 131 (96.3%) | 30 (22.9%) |
| 30 to 34 Years | 71 (100.0%) | 0 (0.0%) |
| 35 to 44 Years | 71 (83.5%) | 0 (0.0%) |
| 45 to 54 Years | 84 (62.7%) | 0 (0.0%) |
| 55 to 59 Years | 3 (8.8%) | 0 (0.0%) |
| 60 to 64 Years | 12 (19.7%) | 0 (0.0%) |
| 65 to 74 Years | 12 (24.5%) | 2 (16.7%) |
| 75 Years and over | 0 (0.0%) | 0 (0.0%) |
| Total | 422 (60.0%) | 41 (9.7%) |
Employment Status by Educational Attainment in Moscow
According to labor force statistics for Moscow, 71.4% of individuals (372) out of the total population between 25 and 64 years of age (521) are in the labor force, with 8.1% or 30 of them being unemployed. The group with the highest labor force participation rate are those with the educational attainment of college / associate degree, with 97.4% or 150 individuals in the labor force. Within the labor force, individuals with college / associate degree education have the highest percentage of unemployment, with 20.0% or 30 of them being unemployed.
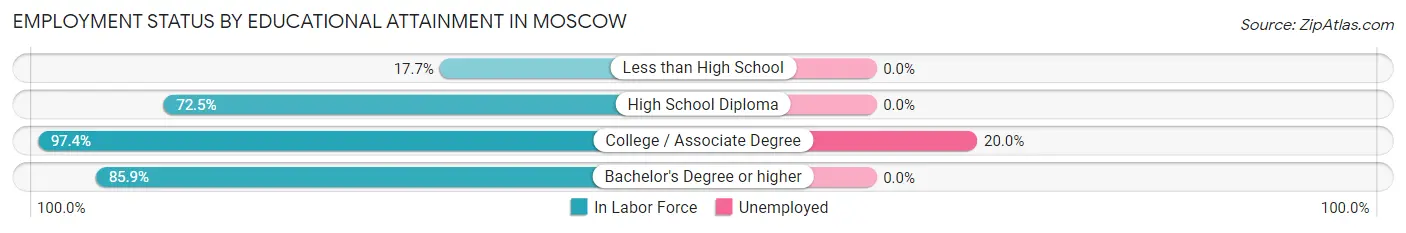
| Educational Attainment | In Labor Force | Unemployed |
| Less than High School | 17 (17.7%) | 0 (0.0%) |
| High School Diploma | 150 (72.5%) | 0 (0.0%) |
| College / Associate Degree | 150 (97.4%) | 31 (20.0%) |
| Bachelor's Degree or higher | 55 (85.9%) | 0 (0.0%) |
| Total | 372 (71.4%) | 42 (8.1%) |
Employment Occupations by Sex in Moscow
Management, Business, Science and Arts Occupations
The most common Management, Business, Science and Arts occupations in Moscow are Community & Social Service (42 | 11.0%), Education Instruction & Library (42 | 11.0%), Health Diagnosing & Treating (21 | 5.5%), Health Technologists (19 | 5.0%), and Management (5 | 1.3%).
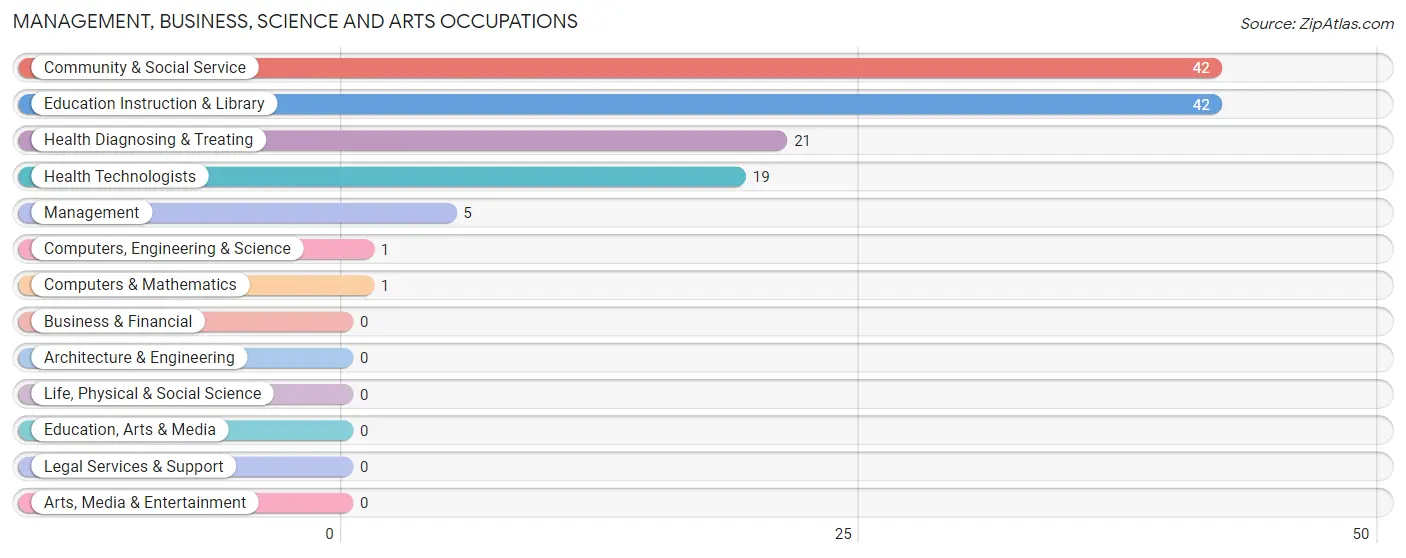
Management, Business, Science and Arts Occupations by Sex
Within the Management, Business, Science and Arts occupations in Moscow, the most male-oriented occupations are Management (100.0%), Computers, Engineering & Science (100.0%), and Computers & Mathematics (100.0%), while the most female-oriented occupations are Community & Social Service (69.1%), Education Instruction & Library (69.1%), and Health Diagnosing & Treating (57.1%).
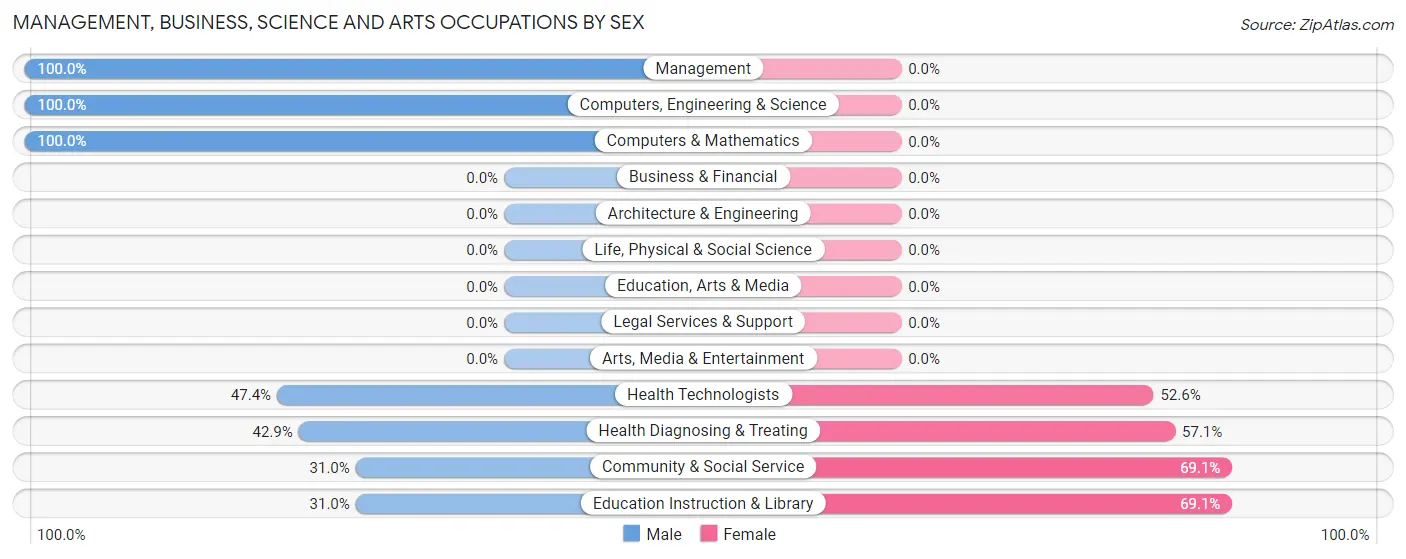
| Occupation | Male | Female |
| Management | 5 (100.0%) | 0 (0.0%) |
| Business & Financial | 0 (0.0%) | 0 (0.0%) |
| Computers, Engineering & Science | 1 (100.0%) | 0 (0.0%) |
| Computers & Mathematics | 1 (100.0%) | 0 (0.0%) |
| Architecture & Engineering | 0 (0.0%) | 0 (0.0%) |
| Life, Physical & Social Science | 0 (0.0%) | 0 (0.0%) |
| Community & Social Service | 13 (30.9%) | 29 (69.1%) |
| Education, Arts & Media | 0 (0.0%) | 0 (0.0%) |
| Legal Services & Support | 0 (0.0%) | 0 (0.0%) |
| Education Instruction & Library | 13 (30.9%) | 29 (69.1%) |
| Arts, Media & Entertainment | 0 (0.0%) | 0 (0.0%) |
| Health Diagnosing & Treating | 9 (42.9%) | 12 (57.1%) |
| Health Technologists | 9 (47.4%) | 10 (52.6%) |
| Total (Category) | 28 (40.6%) | 41 (59.4%) |
| Total (Overall) | 189 (49.6%) | 192 (50.4%) |
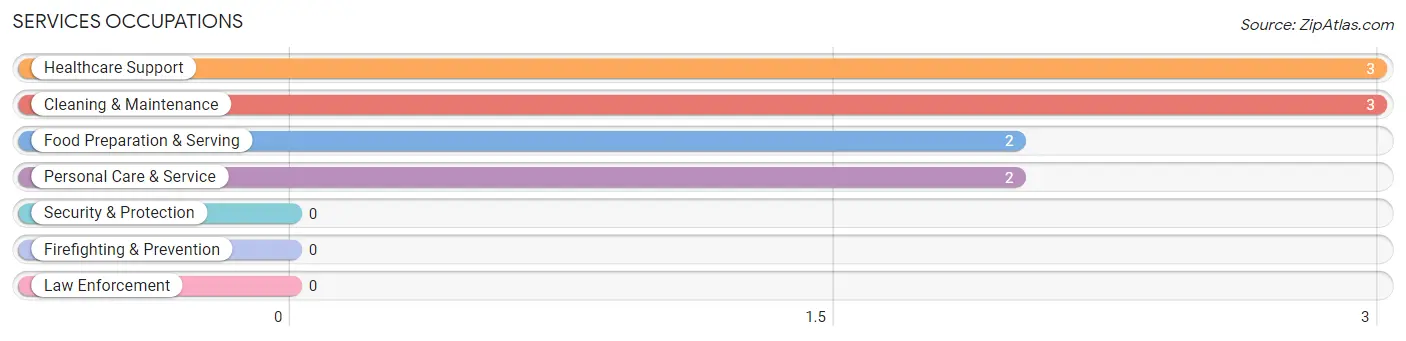
Services Occupations
The most common Services occupations in Moscow are Healthcare Support (3 | 0.8%), Cleaning & Maintenance (3 | 0.8%), Food Preparation & Serving (2 | 0.5%), and Personal Care & Service (2 | 0.5%).
Services Occupations by Sex
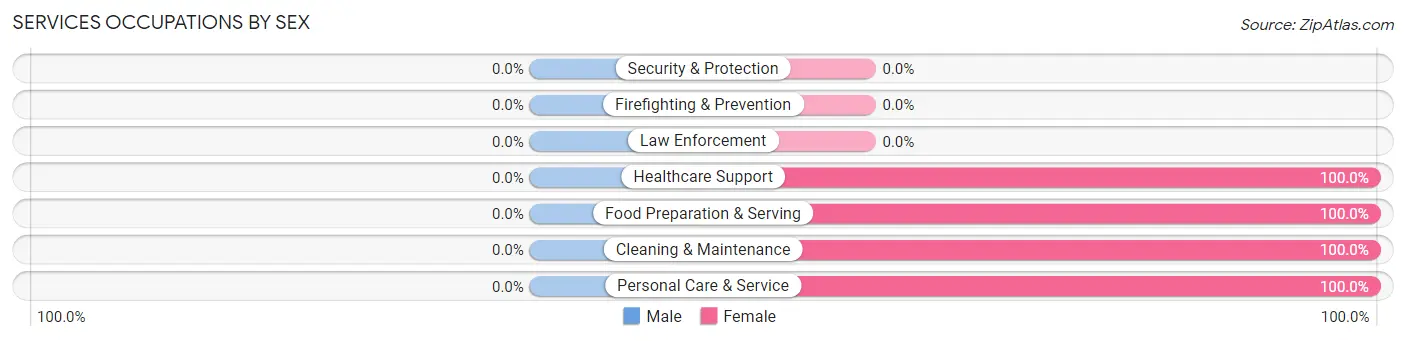
| Occupation | Male | Female |
| Healthcare Support | 0 (0.0%) | 3 (100.0%) |
| Security & Protection | 0 (0.0%) | 0 (0.0%) |
| Firefighting & Prevention | 0 (0.0%) | 0 (0.0%) |
| Law Enforcement | 0 (0.0%) | 0 (0.0%) |
| Food Preparation & Serving | 0 (0.0%) | 2 (100.0%) |
| Cleaning & Maintenance | 0 (0.0%) | 3 (100.0%) |
| Personal Care & Service | 0 (0.0%) | 2 (100.0%) |
| Total (Category) | 0 (0.0%) | 10 (100.0%) |
| Total (Overall) | 189 (49.6%) | 192 (50.4%) |
Sales and Office Occupations
The most common Sales and Office occupations in Moscow are Office & Administration (47 | 12.3%), and Sales & Related (20 | 5.2%).
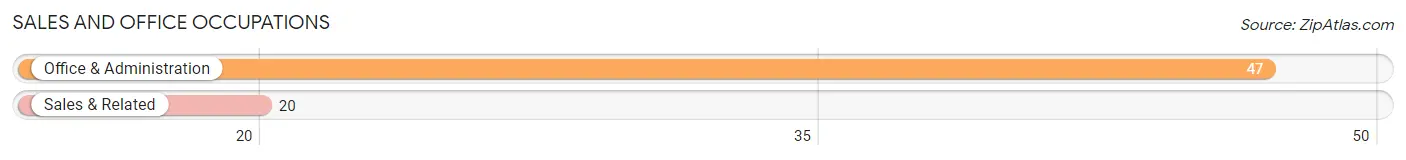
Sales and Office Occupations by Sex

| Occupation | Male | Female |
| Sales & Related | 10 (50.0%) | 10 (50.0%) |
| Office & Administration | 2 (4.3%) | 45 (95.7%) |
| Total (Category) | 12 (17.9%) | 55 (82.1%) |
| Total (Overall) | 189 (49.6%) | 192 (50.4%) |
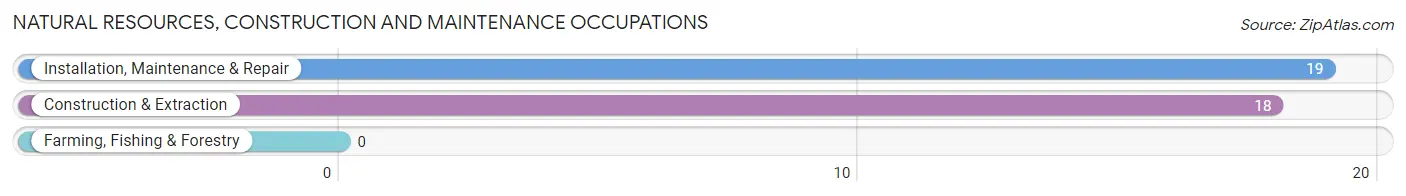
Natural Resources, Construction and Maintenance Occupations
The most common Natural Resources, Construction and Maintenance occupations in Moscow are Installation, Maintenance & Repair (19 | 5.0%), and Construction & Extraction (18 | 4.7%).
Natural Resources, Construction and Maintenance Occupations by Sex
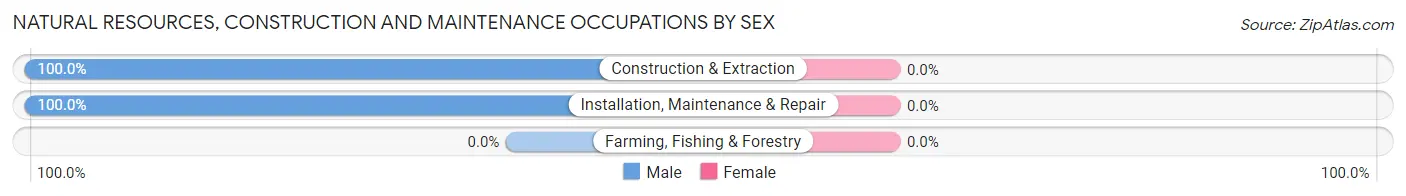
| Occupation | Male | Female |
| Farming, Fishing & Forestry | 0 (0.0%) | 0 (0.0%) |
| Construction & Extraction | 18 (100.0%) | 0 (0.0%) |
| Installation, Maintenance & Repair | 19 (100.0%) | 0 (0.0%) |
| Total (Category) | 37 (100.0%) | 0 (0.0%) |
| Total (Overall) | 189 (49.6%) | 192 (50.4%) |
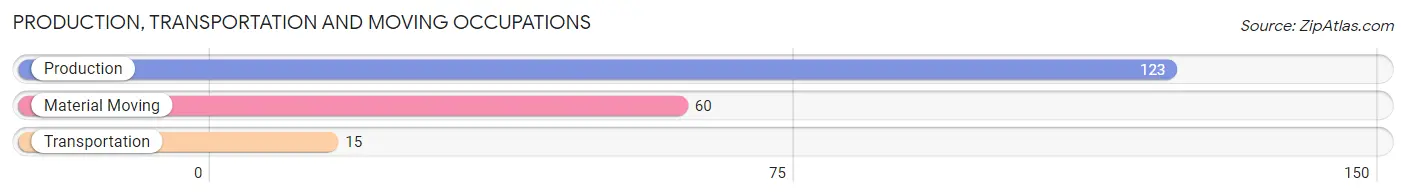
Production, Transportation and Moving Occupations
The most common Production, Transportation and Moving occupations in Moscow are Production (123 | 32.3%), Material Moving (60 | 15.8%), and Transportation (15 | 3.9%).
Production, Transportation and Moving Occupations by Sex
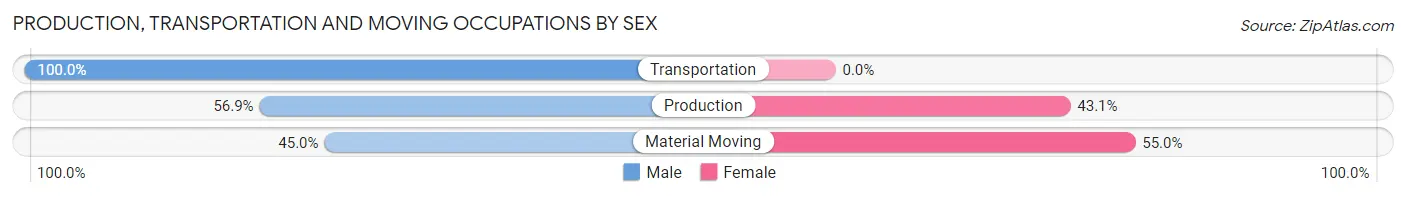
| Occupation | Male | Female |
| Production | 70 (56.9%) | 53 (43.1%) |
| Transportation | 15 (100.0%) | 0 (0.0%) |
| Material Moving | 27 (45.0%) | 33 (55.0%) |
| Total (Category) | 112 (56.6%) | 86 (43.4%) |
| Total (Overall) | 189 (49.6%) | 192 (50.4%) |
Employment Industries by Sex in Moscow
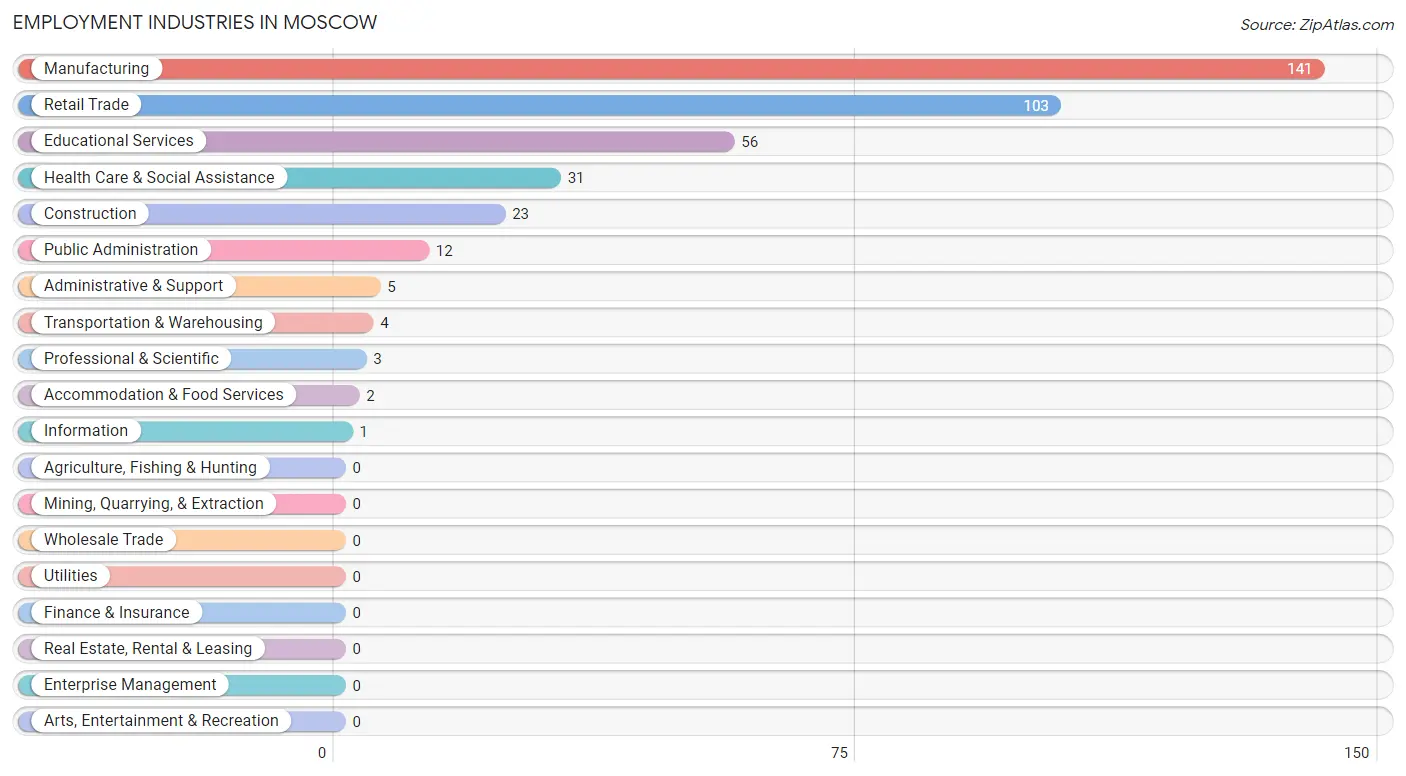
Employment Industries in Moscow
The major employment industries in Moscow include Manufacturing (141 | 37.0%), Retail Trade (103 | 27.0%), Educational Services (56 | 14.7%), Health Care & Social Assistance (31 | 8.1%), and Construction (23 | 6.0%).
Employment Industries by Sex in Moscow
The Moscow industries that see more men than women are Construction (100.0%), Transportation & Warehousing (100.0%), and Information (100.0%), whereas the industries that tend to have a higher number of women are Professional & Scientific (100.0%), Administrative & Support (100.0%), and Health Care & Social Assistance (100.0%).
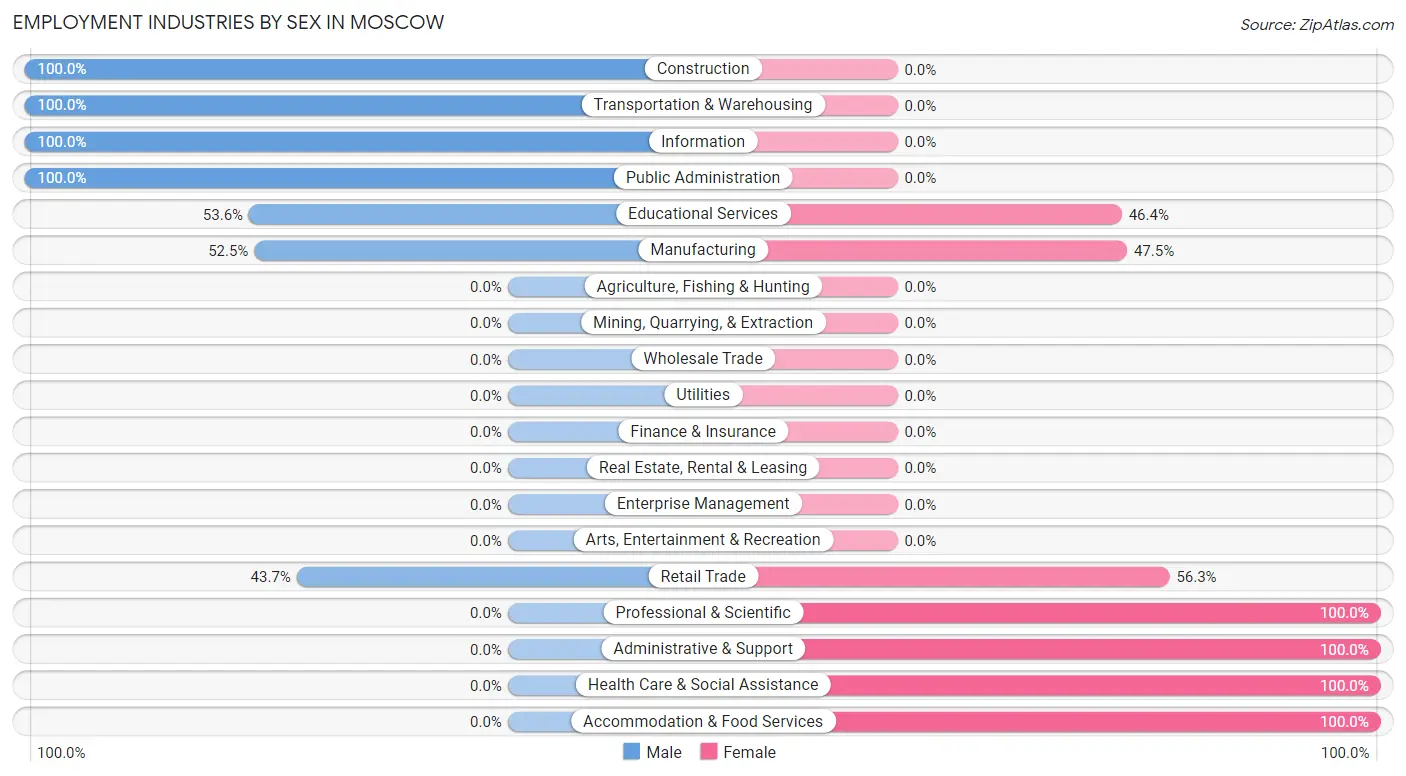
| Industry | Male | Female |
| Agriculture, Fishing & Hunting | 0 (0.0%) | 0 (0.0%) |
| Mining, Quarrying, & Extraction | 0 (0.0%) | 0 (0.0%) |
| Construction | 23 (100.0%) | 0 (0.0%) |
| Manufacturing | 74 (52.5%) | 67 (47.5%) |
| Wholesale Trade | 0 (0.0%) | 0 (0.0%) |
| Retail Trade | 45 (43.7%) | 58 (56.3%) |
| Transportation & Warehousing | 4 (100.0%) | 0 (0.0%) |
| Utilities | 0 (0.0%) | 0 (0.0%) |
| Information | 1 (100.0%) | 0 (0.0%) |
| Finance & Insurance | 0 (0.0%) | 0 (0.0%) |
| Real Estate, Rental & Leasing | 0 (0.0%) | 0 (0.0%) |
| Professional & Scientific | 0 (0.0%) | 3 (100.0%) |
| Enterprise Management | 0 (0.0%) | 0 (0.0%) |
| Administrative & Support | 0 (0.0%) | 5 (100.0%) |
| Educational Services | 30 (53.6%) | 26 (46.4%) |
| Health Care & Social Assistance | 0 (0.0%) | 31 (100.0%) |
| Arts, Entertainment & Recreation | 0 (0.0%) | 0 (0.0%) |
| Accommodation & Food Services | 0 (0.0%) | 2 (100.0%) |
| Public Administration | 12 (100.0%) | 0 (0.0%) |
| Total | 189 (49.6%) | 192 (50.4%) |
Education in Moscow
School Enrollment in Moscow
The most common levels of schooling among the 157 students in Moscow are elementary school (44 | 28.0%), high school (43 | 27.4%), and college / undergraduate (24 | 15.3%).
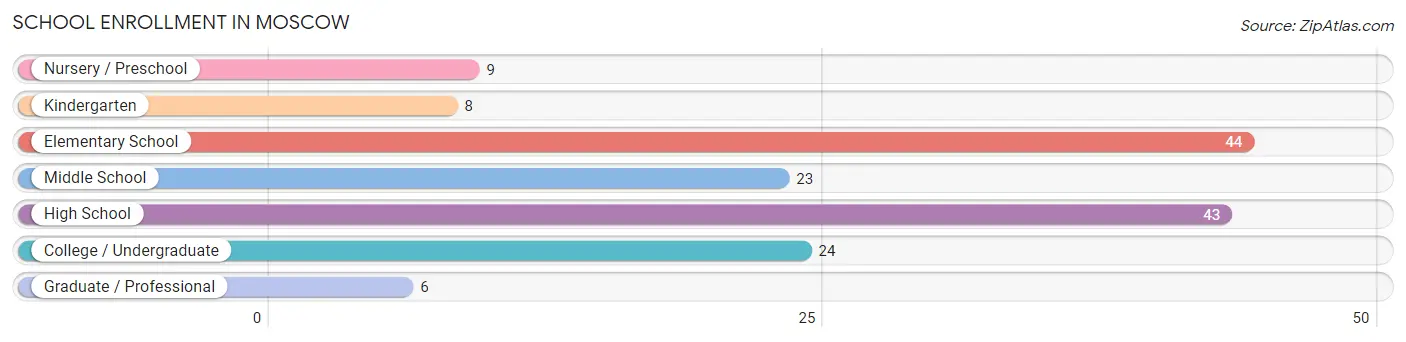
| School Level | # Students | % Students |
| Nursery / Preschool | 9 | 5.7% |
| Kindergarten | 8 | 5.1% |
| Elementary School | 44 | 28.0% |
| Middle School | 23 | 14.6% |
| High School | 43 | 27.4% |
| College / Undergraduate | 24 | 15.3% |
| Graduate / Professional | 6 | 3.8% |
| Total | 157 | 100.0% |
School Enrollment by Age by Funding Source in Moscow
Out of a total of 157 students who are enrolled in schools in Moscow, 23 (14.6%) attend a private institution, while the remaining 134 (85.4%) are enrolled in public schools. The age group of 35 years and over has the highest likelihood of being enrolled in private schools, with 6 (50.0% in the age bracket) enrolled. Conversely, the age group of 3 to 4 year olds has the lowest likelihood of being enrolled in a private school, with 9 (100.0% in the age bracket) attending a public institution.
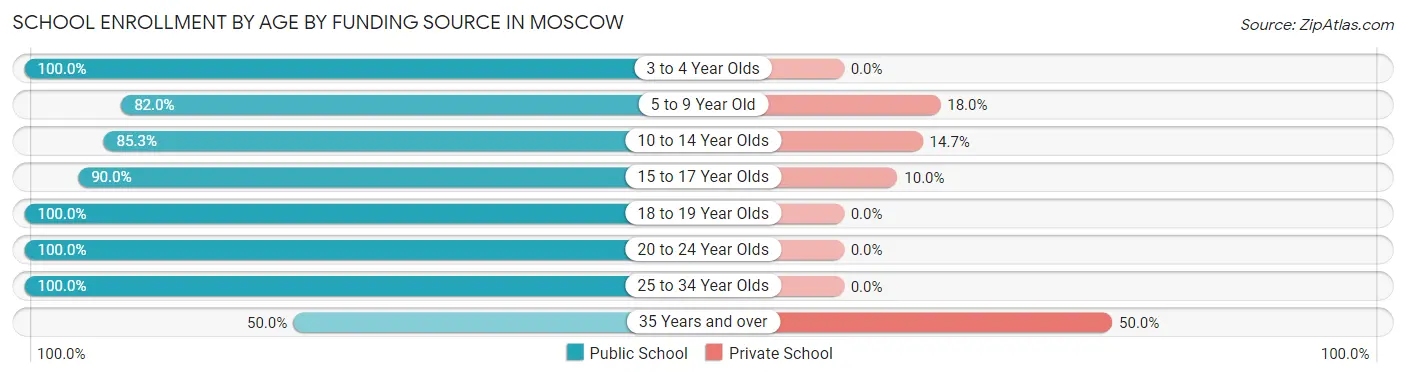
| Age Bracket | Public School | Private School |
| 3 to 4 Year Olds | 9 (100.0%) | 0 (0.0%) |
| 5 to 9 Year Old | 41 (82.0%) | 9 (18.0%) |
| 10 to 14 Year Olds | 29 (85.3%) | 5 (14.7%) |
| 15 to 17 Year Olds | 27 (90.0%) | 3 (10.0%) |
| 18 to 19 Year Olds | 6 (100.0%) | 0 (0.0%) |
| 20 to 24 Year Olds | 4 (100.0%) | 0 (0.0%) |
| 25 to 34 Year Olds | 12 (100.0%) | 0 (0.0%) |
| 35 Years and over | 6 (50.0%) | 6 (50.0%) |
| Total | 134 (85.4%) | 23 (14.6%) |
Educational Attainment by Field of Study in Moscow
Social sciences (29 | 34.5%), science & technology (9 | 10.7%), literature & languages (9 | 10.7%), education (8 | 9.5%), and physical & health sciences (7 | 8.3%) are the most common fields of study among 84 individuals in Moscow who have obtained a bachelor's degree or higher.
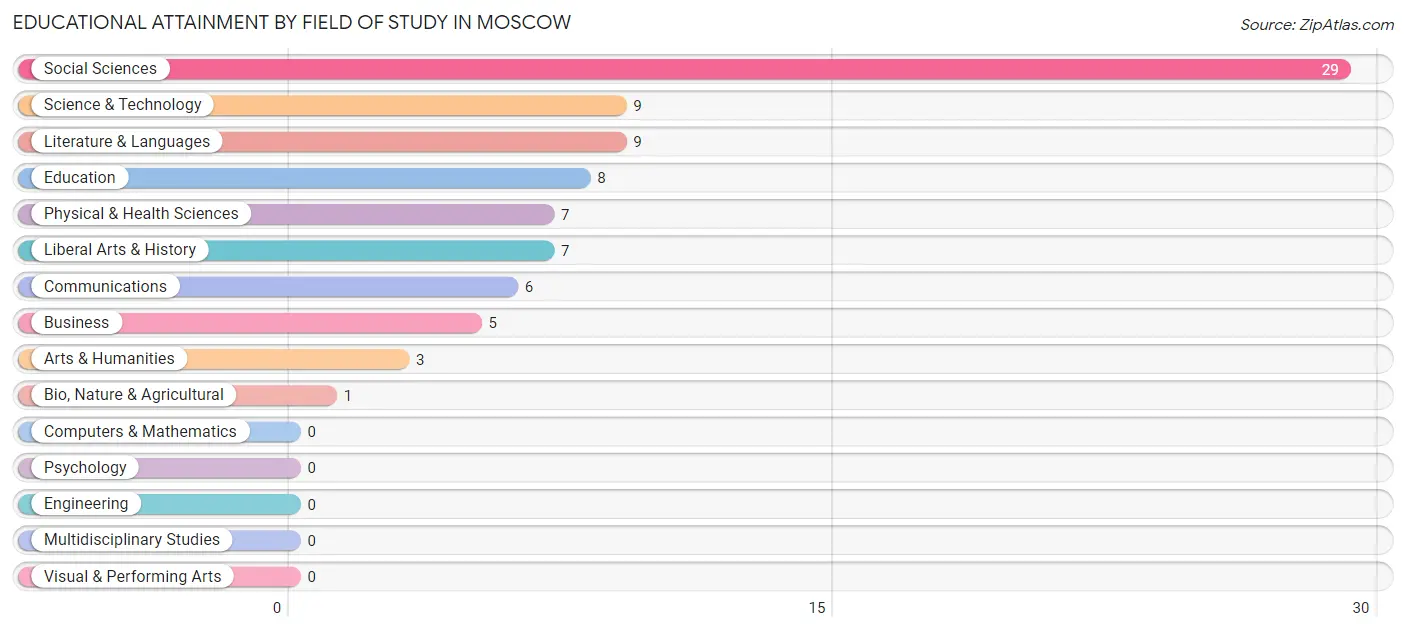
| Field of Study | # Graduates | % Graduates |
| Computers & Mathematics | 0 | 0.0% |
| Bio, Nature & Agricultural | 1 | 1.2% |
| Physical & Health Sciences | 7 | 8.3% |
| Psychology | 0 | 0.0% |
| Social Sciences | 29 | 34.5% |
| Engineering | 0 | 0.0% |
| Multidisciplinary Studies | 0 | 0.0% |
| Science & Technology | 9 | 10.7% |
| Business | 5 | 5.9% |
| Education | 8 | 9.5% |
| Literature & Languages | 9 | 10.7% |
| Liberal Arts & History | 7 | 8.3% |
| Visual & Performing Arts | 0 | 0.0% |
| Communications | 6 | 7.1% |
| Arts & Humanities | 3 | 3.6% |
| Total | 84 | 100.0% |
Transportation & Commute in Moscow
Vehicle Availability by Sex in Moscow
The most prevalent vehicle ownership categories in Moscow are males with no vehicle (54, accounting for 32.1%) and females with no vehicle (34, making up 28.1%).
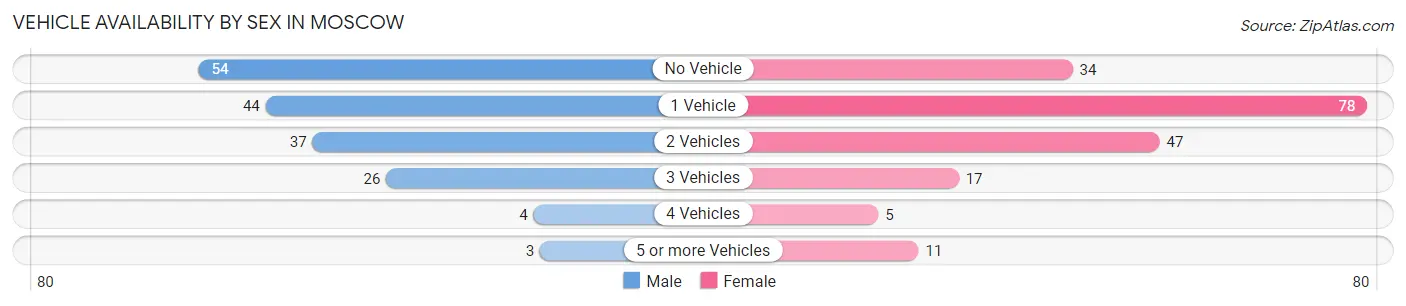
| Vehicles Available | Male | Female |
| No Vehicle | 54 (32.1%) | 34 (17.7%) |
| 1 Vehicle | 44 (26.2%) | 78 (40.6%) |
| 2 Vehicles | 37 (22.0%) | 47 (24.5%) |
| 3 Vehicles | 26 (15.5%) | 17 (8.8%) |
| 4 Vehicles | 4 (2.4%) | 5 (2.6%) |
| 5 or more Vehicles | 3 (1.8%) | 11 (5.7%) |
| Total | 168 (100.0%) | 192 (100.0%) |
Commute Time in Moscow
The most frequently occuring commute durations in Moscow are 45 to 59 minutes (61 commuters, 16.9%), 20 to 24 minutes (60 commuters, 16.7%), and 30 to 34 minutes (41 commuters, 11.4%).
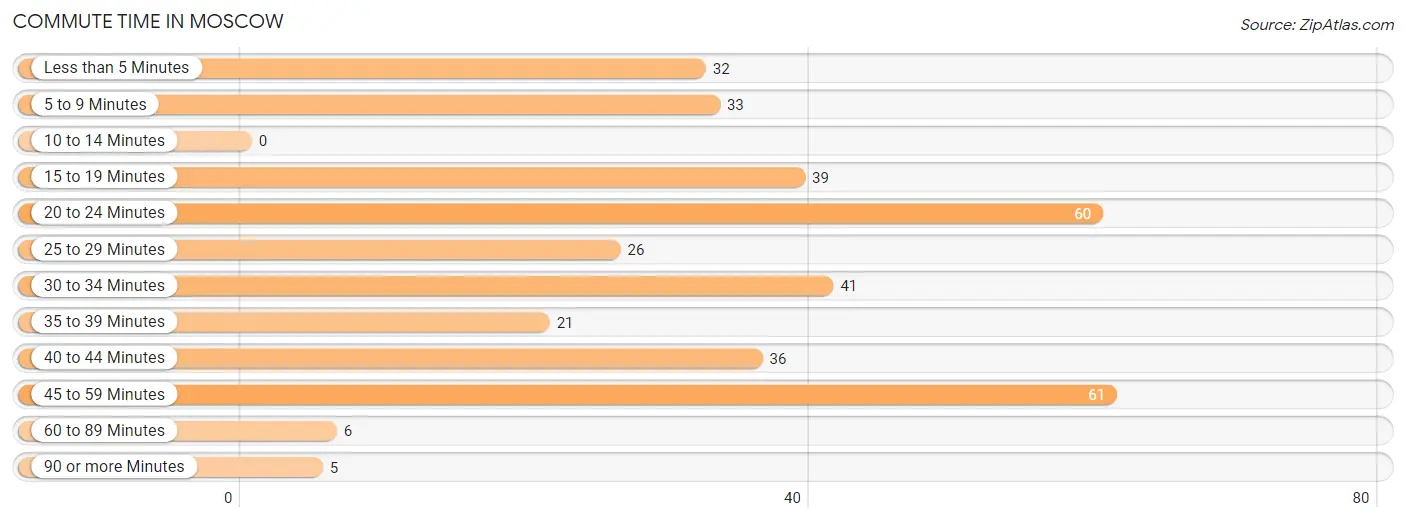
| Commute Time | # Commuters | % Commuters |
| Less than 5 Minutes | 32 | 8.9% |
| 5 to 9 Minutes | 33 | 9.2% |
| 10 to 14 Minutes | 0 | 0.0% |
| 15 to 19 Minutes | 39 | 10.8% |
| 20 to 24 Minutes | 60 | 16.7% |
| 25 to 29 Minutes | 26 | 7.2% |
| 30 to 34 Minutes | 41 | 11.4% |
| 35 to 39 Minutes | 21 | 5.8% |
| 40 to 44 Minutes | 36 | 10.0% |
| 45 to 59 Minutes | 61 | 16.9% |
| 60 to 89 Minutes | 6 | 1.7% |
| 90 or more Minutes | 5 | 1.4% |
Commute Time by Sex in Moscow
The most common commute times in Moscow are 20 to 24 minutes (34 commuters, 20.2%) for males and 45 to 59 minutes (47 commuters, 24.5%) for females.
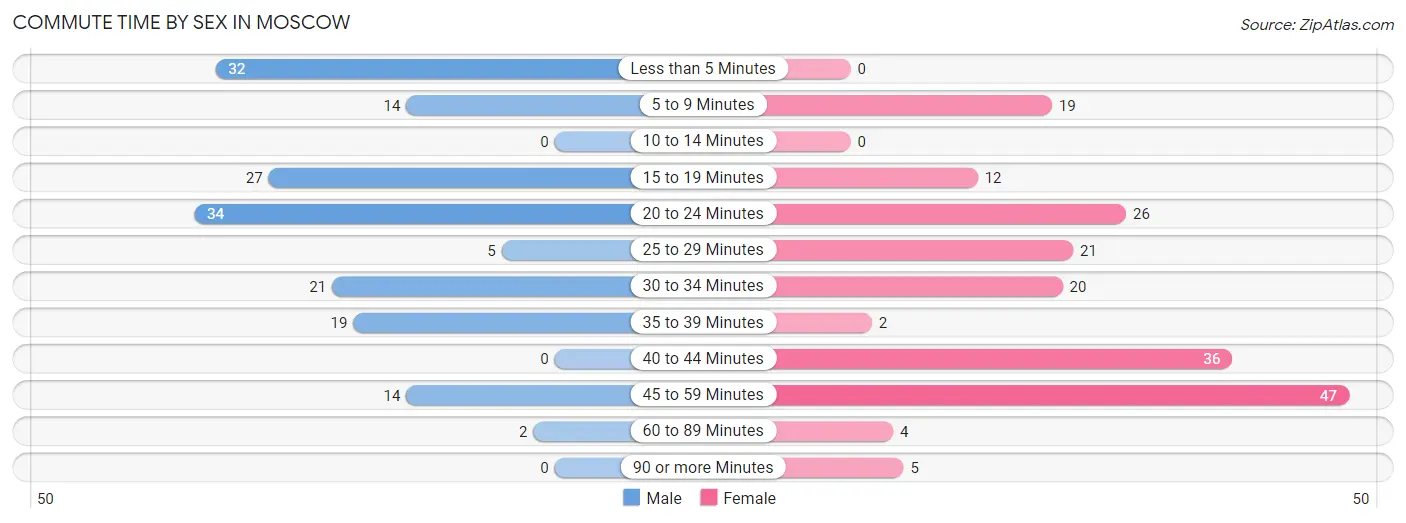
| Commute Time | Male | Female |
| Less than 5 Minutes | 32 (19.1%) | 0 (0.0%) |
| 5 to 9 Minutes | 14 (8.3%) | 19 (9.9%) |
| 10 to 14 Minutes | 0 (0.0%) | 0 (0.0%) |
| 15 to 19 Minutes | 27 (16.1%) | 12 (6.2%) |
| 20 to 24 Minutes | 34 (20.2%) | 26 (13.5%) |
| 25 to 29 Minutes | 5 (3.0%) | 21 (10.9%) |
| 30 to 34 Minutes | 21 (12.5%) | 20 (10.4%) |
| 35 to 39 Minutes | 19 (11.3%) | 2 (1.0%) |
| 40 to 44 Minutes | 0 (0.0%) | 36 (18.8%) |
| 45 to 59 Minutes | 14 (8.3%) | 47 (24.5%) |
| 60 to 89 Minutes | 2 (1.2%) | 4 (2.1%) |
| 90 or more Minutes | 0 (0.0%) | 5 (2.6%) |
Time of Departure to Work by Sex in Moscow
The most frequent times of departure to work in Moscow are 6:30 AM to 6:59 AM (38, 22.6%) for males and 12:00 AM to 4:59 AM (51, 26.6%) for females.
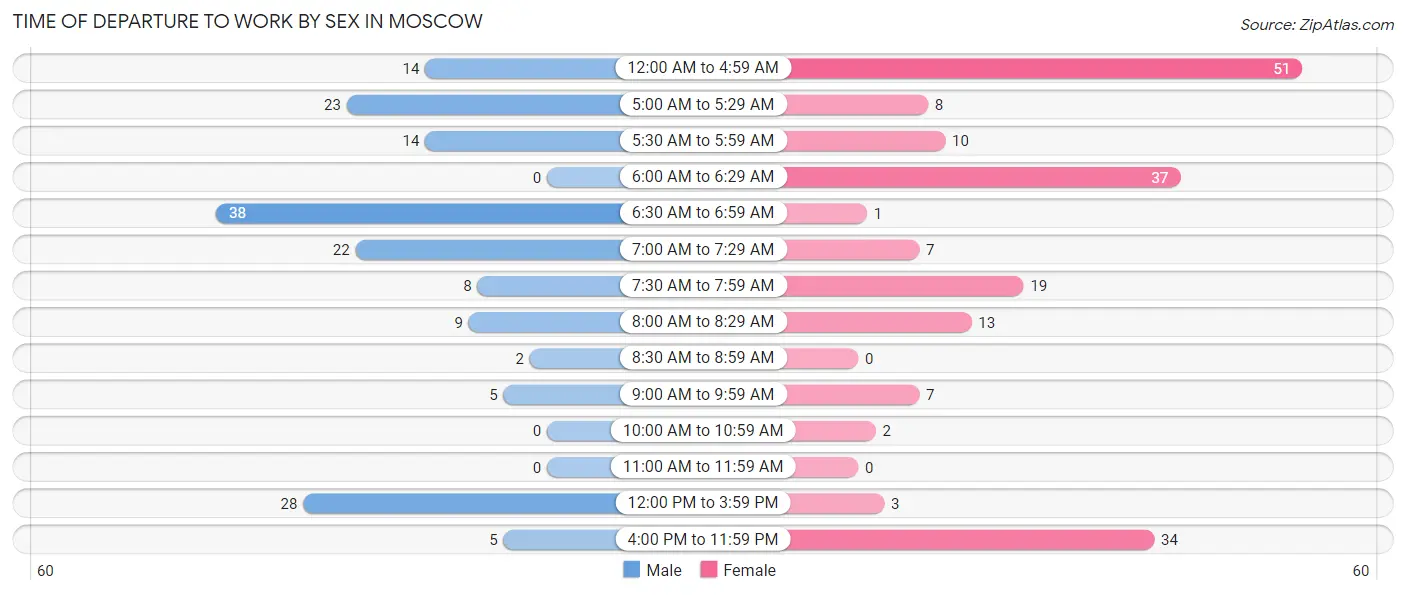
| Time of Departure | Male | Female |
| 12:00 AM to 4:59 AM | 14 (8.3%) | 51 (26.6%) |
| 5:00 AM to 5:29 AM | 23 (13.7%) | 8 (4.2%) |
| 5:30 AM to 5:59 AM | 14 (8.3%) | 10 (5.2%) |
| 6:00 AM to 6:29 AM | 0 (0.0%) | 37 (19.3%) |
| 6:30 AM to 6:59 AM | 38 (22.6%) | 1 (0.5%) |
| 7:00 AM to 7:29 AM | 22 (13.1%) | 7 (3.6%) |
| 7:30 AM to 7:59 AM | 8 (4.8%) | 19 (9.9%) |
| 8:00 AM to 8:29 AM | 9 (5.4%) | 13 (6.8%) |
| 8:30 AM to 8:59 AM | 2 (1.2%) | 0 (0.0%) |
| 9:00 AM to 9:59 AM | 5 (3.0%) | 7 (3.6%) |
| 10:00 AM to 10:59 AM | 0 (0.0%) | 2 (1.0%) |
| 11:00 AM to 11:59 AM | 0 (0.0%) | 0 (0.0%) |
| 12:00 PM to 3:59 PM | 28 (16.7%) | 3 (1.6%) |
| 4:00 PM to 11:59 PM | 5 (3.0%) | 34 (17.7%) |
| Total | 168 (100.0%) | 192 (100.0%) |
Housing Occupancy in Moscow
Occupancy by Ownership in Moscow
Of the total 294 dwellings in Moscow, owner-occupied units account for 107 (36.4%), while renter-occupied units make up 187 (63.6%).
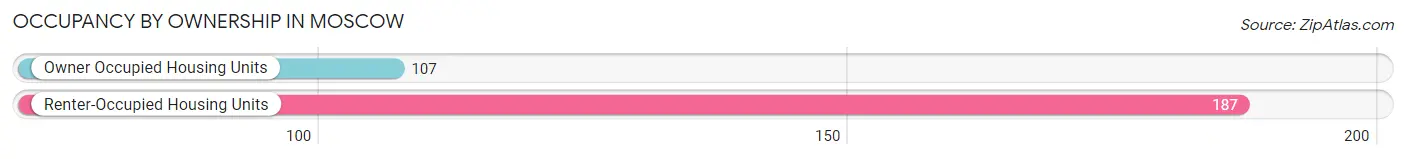
| Occupancy | # Housing Units | % Housing Units |
| Owner Occupied Housing Units | 107 | 36.4% |
| Renter-Occupied Housing Units | 187 | 63.6% |
| Total Occupied Housing Units | 294 | 100.0% |
Occupancy by Household Size in Moscow
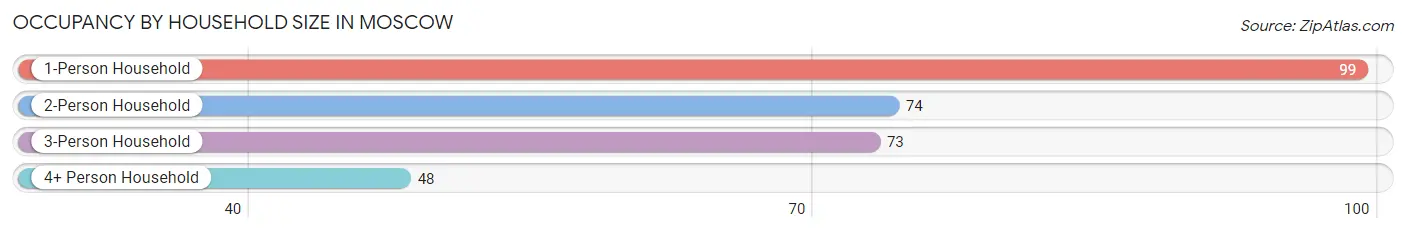
| Household Size | # Housing Units | % Housing Units |
| 1-Person Household | 99 | 33.7% |
| 2-Person Household | 74 | 25.2% |
| 3-Person Household | 73 | 24.8% |
| 4+ Person Household | 48 | 16.3% |
| Total Housing Units | 294 | 100.0% |
Occupancy by Ownership by Household Size in Moscow
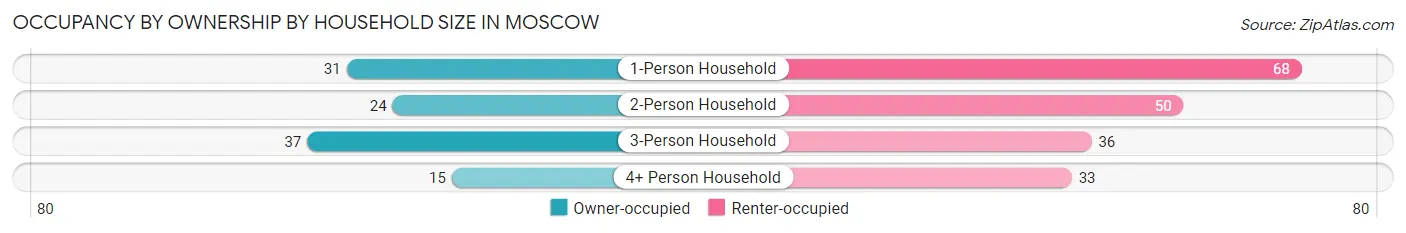
| Household Size | Owner-occupied | Renter-occupied |
| 1-Person Household | 31 (31.3%) | 68 (68.7%) |
| 2-Person Household | 24 (32.4%) | 50 (67.6%) |
| 3-Person Household | 37 (50.7%) | 36 (49.3%) |
| 4+ Person Household | 15 (31.2%) | 33 (68.8%) |
| Total Housing Units | 107 (36.4%) | 187 (63.6%) |
Occupancy by Educational Attainment in Moscow
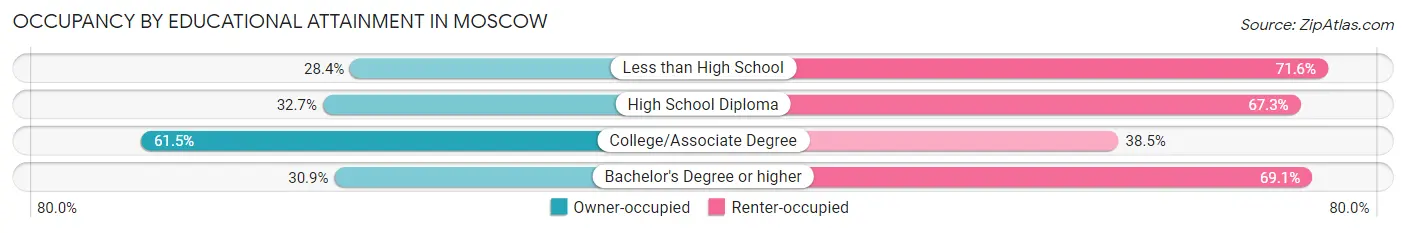
| Household Size | Owner-occupied | Renter-occupied |
| Less than High School | 19 (28.4%) | 48 (71.6%) |
| High School Diploma | 35 (32.7%) | 72 (67.3%) |
| College/Associate Degree | 32 (61.5%) | 20 (38.5%) |
| Bachelor's Degree or higher | 21 (30.9%) | 47 (69.1%) |
Occupancy by Age of Householder in Moscow
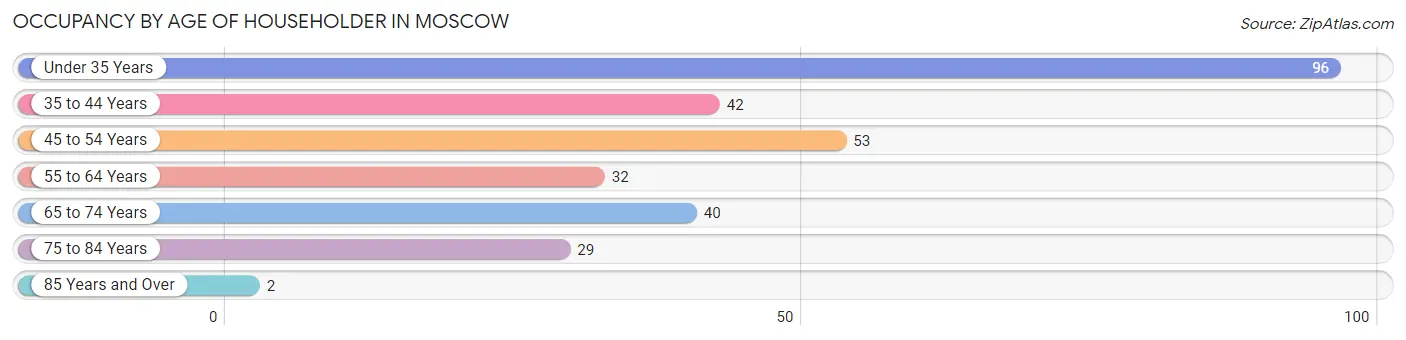
| Age Bracket | # Households | % Households |
| Under 35 Years | 96 | 32.7% |
| 35 to 44 Years | 42 | 14.3% |
| 45 to 54 Years | 53 | 18.0% |
| 55 to 64 Years | 32 | 10.9% |
| 65 to 74 Years | 40 | 13.6% |
| 75 to 84 Years | 29 | 9.9% |
| 85 Years and Over | 2 | 0.7% |
| Total | 294 | 100.0% |
Housing Finances in Moscow
Median Income by Occupancy in Moscow
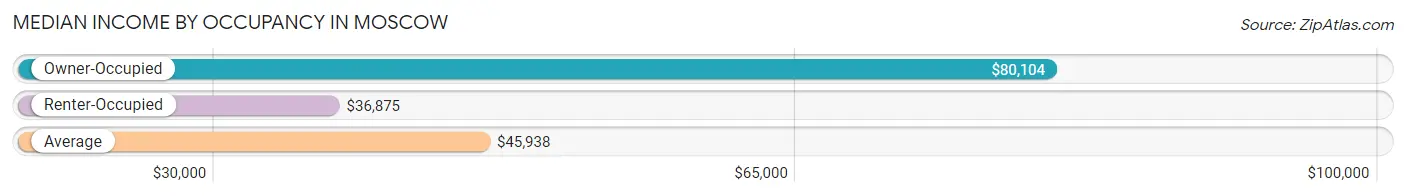
| Occupancy Type | # Households | Median Income |
| Owner-Occupied | 107 (36.4%) | $80,104 |
| Renter-Occupied | 187 (63.6%) | $36,875 |
| Average | 294 (100.0%) | $45,938 |
Occupancy by Householder Income Bracket in Moscow
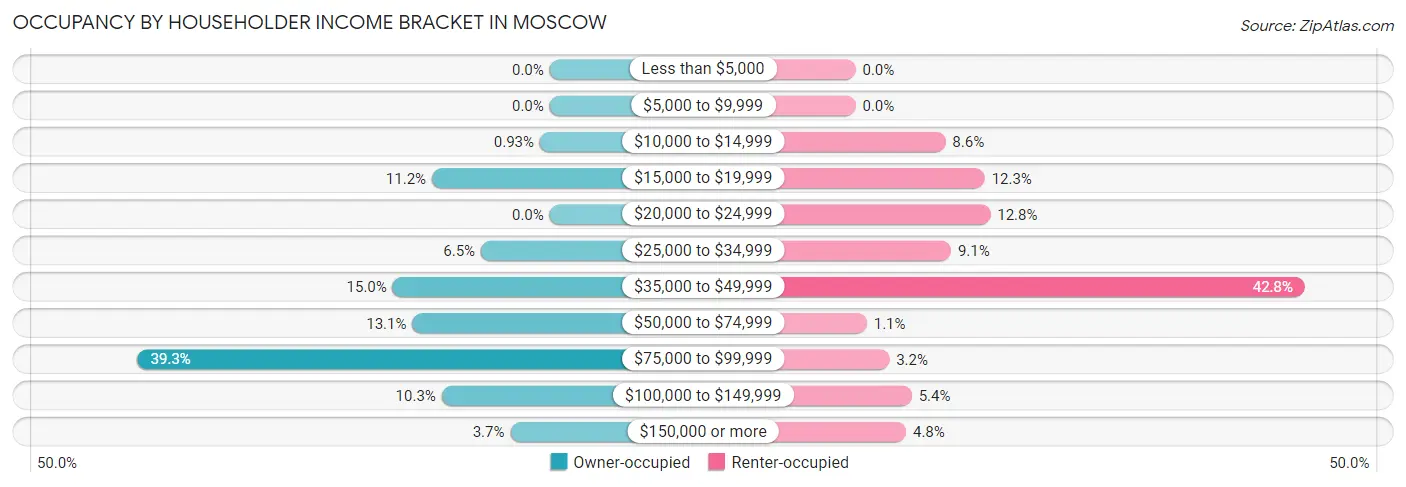
| Income Bracket | Owner-occupied | Renter-occupied |
| Less than $5,000 | 0 (0.0%) | 0 (0.0%) |
| $5,000 to $9,999 | 0 (0.0%) | 0 (0.0%) |
| $10,000 to $14,999 | 1 (0.9%) | 16 (8.6%) |
| $15,000 to $19,999 | 12 (11.2%) | 23 (12.3%) |
| $20,000 to $24,999 | 0 (0.0%) | 24 (12.8%) |
| $25,000 to $34,999 | 7 (6.5%) | 17 (9.1%) |
| $35,000 to $49,999 | 16 (14.9%) | 80 (42.8%) |
| $50,000 to $74,999 | 14 (13.1%) | 2 (1.1%) |
| $75,000 to $99,999 | 42 (39.3%) | 6 (3.2%) |
| $100,000 to $149,999 | 11 (10.3%) | 10 (5.3%) |
| $150,000 or more | 4 (3.7%) | 9 (4.8%) |
| Total | 107 (100.0%) | 187 (100.0%) |
Monthly Housing Cost Tiers in Moscow
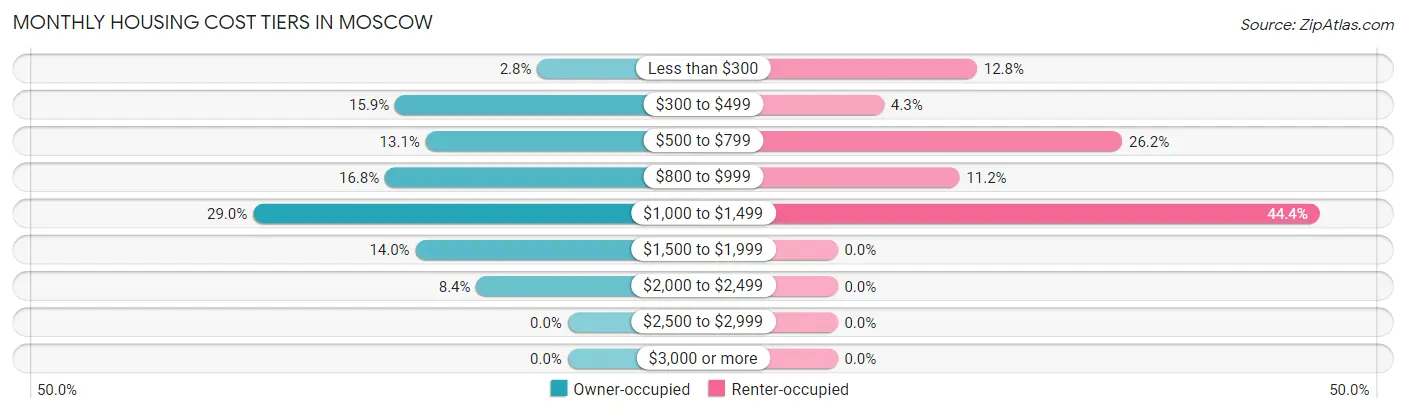
| Monthly Cost | Owner-occupied | Renter-occupied |
| Less than $300 | 3 (2.8%) | 24 (12.8%) |
| $300 to $499 | 17 (15.9%) | 8 (4.3%) |
| $500 to $799 | 14 (13.1%) | 49 (26.2%) |
| $800 to $999 | 18 (16.8%) | 21 (11.2%) |
| $1,000 to $1,499 | 31 (29.0%) | 83 (44.4%) |
| $1,500 to $1,999 | 15 (14.0%) | 0 (0.0%) |
| $2,000 to $2,499 | 9 (8.4%) | 0 (0.0%) |
| $2,500 to $2,999 | 0 (0.0%) | 0 (0.0%) |
| $3,000 or more | 0 (0.0%) | 0 (0.0%) |
| Total | 107 (100.0%) | 187 (100.0%) |
Physical Housing Characteristics in Moscow
Housing Structures in Moscow
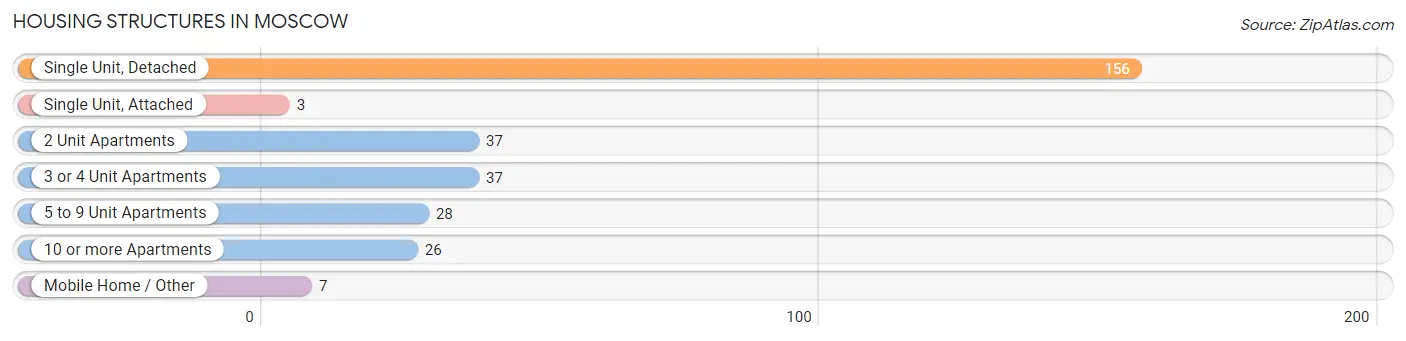
| Structure Type | # Housing Units | % Housing Units |
| Single Unit, Detached | 156 | 53.1% |
| Single Unit, Attached | 3 | 1.0% |
| 2 Unit Apartments | 37 | 12.6% |
| 3 or 4 Unit Apartments | 37 | 12.6% |
| 5 to 9 Unit Apartments | 28 | 9.5% |
| 10 or more Apartments | 26 | 8.8% |
| Mobile Home / Other | 7 | 2.4% |
| Total | 294 | 100.0% |
Housing Structures by Occupancy in Moscow
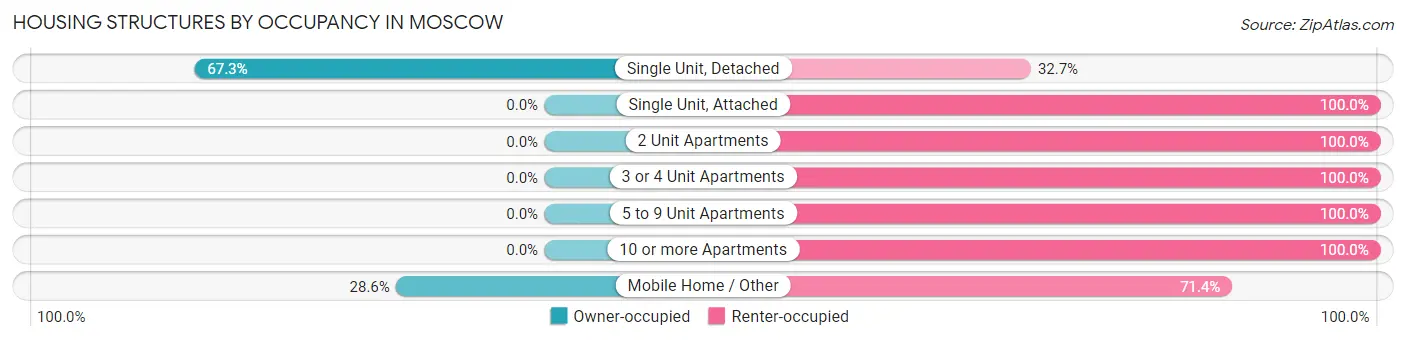
| Structure Type | Owner-occupied | Renter-occupied |
| Single Unit, Detached | 105 (67.3%) | 51 (32.7%) |
| Single Unit, Attached | 0 (0.0%) | 3 (100.0%) |
| 2 Unit Apartments | 0 (0.0%) | 37 (100.0%) |
| 3 or 4 Unit Apartments | 0 (0.0%) | 37 (100.0%) |
| 5 to 9 Unit Apartments | 0 (0.0%) | 28 (100.0%) |
| 10 or more Apartments | 0 (0.0%) | 26 (100.0%) |
| Mobile Home / Other | 2 (28.6%) | 5 (71.4%) |
| Total | 107 (36.4%) | 187 (63.6%) |
Housing Structures by Number of Rooms in Moscow
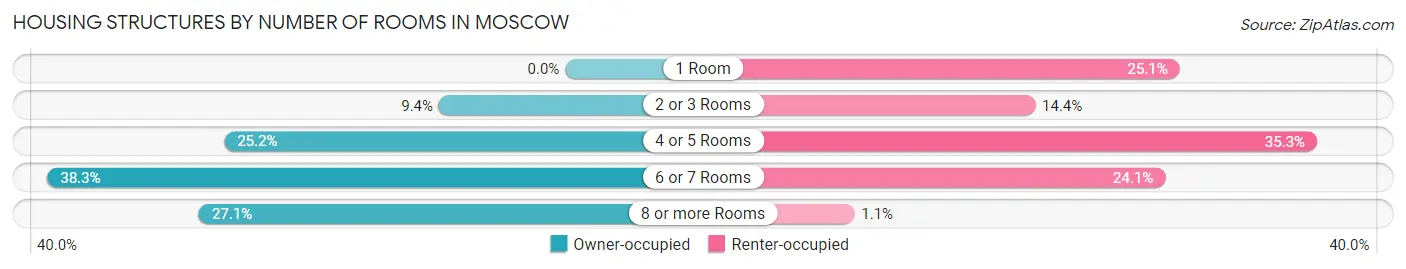
| Number of Rooms | Owner-occupied | Renter-occupied |
| 1 Room | 0 (0.0%) | 47 (25.1%) |
| 2 or 3 Rooms | 10 (9.3%) | 27 (14.4%) |
| 4 or 5 Rooms | 27 (25.2%) | 66 (35.3%) |
| 6 or 7 Rooms | 41 (38.3%) | 45 (24.1%) |
| 8 or more Rooms | 29 (27.1%) | 2 (1.1%) |
| Total | 107 (100.0%) | 187 (100.0%) |
Housing Structure by Heating Type in Moscow
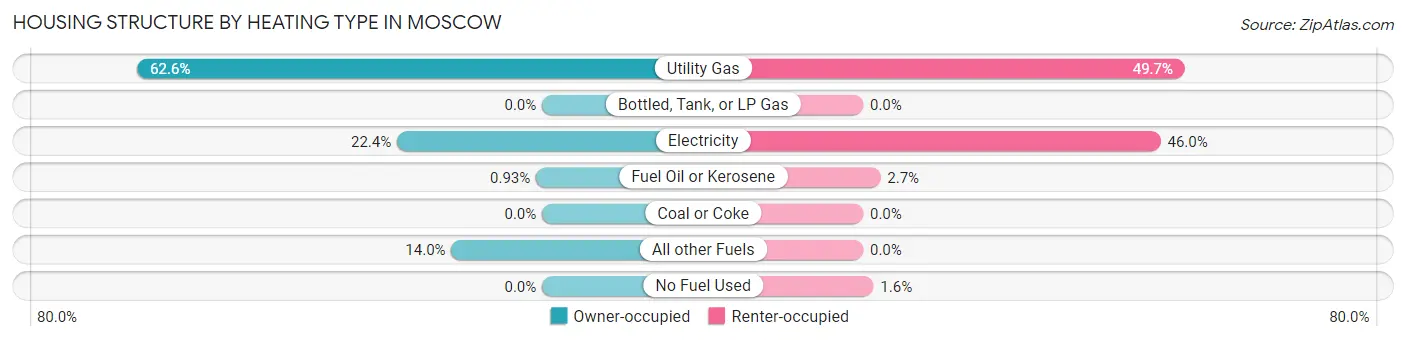
| Heating Type | Owner-occupied | Renter-occupied |
| Utility Gas | 67 (62.6%) | 93 (49.7%) |
| Bottled, Tank, or LP Gas | 0 (0.0%) | 0 (0.0%) |
| Electricity | 24 (22.4%) | 86 (46.0%) |
| Fuel Oil or Kerosene | 1 (0.9%) | 5 (2.7%) |
| Coal or Coke | 0 (0.0%) | 0 (0.0%) |
| All other Fuels | 15 (14.0%) | 0 (0.0%) |
| No Fuel Used | 0 (0.0%) | 3 (1.6%) |
| Total | 107 (100.0%) | 187 (100.0%) |
Household Vehicle Usage in Moscow
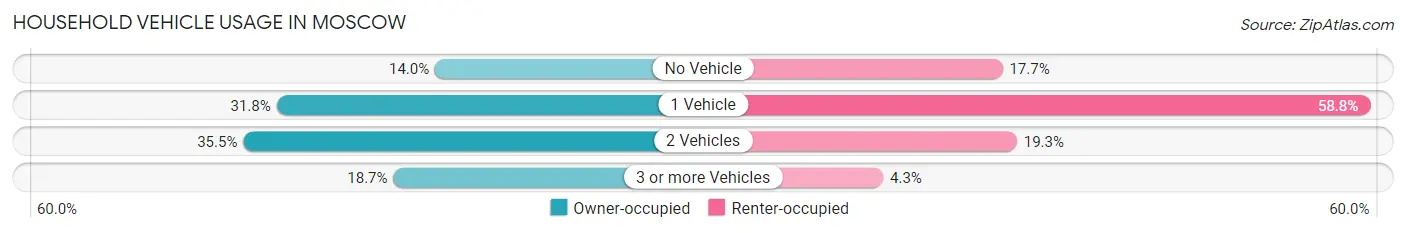
| Vehicles per Household | Owner-occupied | Renter-occupied |
| No Vehicle | 15 (14.0%) | 33 (17.6%) |
| 1 Vehicle | 34 (31.8%) | 110 (58.8%) |
| 2 Vehicles | 38 (35.5%) | 36 (19.3%) |
| 3 or more Vehicles | 20 (18.7%) | 8 (4.3%) |
| Total | 107 (100.0%) | 187 (100.0%) |
Real Estate & Mortgages in Moscow
Real Estate and Mortgage Overview in Moscow
| Characteristic | Without Mortgage | With Mortgage |
| Housing Units | 30 | 77 |
| Median Property Value | $206,300 | $160,500 |
| Median Household Income | $59,688 | $4 |
| Monthly Housing Costs | $471 | $0 |
| Real Estate Taxes | $700 | $2 |
Property Value by Mortgage Status in Moscow
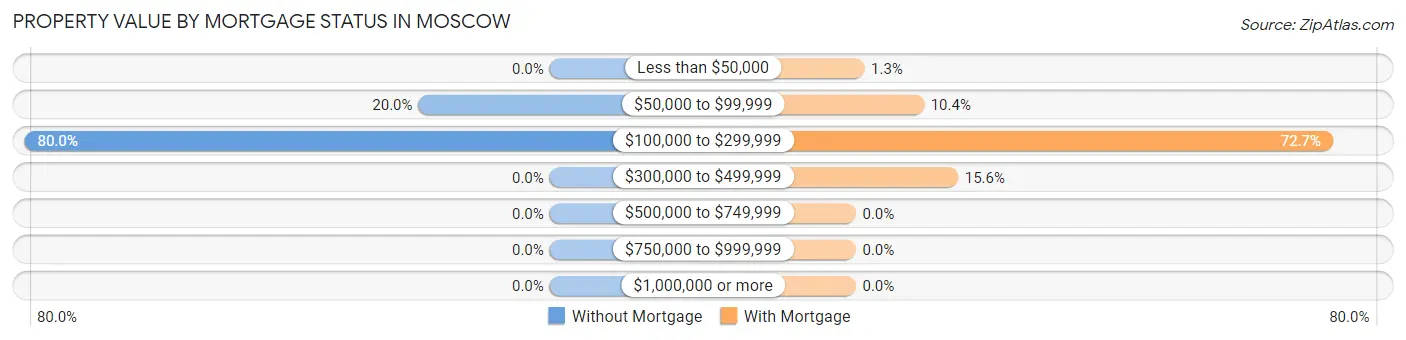
| Property Value | Without Mortgage | With Mortgage |
| Less than $50,000 | 0 (0.0%) | 1 (1.3%) |
| $50,000 to $99,999 | 6 (20.0%) | 8 (10.4%) |
| $100,000 to $299,999 | 24 (80.0%) | 56 (72.7%) |
| $300,000 to $499,999 | 0 (0.0%) | 12 (15.6%) |
| $500,000 to $749,999 | 0 (0.0%) | 0 (0.0%) |
| $750,000 to $999,999 | 0 (0.0%) | 0 (0.0%) |
| $1,000,000 or more | 0 (0.0%) | 0 (0.0%) |
| Total | 30 (100.0%) | 77 (100.0%) |
Household Income by Mortgage Status in Moscow
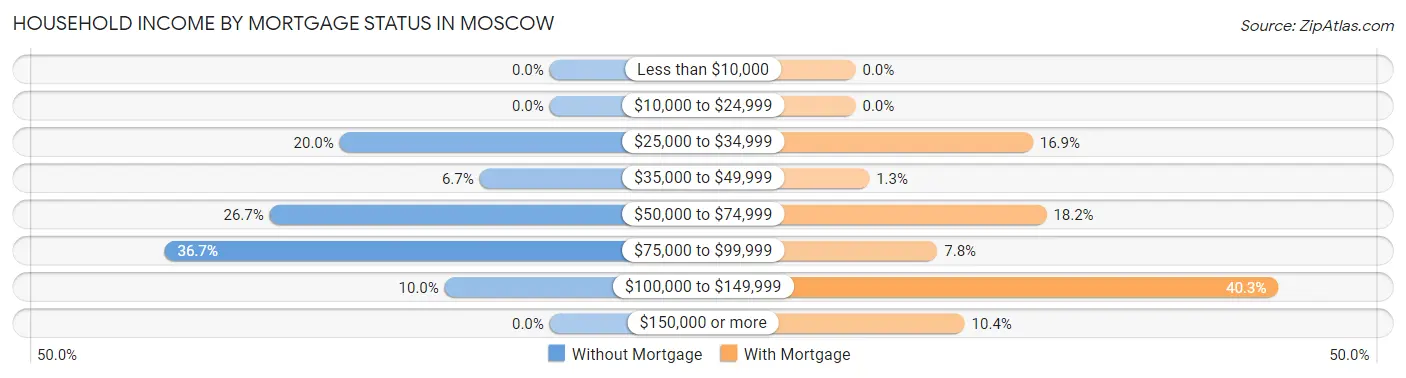
| Household Income | Without Mortgage | With Mortgage |
| Less than $10,000 | 0 (0.0%) | 0 (0.0%) |
| $10,000 to $24,999 | 0 (0.0%) | 0 (0.0%) |
| $25,000 to $34,999 | 6 (20.0%) | 13 (16.9%) |
| $35,000 to $49,999 | 2 (6.7%) | 1 (1.3%) |
| $50,000 to $74,999 | 8 (26.7%) | 14 (18.2%) |
| $75,000 to $99,999 | 11 (36.7%) | 6 (7.8%) |
| $100,000 to $149,999 | 3 (10.0%) | 31 (40.3%) |
| $150,000 or more | 0 (0.0%) | 8 (10.4%) |
| Total | 30 (100.0%) | 77 (100.0%) |
Property Value to Household Income Ratio in Moscow
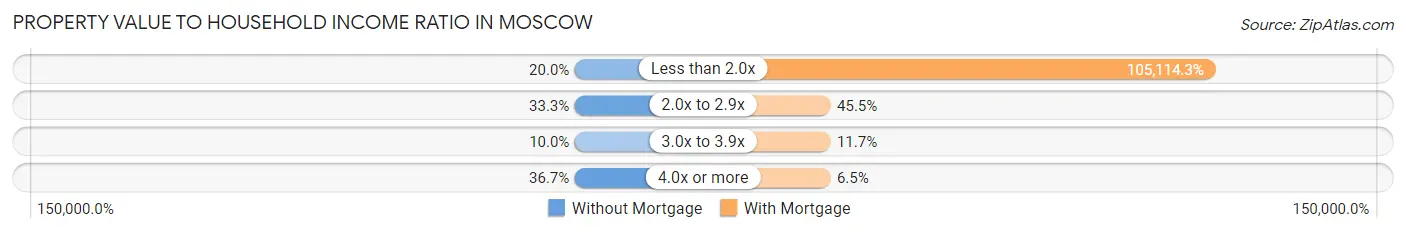
| Value-to-Income Ratio | Without Mortgage | With Mortgage |
| Less than 2.0x | 6 (20.0%) | 80,938 (105,114.3%) |
| 2.0x to 2.9x | 10 (33.3%) | 35 (45.5%) |
| 3.0x to 3.9x | 3 (10.0%) | 9 (11.7%) |
| 4.0x or more | 11 (36.7%) | 5 (6.5%) |
| Total | 30 (100.0%) | 77 (100.0%) |
Real Estate Taxes by Mortgage Status in Moscow
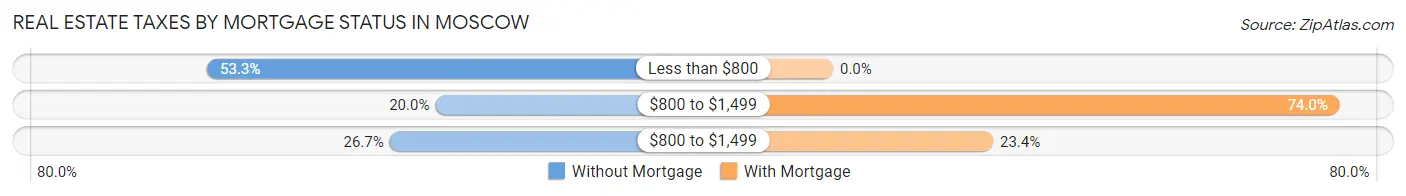
| Property Taxes | Without Mortgage | With Mortgage |
| Less than $800 | 16 (53.3%) | 0 (0.0%) |
| $800 to $1,499 | 6 (20.0%) | 57 (74.0%) |
| $800 to $1,499 | 8 (26.7%) | 18 (23.4%) |
| Total | 30 (100.0%) | 77 (100.0%) |
Health & Disability in Moscow
Health Insurance Coverage by Age in Moscow
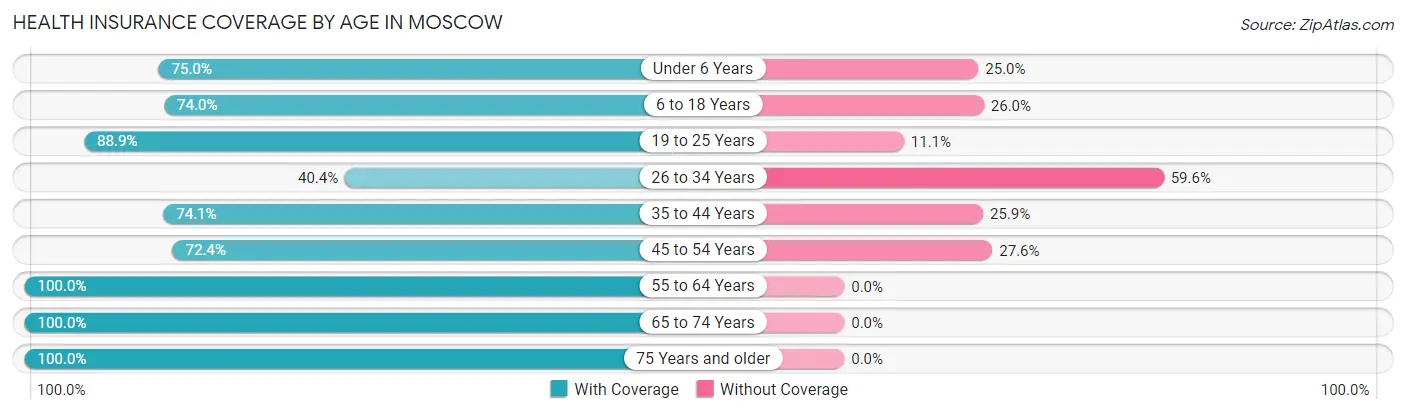
| Age Bracket | With Coverage | Without Coverage |
| Under 6 Years | 33 (75.0%) | 11 (25.0%) |
| 6 to 18 Years | 91 (74.0%) | 32 (26.0%) |
| 19 to 25 Years | 48 (88.9%) | 6 (11.1%) |
| 26 to 34 Years | 76 (40.4%) | 112 (59.6%) |
| 35 to 44 Years | 63 (74.1%) | 22 (25.9%) |
| 45 to 54 Years | 97 (72.4%) | 37 (27.6%) |
| 55 to 64 Years | 95 (100.0%) | 0 (0.0%) |
| 65 to 74 Years | 49 (100.0%) | 0 (0.0%) |
| 75 Years and older | 60 (100.0%) | 0 (0.0%) |
| Total | 612 (73.6%) | 220 (26.4%) |
Health Insurance Coverage by Citizenship Status in Moscow
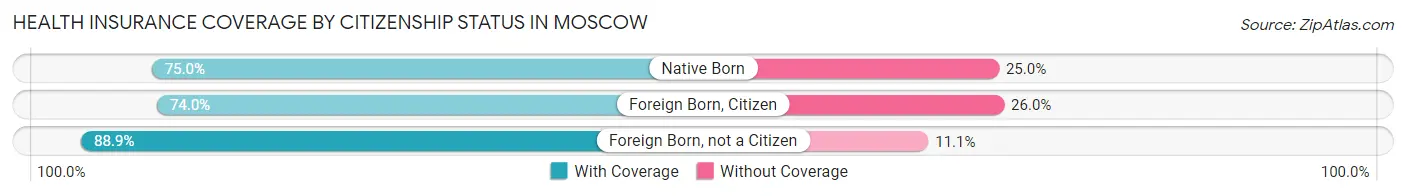
| Citizenship Status | With Coverage | Without Coverage |
| Native Born | 33 (75.0%) | 11 (25.0%) |
| Foreign Born, Citizen | 91 (74.0%) | 32 (26.0%) |
| Foreign Born, not a Citizen | 48 (88.9%) | 6 (11.1%) |
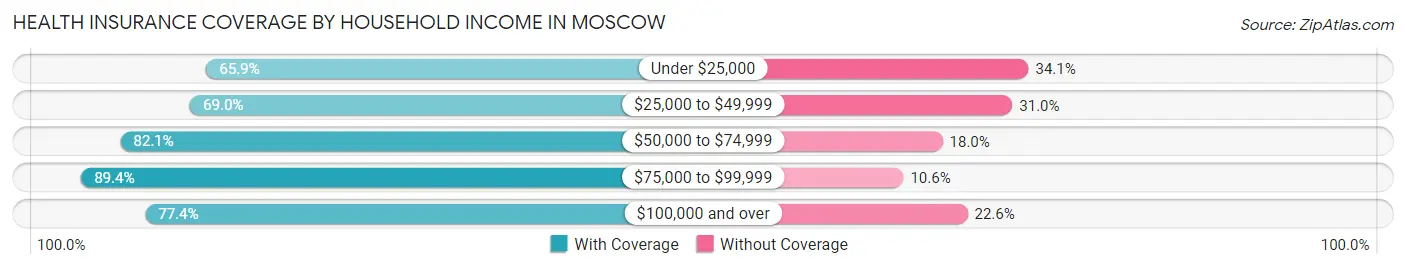
Health Insurance Coverage by Household Income in Moscow
| Household Income | With Coverage | Without Coverage |
| Under $25,000 | 91 (65.9%) | 47 (34.1%) |
| $25,000 to $49,999 | 258 (69.0%) | 116 (31.0%) |
| $50,000 to $74,999 | 32 (82.1%) | 7 (17.9%) |
| $75,000 to $99,999 | 101 (89.4%) | 12 (10.6%) |
| $100,000 and over | 130 (77.4%) | 38 (22.6%) |
Public vs Private Health Insurance Coverage by Age in Moscow
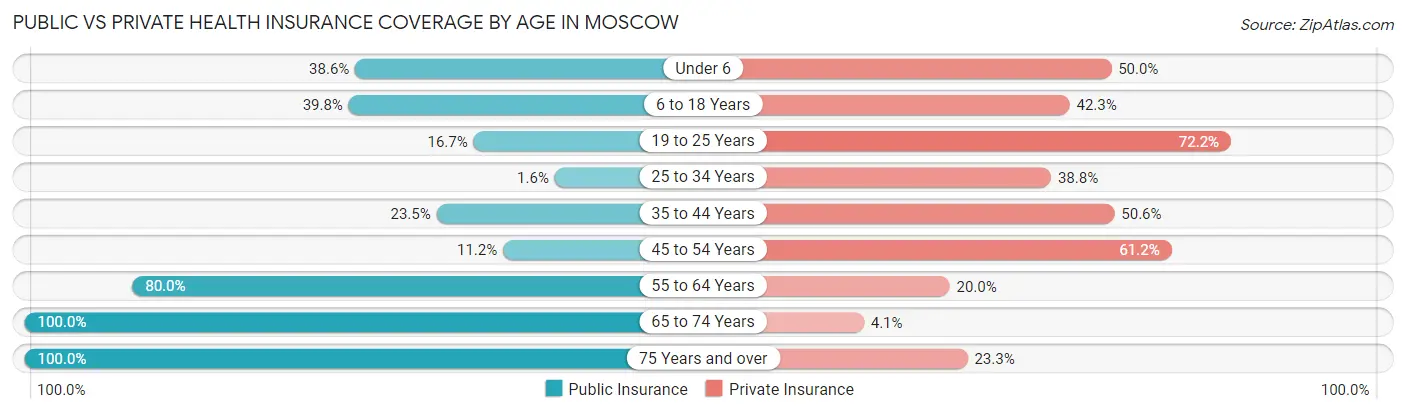
| Age Bracket | Public Insurance | Private Insurance |
| Under 6 | 17 (38.6%) | 22 (50.0%) |
| 6 to 18 Years | 49 (39.8%) | 52 (42.3%) |
| 19 to 25 Years | 9 (16.7%) | 39 (72.2%) |
| 25 to 34 Years | 3 (1.6%) | 73 (38.8%) |
| 35 to 44 Years | 20 (23.5%) | 43 (50.6%) |
| 45 to 54 Years | 15 (11.2%) | 82 (61.2%) |
| 55 to 64 Years | 76 (80.0%) | 19 (20.0%) |
| 65 to 74 Years | 49 (100.0%) | 2 (4.1%) |
| 75 Years and over | 60 (100.0%) | 14 (23.3%) |
| Total | 298 (35.8%) | 346 (41.6%) |
Disability Status by Sex by Age in Moscow
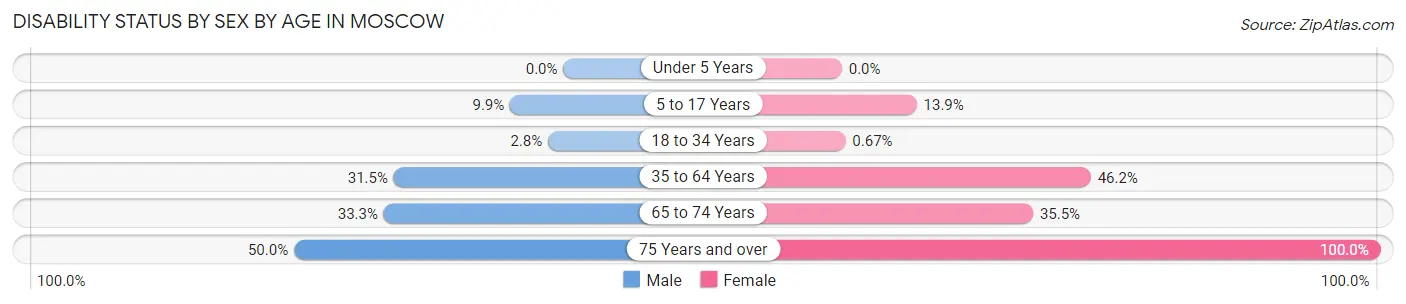
| Age Bracket | Male | Female |
| Under 5 Years | 0 (0.0%) | 0 (0.0%) |
| 5 to 17 Years | 8 (9.9%) | 5 (13.9%) |
| 18 to 34 Years | 3 (2.8%) | 1 (0.7%) |
| 35 to 64 Years | 45 (31.5%) | 79 (46.2%) |
| 65 to 74 Years | 6 (33.3%) | 11 (35.5%) |
| 75 Years and over | 3 (50.0%) | 54 (100.0%) |
Disability Class by Sex by Age in Moscow
Disability Class: Hearing Difficulty
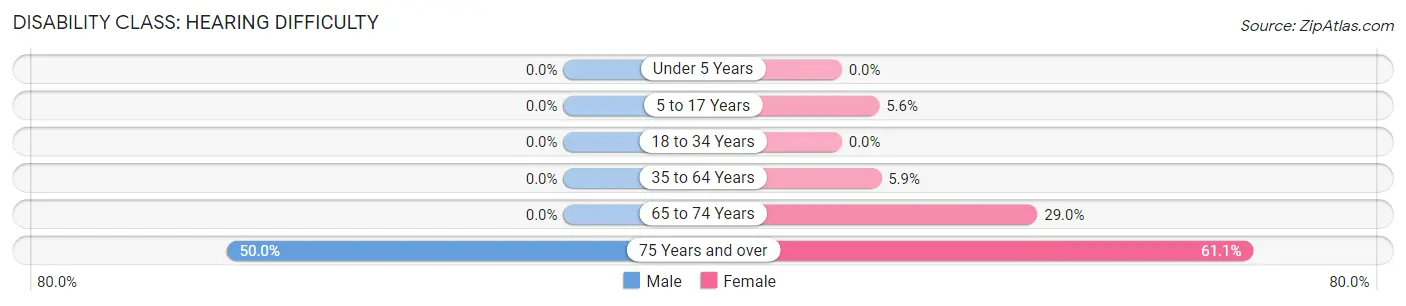
| Age Bracket | Male | Female |
| Under 5 Years | 0 (0.0%) | 0 (0.0%) |
| 5 to 17 Years | 0 (0.0%) | 2 (5.6%) |
| 18 to 34 Years | 0 (0.0%) | 0 (0.0%) |
| 35 to 64 Years | 0 (0.0%) | 10 (5.9%) |
| 65 to 74 Years | 0 (0.0%) | 9 (29.0%) |
| 75 Years and over | 3 (50.0%) | 33 (61.1%) |
Disability Class: Vision Difficulty
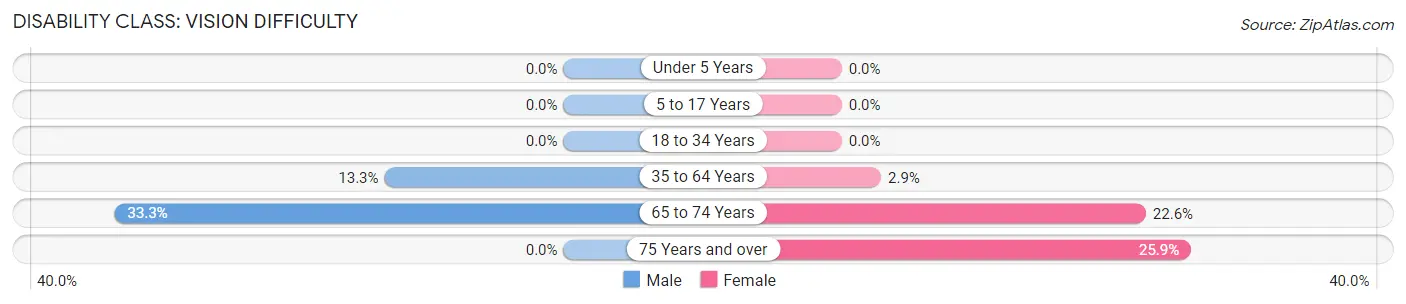
| Age Bracket | Male | Female |
| Under 5 Years | 0 (0.0%) | 0 (0.0%) |
| 5 to 17 Years | 0 (0.0%) | 0 (0.0%) |
| 18 to 34 Years | 0 (0.0%) | 0 (0.0%) |
| 35 to 64 Years | 19 (13.3%) | 5 (2.9%) |
| 65 to 74 Years | 6 (33.3%) | 7 (22.6%) |
| 75 Years and over | 0 (0.0%) | 14 (25.9%) |
Disability Class: Cognitive Difficulty
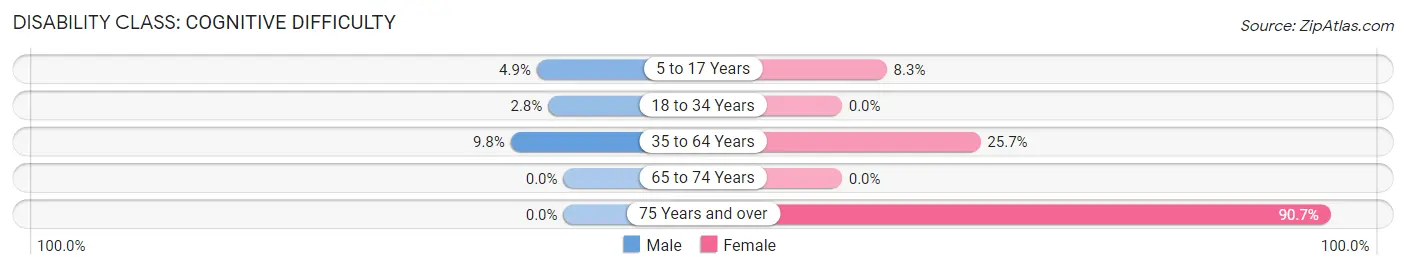
| Age Bracket | Male | Female |
| 5 to 17 Years | 4 (4.9%) | 3 (8.3%) |
| 18 to 34 Years | 3 (2.8%) | 0 (0.0%) |
| 35 to 64 Years | 14 (9.8%) | 44 (25.7%) |
| 65 to 74 Years | 0 (0.0%) | 0 (0.0%) |
| 75 Years and over | 0 (0.0%) | 49 (90.7%) |
Disability Class: Ambulatory Difficulty
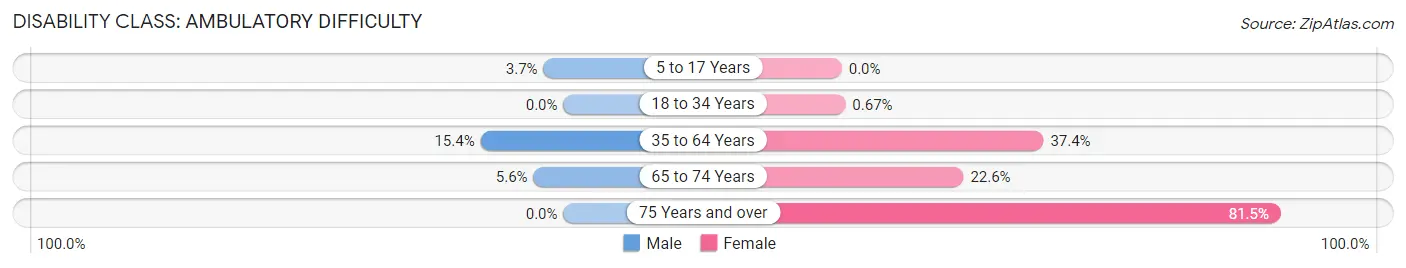
| Age Bracket | Male | Female |
| 5 to 17 Years | 3 (3.7%) | 0 (0.0%) |
| 18 to 34 Years | 0 (0.0%) | 1 (0.7%) |
| 35 to 64 Years | 22 (15.4%) | 64 (37.4%) |
| 65 to 74 Years | 1 (5.6%) | 7 (22.6%) |
| 75 Years and over | 0 (0.0%) | 44 (81.5%) |
Disability Class: Self-Care Difficulty
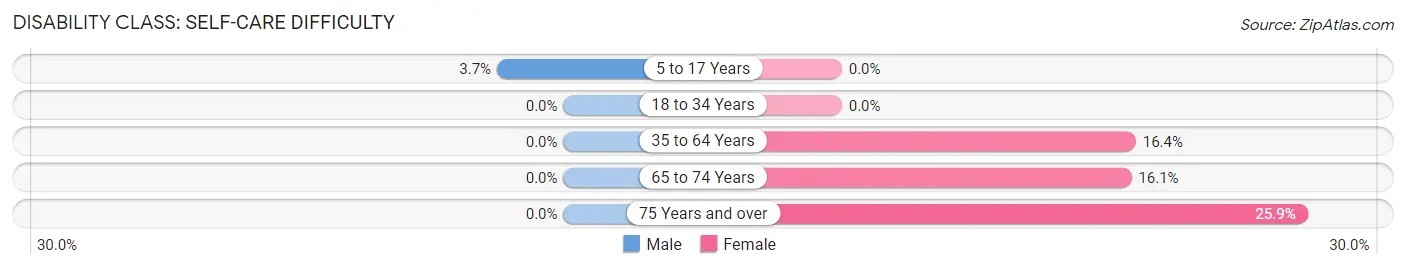
| Age Bracket | Male | Female |
| 5 to 17 Years | 3 (3.7%) | 0 (0.0%) |
| 18 to 34 Years | 0 (0.0%) | 0 (0.0%) |
| 35 to 64 Years | 0 (0.0%) | 28 (16.4%) |
| 65 to 74 Years | 0 (0.0%) | 5 (16.1%) |
| 75 Years and over | 0 (0.0%) | 14 (25.9%) |
Technology Access in Moscow
Computing Device Access in Moscow
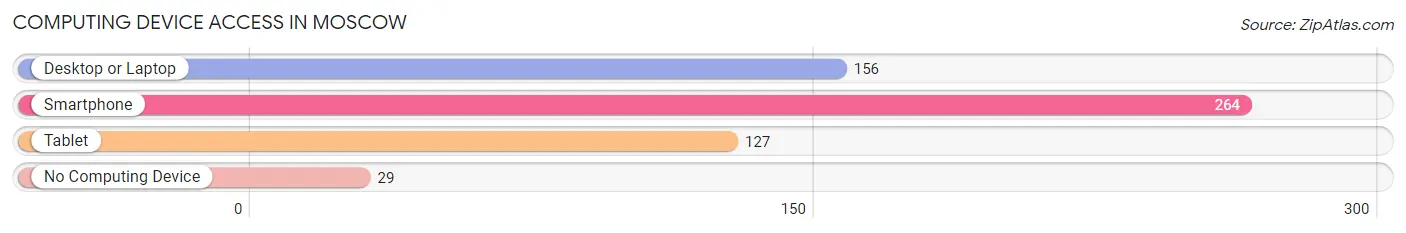
| Device Type | # Households | % Households |
| Desktop or Laptop | 156 | 53.1% |
| Smartphone | 264 | 89.8% |
| Tablet | 127 | 43.2% |
| No Computing Device | 29 | 9.9% |
| Total | 294 | 100.0% |
Internet Access in Moscow
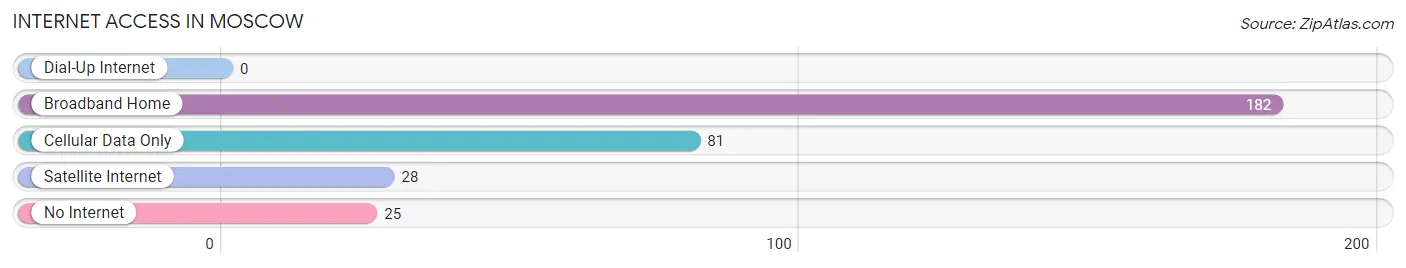
| Internet Type | # Households | % Households |
| Dial-Up Internet | 0 | 0.0% |
| Broadband Home | 182 | 61.9% |
| Cellular Data Only | 81 | 27.6% |
| Satellite Internet | 28 | 9.5% |
| No Internet | 25 | 8.5% |
| Total | 294 | 100.0% |
Moscow Summary
Moscow is a city located in the state of Tennessee, United States. It is located in the southeastern part of the state, about 25 miles from the state capital of Nashville. The city has a population of approximately 8,000 people and is part of the Nashville metropolitan area.
History
The area that is now Moscow was first settled in the early 1800s by settlers from North Carolina. The town was originally known as “Moscow Station” and was a stop on the Nashville and Chattanooga Railroad. The town was officially incorporated in 1887 and was named after the Russian city of Moscow.
In the early 1900s, the town was a major center for the production of cotton and tobacco. The town also had a large number of sawmills and gristmills. The town was also home to a number of churches and schools.
In the 1950s, the town began to experience a decline in population as many of the residents moved away to larger cities. The town was also affected by the construction of Interstate 24, which bypassed the town.
Geography
Moscow is located in the southeastern part of Tennessee, about 25 miles from the state capital of Nashville. The city is situated in a valley between two hills, and is surrounded by rolling hills and farmland. The city is located in the Nashville metropolitan area and is part of the Nashville-Davidson-Murfreesboro-Franklin Metropolitan Statistical Area.
The city has a total area of 2.2 square miles, all of which is land. The city is located at an elevation of 645 feet above sea level.
Economy
The economy of Moscow is largely based on agriculture and manufacturing. The city is home to a number of farms, which produce a variety of crops, including corn, soybeans, wheat, and hay. The city is also home to a number of manufacturing companies, which produce a variety of products, including furniture, clothing, and automotive parts.
The city is also home to a number of retail stores, restaurants, and other businesses. The city is also home to a number of medical facilities, including a hospital and several clinics.
Demographics
As of the 2010 census, the population of Moscow was 8,000. The racial makeup of the city was 79.3% White, 17.2% African American, 0.3% Native American, 0.7% Asian, 0.1% Pacific Islander, and 2.4% from other races. Hispanic or Latino of any race were 2.7% of the population.
The median household income in the city was $37,917, and the median family income was $45,938. The per capita income in the city was $19,945. About 15.3% of the population was below the poverty line.
Conclusion
Moscow is a city located in the southeastern part of Tennessee, about 25 miles from the state capital of Nashville. The city has a population of approximately 8,000 people and is part of the Nashville metropolitan area. The economy of the city is largely based on agriculture and manufacturing, and the city is home to a number of retail stores, restaurants, and other businesses. The racial makeup of the city is 79.3% White, 17.2% African American, 0.3% Native American, 0.7% Asian, 0.1% Pacific Islander, and 2.4% from other races. The median household income in the city was $37,917, and the median family income was $45,938.
Common Questions
What is Per Capita Income in Moscow?
Per Capita income in Moscow is $23,334.
What is the Median Family Income in Moscow?
Median Family Income in Moscow is $48,333.
What is the Median Household income in Moscow?
Median Household Income in Moscow is $45,938.
What is Income or Wage Gap in Moscow?
Income or Wage Gap in Moscow is 16.2%.
Women in Moscow earn 83.8 cents for every dollar earned by a man.
What is Inequality or Gini Index in Moscow?
Inequality or Gini Index in Moscow is 0.38.
What is the Total Population of Moscow?
Total Population of Moscow is 832.
What is the Total Male Population of Moscow?
Total Male Population of Moscow is 367.
What is the Total Female Population of Moscow?
Total Female Population of Moscow is 465.
What is the Ratio of Males per 100 Females in Moscow?
There are 78.92 Males per 100 Females in Moscow.
What is the Ratio of Females per 100 Males in Moscow?
There are 126.70 Females per 100 Males in Moscow.
What is the Median Population Age in Moscow?
Median Population Age in Moscow is 35.4 Years.
What is the Average Family Size in Moscow
Average Family Size in Moscow is 3.8 People.
What is the Average Household Size in Moscow
Average Household Size in Moscow is 2.8 People.
How Large is the Labor Force in Moscow?
There are 422 People in the Labor Forcein in Moscow.
What is the Percentage of People in the Labor Force in Moscow?
60.0% of People are in the Labor Force in Moscow.
What is the Unemployment Rate in Moscow?
Unemployment Rate in Moscow is 9.7%.