Rossville, TN Map & Demographics
Rossville Map
Rossville Overview
$54,382
PER CAPITA INCOME
$145,188
AVG FAMILY INCOME
$117,500
AVG HOUSEHOLD INCOME
30.2%
WAGE / INCOME GAP [ % ]
69.8¢/ $1
WAGE / INCOME GAP [ $ ]
0.37
INEQUALITY / GINI INDEX
1,185
TOTAL POPULATION
570
MALE POPULATION
615
FEMALE POPULATION
92.68
MALES / 100 FEMALES
107.89
FEMALES / 100 MALES
51.4
MEDIAN AGE
2.8
AVG FAMILY SIZE
2.4
AVG HOUSEHOLD SIZE
712
LABOR FORCE [ PEOPLE ]
69.1%
PERCENT IN LABOR FORCE
9.0%
UNEMPLOYMENT RATE
Rossville Zip Codes
Rossville Area Codes
Income in Rossville
Income Overview in Rossville
Per Capita Income in Rossville is $54,382, while median incomes of families and households are $145,188 and $117,500 respectively.
| Characteristic | Number | Measure |
| Per Capita Income | 1,185 | $54,382 |
| Median Family Income | 347 | $145,188 |
| Mean Family Income | 347 | $147,697 |
| Median Household Income | 488 | $117,500 |
| Mean Household Income | 488 | $127,242 |
| Income Deficit | 347 | $0 |
| Wage / Income Gap (%) | 1,185 | 30.16% |
| Wage / Income Gap ($) | 1,185 | 69.84¢ per $1 |
| Gini / Inequality Index | 1,185 | 0.37 |
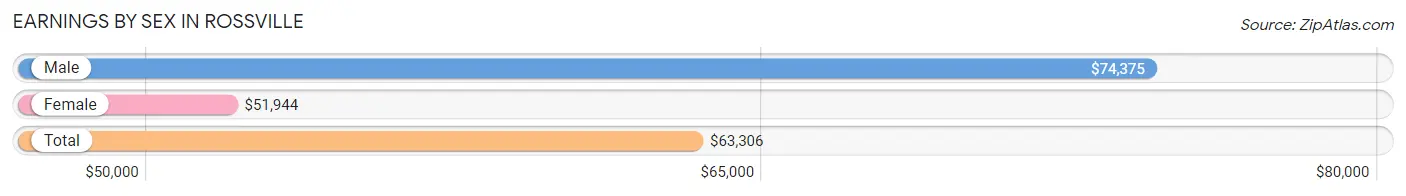
Earnings by Sex in Rossville
Average Earnings in Rossville are $63,306, $74,375 for men and $51,944 for women, a difference of 30.2%.
| Sex | Number | Average Earnings |
| Male | 334 (46.0%) | $74,375 |
| Female | 392 (54.0%) | $51,944 |
| Total | 726 (100.0%) | $63,306 |
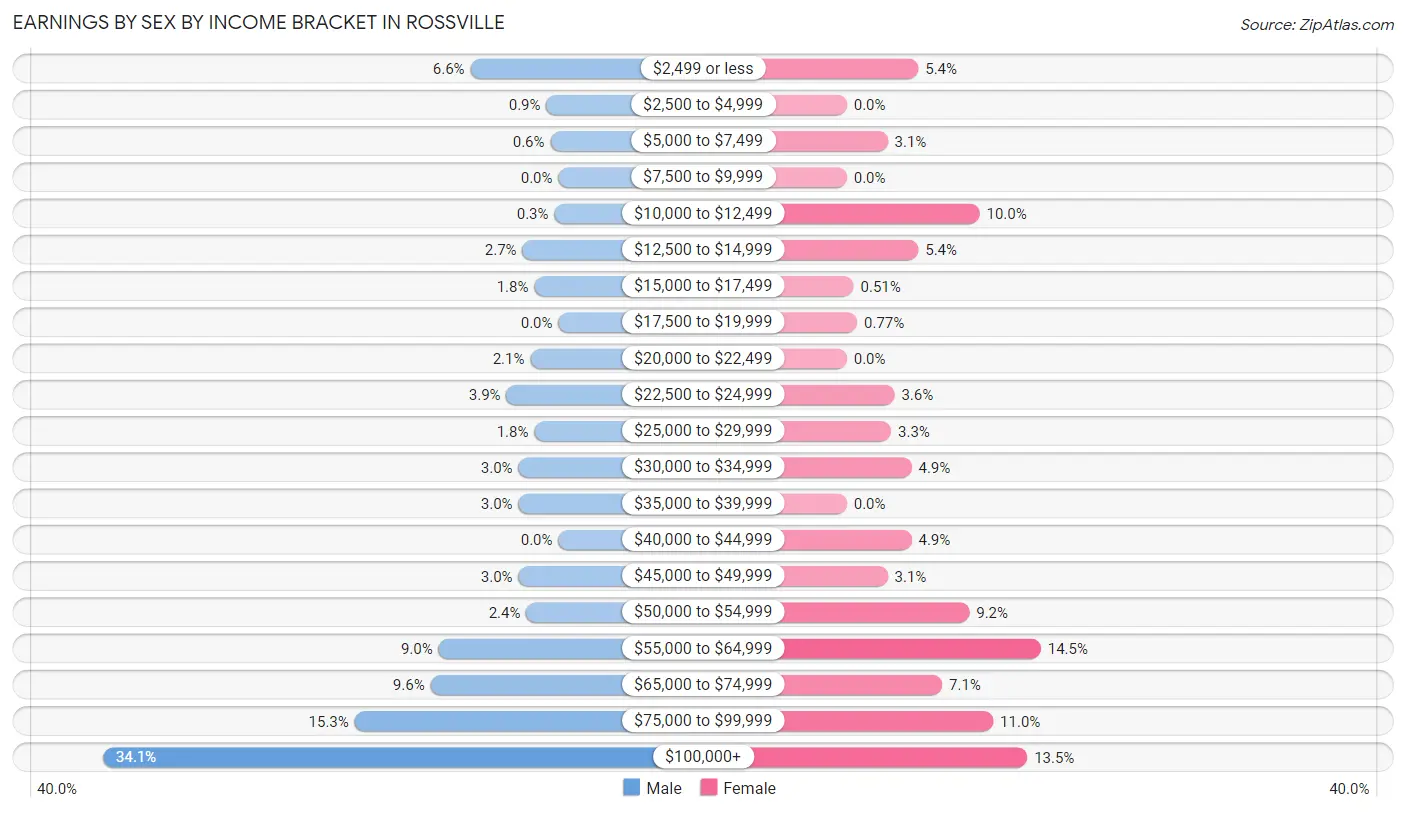
Earnings by Sex by Income Bracket in Rossville
The most common earnings brackets in Rossville are $100,000+ for men (114 | 34.1%) and $55,000 to $64,999 for women (57 | 14.5%).
| Income | Male | Female |
| $2,499 or less | 22 (6.6%) | 21 (5.4%) |
| $2,500 to $4,999 | 3 (0.9%) | 0 (0.0%) |
| $5,000 to $7,499 | 2 (0.6%) | 12 (3.1%) |
| $7,500 to $9,999 | 0 (0.0%) | 0 (0.0%) |
| $10,000 to $12,499 | 1 (0.3%) | 39 (10.0%) |
| $12,500 to $14,999 | 9 (2.7%) | 21 (5.4%) |
| $15,000 to $17,499 | 6 (1.8%) | 2 (0.5%) |
| $17,500 to $19,999 | 0 (0.0%) | 3 (0.8%) |
| $20,000 to $22,499 | 7 (2.1%) | 0 (0.0%) |
| $22,500 to $24,999 | 13 (3.9%) | 14 (3.6%) |
| $25,000 to $29,999 | 6 (1.8%) | 13 (3.3%) |
| $30,000 to $34,999 | 10 (3.0%) | 19 (4.9%) |
| $35,000 to $39,999 | 10 (3.0%) | 0 (0.0%) |
| $40,000 to $44,999 | 0 (0.0%) | 19 (4.9%) |
| $45,000 to $49,999 | 10 (3.0%) | 12 (3.1%) |
| $50,000 to $54,999 | 8 (2.4%) | 36 (9.2%) |
| $55,000 to $64,999 | 30 (9.0%) | 57 (14.5%) |
| $65,000 to $74,999 | 32 (9.6%) | 28 (7.1%) |
| $75,000 to $99,999 | 51 (15.3%) | 43 (11.0%) |
| $100,000+ | 114 (34.1%) | 53 (13.5%) |
| Total | 334 (100.0%) | 392 (100.0%) |
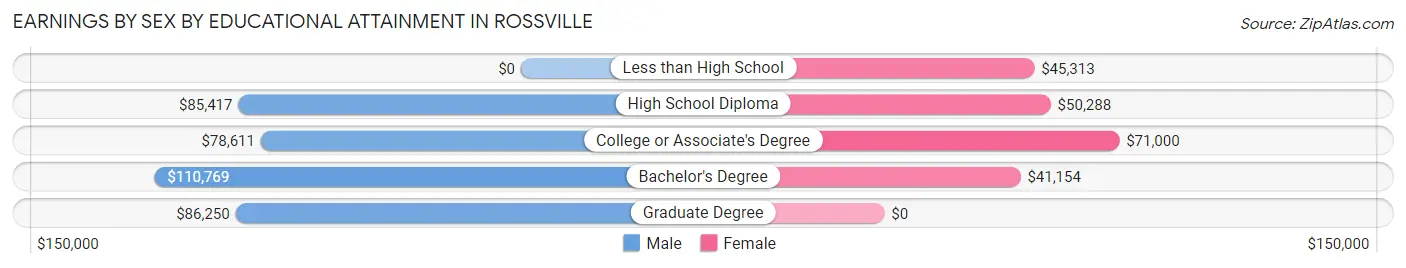
Earnings by Sex by Educational Attainment in Rossville
Average earnings in Rossville are $87,250 for men and $53,611 for women, a difference of 38.6%. Men with an educational attainment of bachelor's degree enjoy the highest average annual earnings of $110,769, while those with college or associate's degree education earn the least with $78,611. Women with an educational attainment of college or associate's degree earn the most with the average annual earnings of $71,000, while those with bachelor's degree education have the smallest earnings of $41,154.
| Educational Attainment | Male Income | Female Income |
| Less than High School | - | - |
| High School Diploma | $85,417 | $50,288 |
| College or Associate's Degree | $78,611 | $71,000 |
| Bachelor's Degree | $110,769 | $41,154 |
| Graduate Degree | $86,250 | $0 |
| Total | $87,250 | $53,611 |
Family Income in Rossville
Family Income Brackets in Rossville
According to the Rossville family income data, there are 109 families falling into the $100,000 to $149,999 income range, which is the most common income bracket and makes up 31.4% of all families.
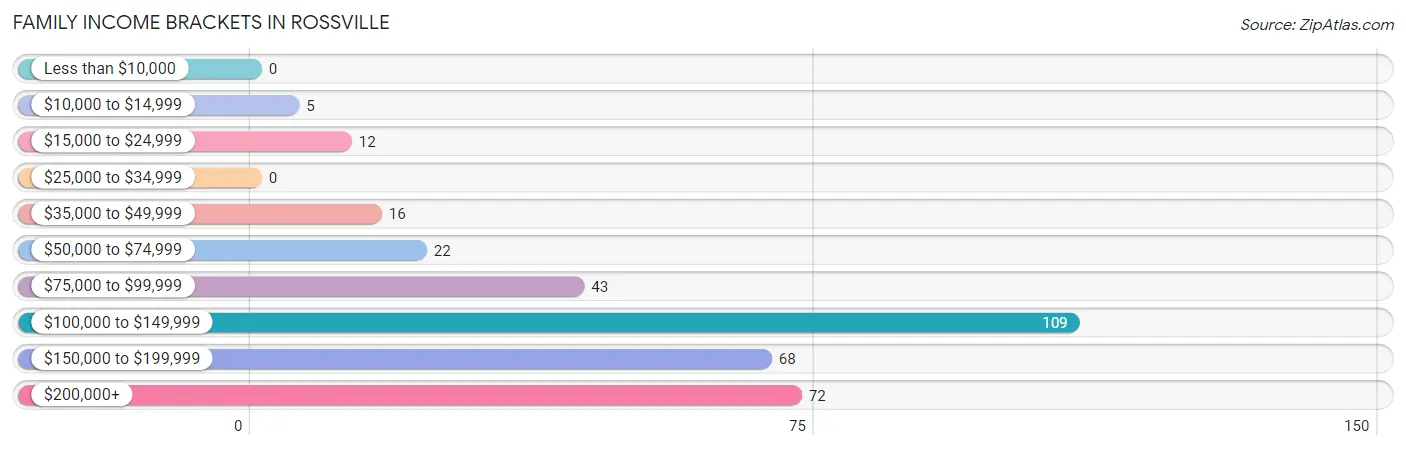
| Income Bracket | # Families | % Families |
| Less than $10,000 | 0 | 0.0% |
| $10,000 to $14,999 | 5 | 1.4% |
| $15,000 to $24,999 | 12 | 3.5% |
| $25,000 to $34,999 | 0 | 0.0% |
| $35,000 to $49,999 | 16 | 4.6% |
| $50,000 to $74,999 | 22 | 6.3% |
| $75,000 to $99,999 | 43 | 12.4% |
| $100,000 to $149,999 | 109 | 31.4% |
| $150,000 to $199,999 | 68 | 19.6% |
| $200,000+ | 72 | 20.7% |
Family Income by Famaliy Size in Rossville
4-person families (51 | 14.7%) account for the highest median family income in Rossville with $147,250 per family, while 2-person families (195 | 56.2%) have the highest median income of $68,438 per family member.
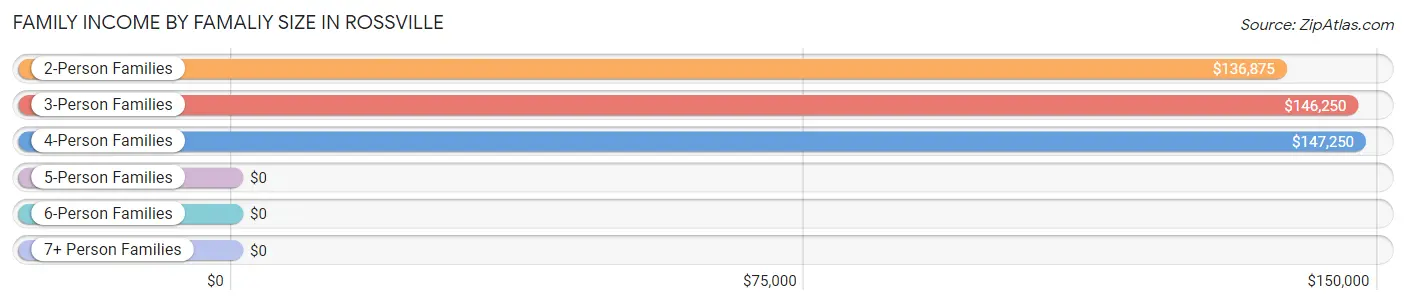
| Income Bracket | # Families | Median Income |
| 2-Person Families | 195 (56.2%) | $136,875 |
| 3-Person Families | 90 (25.9%) | $146,250 |
| 4-Person Families | 51 (14.7%) | $147,250 |
| 5-Person Families | 8 (2.3%) | $0 |
| 6-Person Families | 3 (0.9%) | $0 |
| 7+ Person Families | 0 (0.0%) | $0 |
| Total | 347 (100.0%) | $145,188 |
Family Income by Number of Earners in Rossville
The median family income in Rossville is $145,188, with families comprising 2 earners (168) having the highest median family income of $162,188, while families with no earners (42) have the lowest median family income of $87,500, accounting for 48.4% and 12.1% of families, respectively.
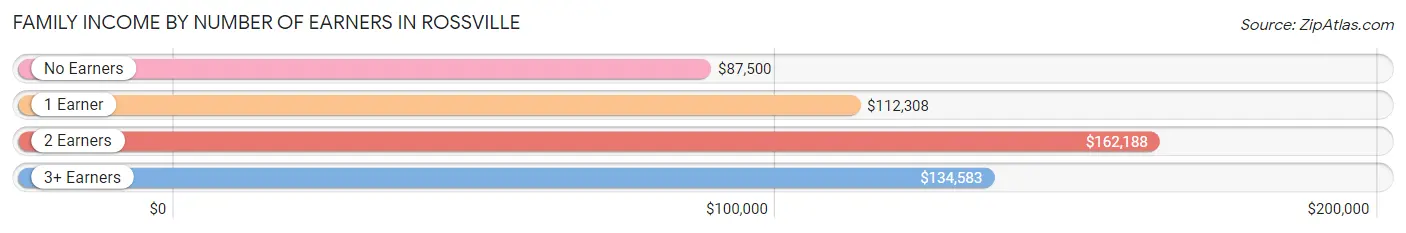
| Number of Earners | # Families | Median Income |
| No Earners | 42 (12.1%) | $87,500 |
| 1 Earner | 92 (26.5%) | $112,308 |
| 2 Earners | 168 (48.4%) | $162,188 |
| 3+ Earners | 45 (13.0%) | $134,583 |
| Total | 347 (100.0%) | $145,188 |
Household Income in Rossville
Household Income Brackets in Rossville
With 119 households falling in the category, the $100,000 to $149,999 income range is the most frequent in Rossville, accounting for 24.4% of all households. In contrast, only 5 households (1.0%) fall into the $10,000 to $14,999 income bracket, making it the least populous group.
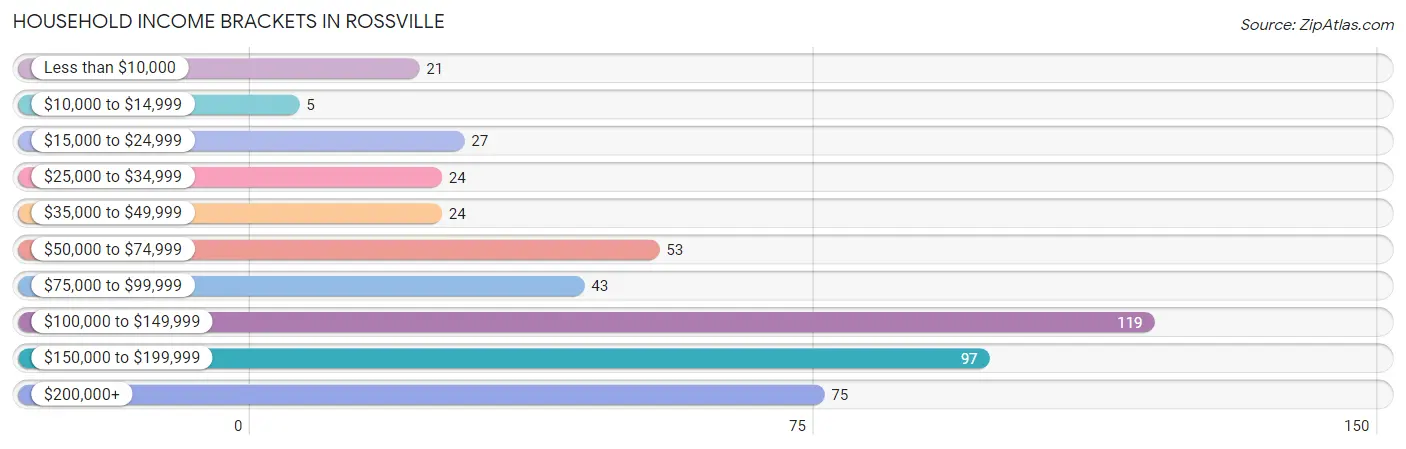
| Income Bracket | # Households | % Households |
| Less than $10,000 | 21 | 4.3% |
| $10,000 to $14,999 | 5 | 1.0% |
| $15,000 to $24,999 | 27 | 5.5% |
| $25,000 to $34,999 | 24 | 4.9% |
| $35,000 to $49,999 | 24 | 4.9% |
| $50,000 to $74,999 | 53 | 10.9% |
| $75,000 to $99,999 | 43 | 8.8% |
| $100,000 to $149,999 | 119 | 24.4% |
| $150,000 to $199,999 | 97 | 19.9% |
| $200,000+ | 75 | 15.4% |
Household Income by Householder Age in Rossville
The median household income in Rossville is $117,500, with the highest median household income of $151,250 found in the 45 to 64 years age bracket for the primary householder. A total of 242 households (49.6%) fall into this category. Meanwhile, the 15 to 24 years age bracket for the primary householder has the lowest median household income of $0, with 3 households (0.6%) in this group.
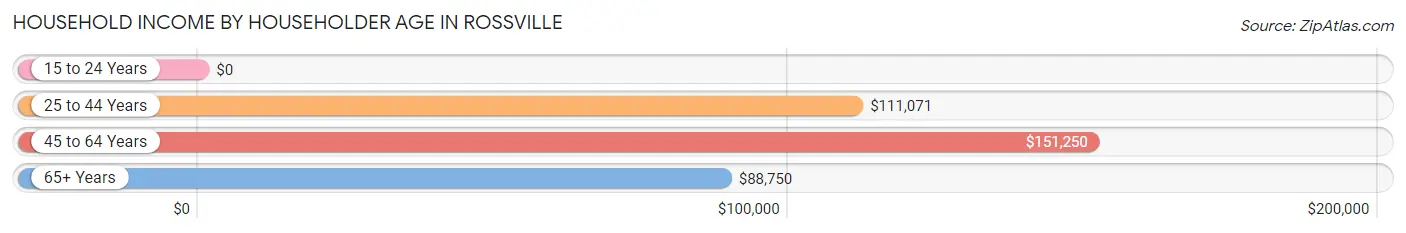
| Income Bracket | # Households | Median Income |
| 15 to 24 Years | 3 (0.6%) | $0 |
| 25 to 44 Years | 108 (22.1%) | $111,071 |
| 45 to 64 Years | 242 (49.6%) | $151,250 |
| 65+ Years | 135 (27.7%) | $88,750 |
| Total | 488 (100.0%) | $117,500 |
Poverty in Rossville
Income Below Poverty by Sex and Age in Rossville
With 7.2% poverty level for males and 7.4% for females among the residents of Rossville, 25 to 34 year old males and 25 to 34 year old females are the most vulnerable to poverty, with 18 males (30.5%) and 37 females (39.0%) in their respective age groups living below the poverty level.
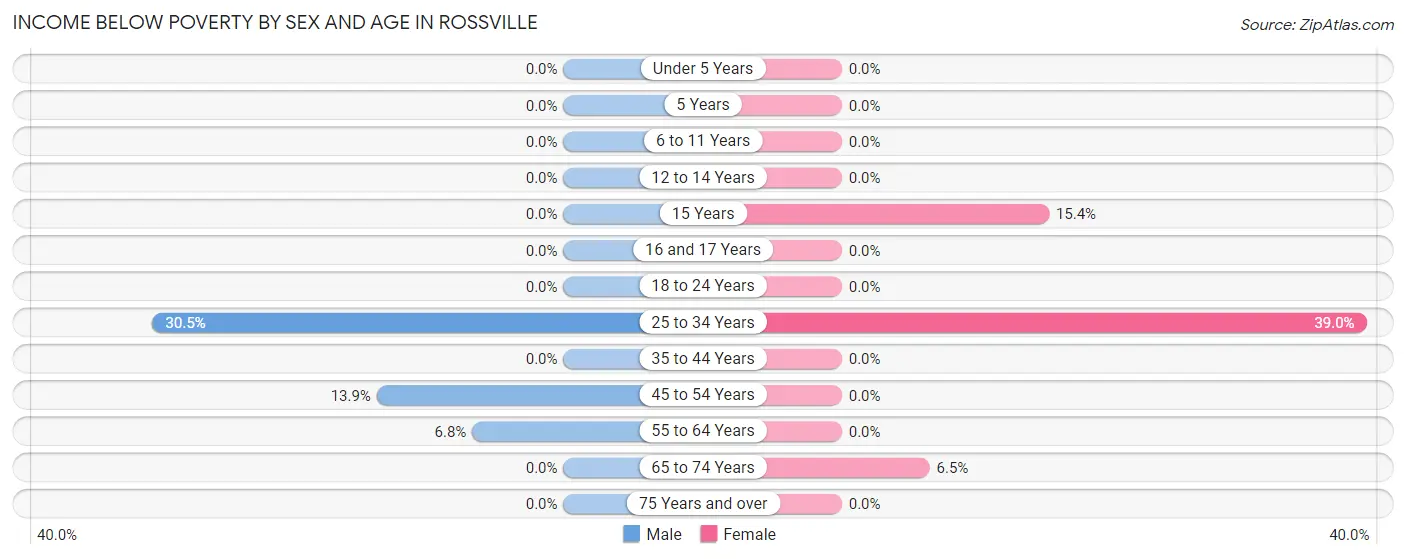
| Age Bracket | Male | Female |
| Under 5 Years | 0 (0.0%) | 0 (0.0%) |
| 5 Years | 0 (0.0%) | 0 (0.0%) |
| 6 to 11 Years | 0 (0.0%) | 0 (0.0%) |
| 12 to 14 Years | 0 (0.0%) | 0 (0.0%) |
| 15 Years | 0 (0.0%) | 2 (15.4%) |
| 16 and 17 Years | 0 (0.0%) | 0 (0.0%) |
| 18 to 24 Years | 0 (0.0%) | 0 (0.0%) |
| 25 to 34 Years | 18 (30.5%) | 37 (39.0%) |
| 35 to 44 Years | 0 (0.0%) | 0 (0.0%) |
| 45 to 54 Years | 14 (13.9%) | 0 (0.0%) |
| 55 to 64 Years | 9 (6.8%) | 0 (0.0%) |
| 65 to 74 Years | 0 (0.0%) | 6 (6.5%) |
| 75 Years and over | 0 (0.0%) | 0 (0.0%) |
| Total | 41 (7.2%) | 45 (7.4%) |
Income Above Poverty by Sex and Age in Rossville
According to the poverty statistics in Rossville, males aged under 5 years and females aged under 5 years are the age groups that are most secure financially, with 100.0% of males and 100.0% of females in these age groups living above the poverty line.
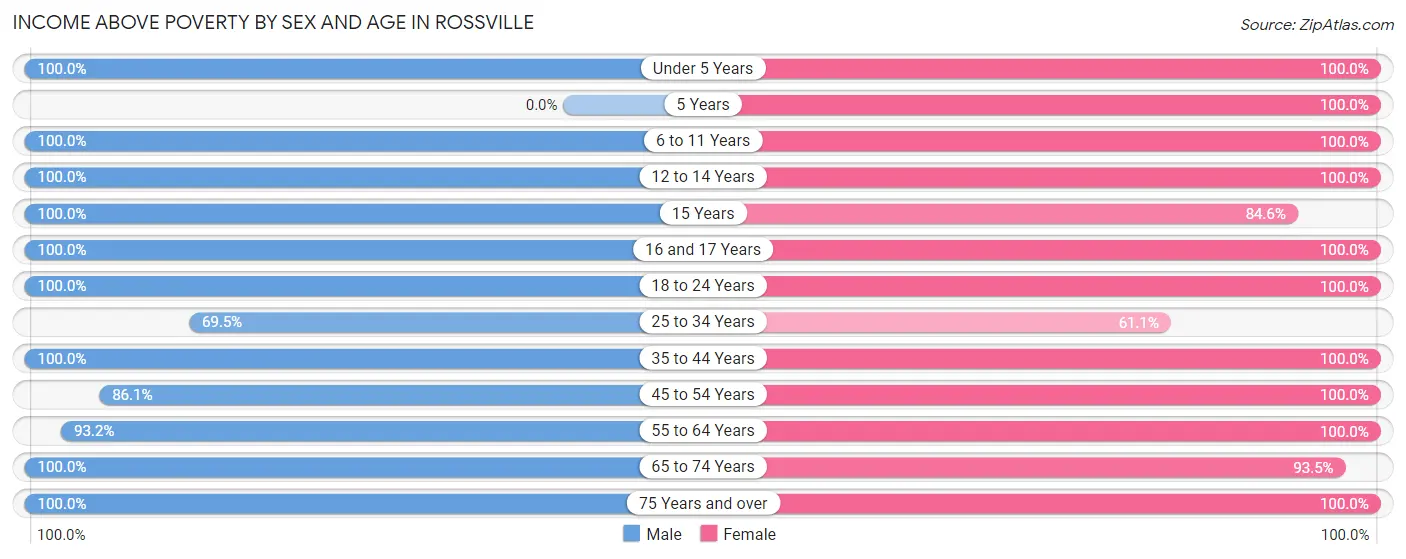
| Age Bracket | Male | Female |
| Under 5 Years | 38 (100.0%) | 9 (100.0%) |
| 5 Years | 0 (0.0%) | 3 (100.0%) |
| 6 to 11 Years | 8 (100.0%) | 24 (100.0%) |
| 12 to 14 Years | 15 (100.0%) | 17 (100.0%) |
| 15 Years | 19 (100.0%) | 11 (84.6%) |
| 16 and 17 Years | 4 (100.0%) | 3 (100.0%) |
| 18 to 24 Years | 42 (100.0%) | 34 (100.0%) |
| 25 to 34 Years | 41 (69.5%) | 58 (61.1%) |
| 35 to 44 Years | 41 (100.0%) | 61 (100.0%) |
| 45 to 54 Years | 87 (86.1%) | 96 (100.0%) |
| 55 to 64 Years | 124 (93.2%) | 141 (100.0%) |
| 65 to 74 Years | 83 (100.0%) | 86 (93.5%) |
| 75 Years and over | 23 (100.0%) | 23 (100.0%) |
| Total | 525 (92.8%) | 566 (92.6%) |
Income Below Poverty Among Married-Couple Families in Rossville
The poverty statistics for married-couple families in Rossville show that 1.7% or 5 of the total 292 families live below the poverty line. Families with no children have the highest poverty rate of 2.4%, comprising of 5 families. On the other hand, families with 1 or 2 children have the lowest poverty rate of 0.0%, which includes 0 families.
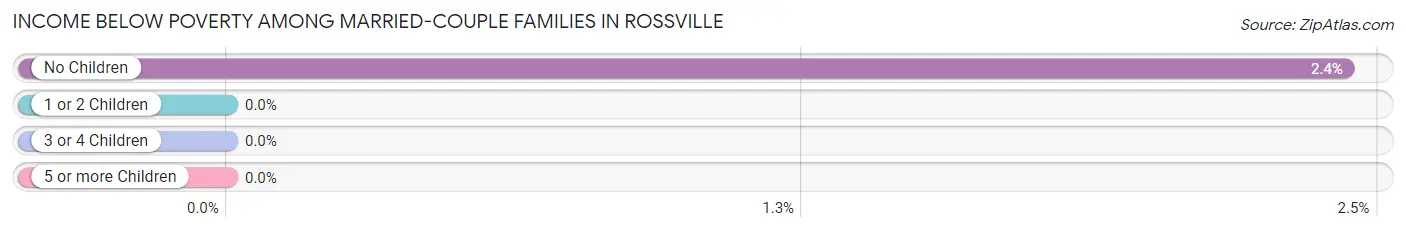
| Children | Above Poverty | Below Poverty |
| No Children | 201 (97.6%) | 5 (2.4%) |
| 1 or 2 Children | 83 (100.0%) | 0 (0.0%) |
| 3 or 4 Children | 3 (100.0%) | 0 (0.0%) |
| 5 or more Children | 0 (0.0%) | 0 (0.0%) |
| Total | 287 (98.3%) | 5 (1.7%) |
Income Below Poverty Among Single-Parent Households in Rossville
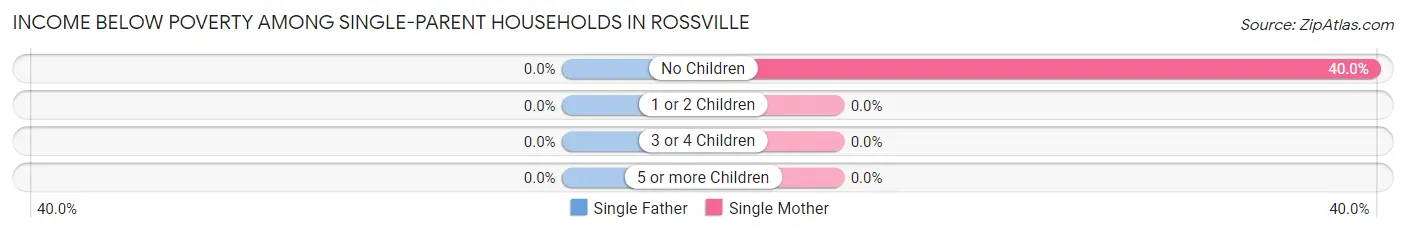
| Children | Single Father | Single Mother |
| No Children | 0 (0.0%) | 12 (40.0%) |
| 1 or 2 Children | 0 (0.0%) | 0 (0.0%) |
| 3 or 4 Children | 0 (0.0%) | 0 (0.0%) |
| 5 or more Children | 0 (0.0%) | 0 (0.0%) |
| Total | 0 (0.0%) | 12 (25.5%) |
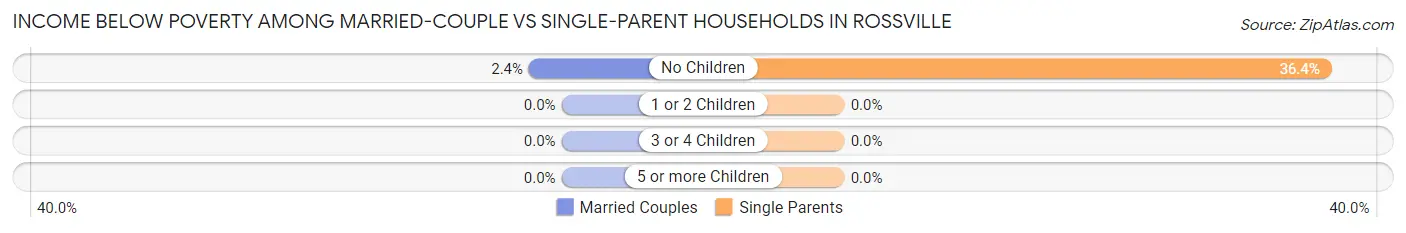
Income Below Poverty Among Married-Couple vs Single-Parent Households in Rossville
The poverty data for Rossville shows that 5 of the married-couple family households (1.7%) and 12 of the single-parent households (21.8%) are living below the poverty level. Within the married-couple family households, those with no children have the highest poverty rate, with 5 households (2.4%) falling below the poverty line. Among the single-parent households, those with no children have the highest poverty rate, with 12 household (36.4%) living below poverty.
| Children | Married-Couple Families | Single-Parent Households |
| No Children | 5 (2.4%) | 12 (36.4%) |
| 1 or 2 Children | 0 (0.0%) | 0 (0.0%) |
| 3 or 4 Children | 0 (0.0%) | 0 (0.0%) |
| 5 or more Children | 0 (0.0%) | 0 (0.0%) |
| Total | 5 (1.7%) | 12 (21.8%) |
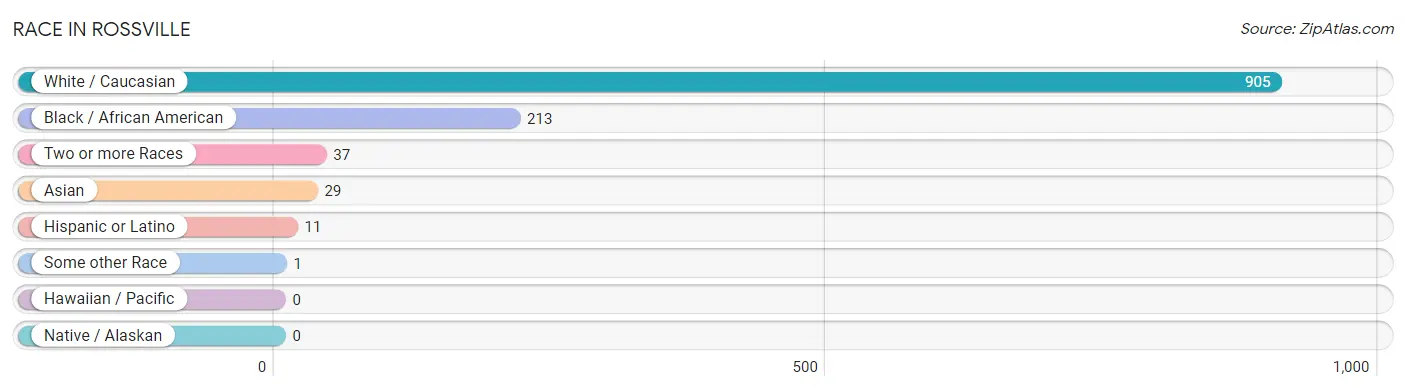
Race in Rossville
The most populous races in Rossville are White / Caucasian (905 | 76.4%), Black / African American (213 | 18.0%), and Two or more Races (37 | 3.1%).
| Race | # Population | % Population |
| Asian | 29 | 2.5% |
| Black / African American | 213 | 18.0% |
| Hawaiian / Pacific | 0 | 0.0% |
| Hispanic or Latino | 11 | 0.9% |
| Native / Alaskan | 0 | 0.0% |
| White / Caucasian | 905 | 76.4% |
| Two or more Races | 37 | 3.1% |
| Some other Race | 1 | 0.1% |
| Total | 1,185 | 100.0% |
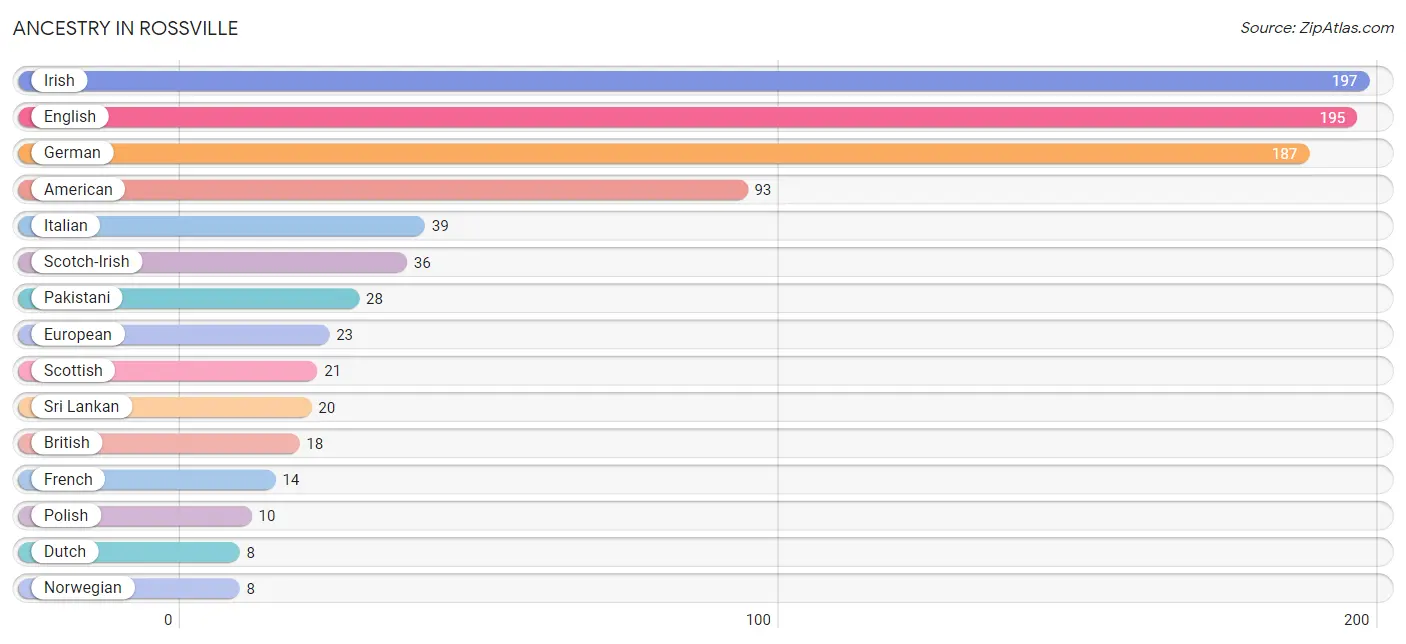
Ancestry in Rossville
The most populous ancestries reported in Rossville are Irish (197 | 16.6%), English (195 | 16.5%), German (187 | 15.8%), American (93 | 7.9%), and Italian (39 | 3.3%), together accounting for 60.0% of all Rossville residents.
| Ancestry | # Population | % Population |
| American | 93 | 7.9% |
| Arab | 4 | 0.3% |
| British | 18 | 1.5% |
| Burmese | 2 | 0.2% |
| Central American | 1 | 0.1% |
| Cherokee | 1 | 0.1% |
| Costa Rican | 1 | 0.1% |
| Czech | 5 | 0.4% |
| Czechoslovakian | 1 | 0.1% |
| Dutch | 8 | 0.7% |
| Eastern European | 7 | 0.6% |
| English | 195 | 16.5% |
| European | 23 | 1.9% |
| French | 14 | 1.2% |
| German | 187 | 15.8% |
| Greek | 5 | 0.4% |
| Iranian | 1 | 0.1% |
| Irish | 197 | 16.6% |
| Italian | 39 | 3.3% |
| Lebanese | 4 | 0.3% |
| Mexican | 6 | 0.5% |
| Norwegian | 8 | 0.7% |
| Pakistani | 28 | 2.4% |
| Polish | 10 | 0.8% |
| Portuguese | 1 | 0.1% |
| Scandinavian | 3 | 0.3% |
| Scotch-Irish | 36 | 3.0% |
| Scottish | 21 | 1.8% |
| South American | 4 | 0.3% |
| Sri Lankan | 20 | 1.7% |
| Swedish | 2 | 0.2% |
| Venezuelan | 4 | 0.3% | View All 32 Rows |
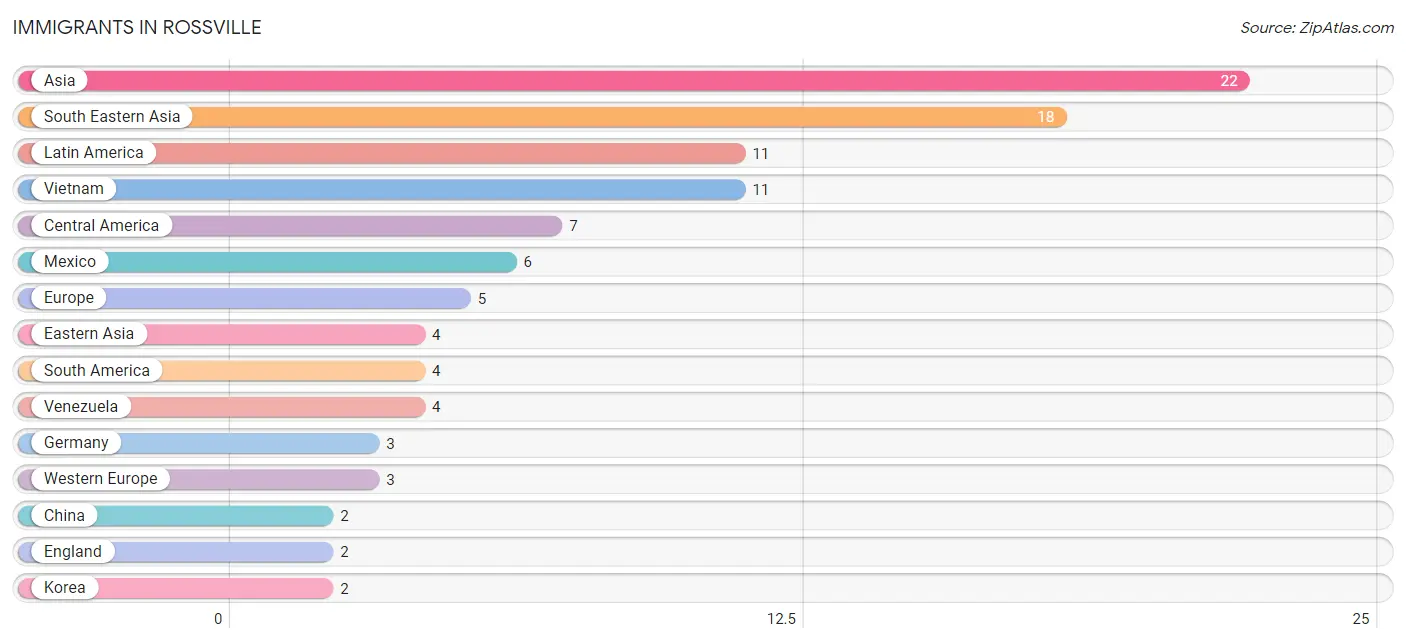
Immigrants in Rossville
The most numerous immigrant groups reported in Rossville came from Asia (22 | 1.9%), South Eastern Asia (18 | 1.5%), Latin America (11 | 0.9%), Vietnam (11 | 0.9%), and Central America (7 | 0.6%), together accounting for 5.8% of all Rossville residents.
| Immigration Origin | # Population | % Population |
| Asia | 22 | 1.9% |
| Central America | 7 | 0.6% |
| China | 2 | 0.2% |
| Costa Rica | 1 | 0.1% |
| Eastern Asia | 4 | 0.3% |
| England | 2 | 0.2% |
| Europe | 5 | 0.4% |
| Germany | 3 | 0.3% |
| Korea | 2 | 0.2% |
| Latin America | 11 | 0.9% |
| Mexico | 6 | 0.5% |
| Northern Europe | 2 | 0.2% |
| South America | 4 | 0.3% |
| South Eastern Asia | 18 | 1.5% |
| Venezuela | 4 | 0.3% |
| Vietnam | 11 | 0.9% |
| Western Europe | 3 | 0.3% | View All 17 Rows |
Sex and Age in Rossville
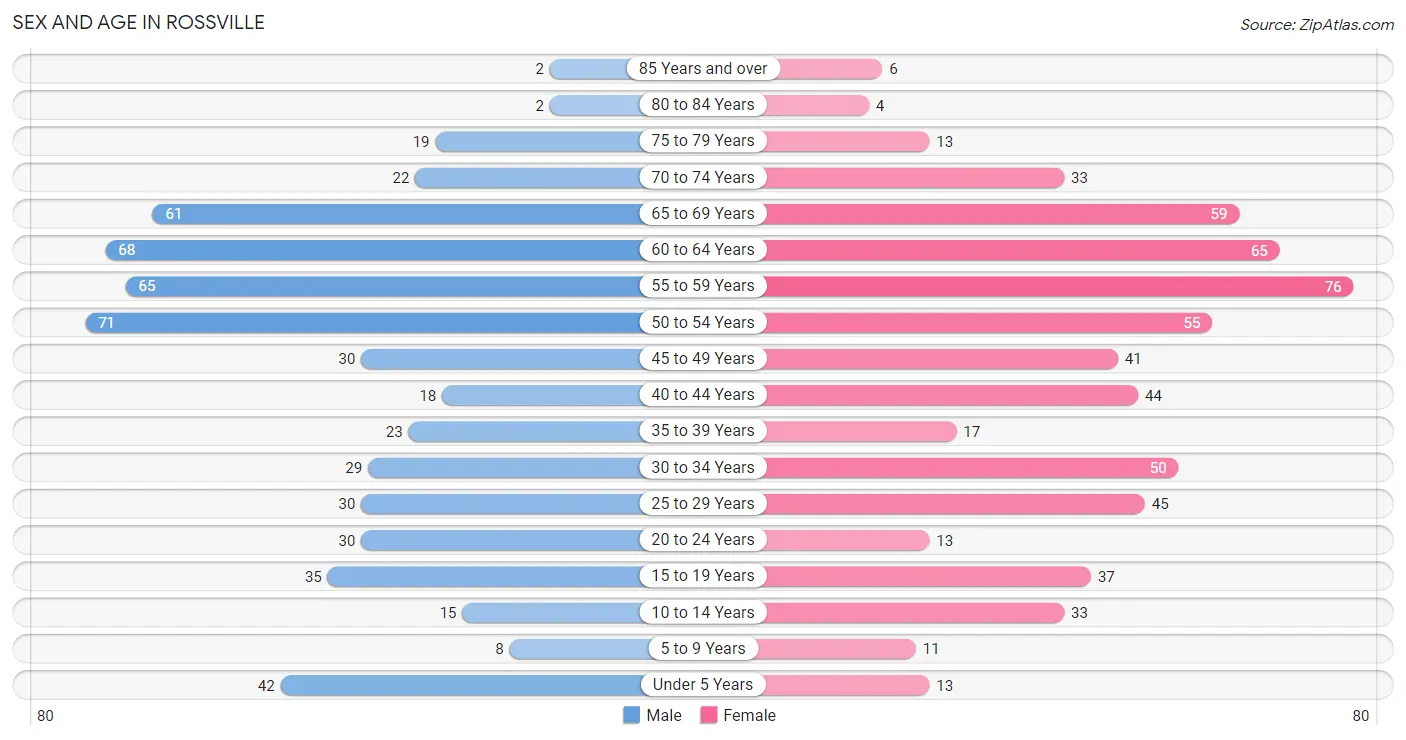
Sex and Age in Rossville
The most populous age groups in Rossville are 50 to 54 Years (71 | 12.5%) for men and 55 to 59 Years (76 | 12.4%) for women.
| Age Bracket | Male | Female |
| Under 5 Years | 42 (7.4%) | 13 (2.1%) |
| 5 to 9 Years | 8 (1.4%) | 11 (1.8%) |
| 10 to 14 Years | 15 (2.6%) | 33 (5.4%) |
| 15 to 19 Years | 35 (6.1%) | 37 (6.0%) |
| 20 to 24 Years | 30 (5.3%) | 13 (2.1%) |
| 25 to 29 Years | 30 (5.3%) | 45 (7.3%) |
| 30 to 34 Years | 29 (5.1%) | 50 (8.1%) |
| 35 to 39 Years | 23 (4.0%) | 17 (2.8%) |
| 40 to 44 Years | 18 (3.2%) | 44 (7.1%) |
| 45 to 49 Years | 30 (5.3%) | 41 (6.7%) |
| 50 to 54 Years | 71 (12.5%) | 55 (8.9%) |
| 55 to 59 Years | 65 (11.4%) | 76 (12.4%) |
| 60 to 64 Years | 68 (11.9%) | 65 (10.6%) |
| 65 to 69 Years | 61 (10.7%) | 59 (9.6%) |
| 70 to 74 Years | 22 (3.9%) | 33 (5.4%) |
| 75 to 79 Years | 19 (3.3%) | 13 (2.1%) |
| 80 to 84 Years | 2 (0.4%) | 4 (0.6%) |
| 85 Years and over | 2 (0.4%) | 6 (1.0%) |
| Total | 570 (100.0%) | 615 (100.0%) |
Families and Households in Rossville
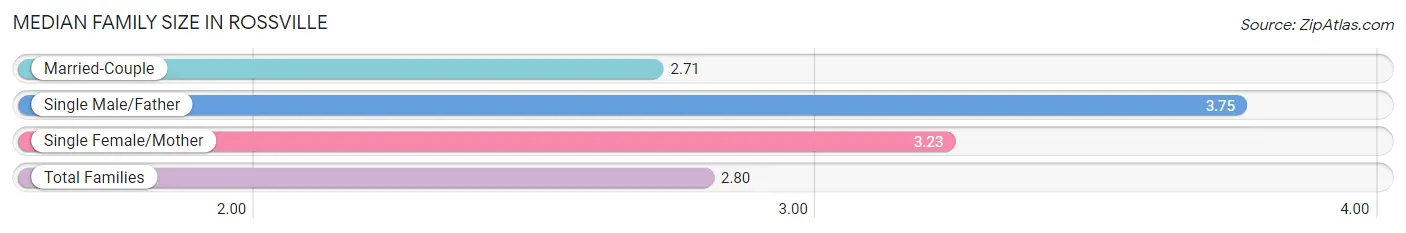
Median Family Size in Rossville
The median family size in Rossville is 2.80 persons per family, with single male/father families (8 | 2.3%) accounting for the largest median family size of 3.75 persons per family. On the other hand, married-couple families (292 | 84.2%) represent the smallest median family size with 2.71 persons per family.
| Family Type | # Families | Family Size |
| Married-Couple | 292 (84.2%) | 2.71 |
| Single Male/Father | 8 (2.3%) | 3.75 |
| Single Female/Mother | 47 (13.5%) | 3.23 |
| Total Families | 347 (100.0%) | 2.80 |
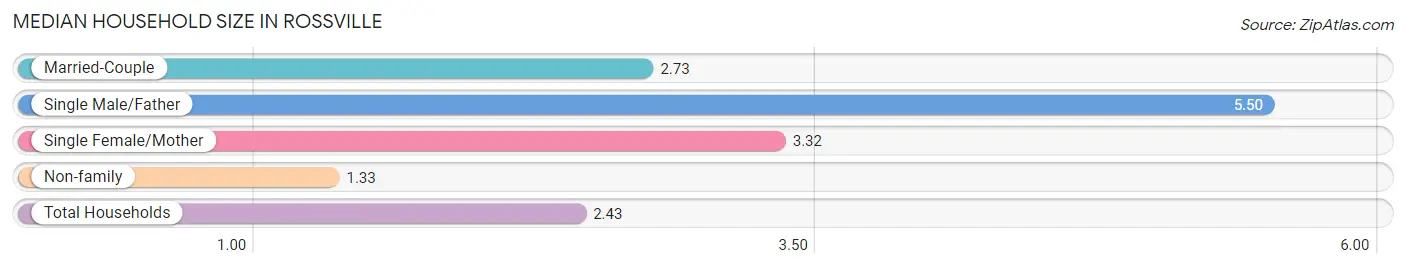
Median Household Size in Rossville
The median household size in Rossville is 2.43 persons per household, with single male/father households (8 | 1.6%) accounting for the largest median household size of 5.5 persons per household. non-family households (141 | 28.9%) represent the smallest median household size with 1.33 persons per household.
| Household Type | # Households | Household Size |
| Married-Couple | 292 (59.8%) | 2.73 |
| Single Male/Father | 8 (1.6%) | 5.50 |
| Single Female/Mother | 47 (9.6%) | 3.32 |
| Non-family | 141 (28.9%) | 1.33 |
| Total Households | 488 (100.0%) | 2.43 |
Household Size by Marriage Status in Rossville
Out of a total of 488 households in Rossville, 347 (71.1%) are family households, while 141 (28.9%) are nonfamily households. The most numerous type of family households are 2-person households, comprising 185, and the most common type of nonfamily households are 1-person households, comprising 109.
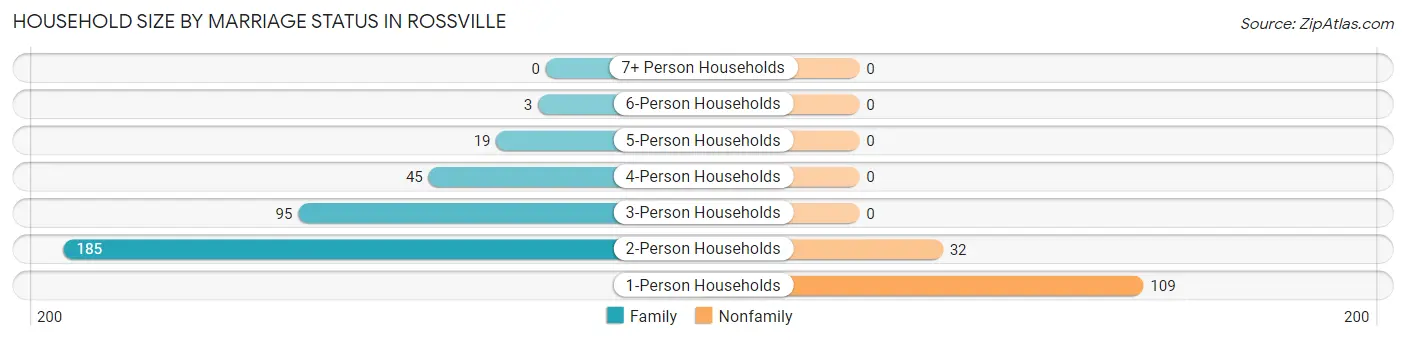
| Household Size | Family Households | Nonfamily Households |
| 1-Person Households | - | 109 (22.3%) |
| 2-Person Households | 185 (37.9%) | 32 (6.6%) |
| 3-Person Households | 95 (19.5%) | 0 (0.0%) |
| 4-Person Households | 45 (9.2%) | 0 (0.0%) |
| 5-Person Households | 19 (3.9%) | 0 (0.0%) |
| 6-Person Households | 3 (0.6%) | 0 (0.0%) |
| 7+ Person Households | 0 (0.0%) | 0 (0.0%) |
| Total | 347 (71.1%) | 141 (28.9%) |
Female Fertility in Rossville
Fertility by Age in Rossville
Average fertility rate in Rossville is 89.0 births per 1,000 women. Women in the age bracket of 20 to 34 years have the highest fertility rate with 148.0 births per 1,000 women. Women in the age bracket of 20 to 34 years acount for 69.6% of all women with births.
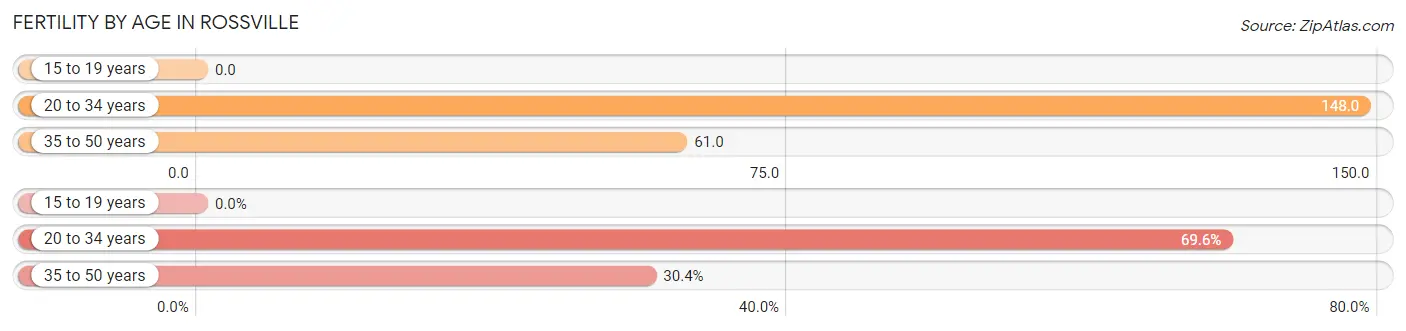
| Age Bracket | Women with Births | Births / 1,000 Women |
| 15 to 19 years | 0 (0.0%) | 0.0 |
| 20 to 34 years | 16 (69.6%) | 148.0 |
| 35 to 50 years | 7 (30.4%) | 61.0 |
| Total | 23 (100.0%) | 89.0 |
Fertility by Age by Marriage Status in Rossville
73.9% of women with births (23) in Rossville are married. The highest percentage of unmarried women with births falls into 20 to 34 years age bracket with 37.5% of them unmarried at the time of birth, while the lowest percentage of unmarried women with births belong to 35 to 50 years age bracket with 0.0% of them unmarried.
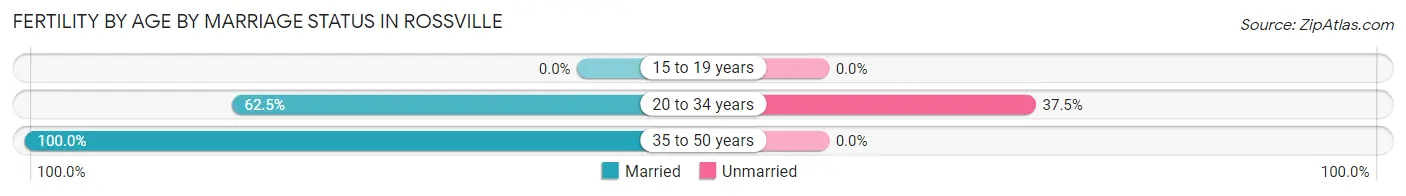
| Age Bracket | Married | Unmarried |
| 15 to 19 years | 0 (0.0%) | 0 (0.0%) |
| 20 to 34 years | 10 (62.5%) | 6 (37.5%) |
| 35 to 50 years | 7 (100.0%) | 0 (0.0%) |
| Total | 17 (73.9%) | 6 (26.1%) |
Fertility by Education in Rossville
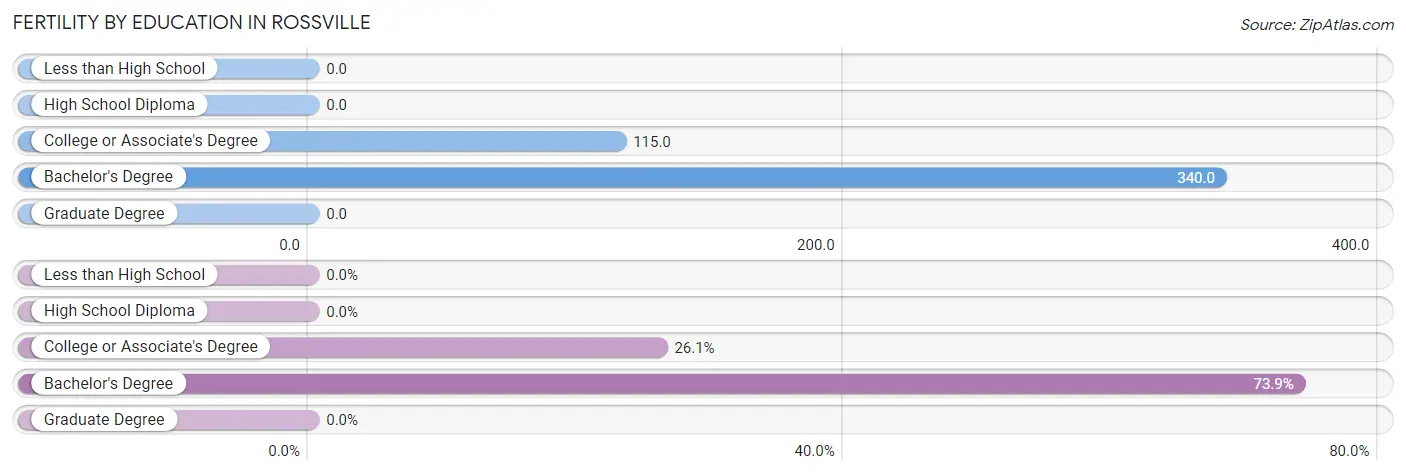
| Educational Attainment | Women with Births | Births / 1,000 Women |
| Less than High School | 0 (0.0%) | 0.0 |
| High School Diploma | 0 (0.0%) | 0.0 |
| College or Associate's Degree | 6 (26.1%) | 115.0 |
| Bachelor's Degree | 17 (73.9%) | 340.0 |
| Graduate Degree | 0 (0.0%) | 0.0 |
| Total | 23 (100.0%) | 89.0 |
Fertility by Education by Marriage Status in Rossville
26.1% of women with births in Rossville are unmarried. Women with the educational attainment of bachelor's degree are most likely to be married with 100.0% of them married at childbirth, while women with the educational attainment of college or associate's degree are least likely to be married with 100.0% of them unmarried at childbirth.
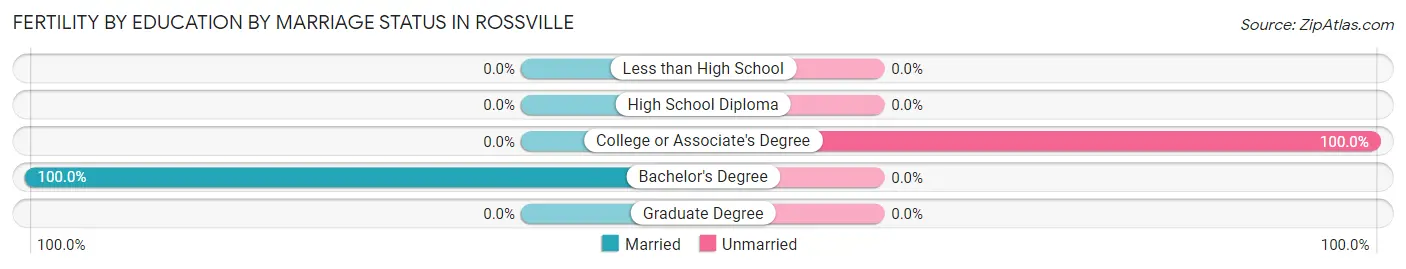
| Educational Attainment | Married | Unmarried |
| Less than High School | 0 (0.0%) | 0 (0.0%) |
| High School Diploma | 0 (0.0%) | 0 (0.0%) |
| College or Associate's Degree | 0 (0.0%) | 6 (100.0%) |
| Bachelor's Degree | 17 (100.0%) | 0 (0.0%) |
| Graduate Degree | 0 (0.0%) | 0 (0.0%) |
| Total | 17 (73.9%) | 6 (26.1%) |
Employment Characteristics in Rossville
Employment by Class of Employer in Rossville
Among the 644 employed individuals in Rossville, private company employees (408 | 63.3%), local government employees (92 | 14.3%), and self-employed (not incorporated) (51 | 7.9%) make up the most common classes of employment.
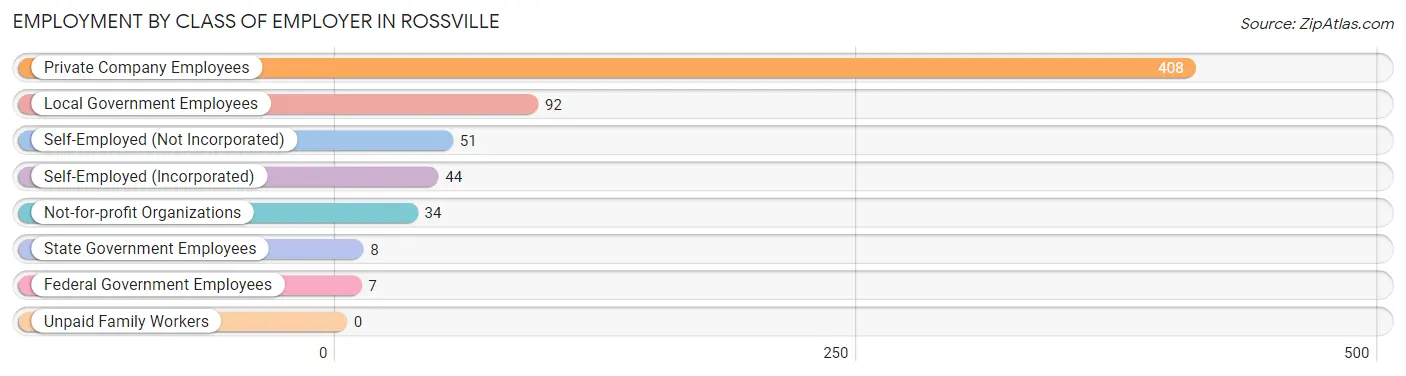
| Employer Class | # Employees | % Employees |
| Private Company Employees | 408 | 63.3% |
| Self-Employed (Incorporated) | 44 | 6.8% |
| Self-Employed (Not Incorporated) | 51 | 7.9% |
| Not-for-profit Organizations | 34 | 5.3% |
| Local Government Employees | 92 | 14.3% |
| State Government Employees | 8 | 1.2% |
| Federal Government Employees | 7 | 1.1% |
| Unpaid Family Workers | 0 | 0.0% |
| Total | 644 | 100.0% |
Employment Status by Age in Rossville
According to the labor force statistics for Rossville, out of the total population over 16 years of age (1,031), 69.1% or 712 individuals are in the labor force, with 9.0% or 64 of them unemployed. The age group with the highest labor force participation rate is 25 to 29 years, with 94.7% or 71 individuals in the labor force. Within the labor force, the 25 to 29 years age range has the highest percentage of unemployed individuals, with 60.6% or 43 of them being unemployed.
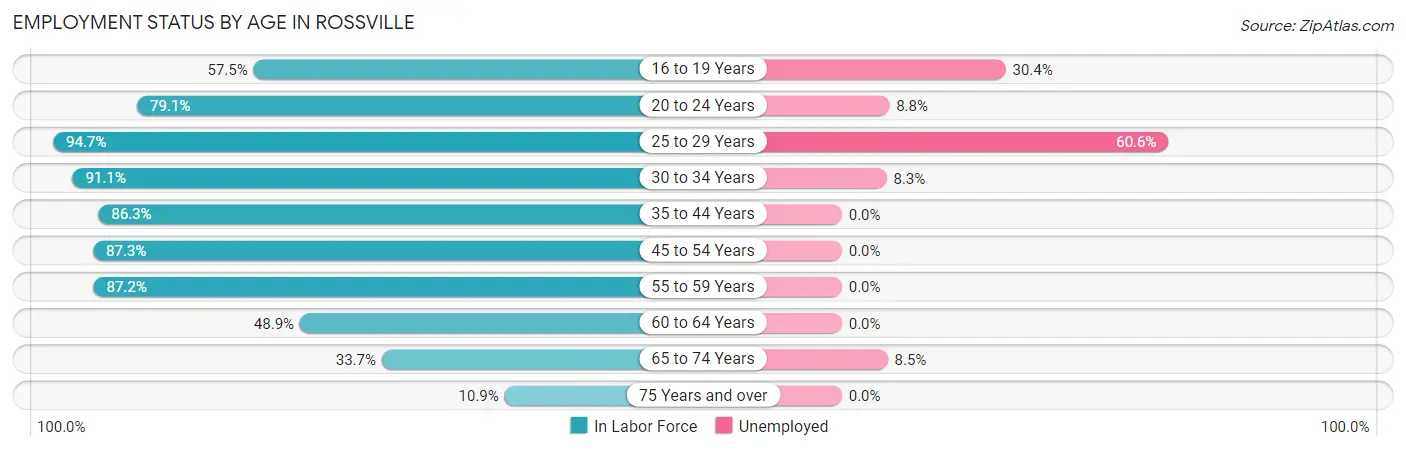
| Age Bracket | In Labor Force | Unemployed |
| 16 to 19 Years | 23 (57.5%) | 7 (30.4%) |
| 20 to 24 Years | 34 (79.1%) | 3 (8.8%) |
| 25 to 29 Years | 71 (94.7%) | 43 (60.6%) |
| 30 to 34 Years | 72 (91.1%) | 6 (8.3%) |
| 35 to 44 Years | 88 (86.3%) | 0 (0.0%) |
| 45 to 54 Years | 172 (87.3%) | 0 (0.0%) |
| 55 to 59 Years | 123 (87.2%) | 0 (0.0%) |
| 60 to 64 Years | 65 (48.9%) | 0 (0.0%) |
| 65 to 74 Years | 59 (33.7%) | 5 (8.5%) |
| 75 Years and over | 5 (10.9%) | 0 (0.0%) |
| Total | 712 (69.1%) | 64 (9.0%) |
Employment Status by Educational Attainment in Rossville
According to labor force statistics for Rossville, 81.3% of individuals (591) out of the total population between 25 and 64 years of age (727) are in the labor force, with 8.3% or 49 of them being unemployed. The group with the highest labor force participation rate are those with the educational attainment of college / associate degree, with 91.2% or 165 individuals in the labor force. Within the labor force, individuals with less than high school education have the highest percentage of unemployment, with 66.7% or 18 of them being unemployed.
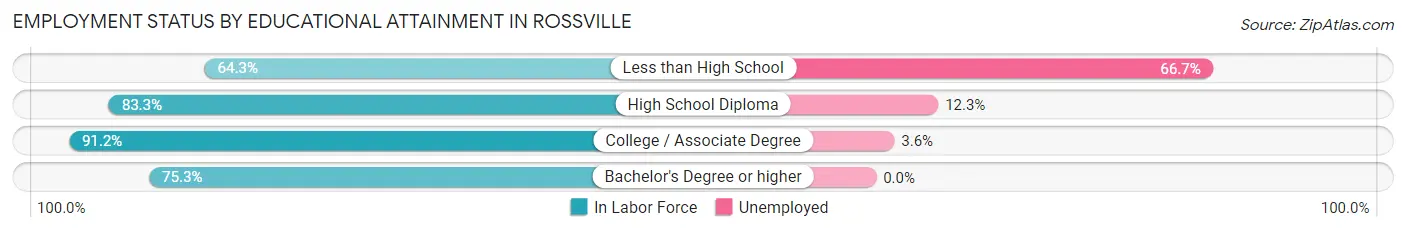
| Educational Attainment | In Labor Force | Unemployed |
| Less than High School | 27 (64.3%) | 28 (66.7%) |
| High School Diploma | 204 (83.3%) | 30 (12.3%) |
| College / Associate Degree | 165 (91.2%) | 7 (3.6%) |
| Bachelor's Degree or higher | 195 (75.3%) | 0 (0.0%) |
| Total | 591 (81.3%) | 60 (8.3%) |
Employment Occupations by Sex in Rossville
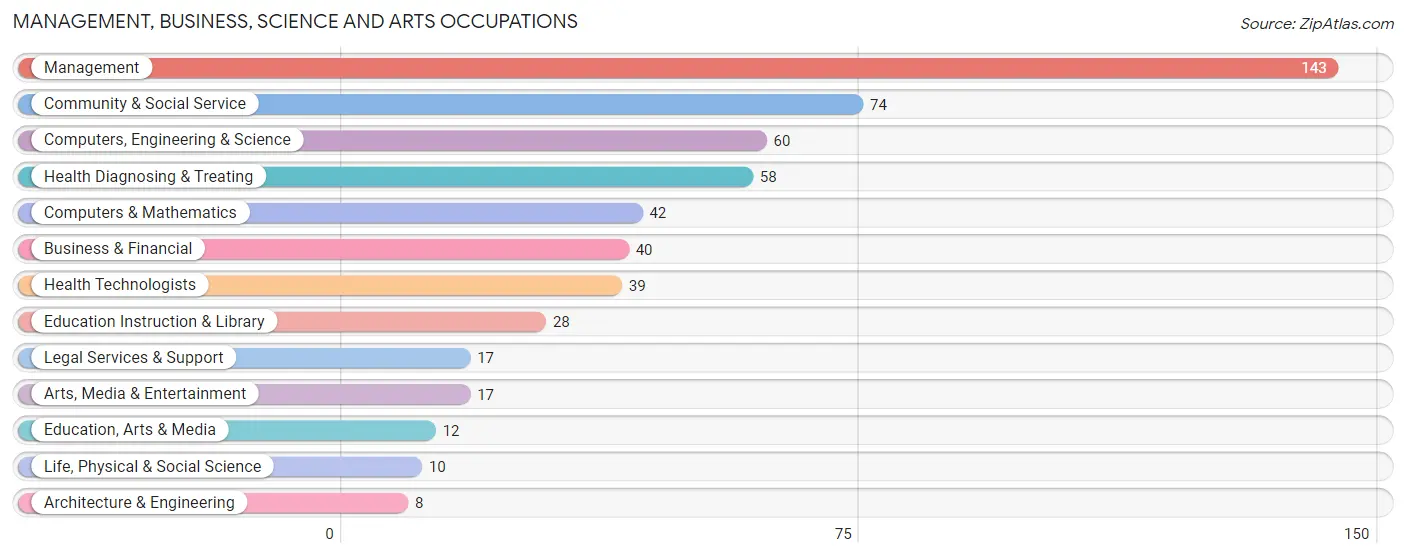
Management, Business, Science and Arts Occupations
The most common Management, Business, Science and Arts occupations in Rossville are Management (143 | 22.1%), Community & Social Service (74 | 11.4%), Computers, Engineering & Science (60 | 9.3%), Health Diagnosing & Treating (58 | 8.9%), and Computers & Mathematics (42 | 6.5%).
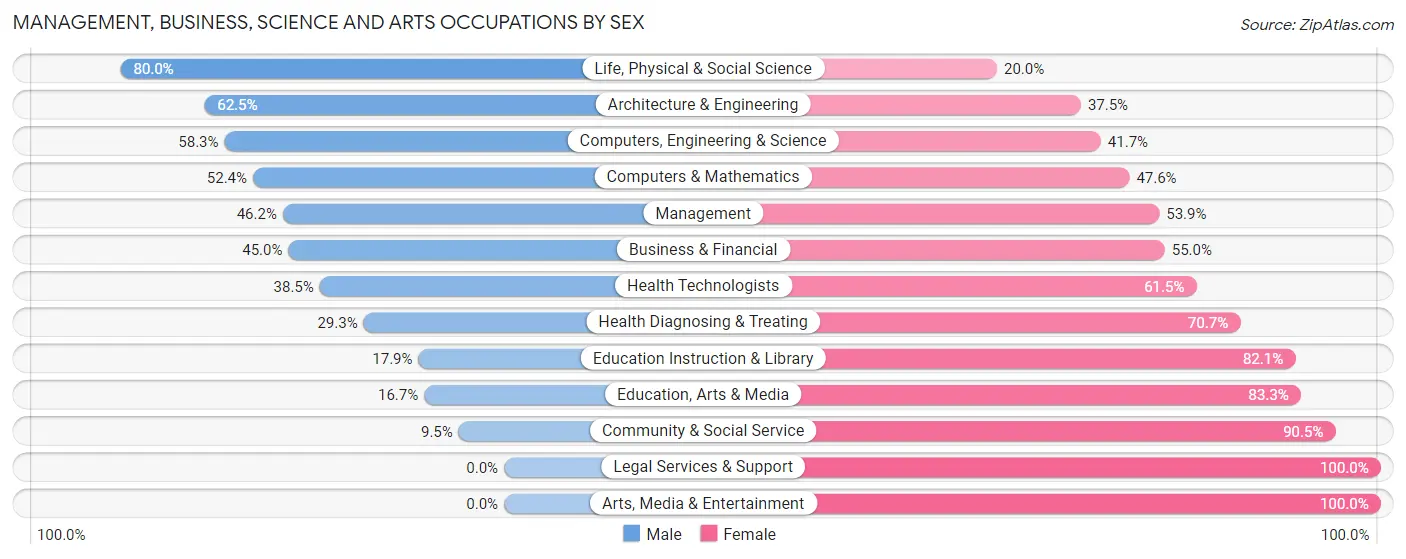
Management, Business, Science and Arts Occupations by Sex
Within the Management, Business, Science and Arts occupations in Rossville, the most male-oriented occupations are Life, Physical & Social Science (80.0%), Architecture & Engineering (62.5%), and Computers, Engineering & Science (58.3%), while the most female-oriented occupations are Legal Services & Support (100.0%), Arts, Media & Entertainment (100.0%), and Community & Social Service (90.5%).
| Occupation | Male | Female |
| Management | 66 (46.2%) | 77 (53.8%) |
| Business & Financial | 18 (45.0%) | 22 (55.0%) |
| Computers, Engineering & Science | 35 (58.3%) | 25 (41.7%) |
| Computers & Mathematics | 22 (52.4%) | 20 (47.6%) |
| Architecture & Engineering | 5 (62.5%) | 3 (37.5%) |
| Life, Physical & Social Science | 8 (80.0%) | 2 (20.0%) |
| Community & Social Service | 7 (9.5%) | 67 (90.5%) |
| Education, Arts & Media | 2 (16.7%) | 10 (83.3%) |
| Legal Services & Support | 0 (0.0%) | 17 (100.0%) |
| Education Instruction & Library | 5 (17.9%) | 23 (82.1%) |
| Arts, Media & Entertainment | 0 (0.0%) | 17 (100.0%) |
| Health Diagnosing & Treating | 17 (29.3%) | 41 (70.7%) |
| Health Technologists | 15 (38.5%) | 24 (61.5%) |
| Total (Category) | 143 (38.1%) | 232 (61.9%) |
| Total (Overall) | 301 (46.5%) | 347 (53.5%) |
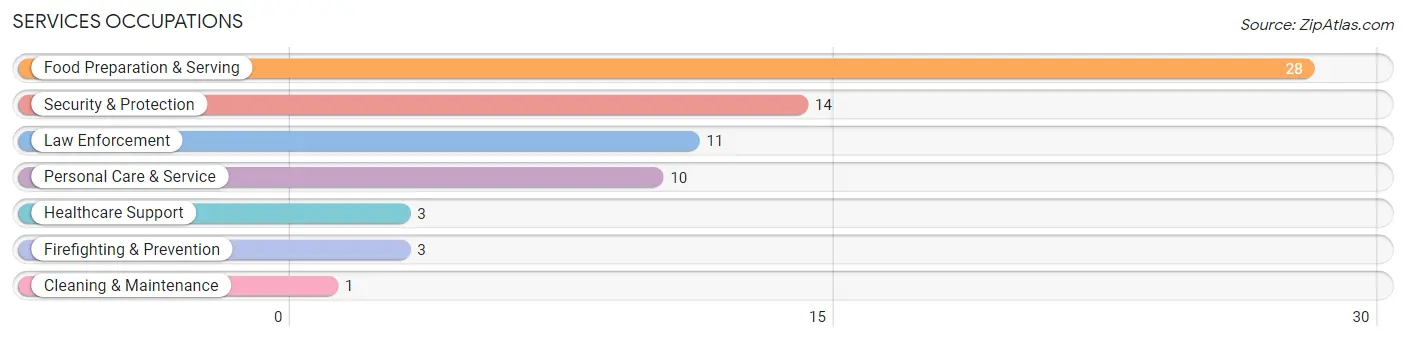
Services Occupations
The most common Services occupations in Rossville are Food Preparation & Serving (28 | 4.3%), Security & Protection (14 | 2.2%), Law Enforcement (11 | 1.7%), Personal Care & Service (10 | 1.5%), and Healthcare Support (3 | 0.5%).
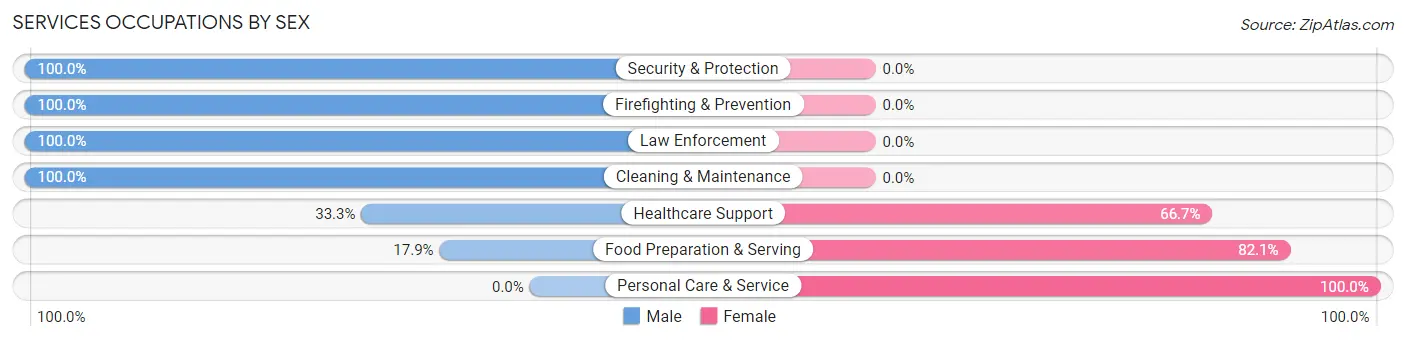
Services Occupations by Sex
Within the Services occupations in Rossville, the most male-oriented occupations are Security & Protection (100.0%), Firefighting & Prevention (100.0%), and Law Enforcement (100.0%), while the most female-oriented occupations are Personal Care & Service (100.0%), Food Preparation & Serving (82.1%), and Healthcare Support (66.7%).
| Occupation | Male | Female |
| Healthcare Support | 1 (33.3%) | 2 (66.7%) |
| Security & Protection | 14 (100.0%) | 0 (0.0%) |
| Firefighting & Prevention | 3 (100.0%) | 0 (0.0%) |
| Law Enforcement | 11 (100.0%) | 0 (0.0%) |
| Food Preparation & Serving | 5 (17.9%) | 23 (82.1%) |
| Cleaning & Maintenance | 1 (100.0%) | 0 (0.0%) |
| Personal Care & Service | 0 (0.0%) | 10 (100.0%) |
| Total (Category) | 21 (37.5%) | 35 (62.5%) |
| Total (Overall) | 301 (46.5%) | 347 (53.5%) |
Sales and Office Occupations
The most common Sales and Office occupations in Rossville are Office & Administration (68 | 10.5%), and Sales & Related (34 | 5.2%).
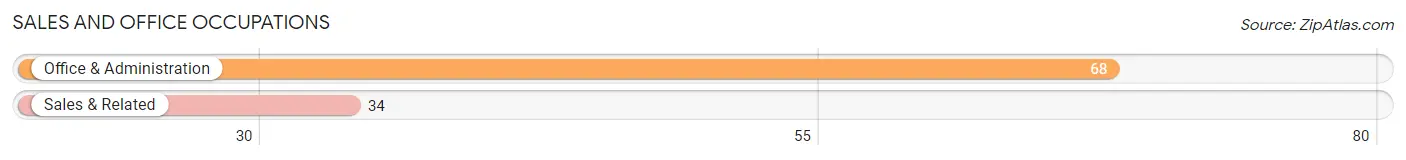
Sales and Office Occupations by Sex

| Occupation | Male | Female |
| Sales & Related | 33 (97.1%) | 1 (2.9%) |
| Office & Administration | 19 (27.9%) | 49 (72.1%) |
| Total (Category) | 52 (51.0%) | 50 (49.0%) |
| Total (Overall) | 301 (46.5%) | 347 (53.5%) |
Natural Resources, Construction and Maintenance Occupations
The most common Natural Resources, Construction and Maintenance occupations in Rossville are Construction & Extraction (23 | 3.5%), and Installation, Maintenance & Repair (10 | 1.5%).
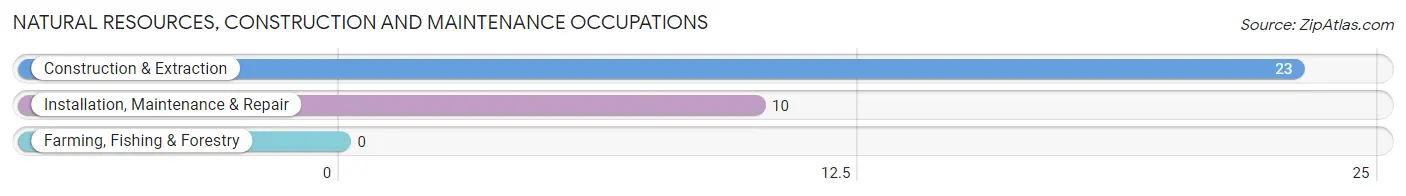
Natural Resources, Construction and Maintenance Occupations by Sex
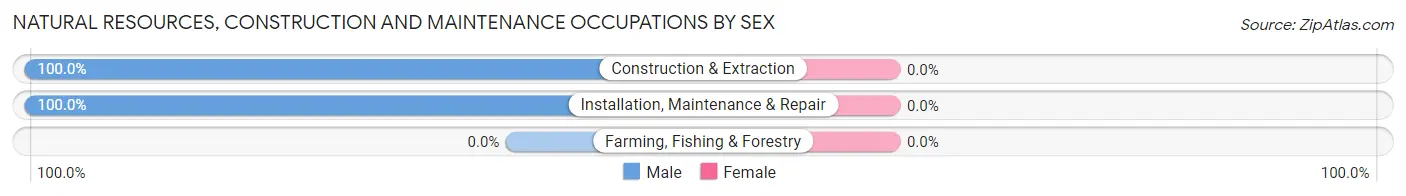
| Occupation | Male | Female |
| Farming, Fishing & Forestry | 0 (0.0%) | 0 (0.0%) |
| Construction & Extraction | 23 (100.0%) | 0 (0.0%) |
| Installation, Maintenance & Repair | 10 (100.0%) | 0 (0.0%) |
| Total (Category) | 33 (100.0%) | 0 (0.0%) |
| Total (Overall) | 301 (46.5%) | 347 (53.5%) |
Production, Transportation and Moving Occupations
The most common Production, Transportation and Moving occupations in Rossville are Material Moving (41 | 6.3%), Transportation (22 | 3.4%), and Production (19 | 2.9%).
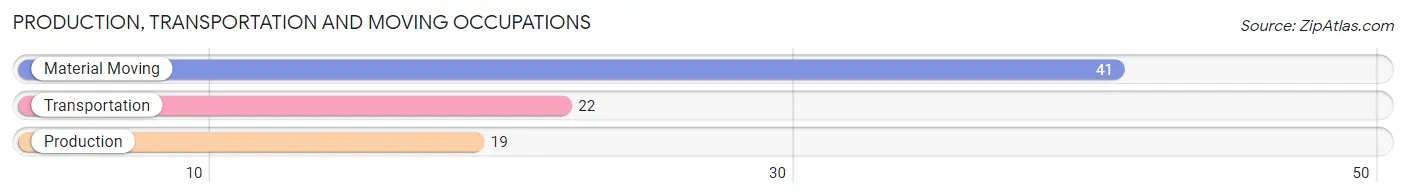
Production, Transportation and Moving Occupations by Sex
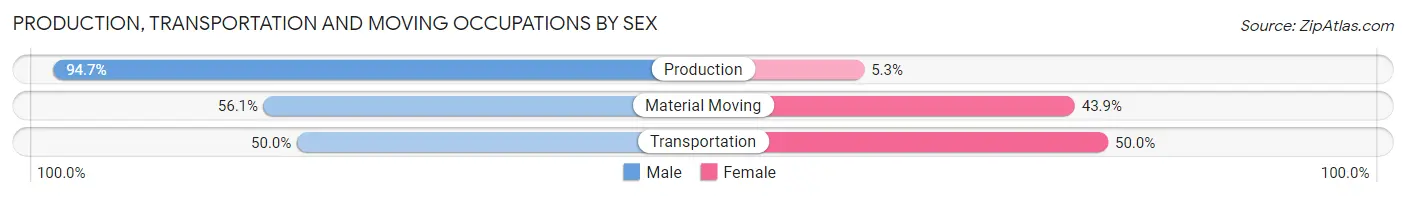
| Occupation | Male | Female |
| Production | 18 (94.7%) | 1 (5.3%) |
| Transportation | 11 (50.0%) | 11 (50.0%) |
| Material Moving | 23 (56.1%) | 18 (43.9%) |
| Total (Category) | 52 (63.4%) | 30 (36.6%) |
| Total (Overall) | 301 (46.5%) | 347 (53.5%) |
Employment Industries by Sex in Rossville
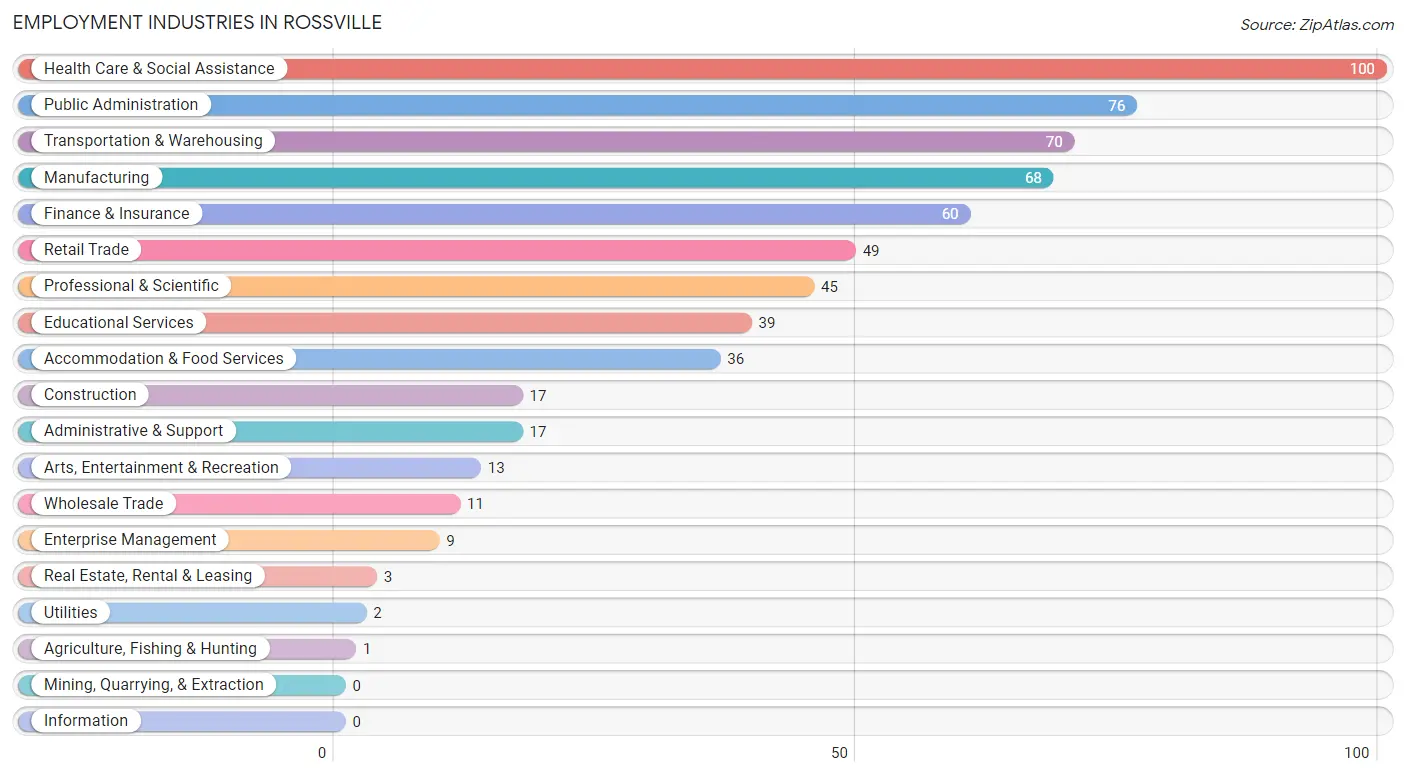
Employment Industries in Rossville
The major employment industries in Rossville include Health Care & Social Assistance (100 | 15.4%), Public Administration (76 | 11.7%), Transportation & Warehousing (70 | 10.8%), Manufacturing (68 | 10.5%), and Finance & Insurance (60 | 9.3%).
Employment Industries by Sex in Rossville
The Rossville industries that see more men than women are Agriculture, Fishing & Hunting (100.0%), Construction (100.0%), and Administrative & Support (88.2%), whereas the industries that tend to have a higher number of women are Utilities (100.0%), Real Estate, Rental & Leasing (100.0%), and Health Care & Social Assistance (79.0%).
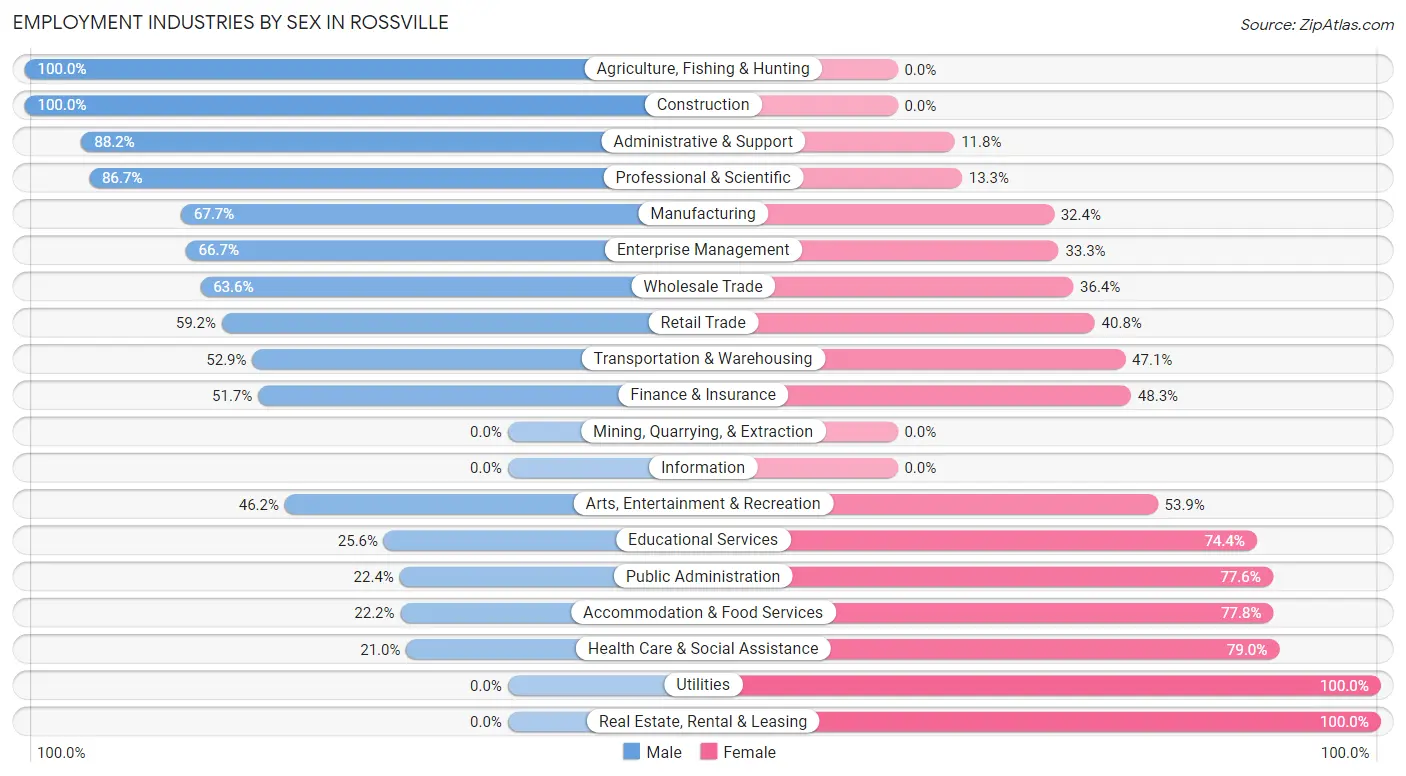
| Industry | Male | Female |
| Agriculture, Fishing & Hunting | 1 (100.0%) | 0 (0.0%) |
| Mining, Quarrying, & Extraction | 0 (0.0%) | 0 (0.0%) |
| Construction | 17 (100.0%) | 0 (0.0%) |
| Manufacturing | 46 (67.6%) | 22 (32.4%) |
| Wholesale Trade | 7 (63.6%) | 4 (36.4%) |
| Retail Trade | 29 (59.2%) | 20 (40.8%) |
| Transportation & Warehousing | 37 (52.9%) | 33 (47.1%) |
| Utilities | 0 (0.0%) | 2 (100.0%) |
| Information | 0 (0.0%) | 0 (0.0%) |
| Finance & Insurance | 31 (51.7%) | 29 (48.3%) |
| Real Estate, Rental & Leasing | 0 (0.0%) | 3 (100.0%) |
| Professional & Scientific | 39 (86.7%) | 6 (13.3%) |
| Enterprise Management | 6 (66.7%) | 3 (33.3%) |
| Administrative & Support | 15 (88.2%) | 2 (11.8%) |
| Educational Services | 10 (25.6%) | 29 (74.4%) |
| Health Care & Social Assistance | 21 (21.0%) | 79 (79.0%) |
| Arts, Entertainment & Recreation | 6 (46.2%) | 7 (53.8%) |
| Accommodation & Food Services | 8 (22.2%) | 28 (77.8%) |
| Public Administration | 17 (22.4%) | 59 (77.6%) |
| Total | 301 (46.5%) | 347 (53.5%) |
Education in Rossville
School Enrollment in Rossville
The most common levels of schooling among the 167 students in Rossville are middle school (43 | 25.8%), high school (41 | 24.5%), and college / undergraduate (40 | 23.9%).
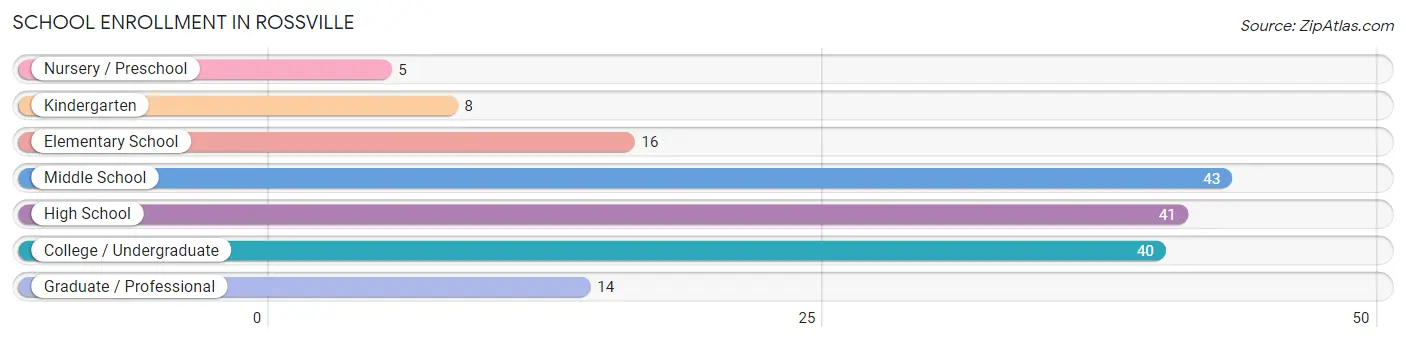
| School Level | # Students | % Students |
| Nursery / Preschool | 5 | 3.0% |
| Kindergarten | 8 | 4.8% |
| Elementary School | 16 | 9.6% |
| Middle School | 43 | 25.8% |
| High School | 41 | 24.5% |
| College / Undergraduate | 40 | 23.9% |
| Graduate / Professional | 14 | 8.4% |
| Total | 167 | 100.0% |
School Enrollment by Age by Funding Source in Rossville
Out of a total of 167 students who are enrolled in schools in Rossville, 75 (44.9%) attend a private institution, while the remaining 92 (55.1%) are enrolled in public schools. The age group of 3 to 4 year olds has the highest likelihood of being enrolled in private schools, with 5 (100.0% in the age bracket) enrolled. Conversely, the age group of 25 to 34 year olds has the lowest likelihood of being enrolled in a private school, with 10 (100.0% in the age bracket) attending a public institution.
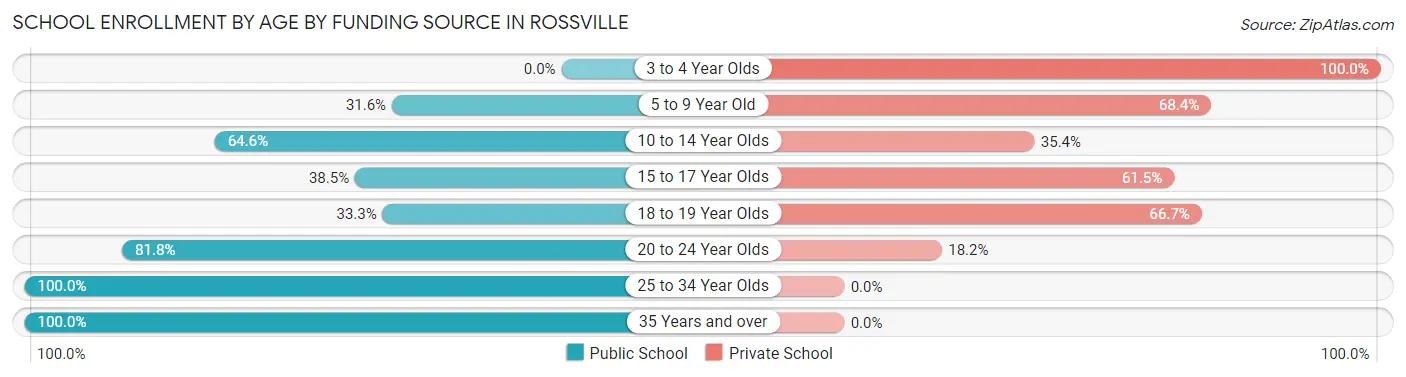
| Age Bracket | Public School | Private School |
| 3 to 4 Year Olds | 0 (0.0%) | 5 (100.0%) |
| 5 to 9 Year Old | 6 (31.6%) | 13 (68.4%) |
| 10 to 14 Year Olds | 31 (64.6%) | 17 (35.4%) |
| 15 to 17 Year Olds | 15 (38.5%) | 24 (61.5%) |
| 18 to 19 Year Olds | 6 (33.3%) | 12 (66.7%) |
| 20 to 24 Year Olds | 18 (81.8%) | 4 (18.2%) |
| 25 to 34 Year Olds | 10 (100.0%) | 0 (0.0%) |
| 35 Years and over | 6 (100.0%) | 0 (0.0%) |
| Total | 92 (55.1%) | 75 (44.9%) |
Educational Attainment by Field of Study in Rossville
Business (104 | 30.7%), science & technology (50 | 14.7%), education (33 | 9.7%), arts & humanities (28 | 8.3%), and bio, nature & agricultural (27 | 8.0%) are the most common fields of study among 339 individuals in Rossville who have obtained a bachelor's degree or higher.
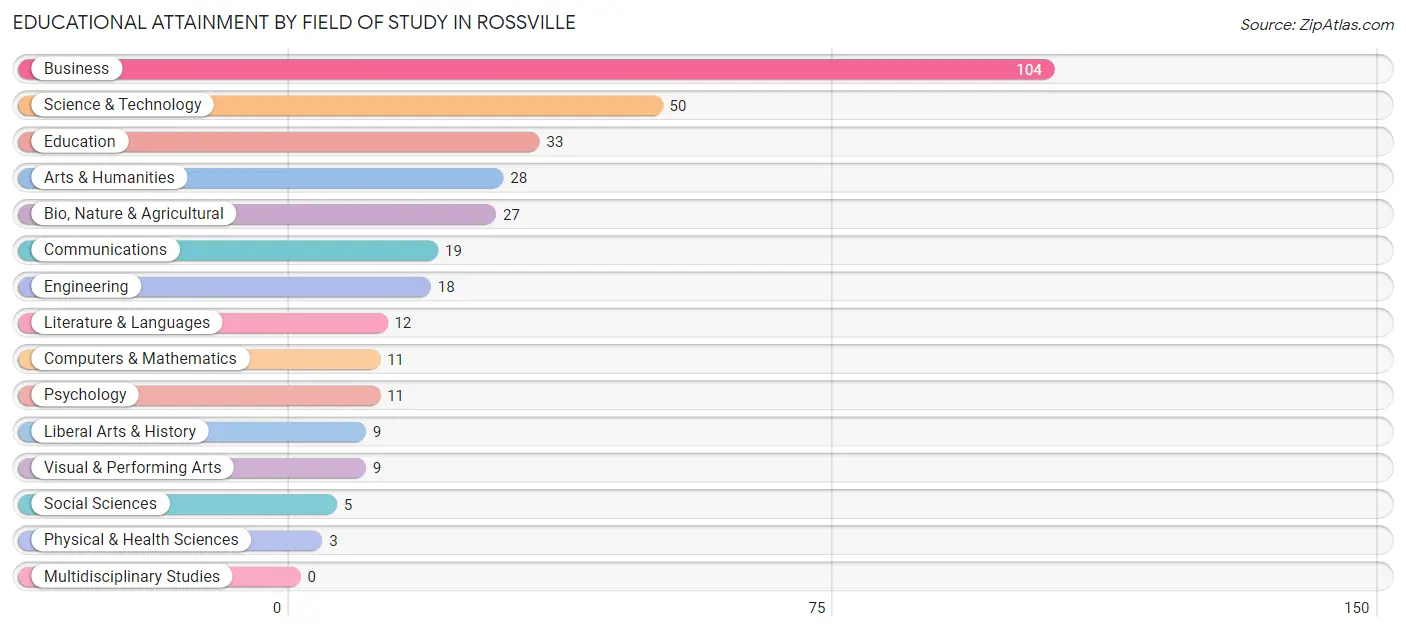
| Field of Study | # Graduates | % Graduates |
| Computers & Mathematics | 11 | 3.2% |
| Bio, Nature & Agricultural | 27 | 8.0% |
| Physical & Health Sciences | 3 | 0.9% |
| Psychology | 11 | 3.2% |
| Social Sciences | 5 | 1.5% |
| Engineering | 18 | 5.3% |
| Multidisciplinary Studies | 0 | 0.0% |
| Science & Technology | 50 | 14.7% |
| Business | 104 | 30.7% |
| Education | 33 | 9.7% |
| Literature & Languages | 12 | 3.5% |
| Liberal Arts & History | 9 | 2.6% |
| Visual & Performing Arts | 9 | 2.6% |
| Communications | 19 | 5.6% |
| Arts & Humanities | 28 | 8.3% |
| Total | 339 | 100.0% |
Transportation & Commute in Rossville
Vehicle Availability by Sex in Rossville
The most prevalent vehicle ownership categories in Rossville are males with 3 vehicles (119, accounting for 40.1%) and females with 3 vehicles (164, making up 34.3%).
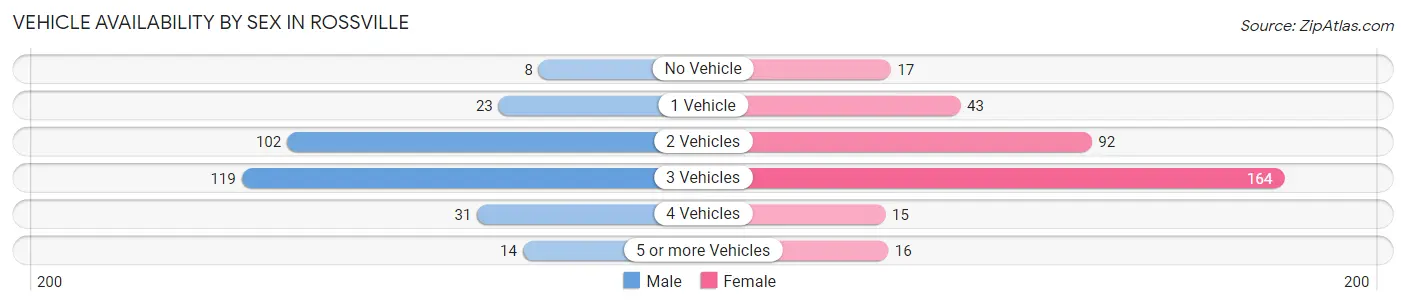
| Vehicles Available | Male | Female |
| No Vehicle | 8 (2.7%) | 17 (4.9%) |
| 1 Vehicle | 23 (7.7%) | 43 (12.4%) |
| 2 Vehicles | 102 (34.3%) | 92 (26.5%) |
| 3 Vehicles | 119 (40.1%) | 164 (47.3%) |
| 4 Vehicles | 31 (10.4%) | 15 (4.3%) |
| 5 or more Vehicles | 14 (4.7%) | 16 (4.6%) |
| Total | 297 (100.0%) | 347 (100.0%) |
Commute Time in Rossville
The most frequently occuring commute durations in Rossville are 30 to 34 minutes (120 commuters, 20.6%), 45 to 59 minutes (92 commuters, 15.8%), and 20 to 24 minutes (80 commuters, 13.8%).
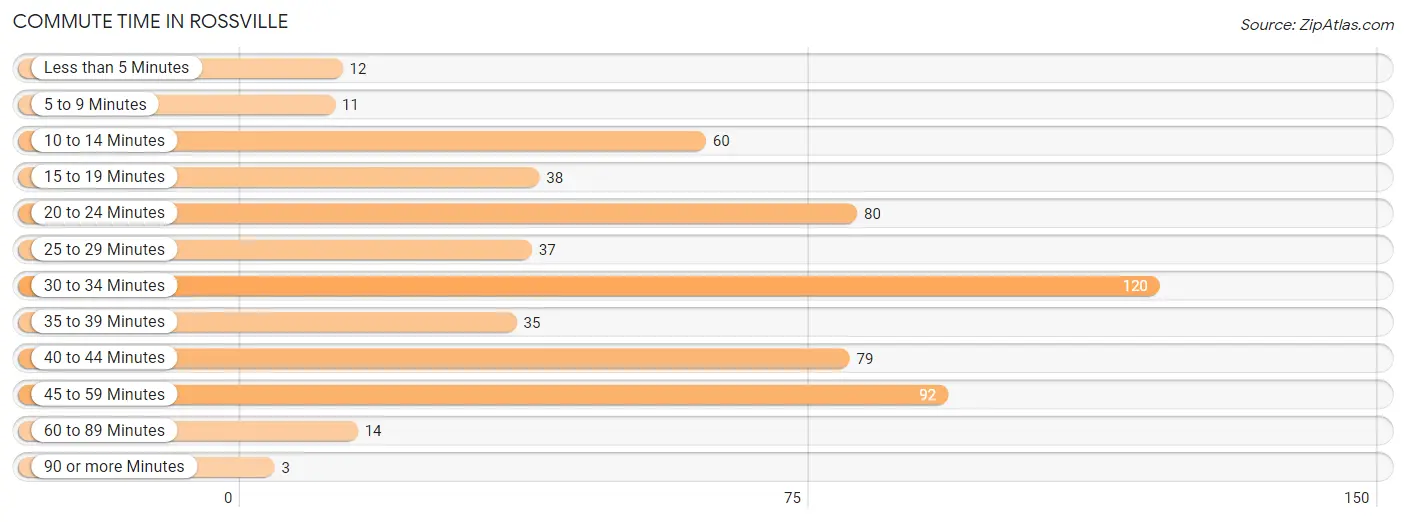
| Commute Time | # Commuters | % Commuters |
| Less than 5 Minutes | 12 | 2.1% |
| 5 to 9 Minutes | 11 | 1.9% |
| 10 to 14 Minutes | 60 | 10.3% |
| 15 to 19 Minutes | 38 | 6.5% |
| 20 to 24 Minutes | 80 | 13.8% |
| 25 to 29 Minutes | 37 | 6.4% |
| 30 to 34 Minutes | 120 | 20.6% |
| 35 to 39 Minutes | 35 | 6.0% |
| 40 to 44 Minutes | 79 | 13.6% |
| 45 to 59 Minutes | 92 | 15.8% |
| 60 to 89 Minutes | 14 | 2.4% |
| 90 or more Minutes | 3 | 0.5% |
Commute Time by Sex in Rossville
The most common commute times in Rossville are 40 to 44 minutes (59 commuters, 21.9%) for males and 30 to 34 minutes (76 commuters, 24.4%) for females.
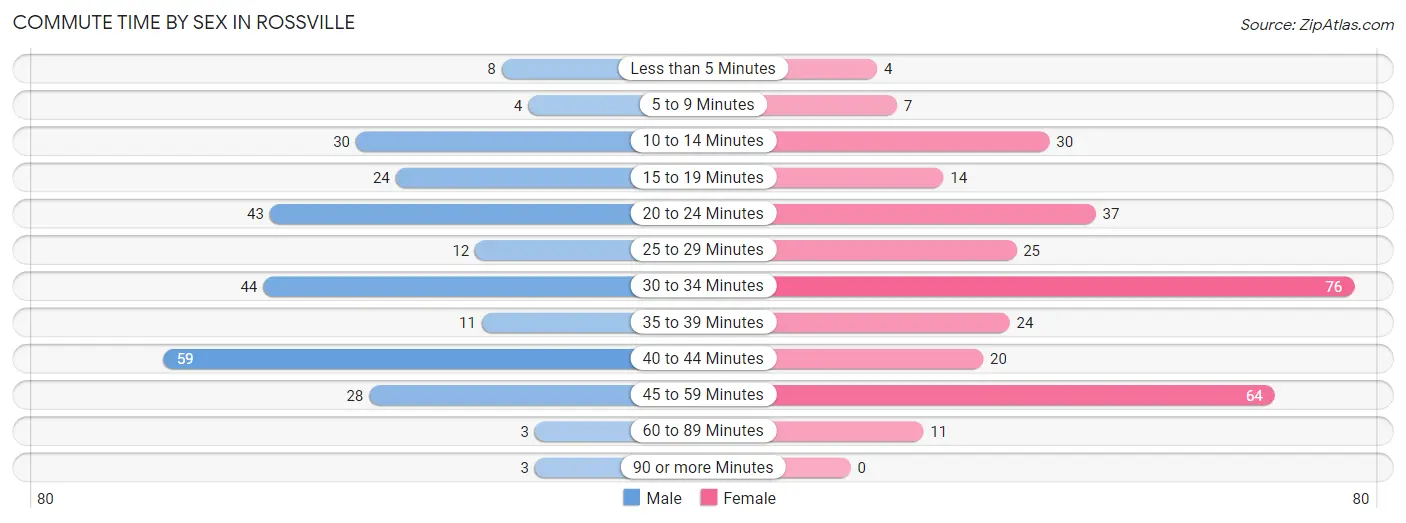
| Commute Time | Male | Female |
| Less than 5 Minutes | 8 (3.0%) | 4 (1.3%) |
| 5 to 9 Minutes | 4 (1.5%) | 7 (2.2%) |
| 10 to 14 Minutes | 30 (11.2%) | 30 (9.6%) |
| 15 to 19 Minutes | 24 (8.9%) | 14 (4.5%) |
| 20 to 24 Minutes | 43 (16.0%) | 37 (11.9%) |
| 25 to 29 Minutes | 12 (4.5%) | 25 (8.0%) |
| 30 to 34 Minutes | 44 (16.4%) | 76 (24.4%) |
| 35 to 39 Minutes | 11 (4.1%) | 24 (7.7%) |
| 40 to 44 Minutes | 59 (21.9%) | 20 (6.4%) |
| 45 to 59 Minutes | 28 (10.4%) | 64 (20.5%) |
| 60 to 89 Minutes | 3 (1.1%) | 11 (3.5%) |
| 90 or more Minutes | 3 (1.1%) | 0 (0.0%) |
Time of Departure to Work by Sex in Rossville
The most frequent times of departure to work in Rossville are 7:00 AM to 7:29 AM (60, 22.3%) for males and 7:00 AM to 7:29 AM (83, 26.6%) for females.
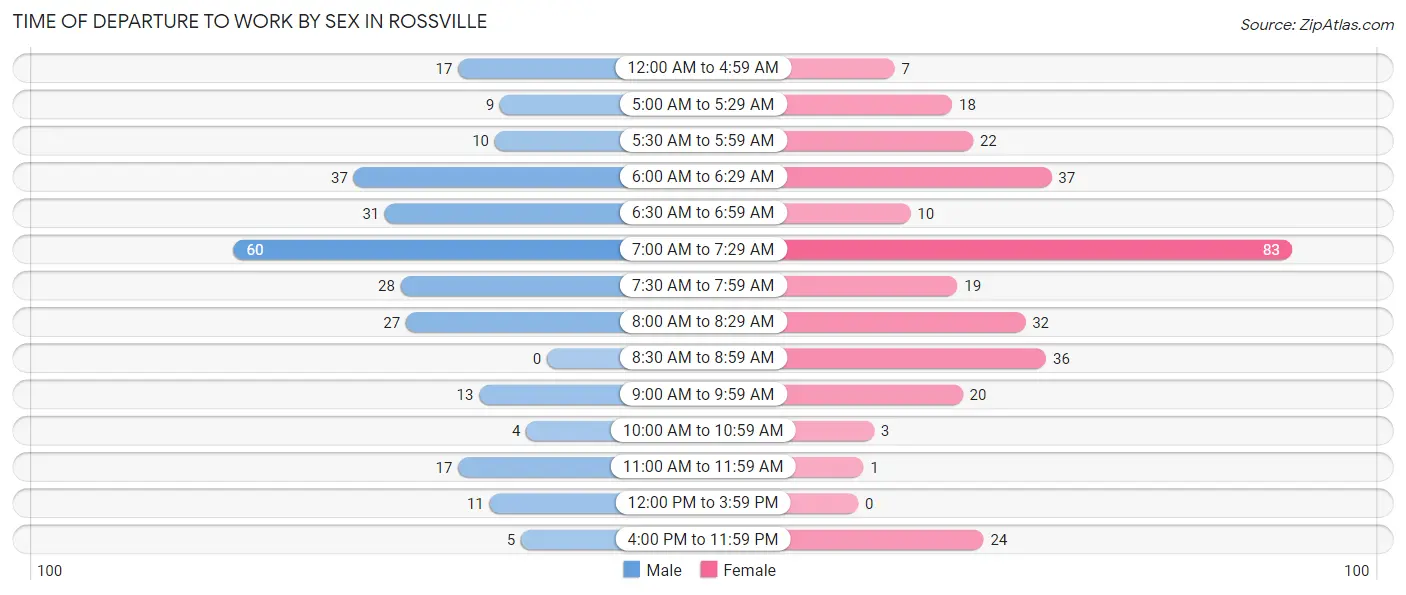
| Time of Departure | Male | Female |
| 12:00 AM to 4:59 AM | 17 (6.3%) | 7 (2.2%) |
| 5:00 AM to 5:29 AM | 9 (3.4%) | 18 (5.8%) |
| 5:30 AM to 5:59 AM | 10 (3.7%) | 22 (7.0%) |
| 6:00 AM to 6:29 AM | 37 (13.8%) | 37 (11.9%) |
| 6:30 AM to 6:59 AM | 31 (11.5%) | 10 (3.2%) |
| 7:00 AM to 7:29 AM | 60 (22.3%) | 83 (26.6%) |
| 7:30 AM to 7:59 AM | 28 (10.4%) | 19 (6.1%) |
| 8:00 AM to 8:29 AM | 27 (10.0%) | 32 (10.3%) |
| 8:30 AM to 8:59 AM | 0 (0.0%) | 36 (11.5%) |
| 9:00 AM to 9:59 AM | 13 (4.8%) | 20 (6.4%) |
| 10:00 AM to 10:59 AM | 4 (1.5%) | 3 (1.0%) |
| 11:00 AM to 11:59 AM | 17 (6.3%) | 1 (0.3%) |
| 12:00 PM to 3:59 PM | 11 (4.1%) | 0 (0.0%) |
| 4:00 PM to 11:59 PM | 5 (1.9%) | 24 (7.7%) |
| Total | 269 (100.0%) | 312 (100.0%) |
Housing Occupancy in Rossville
Occupancy by Ownership in Rossville
Of the total 488 dwellings in Rossville, owner-occupied units account for 418 (85.7%), while renter-occupied units make up 70 (14.3%).
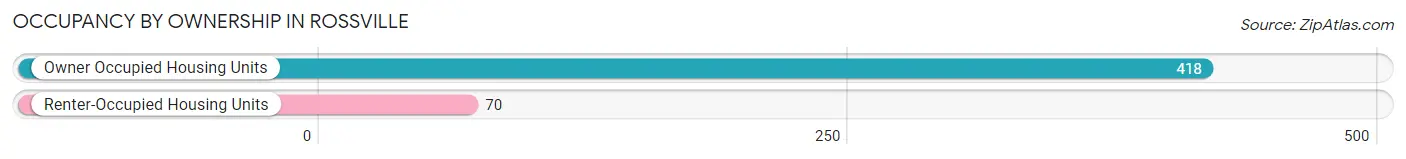
| Occupancy | # Housing Units | % Housing Units |
| Owner Occupied Housing Units | 418 | 85.7% |
| Renter-Occupied Housing Units | 70 | 14.3% |
| Total Occupied Housing Units | 488 | 100.0% |
Occupancy by Household Size in Rossville
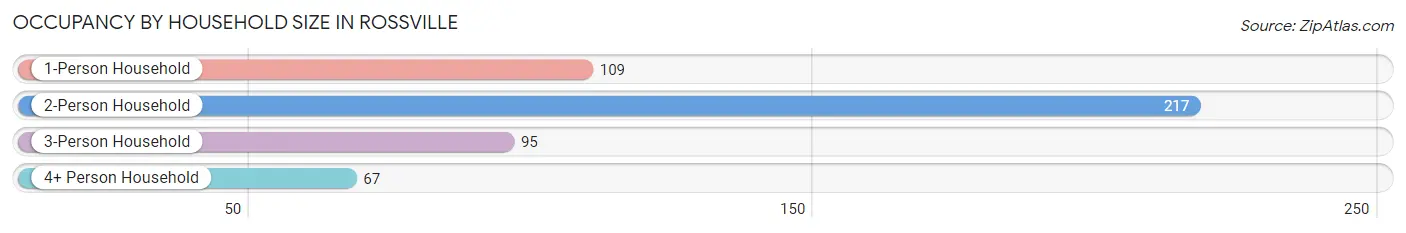
| Household Size | # Housing Units | % Housing Units |
| 1-Person Household | 109 | 22.3% |
| 2-Person Household | 217 | 44.5% |
| 3-Person Household | 95 | 19.5% |
| 4+ Person Household | 67 | 13.7% |
| Total Housing Units | 488 | 100.0% |
Occupancy by Ownership by Household Size in Rossville
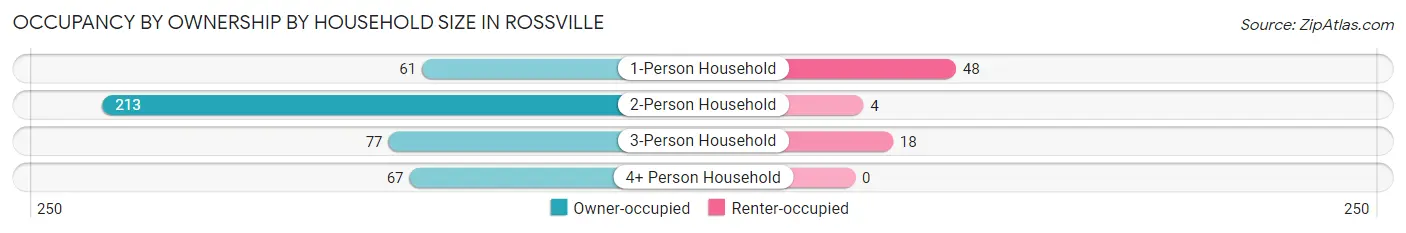
| Household Size | Owner-occupied | Renter-occupied |
| 1-Person Household | 61 (56.0%) | 48 (44.0%) |
| 2-Person Household | 213 (98.2%) | 4 (1.8%) |
| 3-Person Household | 77 (81.0%) | 18 (19.0%) |
| 4+ Person Household | 67 (100.0%) | 0 (0.0%) |
| Total Housing Units | 418 (85.7%) | 70 (14.3%) |
Occupancy by Educational Attainment in Rossville
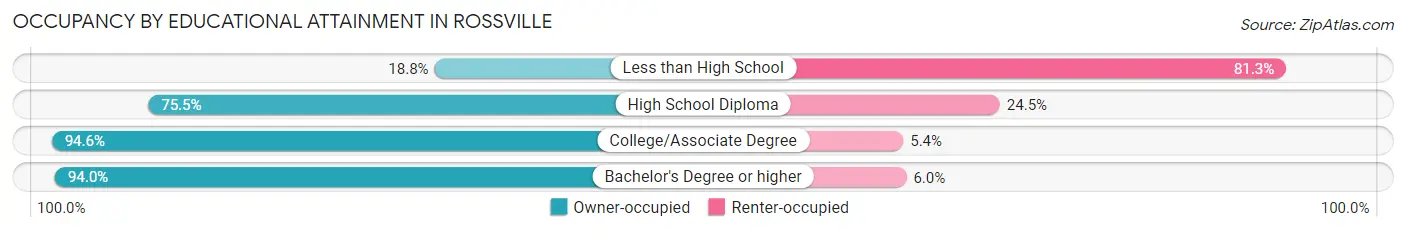
| Household Size | Owner-occupied | Renter-occupied |
| Less than High School | 3 (18.8%) | 13 (81.2%) |
| High School Diploma | 120 (75.5%) | 39 (24.5%) |
| College/Associate Degree | 123 (94.6%) | 7 (5.4%) |
| Bachelor's Degree or higher | 172 (94.0%) | 11 (6.0%) |
Occupancy by Age of Householder in Rossville
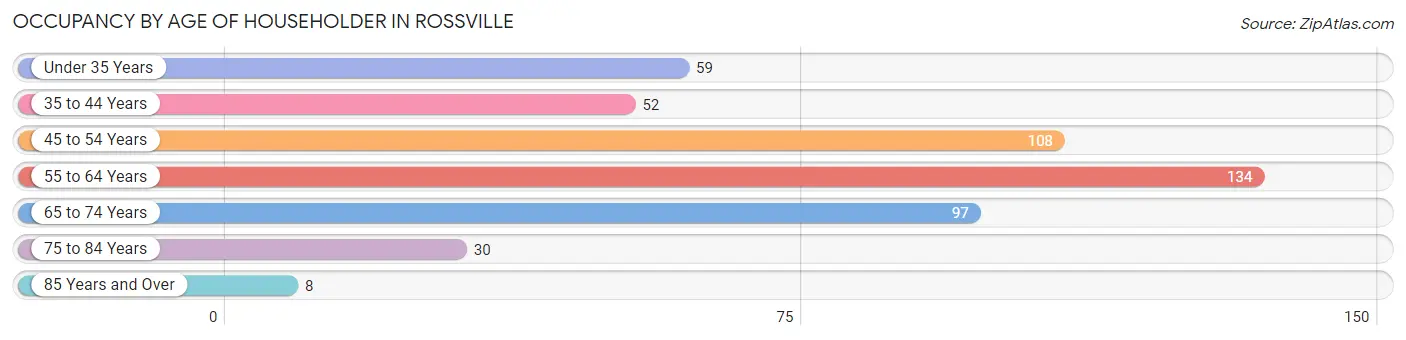
| Age Bracket | # Households | % Households |
| Under 35 Years | 59 | 12.1% |
| 35 to 44 Years | 52 | 10.7% |
| 45 to 54 Years | 108 | 22.1% |
| 55 to 64 Years | 134 | 27.5% |
| 65 to 74 Years | 97 | 19.9% |
| 75 to 84 Years | 30 | 6.1% |
| 85 Years and Over | 8 | 1.6% |
| Total | 488 | 100.0% |
Housing Finances in Rossville
Median Income by Occupancy in Rossville
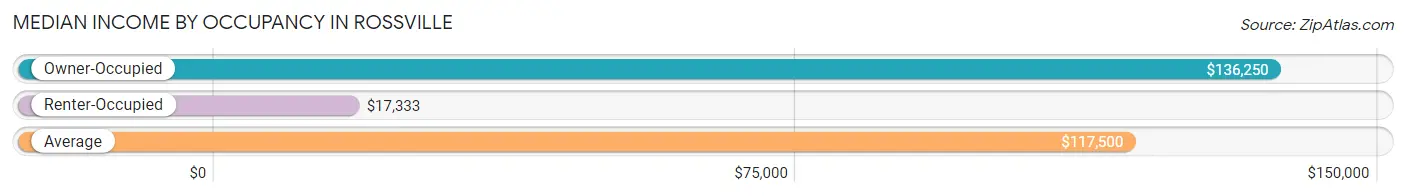
| Occupancy Type | # Households | Median Income |
| Owner-Occupied | 418 (85.7%) | $136,250 |
| Renter-Occupied | 70 (14.3%) | $17,333 |
| Average | 488 (100.0%) | $117,500 |
Occupancy by Householder Income Bracket in Rossville
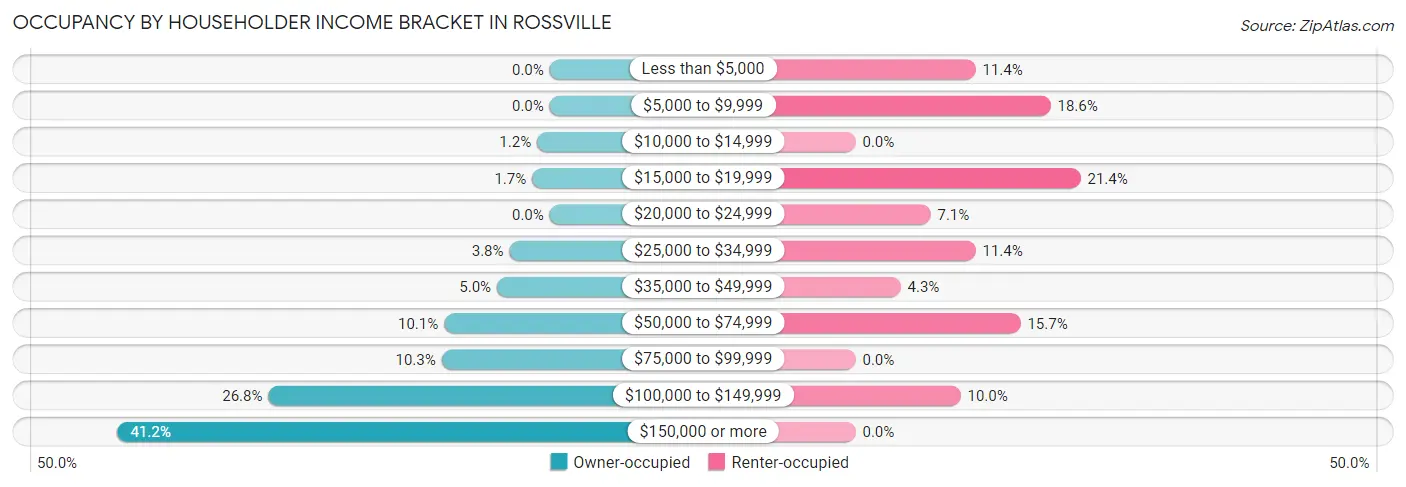
| Income Bracket | Owner-occupied | Renter-occupied |
| Less than $5,000 | 0 (0.0%) | 8 (11.4%) |
| $5,000 to $9,999 | 0 (0.0%) | 13 (18.6%) |
| $10,000 to $14,999 | 5 (1.2%) | 0 (0.0%) |
| $15,000 to $19,999 | 7 (1.7%) | 15 (21.4%) |
| $20,000 to $24,999 | 0 (0.0%) | 5 (7.1%) |
| $25,000 to $34,999 | 16 (3.8%) | 8 (11.4%) |
| $35,000 to $49,999 | 21 (5.0%) | 3 (4.3%) |
| $50,000 to $74,999 | 42 (10.1%) | 11 (15.7%) |
| $75,000 to $99,999 | 43 (10.3%) | 0 (0.0%) |
| $100,000 to $149,999 | 112 (26.8%) | 7 (10.0%) |
| $150,000 or more | 172 (41.1%) | 0 (0.0%) |
| Total | 418 (100.0%) | 70 (100.0%) |
Monthly Housing Cost Tiers in Rossville
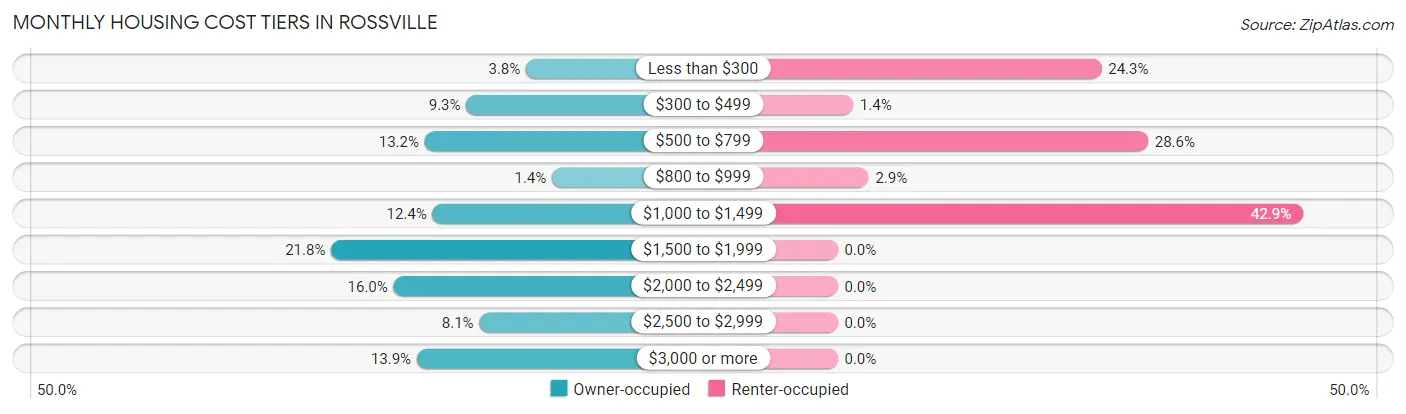
| Monthly Cost | Owner-occupied | Renter-occupied |
| Less than $300 | 16 (3.8%) | 17 (24.3%) |
| $300 to $499 | 39 (9.3%) | 1 (1.4%) |
| $500 to $799 | 55 (13.2%) | 20 (28.6%) |
| $800 to $999 | 6 (1.4%) | 2 (2.9%) |
| $1,000 to $1,499 | 52 (12.4%) | 30 (42.9%) |
| $1,500 to $1,999 | 91 (21.8%) | 0 (0.0%) |
| $2,000 to $2,499 | 67 (16.0%) | 0 (0.0%) |
| $2,500 to $2,999 | 34 (8.1%) | 0 (0.0%) |
| $3,000 or more | 58 (13.9%) | 0 (0.0%) |
| Total | 418 (100.0%) | 70 (100.0%) |
Physical Housing Characteristics in Rossville
Housing Structures in Rossville
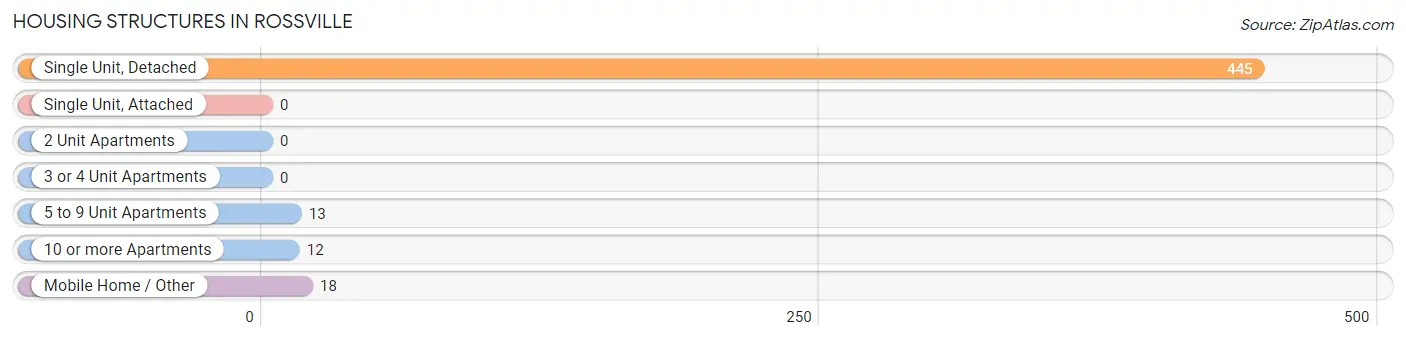
| Structure Type | # Housing Units | % Housing Units |
| Single Unit, Detached | 445 | 91.2% |
| Single Unit, Attached | 0 | 0.0% |
| 2 Unit Apartments | 0 | 0.0% |
| 3 or 4 Unit Apartments | 0 | 0.0% |
| 5 to 9 Unit Apartments | 13 | 2.7% |
| 10 or more Apartments | 12 | 2.5% |
| Mobile Home / Other | 18 | 3.7% |
| Total | 488 | 100.0% |
Housing Structures by Occupancy in Rossville
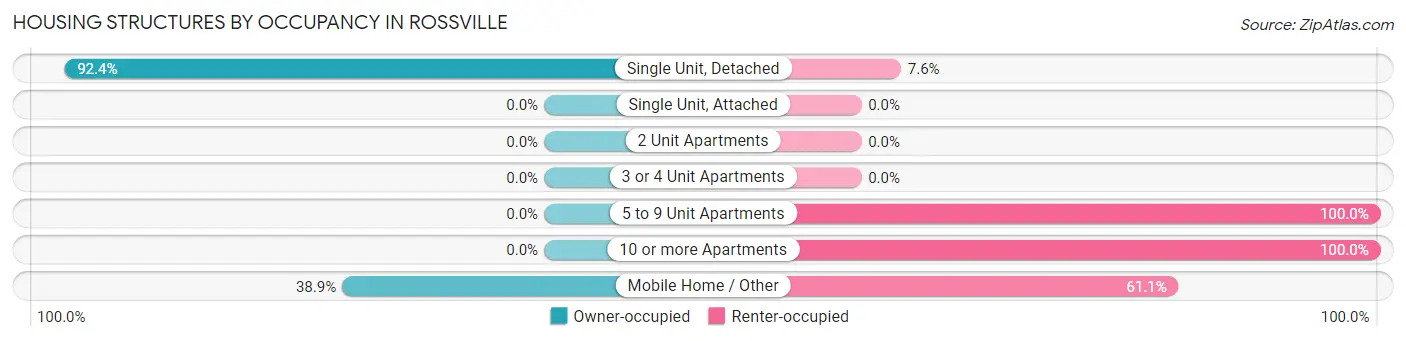
| Structure Type | Owner-occupied | Renter-occupied |
| Single Unit, Detached | 411 (92.4%) | 34 (7.6%) |
| Single Unit, Attached | 0 (0.0%) | 0 (0.0%) |
| 2 Unit Apartments | 0 (0.0%) | 0 (0.0%) |
| 3 or 4 Unit Apartments | 0 (0.0%) | 0 (0.0%) |
| 5 to 9 Unit Apartments | 0 (0.0%) | 13 (100.0%) |
| 10 or more Apartments | 0 (0.0%) | 12 (100.0%) |
| Mobile Home / Other | 7 (38.9%) | 11 (61.1%) |
| Total | 418 (85.7%) | 70 (14.3%) |
Housing Structures by Number of Rooms in Rossville
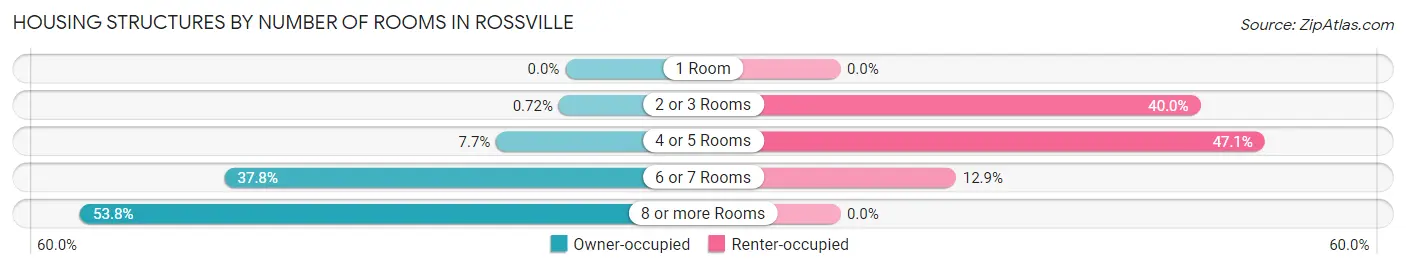
| Number of Rooms | Owner-occupied | Renter-occupied |
| 1 Room | 0 (0.0%) | 0 (0.0%) |
| 2 or 3 Rooms | 3 (0.7%) | 28 (40.0%) |
| 4 or 5 Rooms | 32 (7.7%) | 33 (47.1%) |
| 6 or 7 Rooms | 158 (37.8%) | 9 (12.9%) |
| 8 or more Rooms | 225 (53.8%) | 0 (0.0%) |
| Total | 418 (100.0%) | 70 (100.0%) |
Housing Structure by Heating Type in Rossville
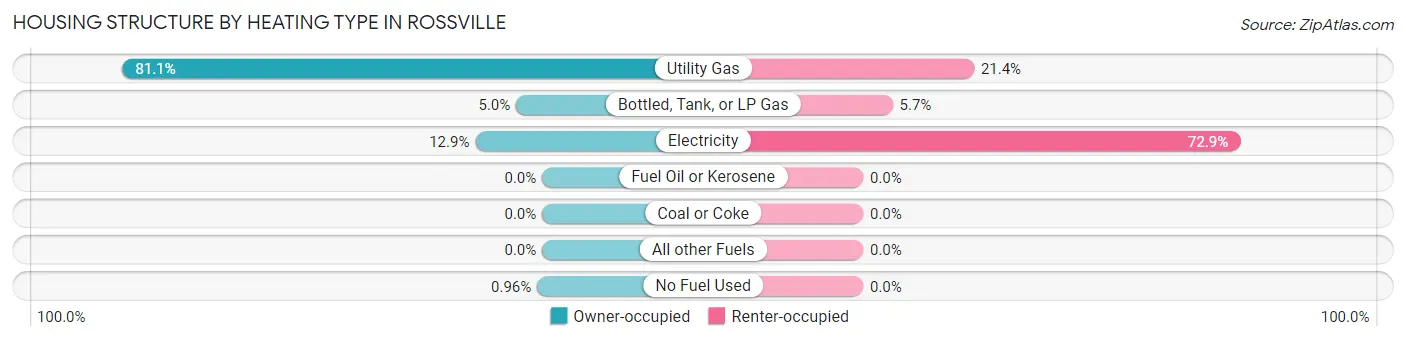
| Heating Type | Owner-occupied | Renter-occupied |
| Utility Gas | 339 (81.1%) | 15 (21.4%) |
| Bottled, Tank, or LP Gas | 21 (5.0%) | 4 (5.7%) |
| Electricity | 54 (12.9%) | 51 (72.9%) |
| Fuel Oil or Kerosene | 0 (0.0%) | 0 (0.0%) |
| Coal or Coke | 0 (0.0%) | 0 (0.0%) |
| All other Fuels | 0 (0.0%) | 0 (0.0%) |
| No Fuel Used | 4 (1.0%) | 0 (0.0%) |
| Total | 418 (100.0%) | 70 (100.0%) |
Household Vehicle Usage in Rossville
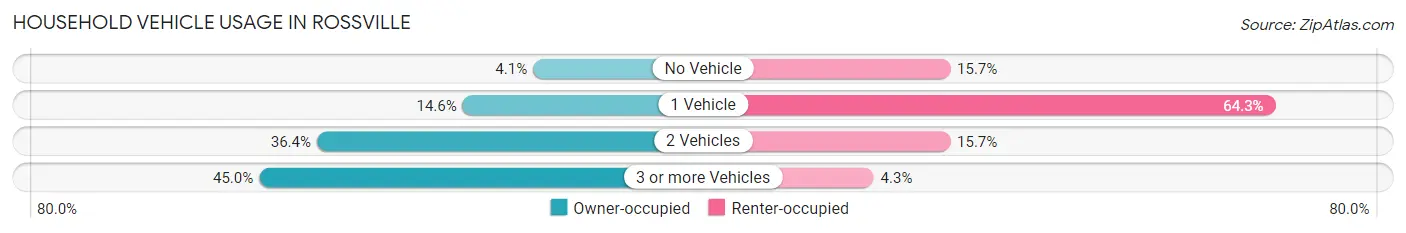
| Vehicles per Household | Owner-occupied | Renter-occupied |
| No Vehicle | 17 (4.1%) | 11 (15.7%) |
| 1 Vehicle | 61 (14.6%) | 45 (64.3%) |
| 2 Vehicles | 152 (36.4%) | 11 (15.7%) |
| 3 or more Vehicles | 188 (45.0%) | 3 (4.3%) |
| Total | 418 (100.0%) | 70 (100.0%) |
Real Estate & Mortgages in Rossville
Real Estate and Mortgage Overview in Rossville
| Characteristic | Without Mortgage | With Mortgage |
| Housing Units | 103 | 315 |
| Median Property Value | $190,600 | $431,800 |
| Median Household Income | $62,344 | $149 |
| Monthly Housing Costs | $490 | $58 |
| Real Estate Taxes | $1,125 | $3 |
Property Value by Mortgage Status in Rossville
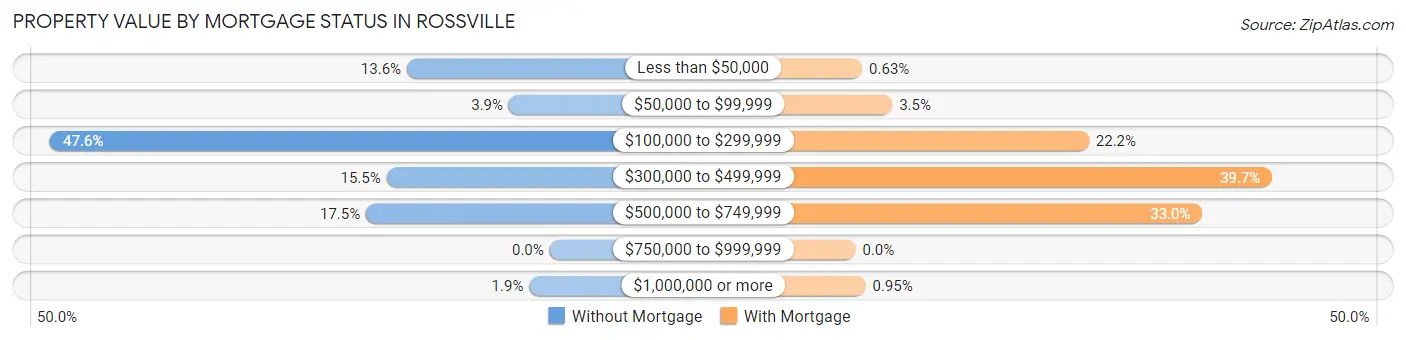
| Property Value | Without Mortgage | With Mortgage |
| Less than $50,000 | 14 (13.6%) | 2 (0.6%) |
| $50,000 to $99,999 | 4 (3.9%) | 11 (3.5%) |
| $100,000 to $299,999 | 49 (47.6%) | 70 (22.2%) |
| $300,000 to $499,999 | 16 (15.5%) | 125 (39.7%) |
| $500,000 to $749,999 | 18 (17.5%) | 104 (33.0%) |
| $750,000 to $999,999 | 0 (0.0%) | 0 (0.0%) |
| $1,000,000 or more | 2 (1.9%) | 3 (0.9%) |
| Total | 103 (100.0%) | 315 (100.0%) |
Household Income by Mortgage Status in Rossville
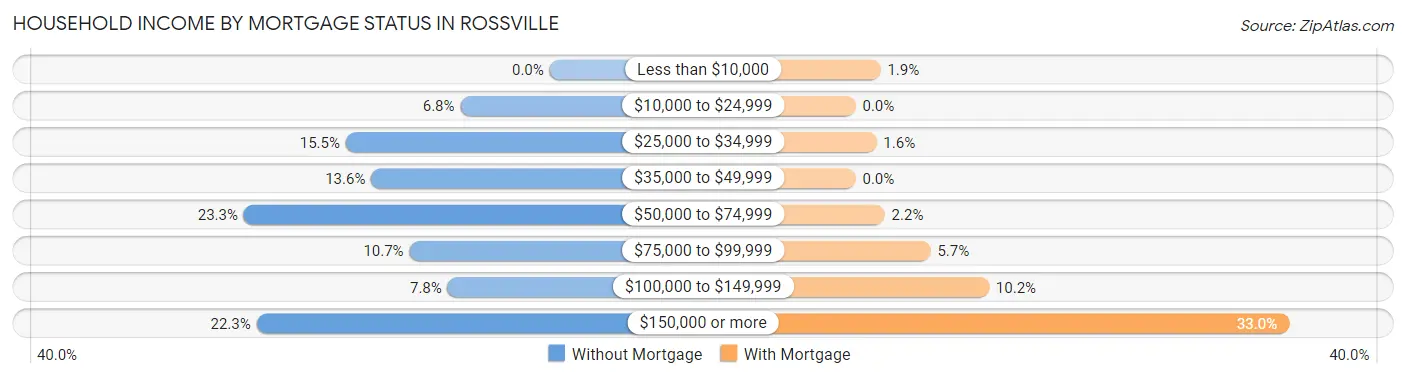
| Household Income | Without Mortgage | With Mortgage |
| Less than $10,000 | 0 (0.0%) | 6 (1.9%) |
| $10,000 to $24,999 | 7 (6.8%) | 0 (0.0%) |
| $25,000 to $34,999 | 16 (15.5%) | 5 (1.6%) |
| $35,000 to $49,999 | 14 (13.6%) | 0 (0.0%) |
| $50,000 to $74,999 | 24 (23.3%) | 7 (2.2%) |
| $75,000 to $99,999 | 11 (10.7%) | 18 (5.7%) |
| $100,000 to $149,999 | 8 (7.8%) | 32 (10.2%) |
| $150,000 or more | 23 (22.3%) | 104 (33.0%) |
| Total | 103 (100.0%) | 315 (100.0%) |
Property Value to Household Income Ratio in Rossville
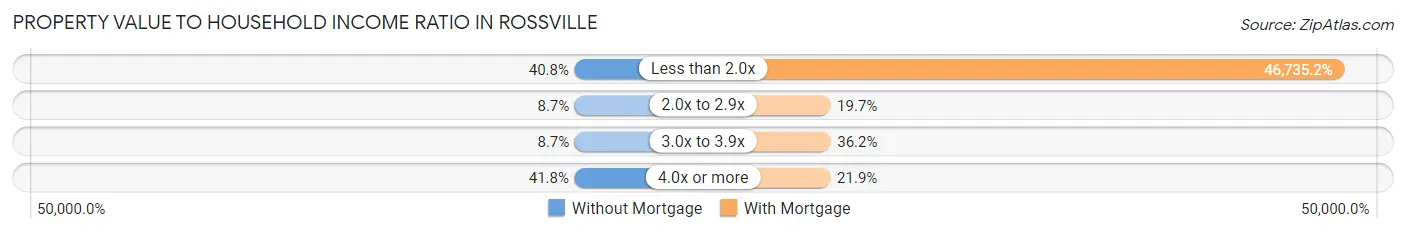
| Value-to-Income Ratio | Without Mortgage | With Mortgage |
| Less than 2.0x | 42 (40.8%) | 147,216 (46,735.2%) |
| 2.0x to 2.9x | 9 (8.7%) | 62 (19.7%) |
| 3.0x to 3.9x | 9 (8.7%) | 114 (36.2%) |
| 4.0x or more | 43 (41.7%) | 69 (21.9%) |
| Total | 103 (100.0%) | 315 (100.0%) |
Real Estate Taxes by Mortgage Status in Rossville
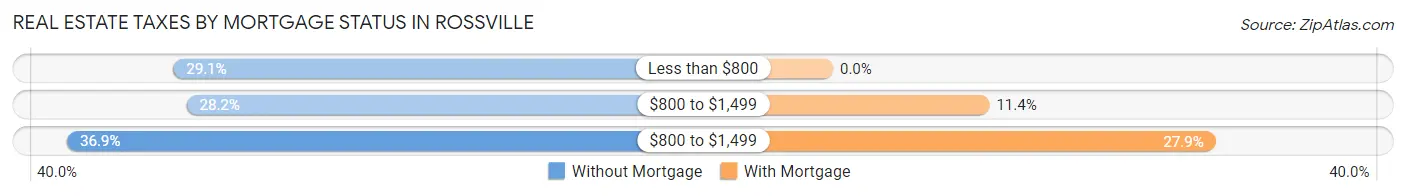
| Property Taxes | Without Mortgage | With Mortgage |
| Less than $800 | 30 (29.1%) | 0 (0.0%) |
| $800 to $1,499 | 29 (28.2%) | 36 (11.4%) |
| $800 to $1,499 | 38 (36.9%) | 88 (27.9%) |
| Total | 103 (100.0%) | 315 (100.0%) |
Health & Disability in Rossville
Health Insurance Coverage by Age in Rossville
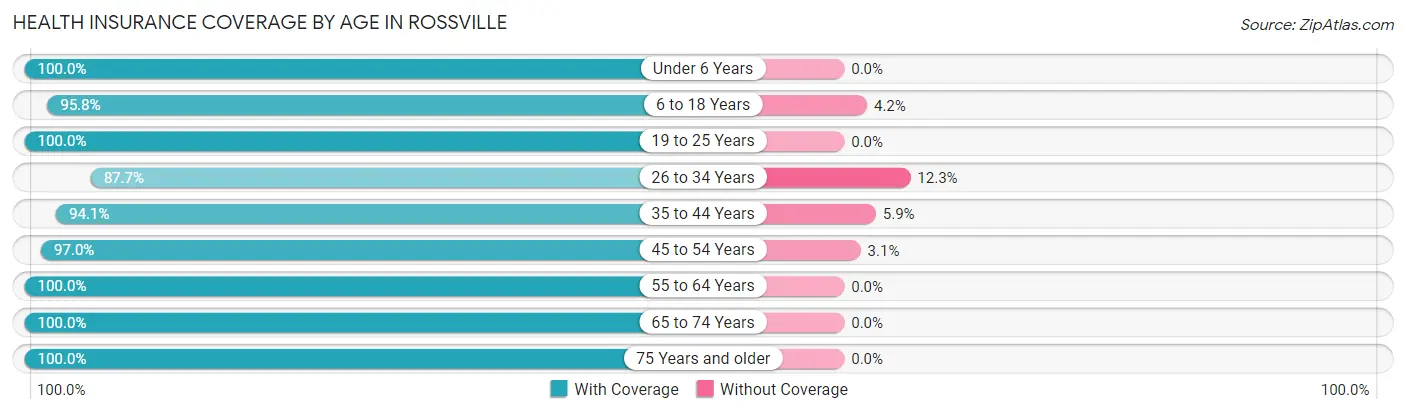
| Age Bracket | With Coverage | Without Coverage |
| Under 6 Years | 58 (100.0%) | 0 (0.0%) |
| 6 to 18 Years | 113 (95.8%) | 5 (4.2%) |
| 19 to 25 Years | 69 (100.0%) | 0 (0.0%) |
| 26 to 34 Years | 128 (87.7%) | 18 (12.3%) |
| 35 to 44 Years | 96 (94.1%) | 6 (5.9%) |
| 45 to 54 Years | 191 (97.0%) | 6 (3.0%) |
| 55 to 64 Years | 274 (100.0%) | 0 (0.0%) |
| 65 to 74 Years | 175 (100.0%) | 0 (0.0%) |
| 75 Years and older | 46 (100.0%) | 0 (0.0%) |
| Total | 1,150 (97.1%) | 35 (2.9%) |
Health Insurance Coverage by Citizenship Status in Rossville
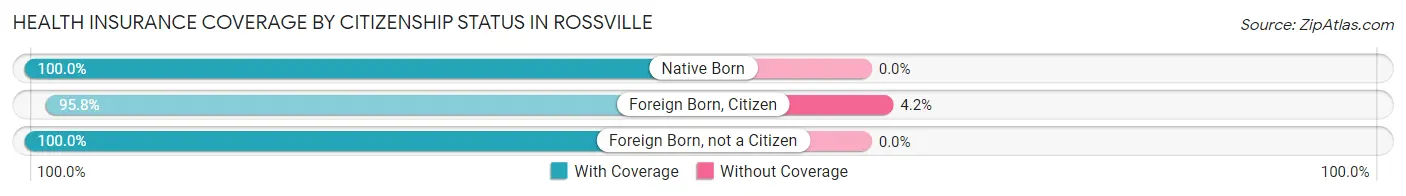
| Citizenship Status | With Coverage | Without Coverage |
| Native Born | 58 (100.0%) | 0 (0.0%) |
| Foreign Born, Citizen | 113 (95.8%) | 5 (4.2%) |
| Foreign Born, not a Citizen | 69 (100.0%) | 0 (0.0%) |
Health Insurance Coverage by Household Income in Rossville
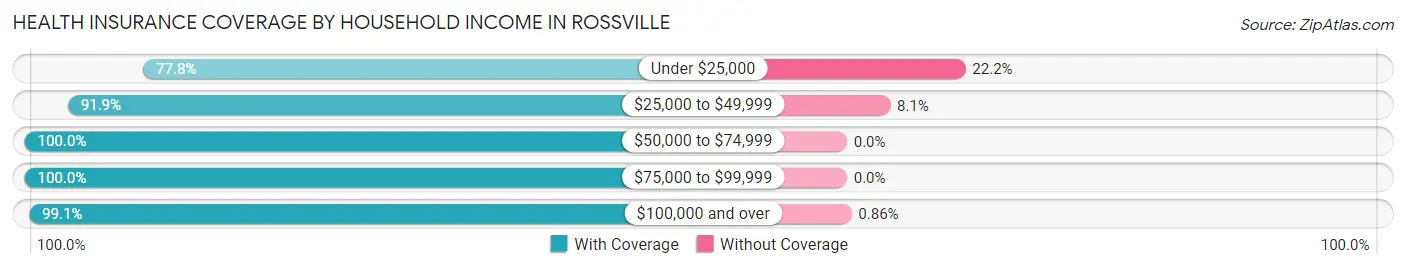
| Household Income | With Coverage | Without Coverage |
| Under $25,000 | 77 (77.8%) | 22 (22.2%) |
| $25,000 to $49,999 | 68 (91.9%) | 6 (8.1%) |
| $50,000 to $74,999 | 80 (100.0%) | 0 (0.0%) |
| $75,000 to $99,999 | 117 (100.0%) | 0 (0.0%) |
| $100,000 and over | 808 (99.1%) | 7 (0.9%) |
Public vs Private Health Insurance Coverage by Age in Rossville
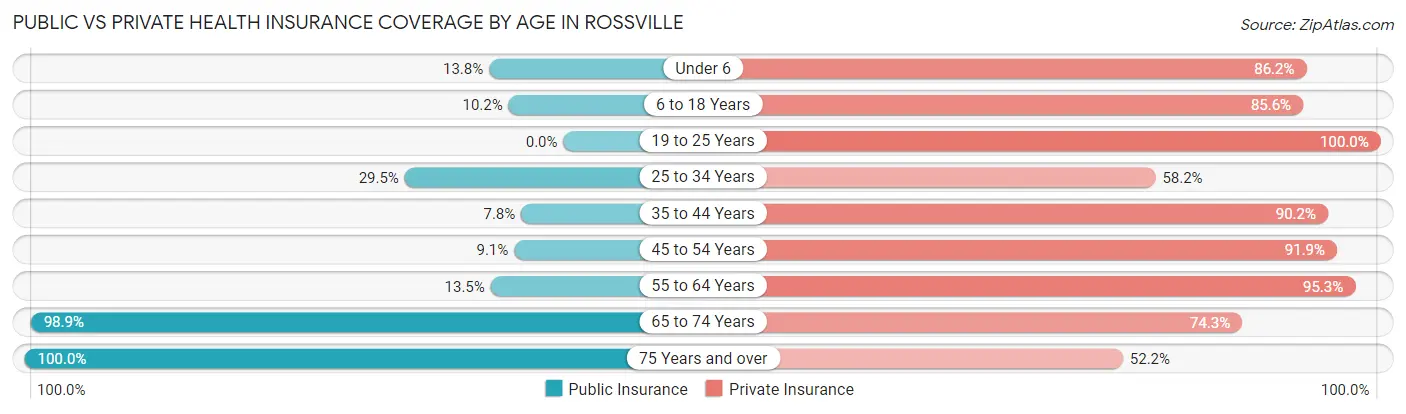
| Age Bracket | Public Insurance | Private Insurance |
| Under 6 | 8 (13.8%) | 50 (86.2%) |
| 6 to 18 Years | 12 (10.2%) | 101 (85.6%) |
| 19 to 25 Years | 0 (0.0%) | 69 (100.0%) |
| 25 to 34 Years | 43 (29.4%) | 85 (58.2%) |
| 35 to 44 Years | 8 (7.8%) | 92 (90.2%) |
| 45 to 54 Years | 18 (9.1%) | 181 (91.9%) |
| 55 to 64 Years | 37 (13.5%) | 261 (95.3%) |
| 65 to 74 Years | 173 (98.9%) | 130 (74.3%) |
| 75 Years and over | 46 (100.0%) | 24 (52.2%) |
| Total | 345 (29.1%) | 993 (83.8%) |
Disability Status by Sex by Age in Rossville
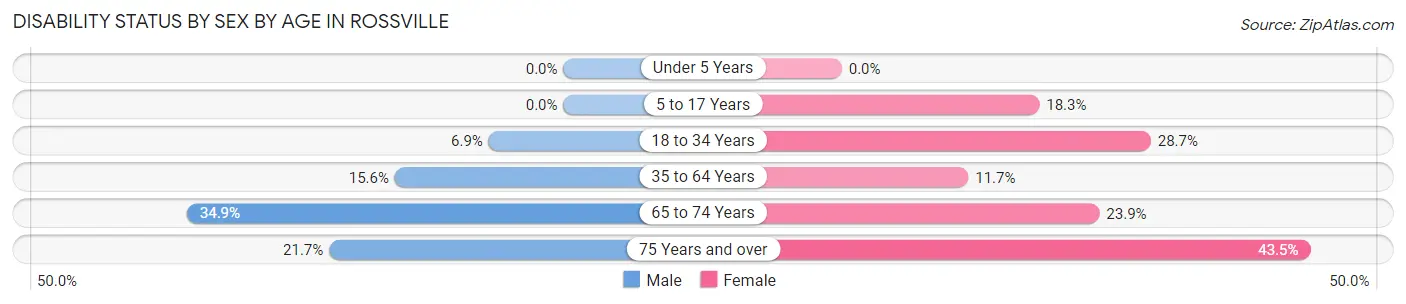
| Age Bracket | Male | Female |
| Under 5 Years | 0 (0.0%) | 0 (0.0%) |
| 5 to 17 Years | 0 (0.0%) | 11 (18.3%) |
| 18 to 34 Years | 7 (6.9%) | 37 (28.7%) |
| 35 to 64 Years | 43 (15.6%) | 35 (11.7%) |
| 65 to 74 Years | 29 (34.9%) | 22 (23.9%) |
| 75 Years and over | 5 (21.7%) | 10 (43.5%) |
Disability Class by Sex by Age in Rossville
Disability Class: Hearing Difficulty
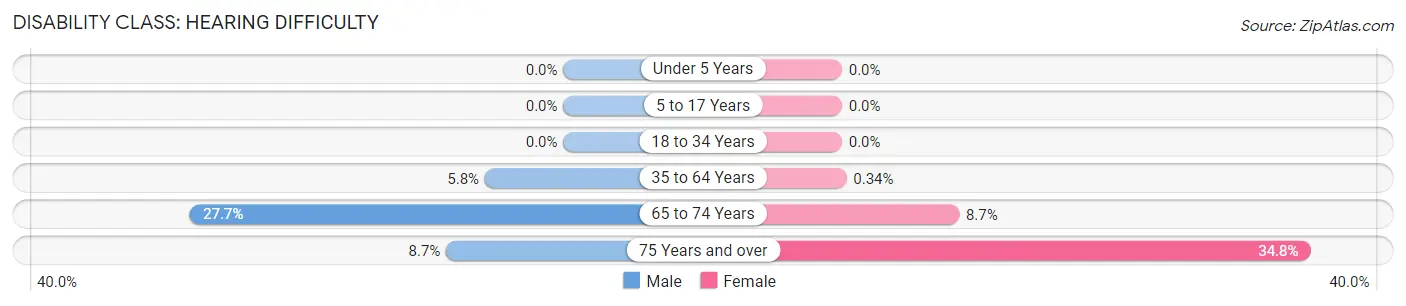
| Age Bracket | Male | Female |
| Under 5 Years | 0 (0.0%) | 0 (0.0%) |
| 5 to 17 Years | 0 (0.0%) | 0 (0.0%) |
| 18 to 34 Years | 0 (0.0%) | 0 (0.0%) |
| 35 to 64 Years | 16 (5.8%) | 1 (0.3%) |
| 65 to 74 Years | 23 (27.7%) | 8 (8.7%) |
| 75 Years and over | 2 (8.7%) | 8 (34.8%) |
Disability Class: Vision Difficulty
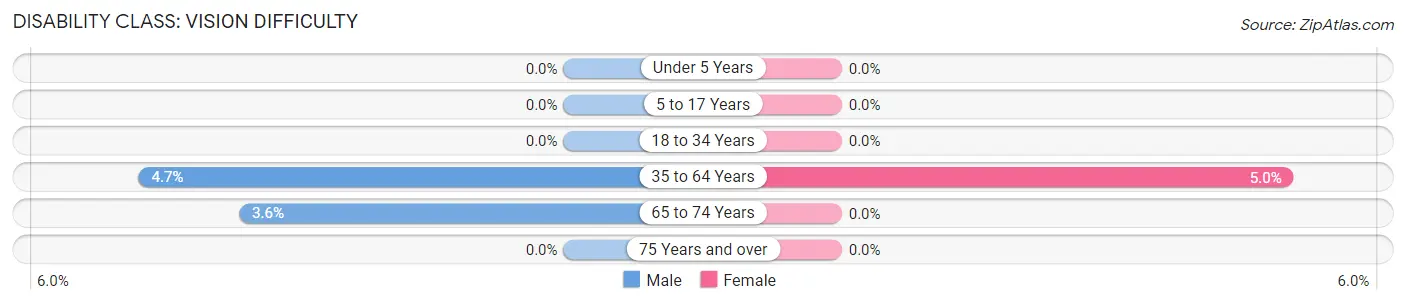
| Age Bracket | Male | Female |
| Under 5 Years | 0 (0.0%) | 0 (0.0%) |
| 5 to 17 Years | 0 (0.0%) | 0 (0.0%) |
| 18 to 34 Years | 0 (0.0%) | 0 (0.0%) |
| 35 to 64 Years | 13 (4.7%) | 15 (5.0%) |
| 65 to 74 Years | 3 (3.6%) | 0 (0.0%) |
| 75 Years and over | 0 (0.0%) | 0 (0.0%) |
Disability Class: Cognitive Difficulty
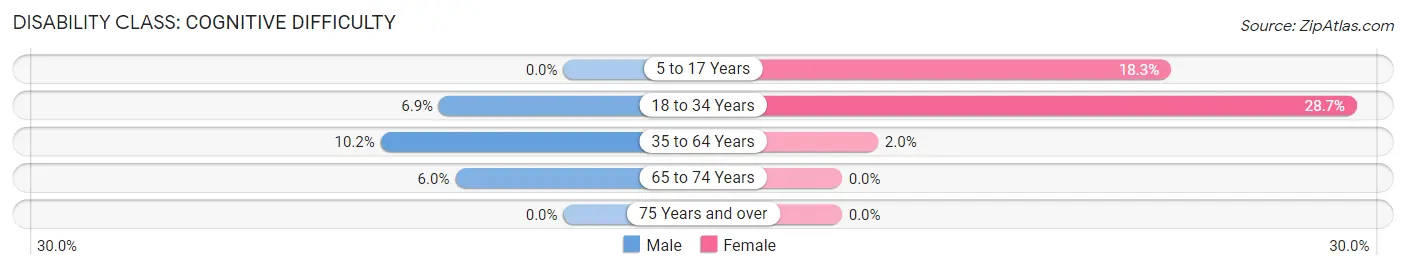
| Age Bracket | Male | Female |
| 5 to 17 Years | 0 (0.0%) | 11 (18.3%) |
| 18 to 34 Years | 7 (6.9%) | 37 (28.7%) |
| 35 to 64 Years | 28 (10.2%) | 6 (2.0%) |
| 65 to 74 Years | 5 (6.0%) | 0 (0.0%) |
| 75 Years and over | 0 (0.0%) | 0 (0.0%) |
Disability Class: Ambulatory Difficulty
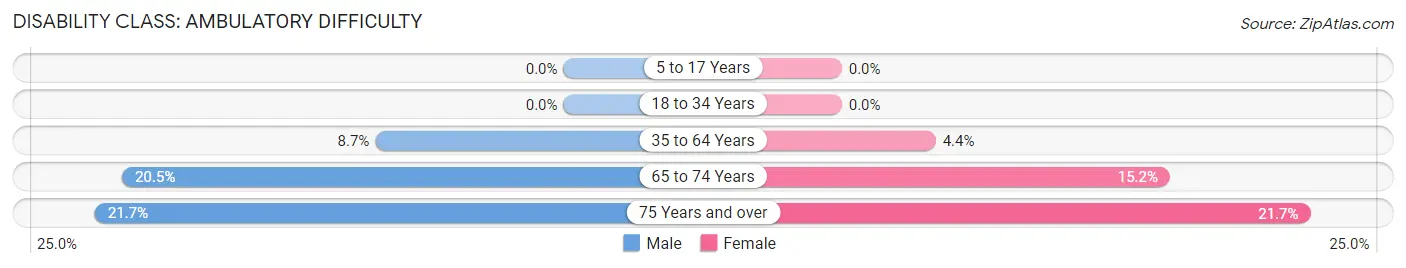
| Age Bracket | Male | Female |
| 5 to 17 Years | 0 (0.0%) | 0 (0.0%) |
| 18 to 34 Years | 0 (0.0%) | 0 (0.0%) |
| 35 to 64 Years | 24 (8.7%) | 13 (4.4%) |
| 65 to 74 Years | 17 (20.5%) | 14 (15.2%) |
| 75 Years and over | 5 (21.7%) | 5 (21.7%) |
Disability Class: Self-Care Difficulty
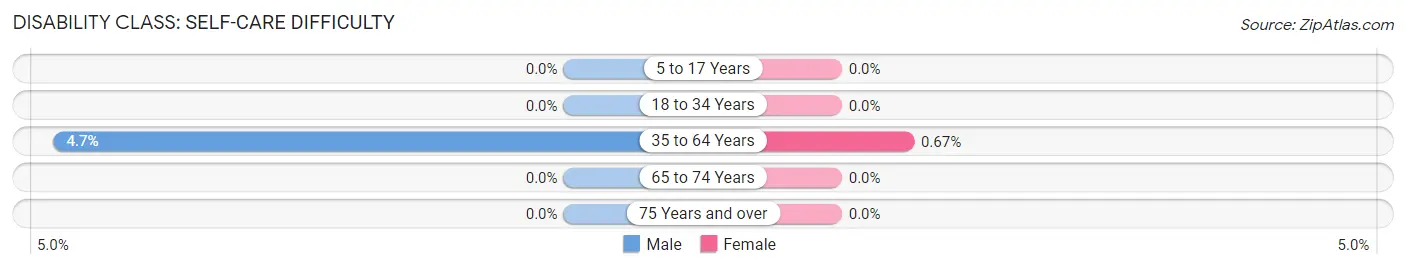
| Age Bracket | Male | Female |
| 5 to 17 Years | 0 (0.0%) | 0 (0.0%) |
| 18 to 34 Years | 0 (0.0%) | 0 (0.0%) |
| 35 to 64 Years | 13 (4.7%) | 2 (0.7%) |
| 65 to 74 Years | 0 (0.0%) | 0 (0.0%) |
| 75 Years and over | 0 (0.0%) | 0 (0.0%) |
Technology Access in Rossville
Computing Device Access in Rossville
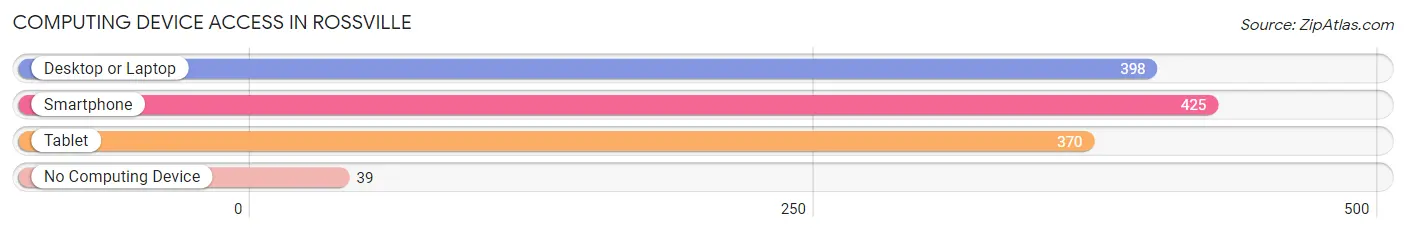
| Device Type | # Households | % Households |
| Desktop or Laptop | 398 | 81.6% |
| Smartphone | 425 | 87.1% |
| Tablet | 370 | 75.8% |
| No Computing Device | 39 | 8.0% |
| Total | 488 | 100.0% |
Internet Access in Rossville
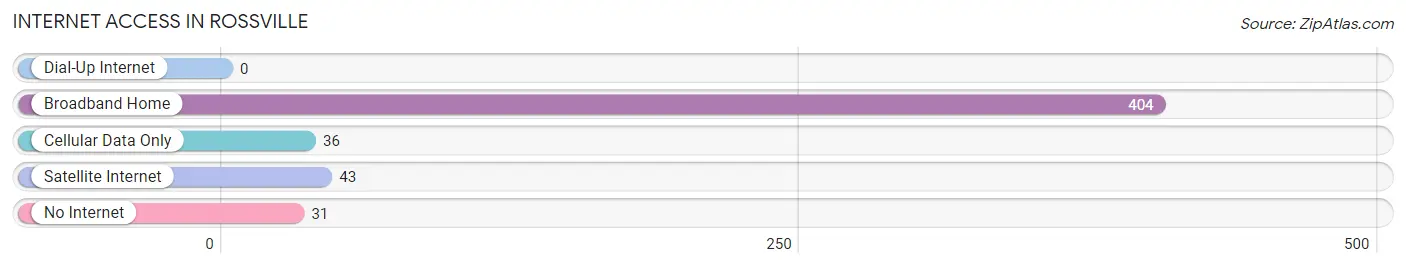
| Internet Type | # Households | % Households |
| Dial-Up Internet | 0 | 0.0% |
| Broadband Home | 404 | 82.8% |
| Cellular Data Only | 36 | 7.4% |
| Satellite Internet | 43 | 8.8% |
| No Internet | 31 | 6.4% |
| Total | 488 | 100.0% |
Rossville Summary
Rossville is a small town located in Fayette County, Tennessee. It is situated in the southwestern corner of the state, just north of the Tennessee River. The town was founded in 1820 and has a population of approximately 1,500 people.
History
The town of Rossville was founded in 1820 by William Ross, a Revolutionary War veteran. He named the town after his father, Robert Ross, who had served in the same war. The town was originally a small farming community, but it soon grew to become a major trading center for the surrounding area. In 1845, the town was incorporated and the first post office was established.
In the late 19th century, Rossville became a major railroad hub. The town was connected to the Memphis & Charleston Railroad, which ran from Memphis to Chattanooga. This allowed the town to become a major shipping center for the region. The railroad also brought new businesses and industries to the area, including a cotton mill, a sawmill, and a gristmill.
Geography
Rossville is located in the southwestern corner of Fayette County, Tennessee. It is situated just north of the Tennessee River, which forms the border between Tennessee and Mississippi. The town is surrounded by rolling hills and farmland, and is located about 25 miles from Memphis.
The climate in Rossville is humid subtropical, with hot summers and mild winters. The average annual temperature is around 65 degrees Fahrenheit, and the average annual precipitation is around 45 inches.
Economy
The economy of Rossville is largely based on agriculture and manufacturing. The town is home to several large farms, which produce a variety of crops, including corn, soybeans, and cotton. The town is also home to several manufacturing companies, which produce a variety of products, including furniture, clothing, and automotive parts.
The town is also home to several small businesses, including restaurants, shops, and services. The town is also home to a few tourist attractions, including the Rossville Museum and the Rossville Historic District.
Demographics
As of the 2010 census, the population of Rossville was 1,500. The racial makeup of the town was 95.3% White, 2.7% African American, 0.3% Native American, 0.3% Asian, and 1.3% from other races. The median household income was $37,500, and the median family income was $45,000.
The town is home to several churches, including the First Baptist Church of Rossville, the Rossville United Methodist Church, and the Rossville Presbyterian Church. The town is also home to several schools, including Rossville Elementary School, Rossville Middle School, and Rossville High School.
Conclusion
Rossville is a small town located in Fayette County, Tennessee. It was founded in 1820 and has a population of approximately 1,500 people. The town is largely based on agriculture and manufacturing, and is home to several small businesses, churches, and schools. The town is also home to several tourist attractions, including the Rossville Museum and the Rossville Historic District.
Common Questions
What is Per Capita Income in Rossville?
Per Capita income in Rossville is $54,382.
What is the Median Family Income in Rossville?
Median Family Income in Rossville is $145,188.
What is the Median Household income in Rossville?
Median Household Income in Rossville is $117,500.
What is Income or Wage Gap in Rossville?
Income or Wage Gap in Rossville is 30.2%.
Women in Rossville earn 69.8 cents for every dollar earned by a man.
What is Inequality or Gini Index in Rossville?
Inequality or Gini Index in Rossville is 0.37.
What is the Total Population of Rossville?
Total Population of Rossville is 1,185.
What is the Total Male Population of Rossville?
Total Male Population of Rossville is 570.
What is the Total Female Population of Rossville?
Total Female Population of Rossville is 615.
What is the Ratio of Males per 100 Females in Rossville?
There are 92.68 Males per 100 Females in Rossville.
What is the Ratio of Females per 100 Males in Rossville?
There are 107.89 Females per 100 Males in Rossville.
What is the Median Population Age in Rossville?
Median Population Age in Rossville is 51.4 Years.
What is the Average Family Size in Rossville
Average Family Size in Rossville is 2.8 People.
What is the Average Household Size in Rossville
Average Household Size in Rossville is 2.4 People.
How Large is the Labor Force in Rossville?
There are 712 People in the Labor Forcein in Rossville.
What is the Percentage of People in the Labor Force in Rossville?
69.1% of People are in the Labor Force in Rossville.
What is the Unemployment Rate in Rossville?
Unemployment Rate in Rossville is 9.0%.