Ripley, TN Map & Demographics
Ripley Map
Ripley Overview
$22,503
PER CAPITA INCOME
$47,256
AVG FAMILY INCOME
$39,454
AVG HOUSEHOLD INCOME
32.7%
WAGE / INCOME GAP [ % ]
67.3¢/ $1
WAGE / INCOME GAP [ $ ]
$14,003
FAMILY INCOME DEFICIT
0.48
INEQUALITY / GINI INDEX
7,794
TOTAL POPULATION
3,783
MALE POPULATION
4,011
FEMALE POPULATION
94.32
MALES / 100 FEMALES
106.03
FEMALES / 100 MALES
36.7
MEDIAN AGE
3.3
AVG FAMILY SIZE
2.6
AVG HOUSEHOLD SIZE
3,070
LABOR FORCE [ PEOPLE ]
50.0%
PERCENT IN LABOR FORCE
9.6%
UNEMPLOYMENT RATE
Ripley Zip Codes
Ripley Area Codes
Income in Ripley
Income Overview in Ripley
Per Capita Income in Ripley is $22,503, while median incomes of families and households are $47,256 and $39,454 respectively.
| Characteristic | Number | Measure |
| Per Capita Income | 7,794 | $22,503 |
| Median Family Income | 1,794 | $47,256 |
| Mean Family Income | 1,794 | $63,528 |
| Median Household Income | 2,873 | $39,454 |
| Mean Household Income | 2,873 | $53,452 |
| Income Deficit | 1,794 | $14,003 |
| Wage / Income Gap (%) | 7,794 | 32.68% |
| Wage / Income Gap ($) | 7,794 | 67.32¢ per $1 |
| Gini / Inequality Index | 7,794 | 0.48 |
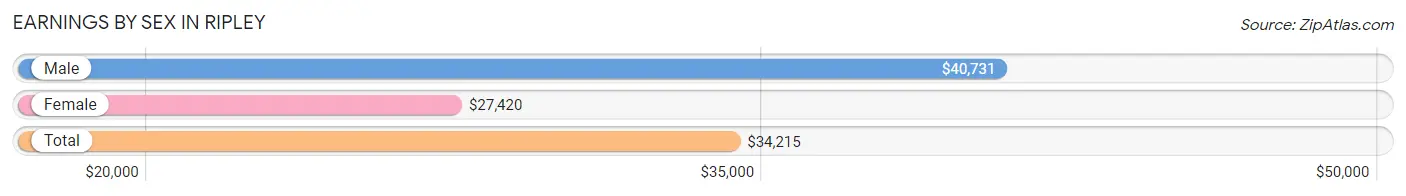
Earnings by Sex in Ripley
Average Earnings in Ripley are $34,215, $40,731 for men and $27,420 for women, a difference of 32.7%.
| Sex | Number | Average Earnings |
| Male | 1,683 (50.4%) | $40,731 |
| Female | 1,654 (49.6%) | $27,420 |
| Total | 3,337 (100.0%) | $34,215 |
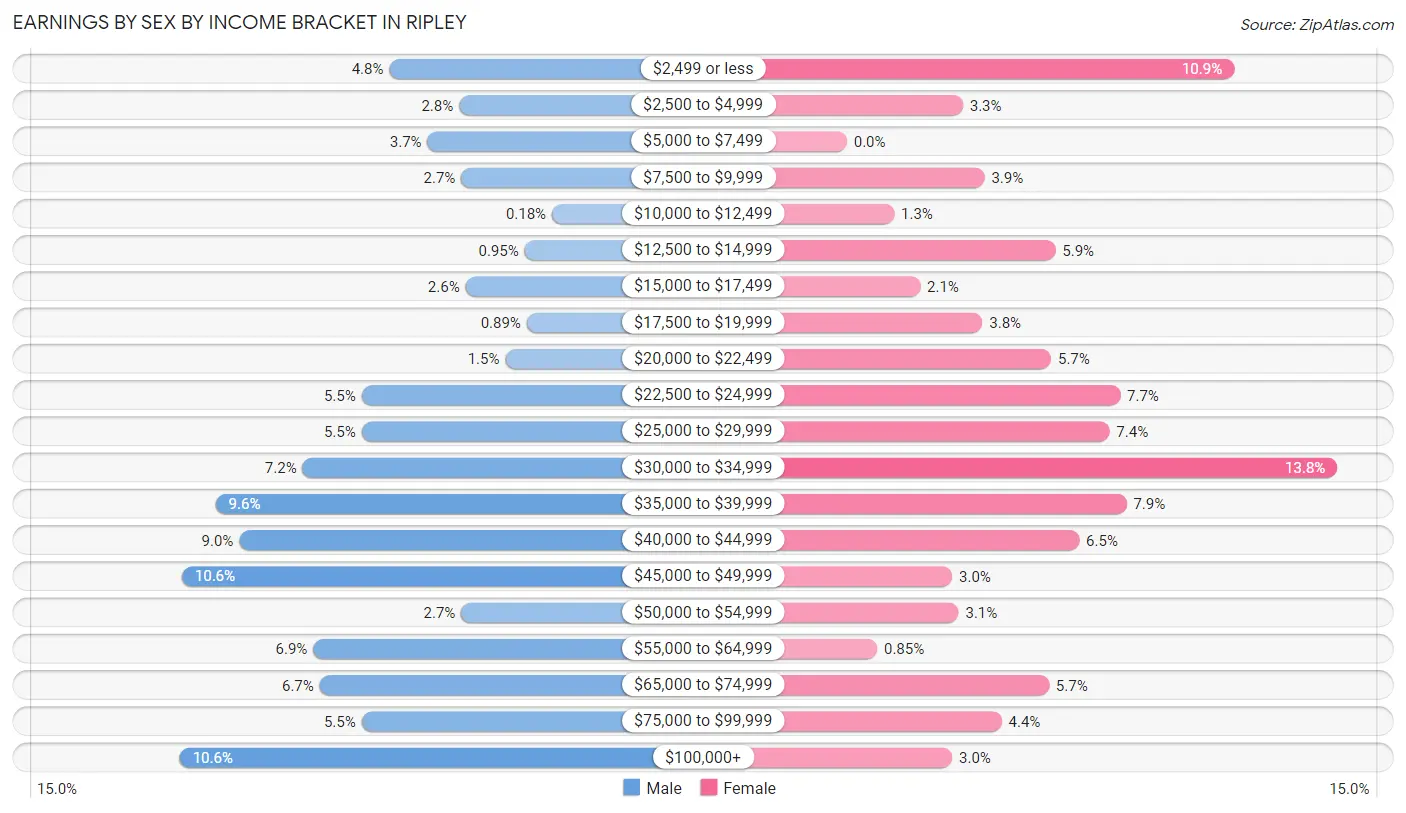
Earnings by Sex by Income Bracket in Ripley
The most common earnings brackets in Ripley are $100,000+ for men (179 | 10.6%) and $30,000 to $34,999 for women (228 | 13.8%).
| Income | Male | Female |
| $2,499 or less | 80 (4.8%) | 180 (10.9%) |
| $2,500 to $4,999 | 47 (2.8%) | 54 (3.3%) |
| $5,000 to $7,499 | 62 (3.7%) | 0 (0.0%) |
| $7,500 to $9,999 | 46 (2.7%) | 64 (3.9%) |
| $10,000 to $12,499 | 3 (0.2%) | 22 (1.3%) |
| $12,500 to $14,999 | 16 (0.9%) | 97 (5.9%) |
| $15,000 to $17,499 | 44 (2.6%) | 34 (2.1%) |
| $17,500 to $19,999 | 15 (0.9%) | 63 (3.8%) |
| $20,000 to $22,499 | 25 (1.5%) | 95 (5.7%) |
| $22,500 to $24,999 | 93 (5.5%) | 127 (7.7%) |
| $25,000 to $29,999 | 93 (5.5%) | 122 (7.4%) |
| $30,000 to $34,999 | 121 (7.2%) | 228 (13.8%) |
| $35,000 to $39,999 | 162 (9.6%) | 130 (7.9%) |
| $40,000 to $44,999 | 151 (9.0%) | 108 (6.5%) |
| $45,000 to $49,999 | 178 (10.6%) | 49 (3.0%) |
| $50,000 to $54,999 | 46 (2.7%) | 52 (3.1%) |
| $55,000 to $64,999 | 116 (6.9%) | 14 (0.9%) |
| $65,000 to $74,999 | 113 (6.7%) | 94 (5.7%) |
| $75,000 to $99,999 | 93 (5.5%) | 72 (4.3%) |
| $100,000+ | 179 (10.6%) | 49 (3.0%) |
| Total | 1,683 (100.0%) | 1,654 (100.0%) |
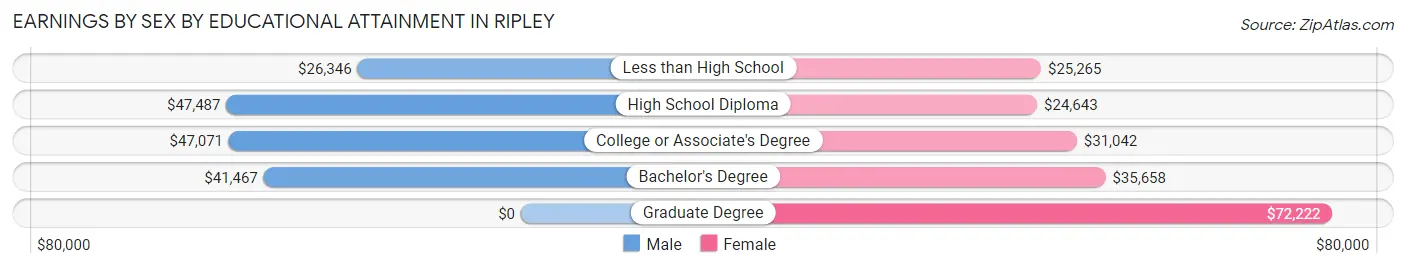
Earnings by Sex by Educational Attainment in Ripley
Average earnings in Ripley are $45,638 for men and $30,378 for women, a difference of 33.4%. Men with an educational attainment of high school diploma enjoy the highest average annual earnings of $47,487, while those with less than high school education earn the least with $26,346. Women with an educational attainment of graduate degree earn the most with the average annual earnings of $72,222, while those with high school diploma education have the smallest earnings of $24,643.
| Educational Attainment | Male Income | Female Income |
| Less than High School | $26,346 | $25,265 |
| High School Diploma | $47,487 | $24,643 |
| College or Associate's Degree | $47,071 | $31,042 |
| Bachelor's Degree | $41,467 | $35,658 |
| Graduate Degree | - | - |
| Total | $45,638 | $30,378 |
Family Income in Ripley
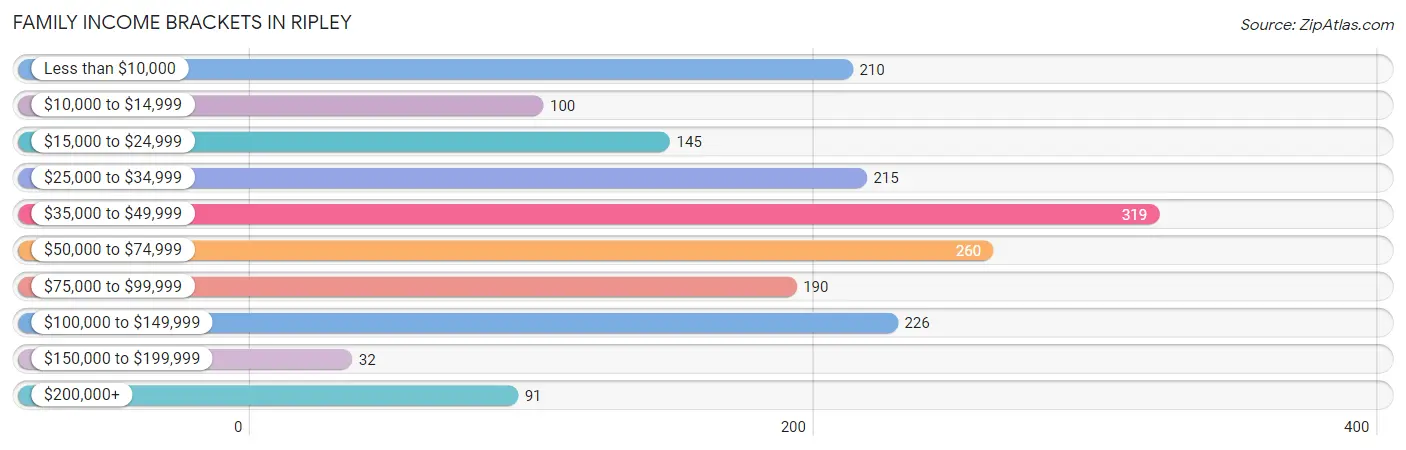
Family Income Brackets in Ripley
According to the Ripley family income data, there are 319 families falling into the $35,000 to $49,999 income range, which is the most common income bracket and makes up 17.8% of all families. Conversely, the $150,000 to $199,999 income bracket is the least frequent group with only 32 families (1.8%) belonging to this category.
| Income Bracket | # Families | % Families |
| Less than $10,000 | 210 | 11.7% |
| $10,000 to $14,999 | 100 | 5.6% |
| $15,000 to $24,999 | 145 | 8.1% |
| $25,000 to $34,999 | 215 | 12.0% |
| $35,000 to $49,999 | 319 | 17.8% |
| $50,000 to $74,999 | 260 | 14.5% |
| $75,000 to $99,999 | 190 | 10.6% |
| $100,000 to $149,999 | 226 | 12.6% |
| $150,000 to $199,999 | 32 | 1.8% |
| $200,000+ | 91 | 5.1% |
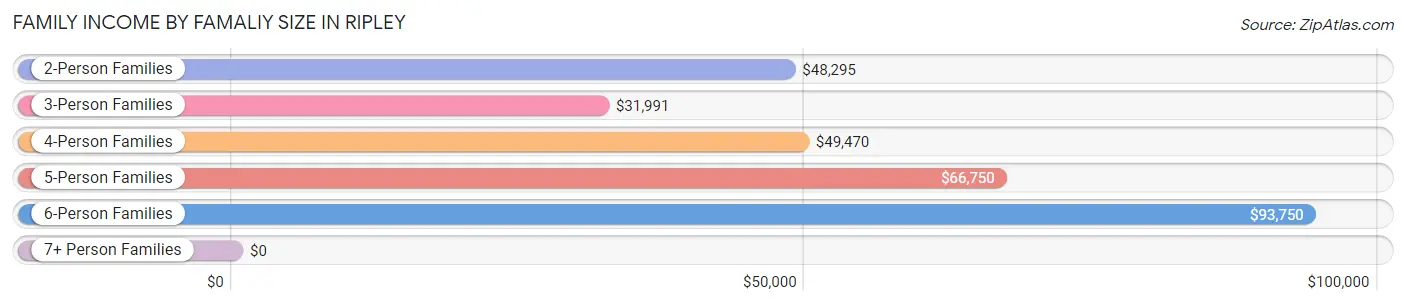
Family Income by Famaliy Size in Ripley
6-person families (124 | 6.9%) account for the highest median family income in Ripley with $93,750 per family, while 2-person families (819 | 45.7%) have the highest median income of $24,148 per family member.
| Income Bracket | # Families | Median Income |
| 2-Person Families | 819 (45.7%) | $48,295 |
| 3-Person Families | 483 (26.9%) | $31,991 |
| 4-Person Families | 138 (7.7%) | $49,470 |
| 5-Person Families | 218 (12.1%) | $66,750 |
| 6-Person Families | 124 (6.9%) | $93,750 |
| 7+ Person Families | 12 (0.7%) | $0 |
| Total | 1,794 (100.0%) | $47,256 |
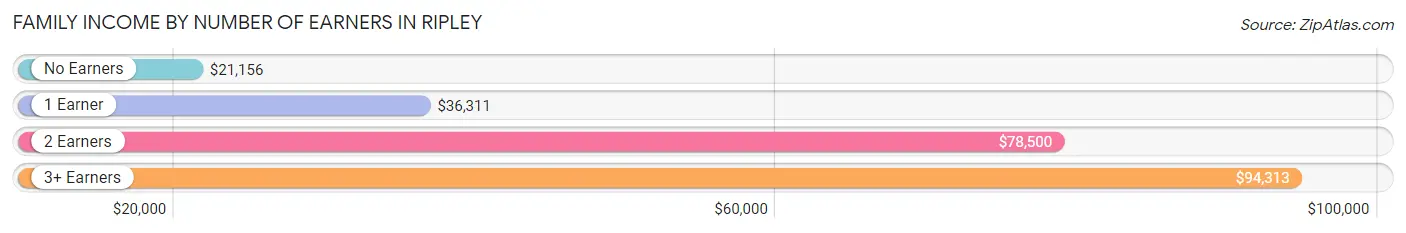
Family Income by Number of Earners in Ripley
The median family income in Ripley is $47,256, with families comprising 3+ earners (140) having the highest median family income of $94,313, while families with no earners (389) have the lowest median family income of $21,156, accounting for 7.8% and 21.7% of families, respectively.
| Number of Earners | # Families | Median Income |
| No Earners | 389 (21.7%) | $21,156 |
| 1 Earner | 691 (38.5%) | $36,311 |
| 2 Earners | 574 (32.0%) | $78,500 |
| 3+ Earners | 140 (7.8%) | $94,313 |
| Total | 1,794 (100.0%) | $47,256 |
Household Income in Ripley
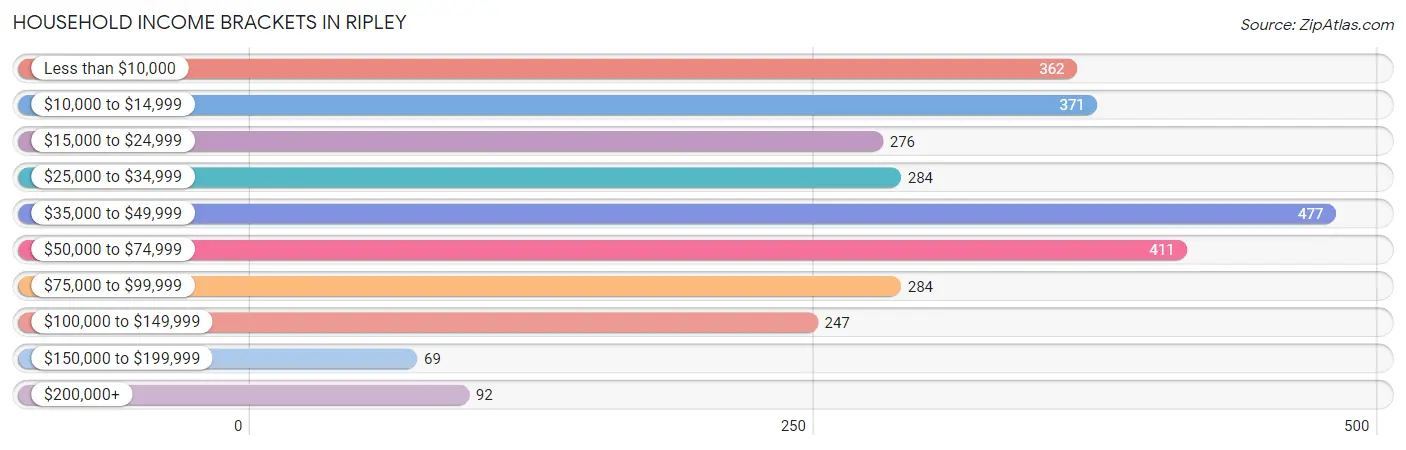
Household Income Brackets in Ripley
With 477 households falling in the category, the $35,000 to $49,999 income range is the most frequent in Ripley, accounting for 16.6% of all households. In contrast, only 69 households (2.4%) fall into the $150,000 to $199,999 income bracket, making it the least populous group.
| Income Bracket | # Households | % Households |
| Less than $10,000 | 362 | 12.6% |
| $10,000 to $14,999 | 371 | 12.9% |
| $15,000 to $24,999 | 276 | 9.6% |
| $25,000 to $34,999 | 284 | 9.9% |
| $35,000 to $49,999 | 477 | 16.6% |
| $50,000 to $74,999 | 411 | 14.3% |
| $75,000 to $99,999 | 284 | 9.9% |
| $100,000 to $149,999 | 247 | 8.6% |
| $150,000 to $199,999 | 69 | 2.4% |
| $200,000+ | 92 | 3.2% |
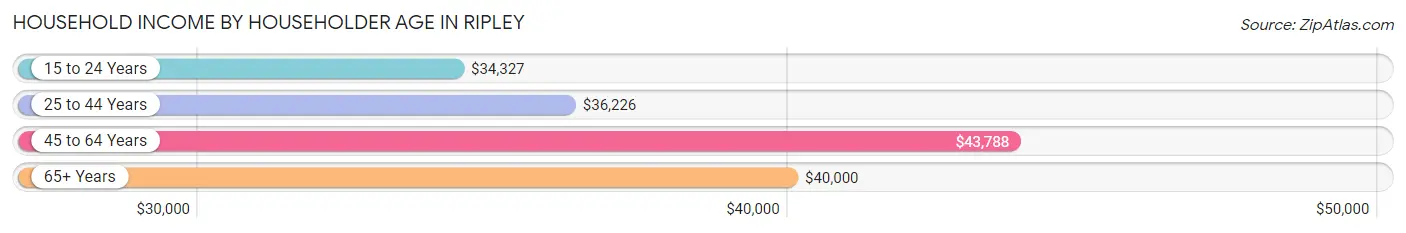
Household Income by Householder Age in Ripley
The median household income in Ripley is $39,454, with the highest median household income of $43,788 found in the 45 to 64 years age bracket for the primary householder. A total of 1,202 households (41.8%) fall into this category. Meanwhile, the 15 to 24 years age bracket for the primary householder has the lowest median household income of $34,327, with 282 households (9.8%) in this group.
| Income Bracket | # Households | Median Income |
| 15 to 24 Years | 282 (9.8%) | $34,327 |
| 25 to 44 Years | 789 (27.5%) | $36,226 |
| 45 to 64 Years | 1,202 (41.8%) | $43,788 |
| 65+ Years | 600 (20.9%) | $40,000 |
| Total | 2,873 (100.0%) | $39,454 |
Poverty in Ripley
Income Below Poverty by Sex and Age in Ripley
With 23.5% poverty level for males and 27.6% for females among the residents of Ripley, 5 year old males and 15 year old females are the most vulnerable to poverty, with 45 males (84.9%) and 47 females (71.2%) in their respective age groups living below the poverty level.
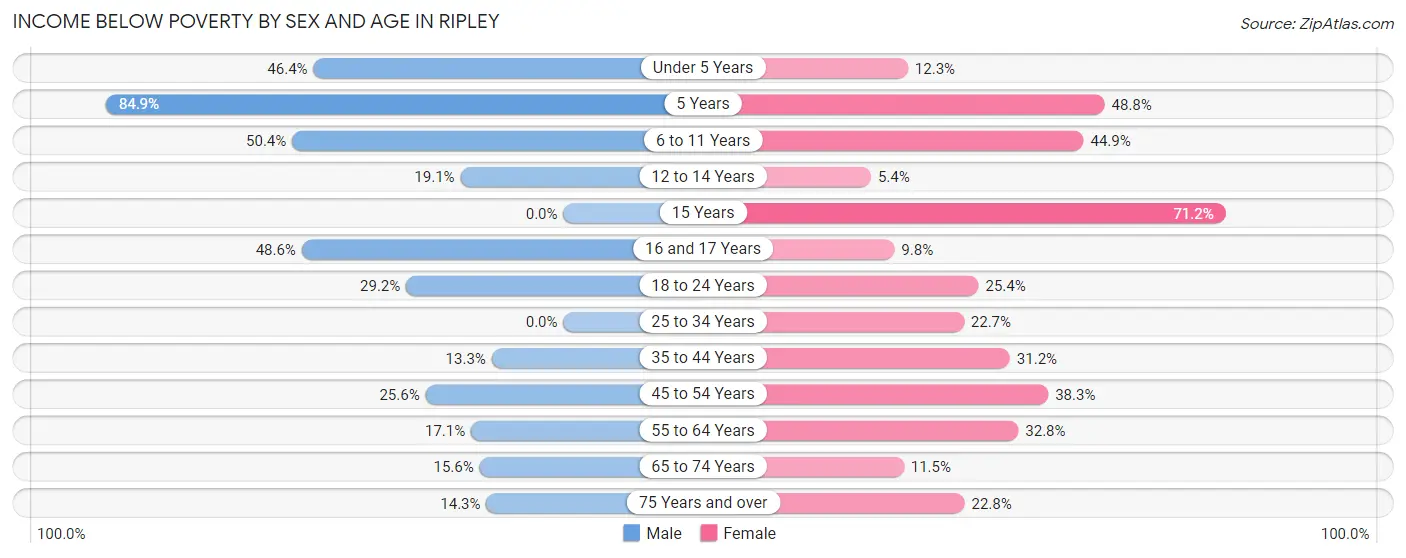
| Age Bracket | Male | Female |
| Under 5 Years | 135 (46.4%) | 34 (12.3%) |
| 5 Years | 45 (84.9%) | 40 (48.8%) |
| 6 to 11 Years | 144 (50.3%) | 114 (44.9%) |
| 12 to 14 Years | 30 (19.1%) | 6 (5.4%) |
| 15 Years | 0 (0.0%) | 47 (71.2%) |
| 16 and 17 Years | 68 (48.6%) | 13 (9.8%) |
| 18 to 24 Years | 138 (29.2%) | 116 (25.4%) |
| 25 to 34 Years | 0 (0.0%) | 104 (22.7%) |
| 35 to 44 Years | 70 (13.3%) | 146 (31.2%) |
| 45 to 54 Years | 76 (25.6%) | 215 (38.3%) |
| 55 to 64 Years | 90 (17.1%) | 173 (32.8%) |
| 65 to 74 Years | 42 (15.6%) | 46 (11.5%) |
| 75 Years and over | 17 (14.3%) | 31 (22.8%) |
| Total | 855 (23.5%) | 1,085 (27.6%) |
Income Above Poverty by Sex and Age in Ripley
According to the poverty statistics in Ripley, males aged 15 years and females aged 12 to 14 years are the age groups that are most secure financially, with 100.0% of males and 94.6% of females in these age groups living above the poverty line.
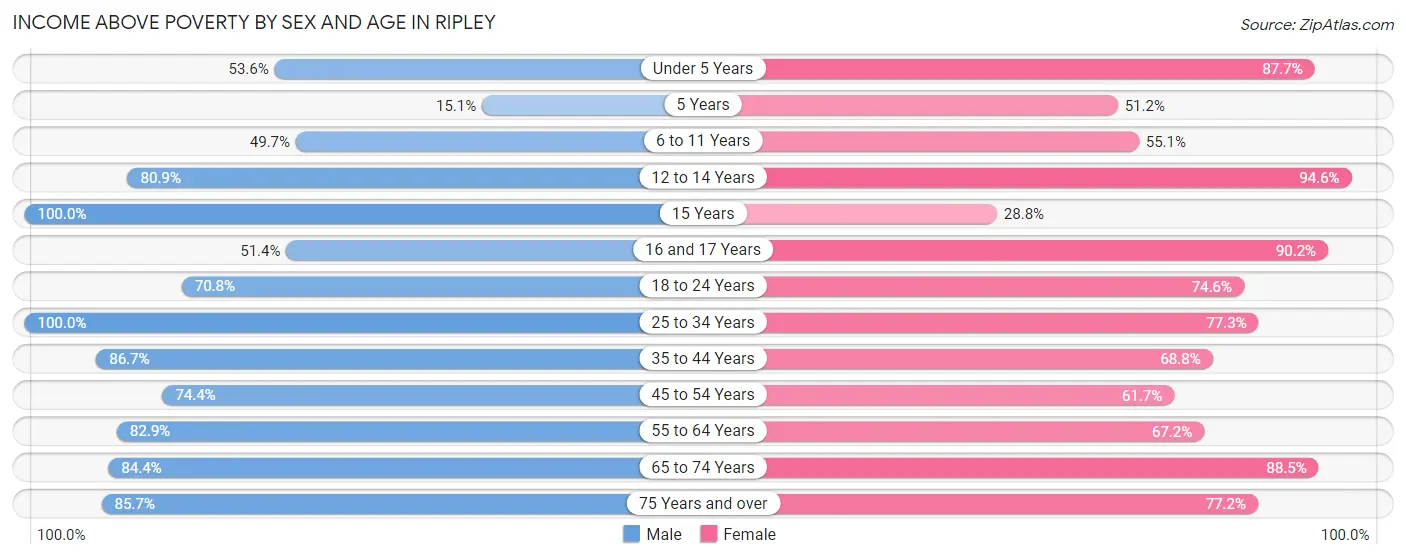
| Age Bracket | Male | Female |
| Under 5 Years | 156 (53.6%) | 243 (87.7%) |
| 5 Years | 8 (15.1%) | 42 (51.2%) |
| 6 to 11 Years | 142 (49.6%) | 140 (55.1%) |
| 12 to 14 Years | 127 (80.9%) | 105 (94.6%) |
| 15 Years | 77 (100.0%) | 19 (28.8%) |
| 16 and 17 Years | 72 (51.4%) | 120 (90.2%) |
| 18 to 24 Years | 335 (70.8%) | 341 (74.6%) |
| 25 to 34 Years | 426 (100.0%) | 355 (77.3%) |
| 35 to 44 Years | 456 (86.7%) | 322 (68.8%) |
| 45 to 54 Years | 221 (74.4%) | 346 (61.7%) |
| 55 to 64 Years | 435 (82.9%) | 355 (67.2%) |
| 65 to 74 Years | 228 (84.4%) | 354 (88.5%) |
| 75 Years and over | 102 (85.7%) | 105 (77.2%) |
| Total | 2,785 (76.5%) | 2,847 (72.4%) |
Income Below Poverty Among Married-Couple Families in Ripley
The poverty statistics for married-couple families in Ripley show that 5.2% or 44 of the total 845 families live below the poverty line. Families with 1 or 2 children have the highest poverty rate of 8.4%, comprising of 17 families. On the other hand, families with 3 or 4 children have the lowest poverty rate of 0.0%, which includes 0 families.
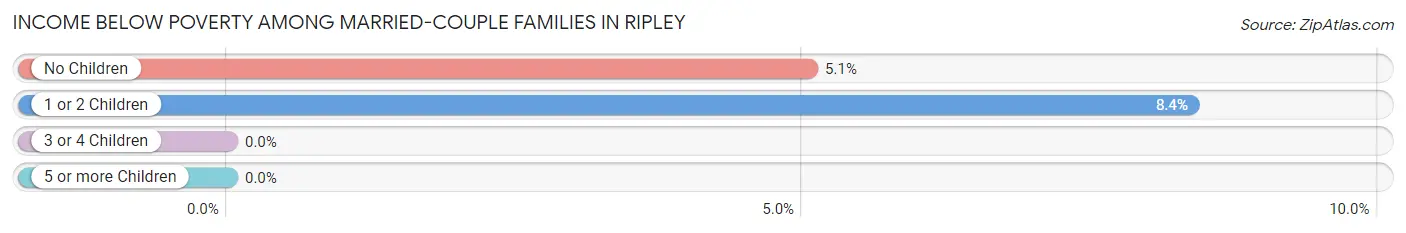
| Children | Above Poverty | Below Poverty |
| No Children | 508 (95.0%) | 27 (5.1%) |
| 1 or 2 Children | 186 (91.6%) | 17 (8.4%) |
| 3 or 4 Children | 107 (100.0%) | 0 (0.0%) |
| 5 or more Children | 0 (0.0%) | 0 (0.0%) |
| Total | 801 (94.8%) | 44 (5.2%) |
Income Below Poverty Among Single-Parent Households in Ripley
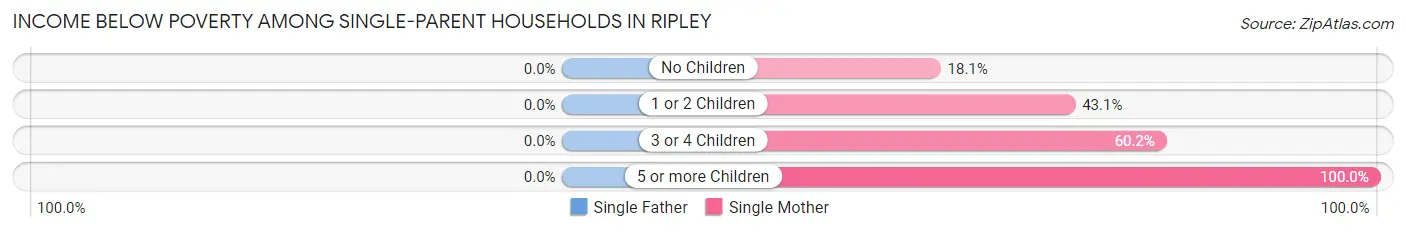
| Children | Single Father | Single Mother |
| No Children | 0 (0.0%) | 54 (18.1%) |
| 1 or 2 Children | 0 (0.0%) | 179 (43.1%) |
| 3 or 4 Children | 0 (0.0%) | 77 (60.2%) |
| 5 or more Children | 0 (0.0%) | 19 (100.0%) |
| Total | 0 (0.0%) | 329 (38.2%) |
Income Below Poverty Among Married-Couple vs Single-Parent Households in Ripley
The poverty data for Ripley shows that 44 of the married-couple family households (5.2%) and 329 of the single-parent households (34.7%) are living below the poverty level. Within the married-couple family households, those with 1 or 2 children have the highest poverty rate, with 17 households (8.4%) falling below the poverty line. Among the single-parent households, those with 5 or more children have the highest poverty rate, with 19 household (100.0%) living below poverty.
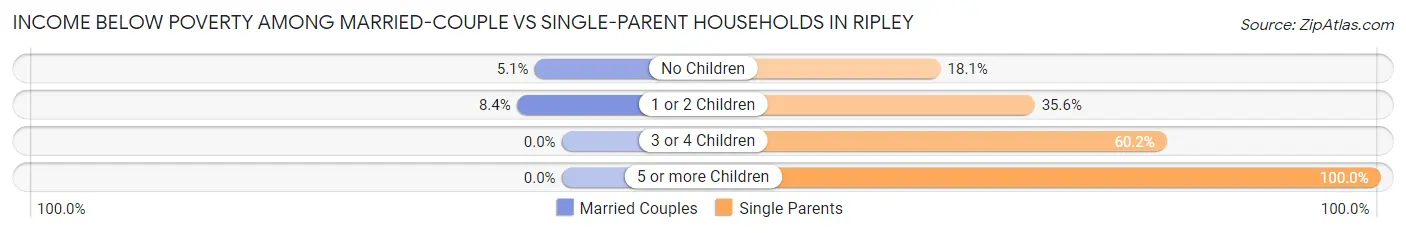
| Children | Married-Couple Families | Single-Parent Households |
| No Children | 27 (5.1%) | 54 (18.1%) |
| 1 or 2 Children | 17 (8.4%) | 179 (35.6%) |
| 3 or 4 Children | 0 (0.0%) | 77 (60.2%) |
| 5 or more Children | 0 (0.0%) | 19 (100.0%) |
| Total | 44 (5.2%) | 329 (34.7%) |
Race in Ripley
The most populous races in Ripley are Black / African American (4,438 | 56.9%), White / Caucasian (2,921 | 37.5%), and Two or more Races (320 | 4.1%).
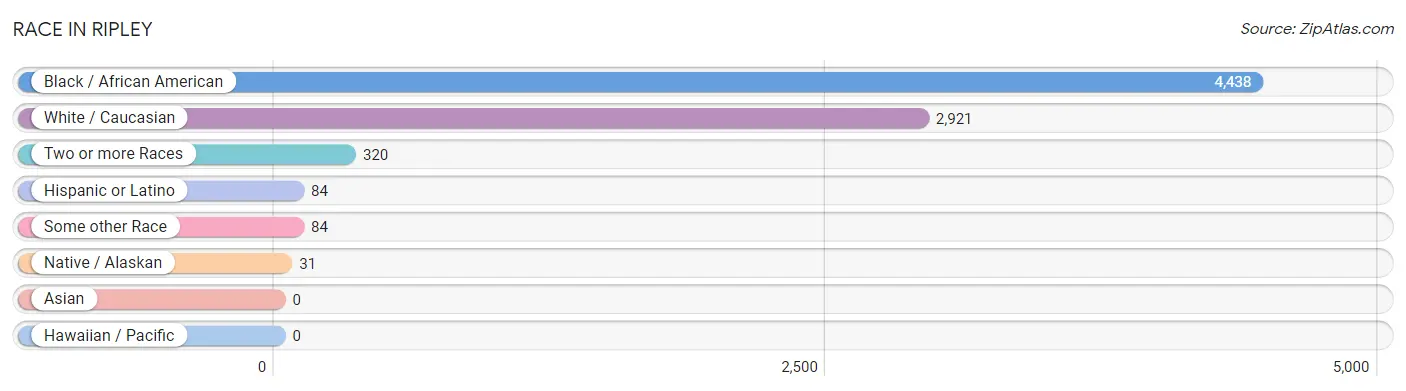
| Race | # Population | % Population |
| Asian | 0 | 0.0% |
| Black / African American | 4,438 | 56.9% |
| Hawaiian / Pacific | 0 | 0.0% |
| Hispanic or Latino | 84 | 1.1% |
| Native / Alaskan | 31 | 0.4% |
| White / Caucasian | 2,921 | 37.5% |
| Two or more Races | 320 | 4.1% |
| Some other Race | 84 | 1.1% |
| Total | 7,794 | 100.0% |
Ancestry in Ripley
The most populous ancestries reported in Ripley are American (637 | 8.2%), Irish (470 | 6.0%), English (304 | 3.9%), German (210 | 2.7%), and Mexican (84 | 1.1%), together accounting for 21.9% of all Ripley residents.
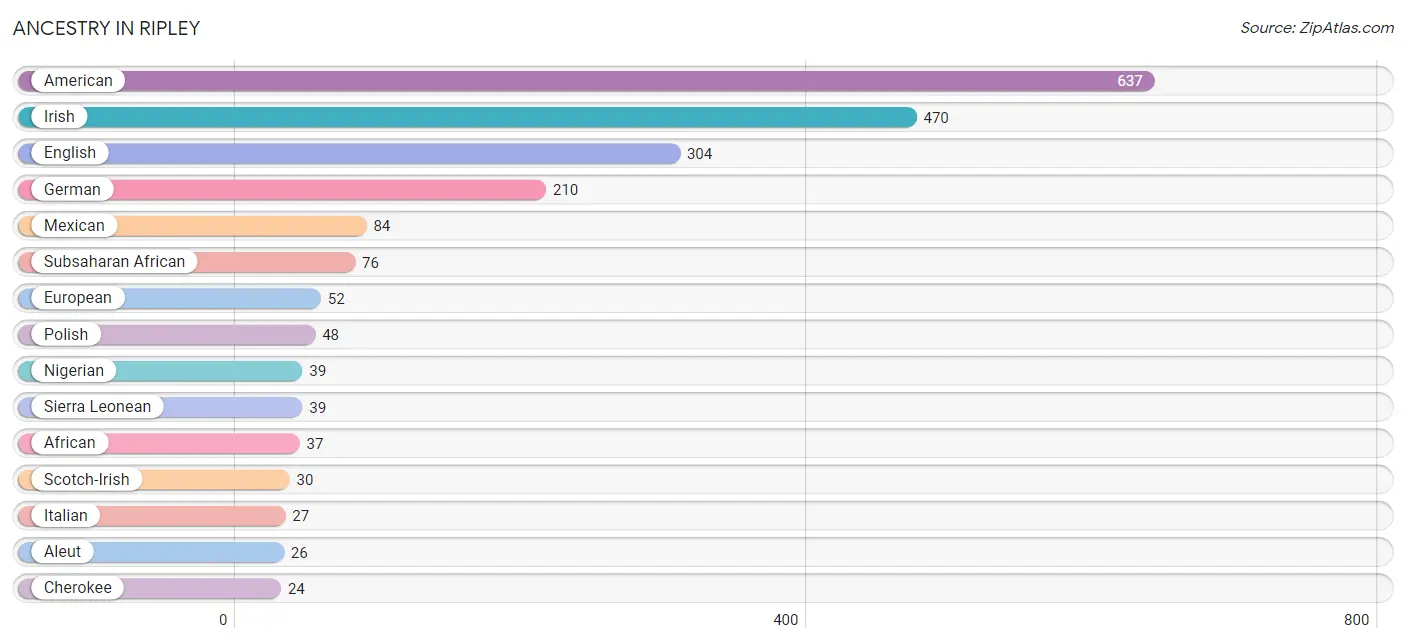
| Ancestry | # Population | % Population |
| African | 37 | 0.5% |
| Aleut | 26 | 0.3% |
| American | 637 | 8.2% |
| Cherokee | 24 | 0.3% |
| Czechoslovakian | 6 | 0.1% |
| English | 304 | 3.9% |
| European | 52 | 0.7% |
| French | 16 | 0.2% |
| French Canadian | 13 | 0.2% |
| German | 210 | 2.7% |
| Hungarian | 11 | 0.1% |
| Irish | 470 | 6.0% |
| Iroquois | 12 | 0.2% |
| Italian | 27 | 0.4% |
| Mexican | 84 | 1.1% |
| Nigerian | 39 | 0.5% |
| Norwegian | 6 | 0.1% |
| Polish | 48 | 0.6% |
| Russian | 7 | 0.1% |
| Scotch-Irish | 30 | 0.4% |
| Sierra Leonean | 39 | 0.5% |
| Subsaharan African | 76 | 1.0% |
| Welsh | 16 | 0.2% | View All 23 Rows |
Immigrants in Ripley
The most numerous immigrant groups reported in Ripley came from Central America (40 | 0.5%), Latin America (40 | 0.5%), Mexico (40 | 0.5%), Australia (8 | 0.1%), and Oceania (8 | 0.1%), together accounting for 1.7% of all Ripley residents.
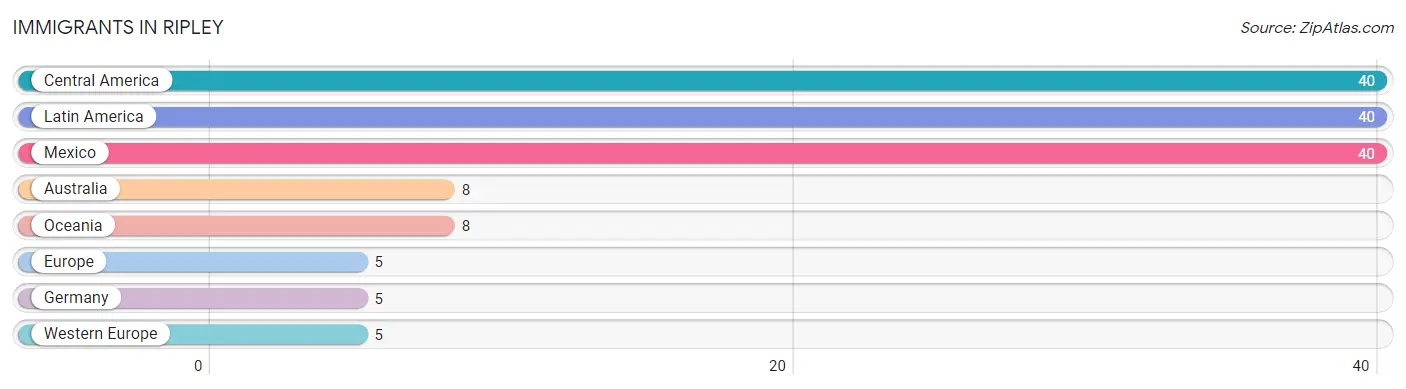
| Immigration Origin | # Population | % Population |
| Australia | 8 | 0.1% |
| Central America | 40 | 0.5% |
| Europe | 5 | 0.1% |
| Germany | 5 | 0.1% |
| Latin America | 40 | 0.5% |
| Mexico | 40 | 0.5% |
| Oceania | 8 | 0.1% |
| Western Europe | 5 | 0.1% | View All 8 Rows |
Sex and Age in Ripley
Sex and Age in Ripley
The most populous age groups in Ripley are 15 to 19 Years (372 | 9.8%) for men and 50 to 54 Years (366 | 9.1%) for women.
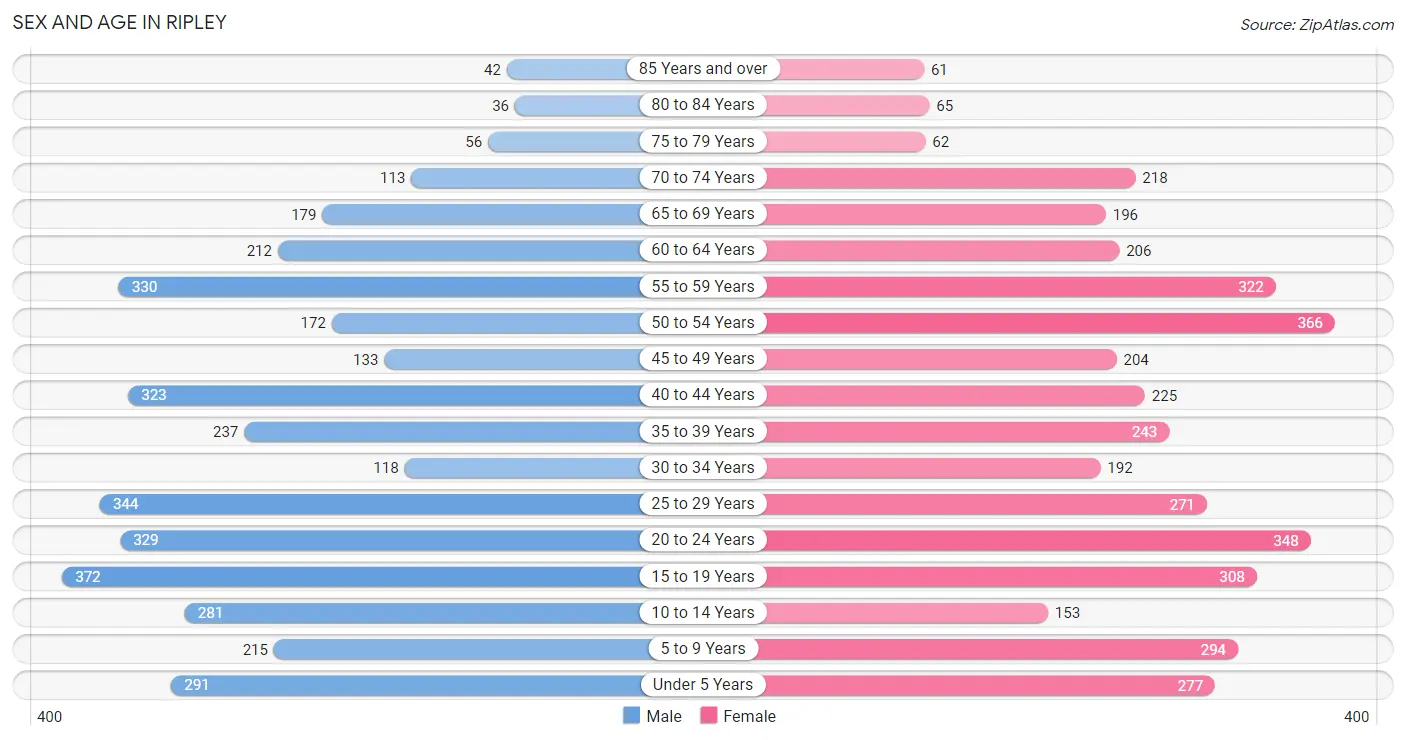
| Age Bracket | Male | Female |
| Under 5 Years | 291 (7.7%) | 277 (6.9%) |
| 5 to 9 Years | 215 (5.7%) | 294 (7.3%) |
| 10 to 14 Years | 281 (7.4%) | 153 (3.8%) |
| 15 to 19 Years | 372 (9.8%) | 308 (7.7%) |
| 20 to 24 Years | 329 (8.7%) | 348 (8.7%) |
| 25 to 29 Years | 344 (9.1%) | 271 (6.8%) |
| 30 to 34 Years | 118 (3.1%) | 192 (4.8%) |
| 35 to 39 Years | 237 (6.3%) | 243 (6.1%) |
| 40 to 44 Years | 323 (8.5%) | 225 (5.6%) |
| 45 to 49 Years | 133 (3.5%) | 204 (5.1%) |
| 50 to 54 Years | 172 (4.5%) | 366 (9.1%) |
| 55 to 59 Years | 330 (8.7%) | 322 (8.0%) |
| 60 to 64 Years | 212 (5.6%) | 206 (5.1%) |
| 65 to 69 Years | 179 (4.7%) | 196 (4.9%) |
| 70 to 74 Years | 113 (3.0%) | 218 (5.4%) |
| 75 to 79 Years | 56 (1.5%) | 62 (1.5%) |
| 80 to 84 Years | 36 (0.9%) | 65 (1.6%) |
| 85 Years and over | 42 (1.1%) | 61 (1.5%) |
| Total | 3,783 (100.0%) | 4,011 (100.0%) |
Families and Households in Ripley
Median Family Size in Ripley
The median family size in Ripley is 3.31 persons per family, with single female/mother families (861 | 48.0%) accounting for the largest median family size of 3.67 persons per family. On the other hand, single male/father families (88 | 4.9%) represent the smallest median family size with 2.57 persons per family.
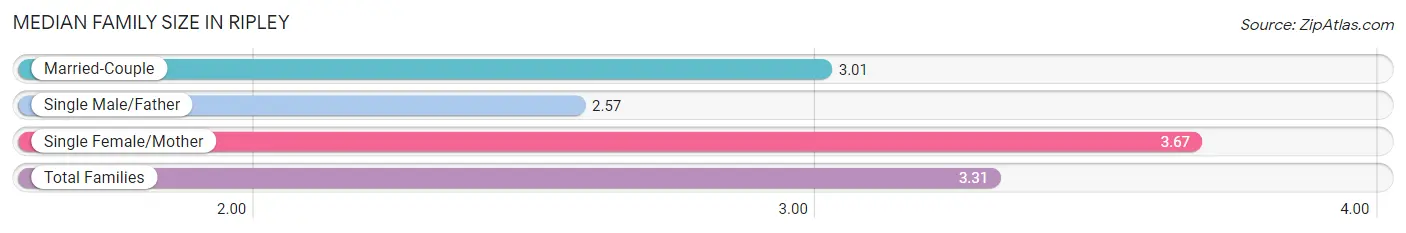
| Family Type | # Families | Family Size |
| Married-Couple | 845 (47.1%) | 3.01 |
| Single Male/Father | 88 (4.9%) | 2.57 |
| Single Female/Mother | 861 (48.0%) | 3.67 |
| Total Families | 1,794 (100.0%) | 3.31 |
Median Household Size in Ripley
The median household size in Ripley is 2.63 persons per household, with single female/mother households (861 | 30.0%) accounting for the largest median household size of 3.86 persons per household. non-family households (1,079 | 37.6%) represent the smallest median household size with 1.22 persons per household.
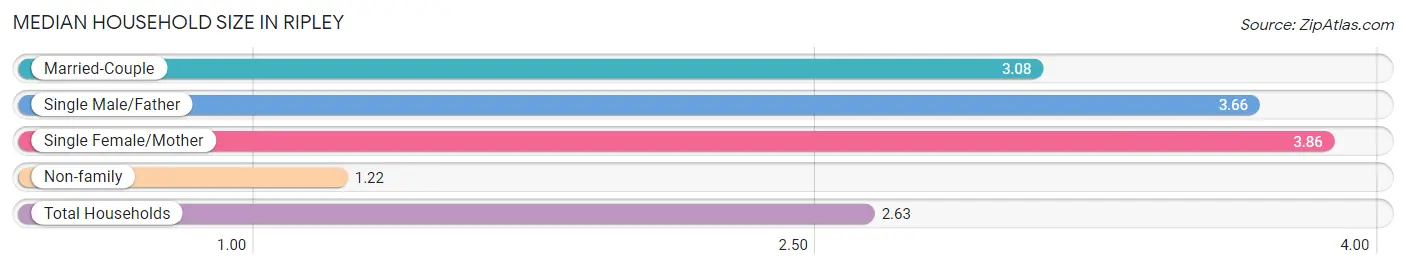
| Household Type | # Households | Household Size |
| Married-Couple | 845 (29.4%) | 3.08 |
| Single Male/Father | 88 (3.1%) | 3.66 |
| Single Female/Mother | 861 (30.0%) | 3.86 |
| Non-family | 1,079 (37.6%) | 1.22 |
| Total Households | 2,873 (100.0%) | 2.63 |
Household Size by Marriage Status in Ripley
Out of a total of 2,873 households in Ripley, 1,794 (62.4%) are family households, while 1,079 (37.6%) are nonfamily households. The most numerous type of family households are 2-person households, comprising 770, and the most common type of nonfamily households are 1-person households, comprising 895.
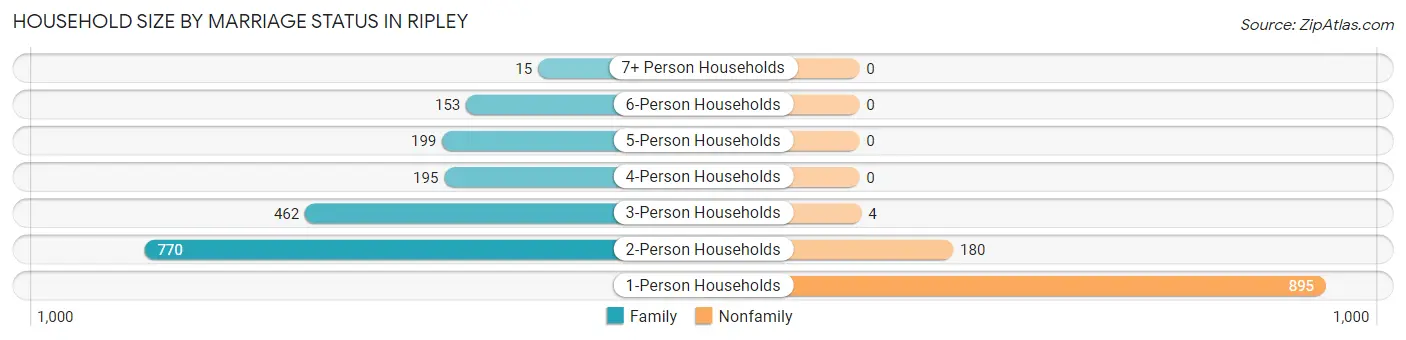
| Household Size | Family Households | Nonfamily Households |
| 1-Person Households | - | 895 (31.1%) |
| 2-Person Households | 770 (26.8%) | 180 (6.3%) |
| 3-Person Households | 462 (16.1%) | 4 (0.1%) |
| 4-Person Households | 195 (6.8%) | 0 (0.0%) |
| 5-Person Households | 199 (6.9%) | 0 (0.0%) |
| 6-Person Households | 153 (5.3%) | 0 (0.0%) |
| 7+ Person Households | 15 (0.5%) | 0 (0.0%) |
| Total | 1,794 (62.4%) | 1,079 (37.6%) |
Female Fertility in Ripley
Fertility by Age in Ripley
Average fertility rate in Ripley is 75.0 births per 1,000 women. Women in the age bracket of 20 to 34 years have the highest fertility rate with 158.0 births per 1,000 women. Women in the age bracket of 20 to 34 years acount for 94.1% of all women with births.
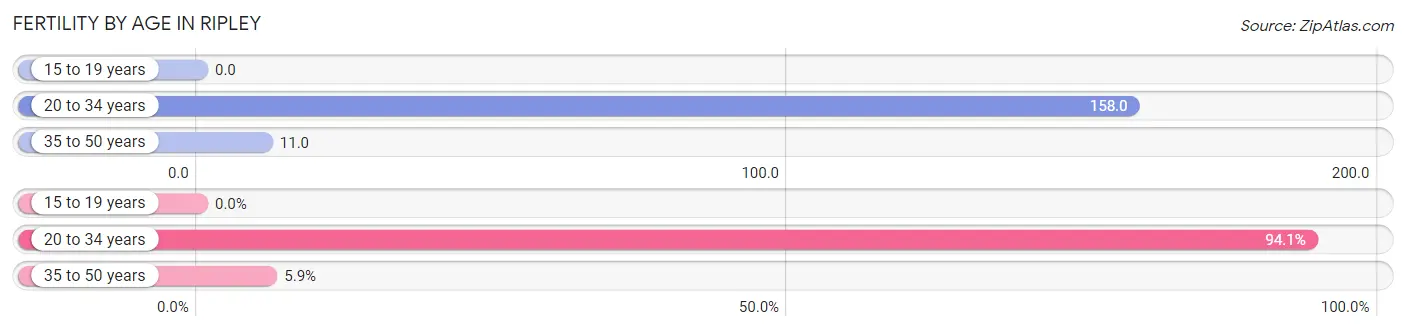
| Age Bracket | Women with Births | Births / 1,000 Women |
| 15 to 19 years | 0 (0.0%) | 0.0 |
| 20 to 34 years | 128 (94.1%) | 158.0 |
| 35 to 50 years | 8 (5.9%) | 11.0 |
| Total | 136 (100.0%) | 75.0 |
Fertility by Age by Marriage Status in Ripley
28.7% of women with births (136) in Ripley are married. The highest percentage of unmarried women with births falls into 35 to 50 years age bracket with 100.0% of them unmarried at the time of birth, while the lowest percentage of unmarried women with births belong to 20 to 34 years age bracket with 69.5% of them unmarried.
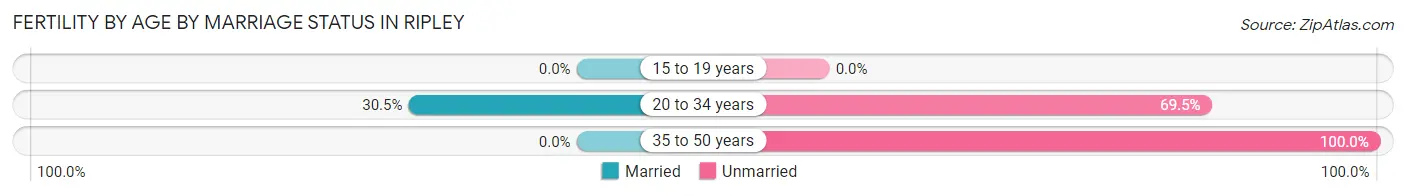
| Age Bracket | Married | Unmarried |
| 15 to 19 years | 0 (0.0%) | 0 (0.0%) |
| 20 to 34 years | 39 (30.5%) | 89 (69.5%) |
| 35 to 50 years | 0 (0.0%) | 8 (100.0%) |
| Total | 39 (28.7%) | 97 (71.3%) |
Fertility by Education in Ripley
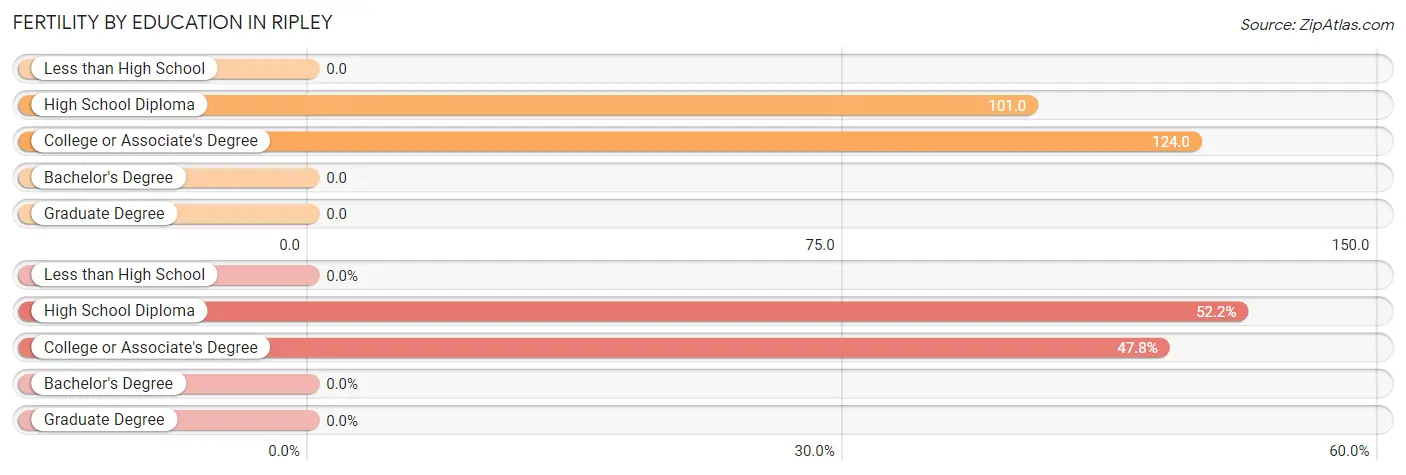
| Educational Attainment | Women with Births | Births / 1,000 Women |
| Less than High School | 0 (0.0%) | 0.0 |
| High School Diploma | 71 (52.2%) | 101.0 |
| College or Associate's Degree | 65 (47.8%) | 124.0 |
| Bachelor's Degree | 0 (0.0%) | 0.0 |
| Graduate Degree | 0 (0.0%) | 0.0 |
| Total | 136 (100.0%) | 75.0 |
Fertility by Education by Marriage Status in Ripley
71.3% of women with births in Ripley are unmarried. Women with the educational attainment of college or associate's degree are most likely to be married with 60.0% of them married at childbirth, while women with the educational attainment of high school diploma are least likely to be married with 100.0% of them unmarried at childbirth.
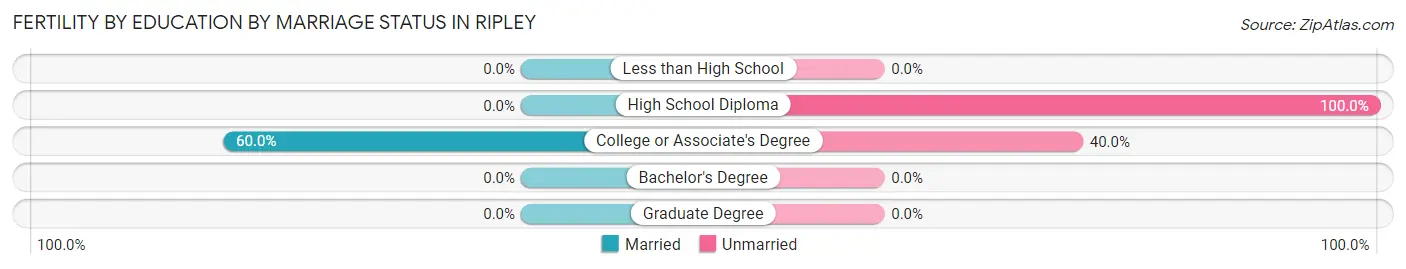
| Educational Attainment | Married | Unmarried |
| Less than High School | 0 (0.0%) | 0 (0.0%) |
| High School Diploma | 0 (0.0%) | 71 (100.0%) |
| College or Associate's Degree | 39 (60.0%) | 26 (40.0%) |
| Bachelor's Degree | 0 (0.0%) | 0 (0.0%) |
| Graduate Degree | 0 (0.0%) | 0 (0.0%) |
| Total | 39 (28.7%) | 97 (71.3%) |
Employment Characteristics in Ripley
Employment by Class of Employer in Ripley
Among the 2,686 employed individuals in Ripley, private company employees (2,006 | 74.7%), local government employees (217 | 8.1%), and state government employees (183 | 6.8%) make up the most common classes of employment.
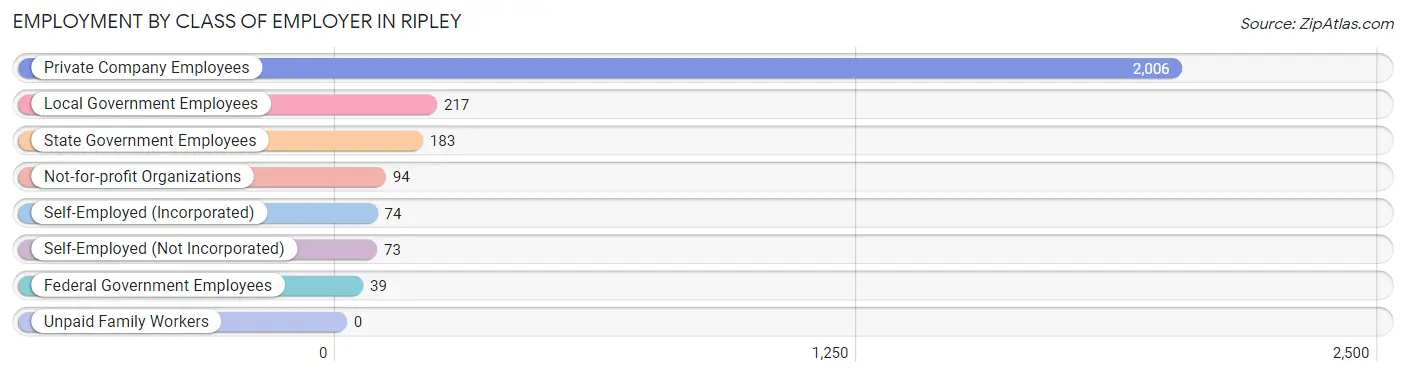
| Employer Class | # Employees | % Employees |
| Private Company Employees | 2,006 | 74.7% |
| Self-Employed (Incorporated) | 74 | 2.8% |
| Self-Employed (Not Incorporated) | 73 | 2.7% |
| Not-for-profit Organizations | 94 | 3.5% |
| Local Government Employees | 217 | 8.1% |
| State Government Employees | 183 | 6.8% |
| Federal Government Employees | 39 | 1.5% |
| Unpaid Family Workers | 0 | 0.0% |
| Total | 2,686 | 100.0% |
Employment Status by Age in Ripley
According to the labor force statistics for Ripley, out of the total population over 16 years of age (6,140), 50.0% or 3,070 individuals are in the labor force, with 9.6% or 295 of them unemployed. The age group with the highest labor force participation rate is 35 to 44 years, with 68.5% or 704 individuals in the labor force. Within the labor force, the 16 to 19 years age range has the highest percentage of unemployed individuals, with 35.2% or 62 of them being unemployed.
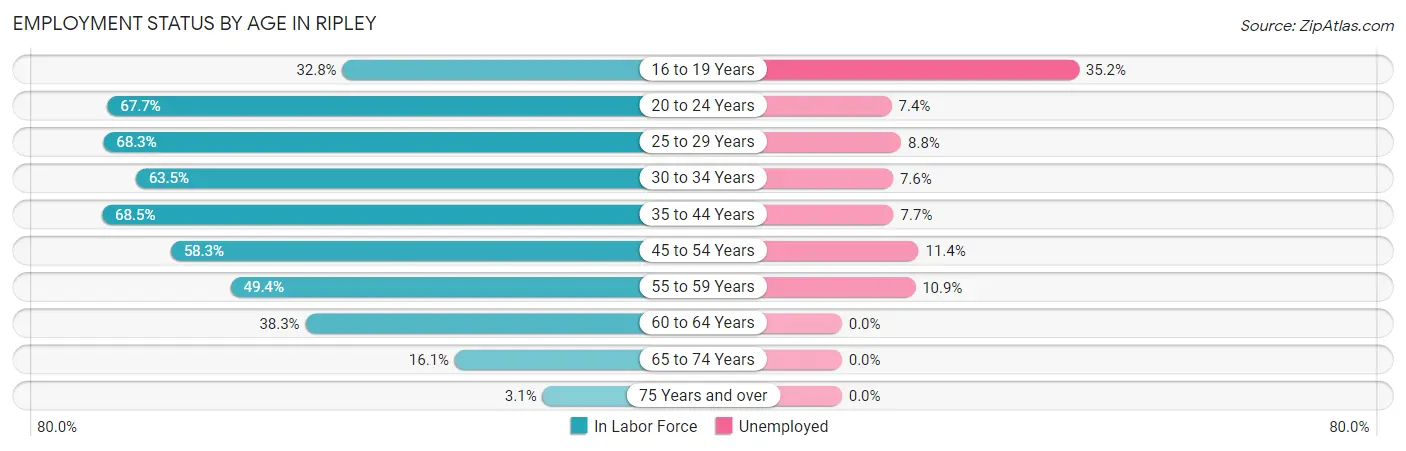
| Age Bracket | In Labor Force | Unemployed |
| 16 to 19 Years | 176 (32.8%) | 62 (35.2%) |
| 20 to 24 Years | 458 (67.7%) | 34 (7.4%) |
| 25 to 29 Years | 420 (68.3%) | 37 (8.8%) |
| 30 to 34 Years | 197 (63.5%) | 15 (7.6%) |
| 35 to 44 Years | 704 (68.5%) | 54 (7.7%) |
| 45 to 54 Years | 510 (58.3%) | 58 (11.4%) |
| 55 to 59 Years | 322 (49.4%) | 35 (10.9%) |
| 60 to 64 Years | 160 (38.3%) | 0 (0.0%) |
| 65 to 74 Years | 114 (16.1%) | 0 (0.0%) |
| 75 Years and over | 10 (3.1%) | 0 (0.0%) |
| Total | 3,070 (50.0%) | 295 (9.6%) |
Employment Status by Educational Attainment in Ripley
According to labor force statistics for Ripley, 59.3% of individuals (2,312) out of the total population between 25 and 64 years of age (3,898) are in the labor force, with 8.6% or 199 of them being unemployed. The group with the highest labor force participation rate are those with the educational attainment of bachelor's degree or higher, with 90.1% or 384 individuals in the labor force. Within the labor force, individuals with less than high school education have the highest percentage of unemployment, with 12.6% or 35 of them being unemployed.
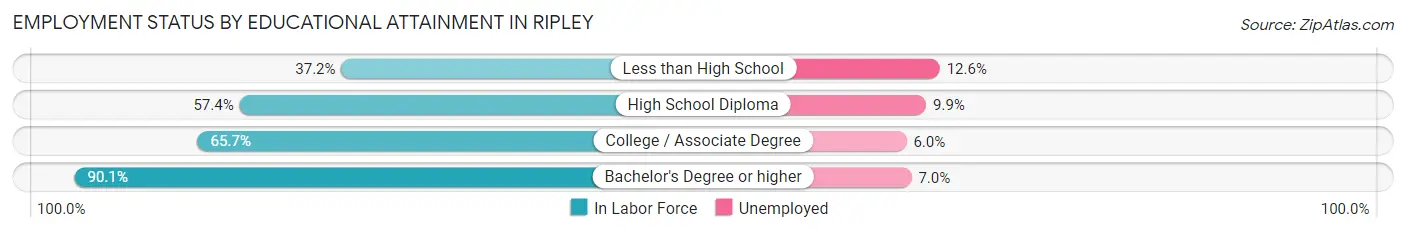
| Educational Attainment | In Labor Force | Unemployed |
| Less than High School | 277 (37.2%) | 94 (12.6%) |
| High School Diploma | 966 (57.4%) | 167 (9.9%) |
| College / Associate Degree | 686 (65.7%) | 63 (6.0%) |
| Bachelor's Degree or higher | 384 (90.1%) | 30 (7.0%) |
| Total | 2,312 (59.3%) | 335 (8.6%) |
Employment Occupations by Sex in Ripley
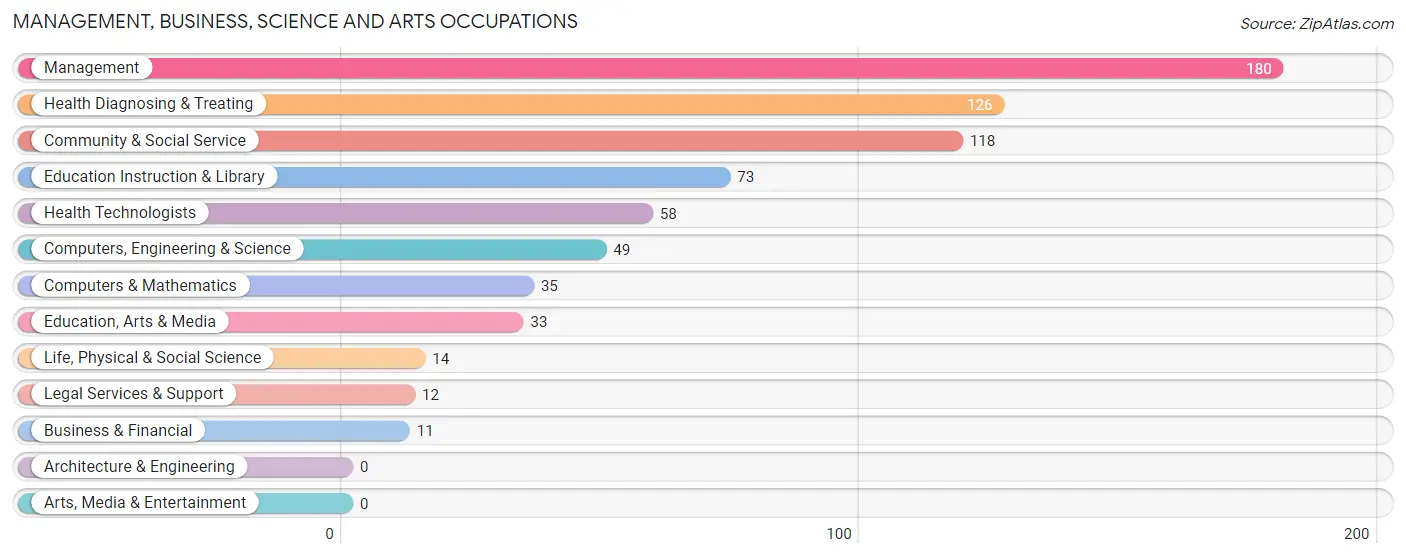
Management, Business, Science and Arts Occupations
The most common Management, Business, Science and Arts occupations in Ripley are Management (180 | 6.5%), Health Diagnosing & Treating (126 | 4.5%), Community & Social Service (118 | 4.3%), Education Instruction & Library (73 | 2.6%), and Health Technologists (58 | 2.1%).
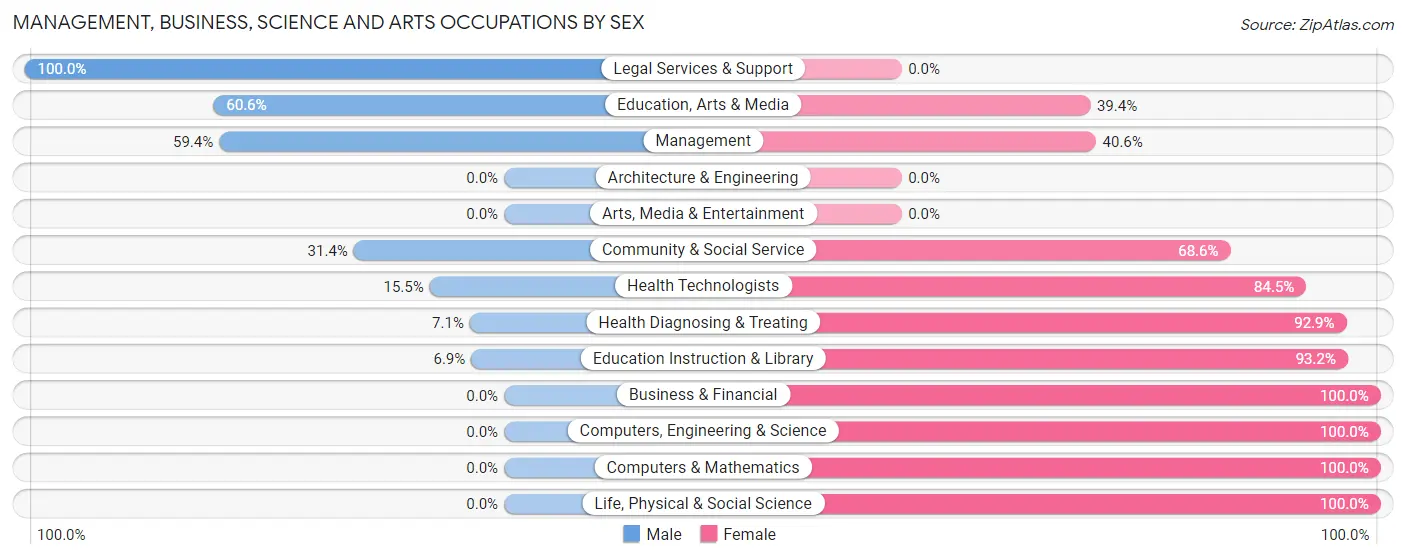
Management, Business, Science and Arts Occupations by Sex
Within the Management, Business, Science and Arts occupations in Ripley, the most male-oriented occupations are Legal Services & Support (100.0%), Education, Arts & Media (60.6%), and Management (59.4%), while the most female-oriented occupations are Business & Financial (100.0%), Computers, Engineering & Science (100.0%), and Computers & Mathematics (100.0%).
| Occupation | Male | Female |
| Management | 107 (59.4%) | 73 (40.6%) |
| Business & Financial | 0 (0.0%) | 11 (100.0%) |
| Computers, Engineering & Science | 0 (0.0%) | 49 (100.0%) |
| Computers & Mathematics | 0 (0.0%) | 35 (100.0%) |
| Architecture & Engineering | 0 (0.0%) | 0 (0.0%) |
| Life, Physical & Social Science | 0 (0.0%) | 14 (100.0%) |
| Community & Social Service | 37 (31.4%) | 81 (68.6%) |
| Education, Arts & Media | 20 (60.6%) | 13 (39.4%) |
| Legal Services & Support | 12 (100.0%) | 0 (0.0%) |
| Education Instruction & Library | 5 (6.9%) | 68 (93.1%) |
| Arts, Media & Entertainment | 0 (0.0%) | 0 (0.0%) |
| Health Diagnosing & Treating | 9 (7.1%) | 117 (92.9%) |
| Health Technologists | 9 (15.5%) | 49 (84.5%) |
| Total (Category) | 153 (31.6%) | 331 (68.4%) |
| Total (Overall) | 1,471 (53.0%) | 1,305 (47.0%) |
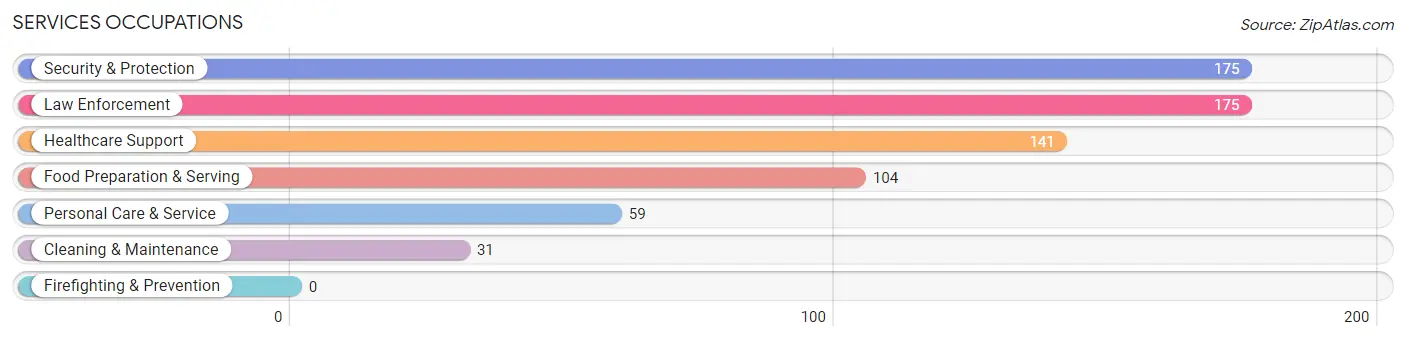
Services Occupations
The most common Services occupations in Ripley are Security & Protection (175 | 6.3%), Law Enforcement (175 | 6.3%), Healthcare Support (141 | 5.1%), Food Preparation & Serving (104 | 3.7%), and Personal Care & Service (59 | 2.1%).
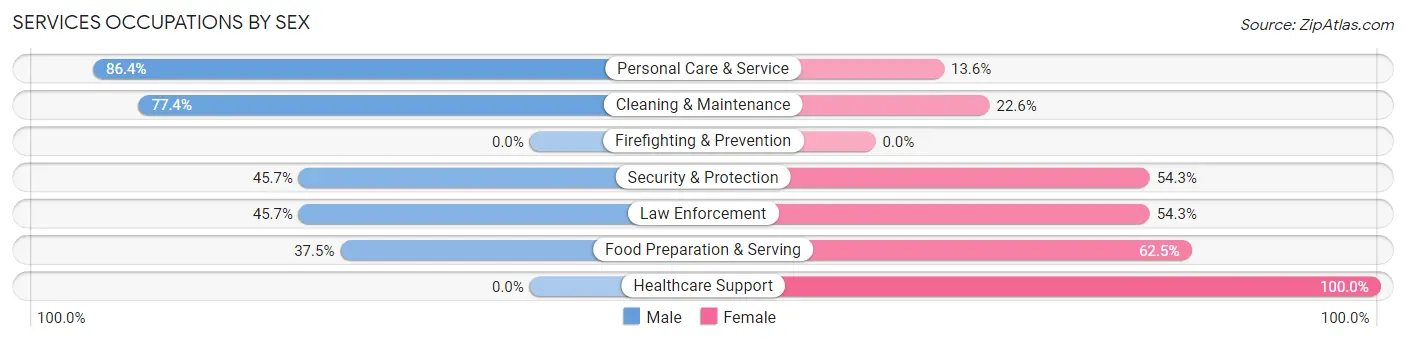
Services Occupations by Sex
Within the Services occupations in Ripley, the most male-oriented occupations are Personal Care & Service (86.4%), Cleaning & Maintenance (77.4%), and Security & Protection (45.7%), while the most female-oriented occupations are Healthcare Support (100.0%), Food Preparation & Serving (62.5%), and Security & Protection (54.3%).
| Occupation | Male | Female |
| Healthcare Support | 0 (0.0%) | 141 (100.0%) |
| Security & Protection | 80 (45.7%) | 95 (54.3%) |
| Firefighting & Prevention | 0 (0.0%) | 0 (0.0%) |
| Law Enforcement | 80 (45.7%) | 95 (54.3%) |
| Food Preparation & Serving | 39 (37.5%) | 65 (62.5%) |
| Cleaning & Maintenance | 24 (77.4%) | 7 (22.6%) |
| Personal Care & Service | 51 (86.4%) | 8 (13.6%) |
| Total (Category) | 194 (38.0%) | 316 (62.0%) |
| Total (Overall) | 1,471 (53.0%) | 1,305 (47.0%) |
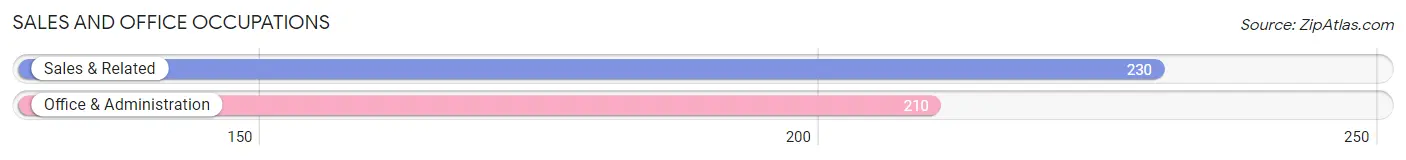
Sales and Office Occupations
The most common Sales and Office occupations in Ripley are Sales & Related (230 | 8.3%), and Office & Administration (210 | 7.6%).
Sales and Office Occupations by Sex
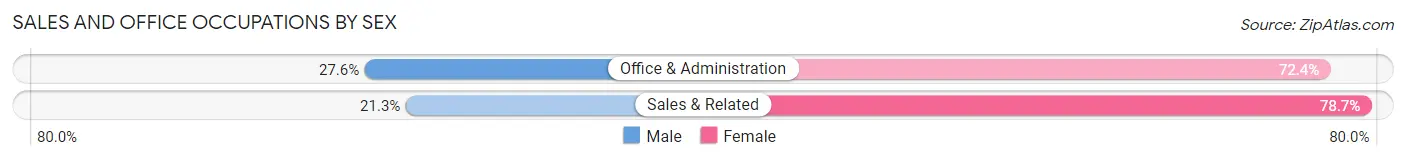
| Occupation | Male | Female |
| Sales & Related | 49 (21.3%) | 181 (78.7%) |
| Office & Administration | 58 (27.6%) | 152 (72.4%) |
| Total (Category) | 107 (24.3%) | 333 (75.7%) |
| Total (Overall) | 1,471 (53.0%) | 1,305 (47.0%) |
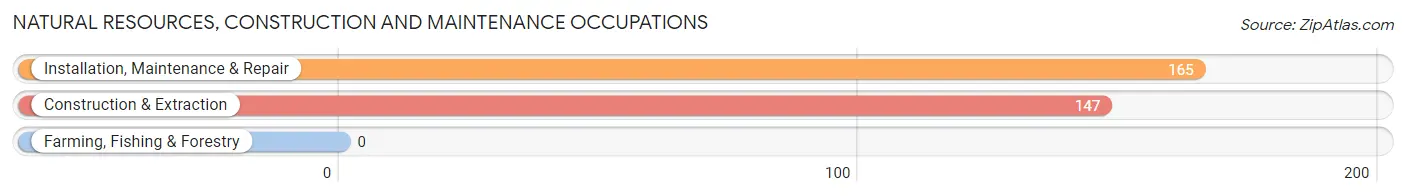
Natural Resources, Construction and Maintenance Occupations
The most common Natural Resources, Construction and Maintenance occupations in Ripley are Installation, Maintenance & Repair (165 | 5.9%), and Construction & Extraction (147 | 5.3%).
Natural Resources, Construction and Maintenance Occupations by Sex
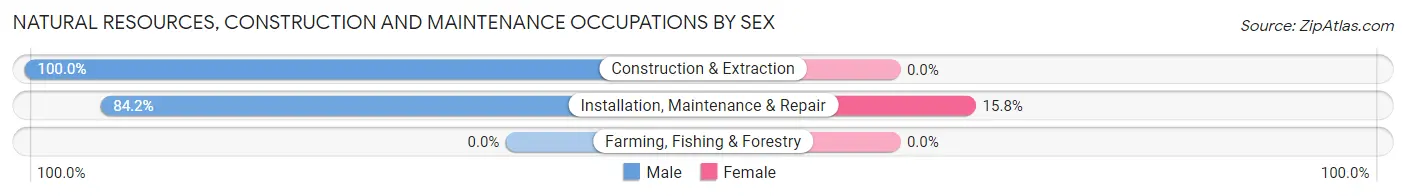
| Occupation | Male | Female |
| Farming, Fishing & Forestry | 0 (0.0%) | 0 (0.0%) |
| Construction & Extraction | 147 (100.0%) | 0 (0.0%) |
| Installation, Maintenance & Repair | 139 (84.2%) | 26 (15.8%) |
| Total (Category) | 286 (91.7%) | 26 (8.3%) |
| Total (Overall) | 1,471 (53.0%) | 1,305 (47.0%) |
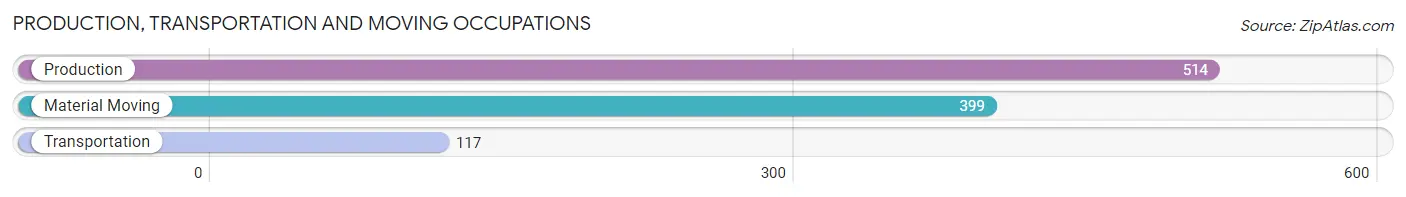
Production, Transportation and Moving Occupations
The most common Production, Transportation and Moving occupations in Ripley are Production (514 | 18.5%), Material Moving (399 | 14.4%), and Transportation (117 | 4.2%).
Production, Transportation and Moving Occupations by Sex
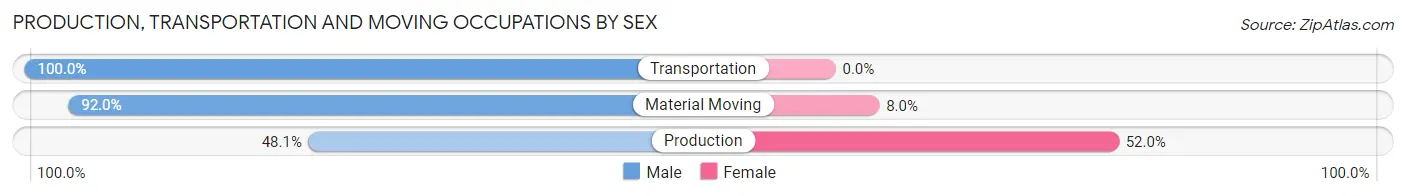
| Occupation | Male | Female |
| Production | 247 (48.0%) | 267 (51.9%) |
| Transportation | 117 (100.0%) | 0 (0.0%) |
| Material Moving | 367 (92.0%) | 32 (8.0%) |
| Total (Category) | 731 (71.0%) | 299 (29.0%) |
| Total (Overall) | 1,471 (53.0%) | 1,305 (47.0%) |
Employment Industries by Sex in Ripley
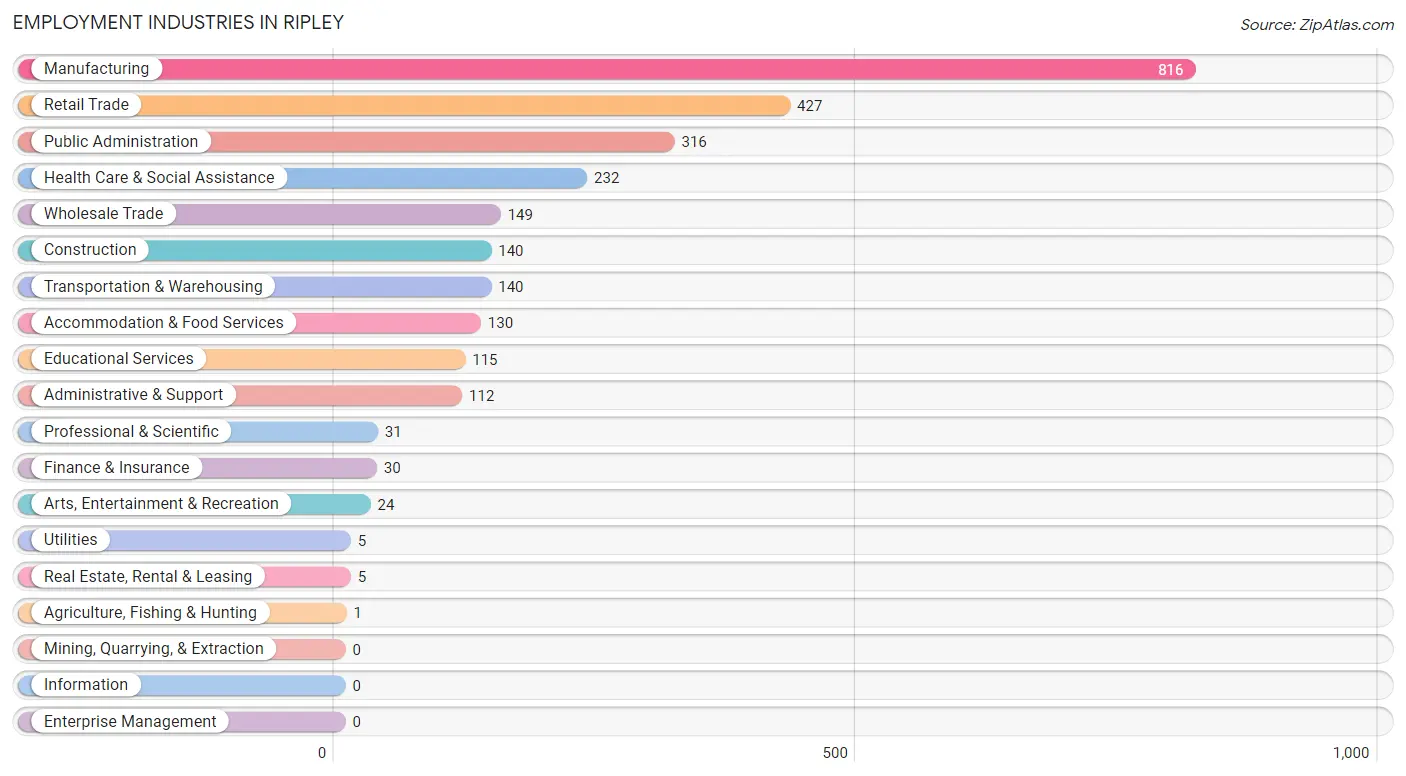
Employment Industries in Ripley
The major employment industries in Ripley include Manufacturing (816 | 29.4%), Retail Trade (427 | 15.4%), Public Administration (316 | 11.4%), Health Care & Social Assistance (232 | 8.4%), and Wholesale Trade (149 | 5.4%).
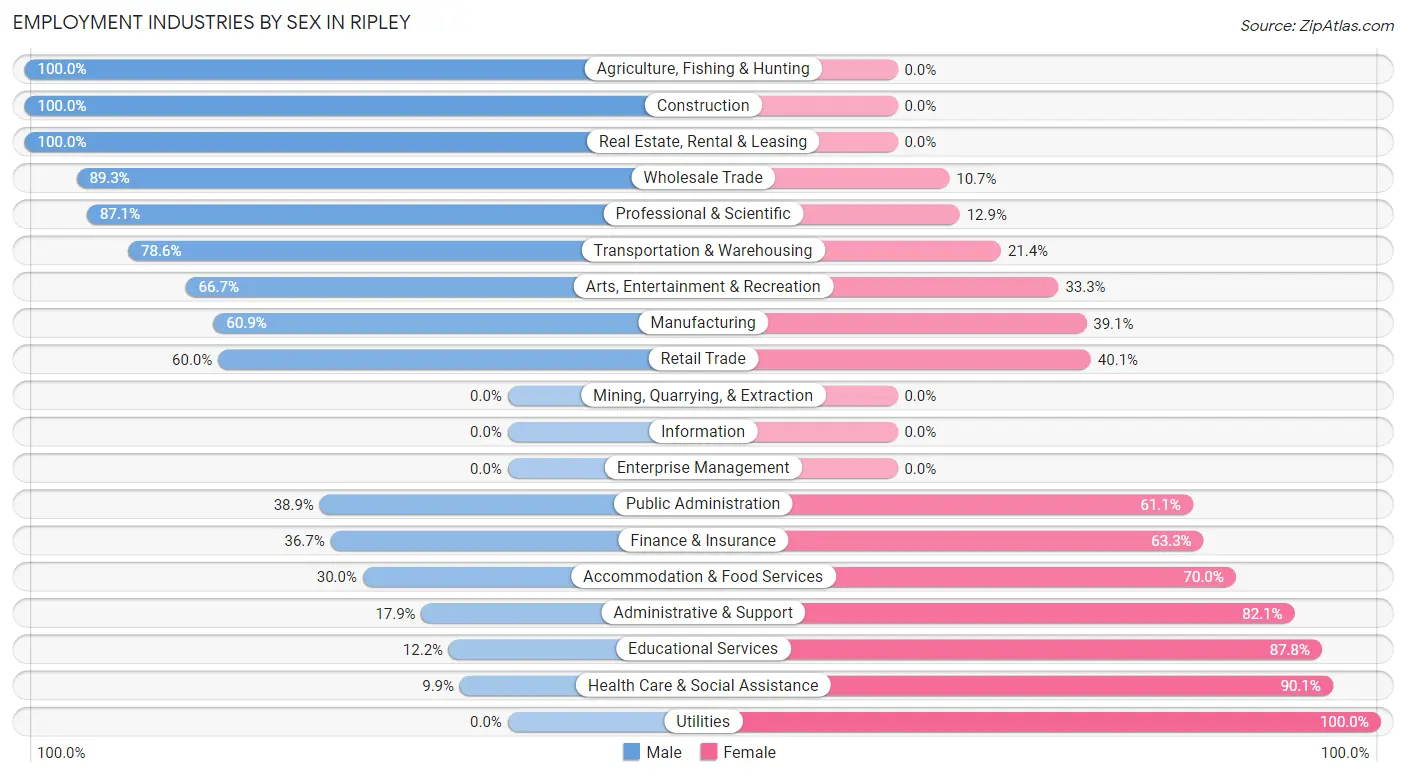
Employment Industries by Sex in Ripley
The Ripley industries that see more men than women are Agriculture, Fishing & Hunting (100.0%), Construction (100.0%), and Real Estate, Rental & Leasing (100.0%), whereas the industries that tend to have a higher number of women are Utilities (100.0%), Health Care & Social Assistance (90.1%), and Educational Services (87.8%).
| Industry | Male | Female |
| Agriculture, Fishing & Hunting | 1 (100.0%) | 0 (0.0%) |
| Mining, Quarrying, & Extraction | 0 (0.0%) | 0 (0.0%) |
| Construction | 140 (100.0%) | 0 (0.0%) |
| Manufacturing | 497 (60.9%) | 319 (39.1%) |
| Wholesale Trade | 133 (89.3%) | 16 (10.7%) |
| Retail Trade | 256 (60.0%) | 171 (40.1%) |
| Transportation & Warehousing | 110 (78.6%) | 30 (21.4%) |
| Utilities | 0 (0.0%) | 5 (100.0%) |
| Information | 0 (0.0%) | 0 (0.0%) |
| Finance & Insurance | 11 (36.7%) | 19 (63.3%) |
| Real Estate, Rental & Leasing | 5 (100.0%) | 0 (0.0%) |
| Professional & Scientific | 27 (87.1%) | 4 (12.9%) |
| Enterprise Management | 0 (0.0%) | 0 (0.0%) |
| Administrative & Support | 20 (17.9%) | 92 (82.1%) |
| Educational Services | 14 (12.2%) | 101 (87.8%) |
| Health Care & Social Assistance | 23 (9.9%) | 209 (90.1%) |
| Arts, Entertainment & Recreation | 16 (66.7%) | 8 (33.3%) |
| Accommodation & Food Services | 39 (30.0%) | 91 (70.0%) |
| Public Administration | 123 (38.9%) | 193 (61.1%) |
| Total | 1,471 (53.0%) | 1,305 (47.0%) |
Education in Ripley
School Enrollment in Ripley
The most common levels of schooling among the 1,639 students in Ripley are high school (580 | 35.4%), elementary school (380 | 23.2%), and middle school (262 | 16.0%).
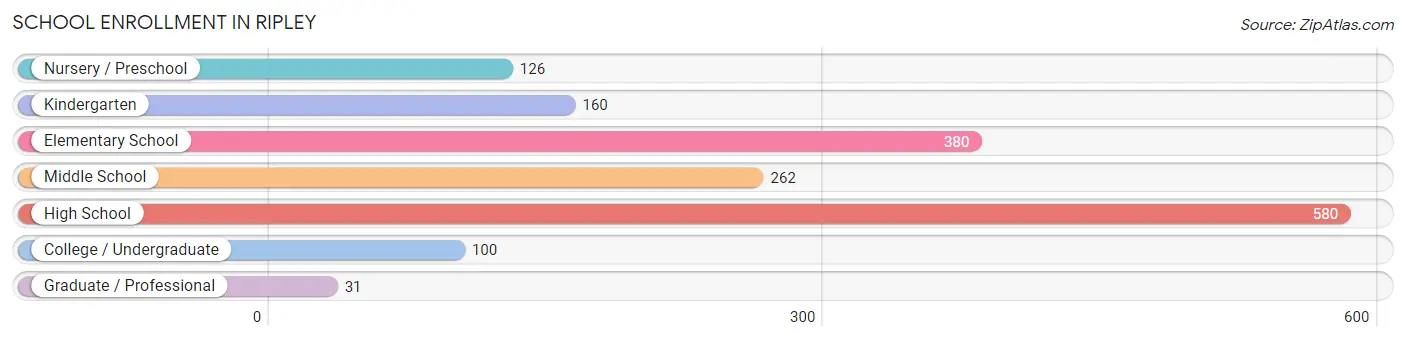
| School Level | # Students | % Students |
| Nursery / Preschool | 126 | 7.7% |
| Kindergarten | 160 | 9.8% |
| Elementary School | 380 | 23.2% |
| Middle School | 262 | 16.0% |
| High School | 580 | 35.4% |
| College / Undergraduate | 100 | 6.1% |
| Graduate / Professional | 31 | 1.9% |
| Total | 1,639 | 100.0% |
School Enrollment by Age by Funding Source in Ripley
Out of a total of 1,639 students who are enrolled in schools in Ripley, 129 (7.9%) attend a private institution, while the remaining 1,510 (92.1%) are enrolled in public schools. The age group of 20 to 24 year olds has the highest likelihood of being enrolled in private schools, with 16 (35.6% in the age bracket) enrolled. Conversely, the age group of 5 to 9 year old has the lowest likelihood of being enrolled in a private school, with 449 (97.4% in the age bracket) attending a public institution.
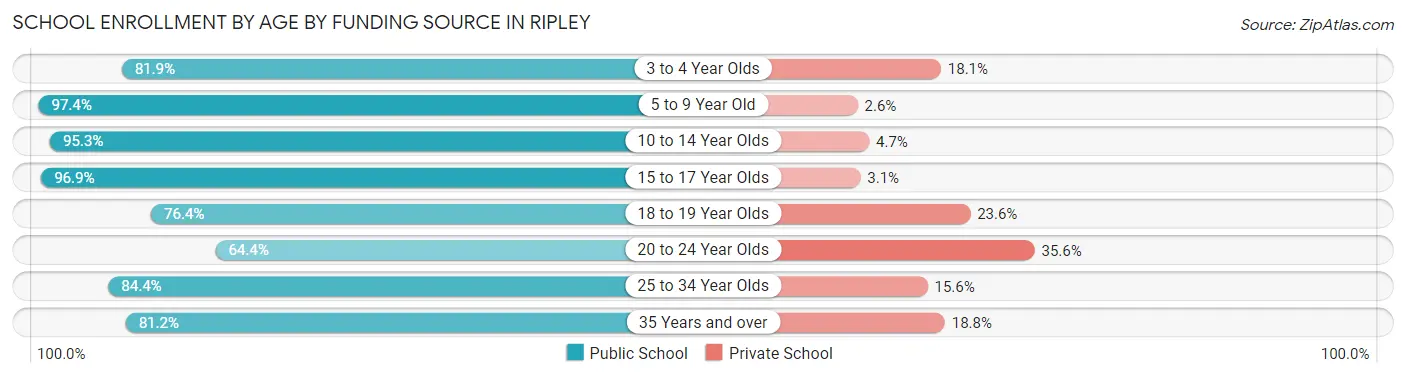
| Age Bracket | Public School | Private School |
| 3 to 4 Year Olds | 86 (81.9%) | 19 (18.1%) |
| 5 to 9 Year Old | 449 (97.4%) | 12 (2.6%) |
| 10 to 14 Year Olds | 382 (95.3%) | 19 (4.7%) |
| 15 to 17 Year Olds | 374 (96.9%) | 12 (3.1%) |
| 18 to 19 Year Olds | 107 (76.4%) | 33 (23.6%) |
| 20 to 24 Year Olds | 29 (64.4%) | 16 (35.6%) |
| 25 to 34 Year Olds | 27 (84.4%) | 5 (15.6%) |
| 35 Years and over | 56 (81.2%) | 13 (18.8%) |
| Total | 1,510 (92.1%) | 129 (7.9%) |
Educational Attainment by Field of Study in Ripley
Education (161 | 23.0%), science & technology (150 | 21.4%), engineering (82 | 11.7%), arts & humanities (60 | 8.6%), and bio, nature & agricultural (54 | 7.7%) are the most common fields of study among 701 individuals in Ripley who have obtained a bachelor's degree or higher.
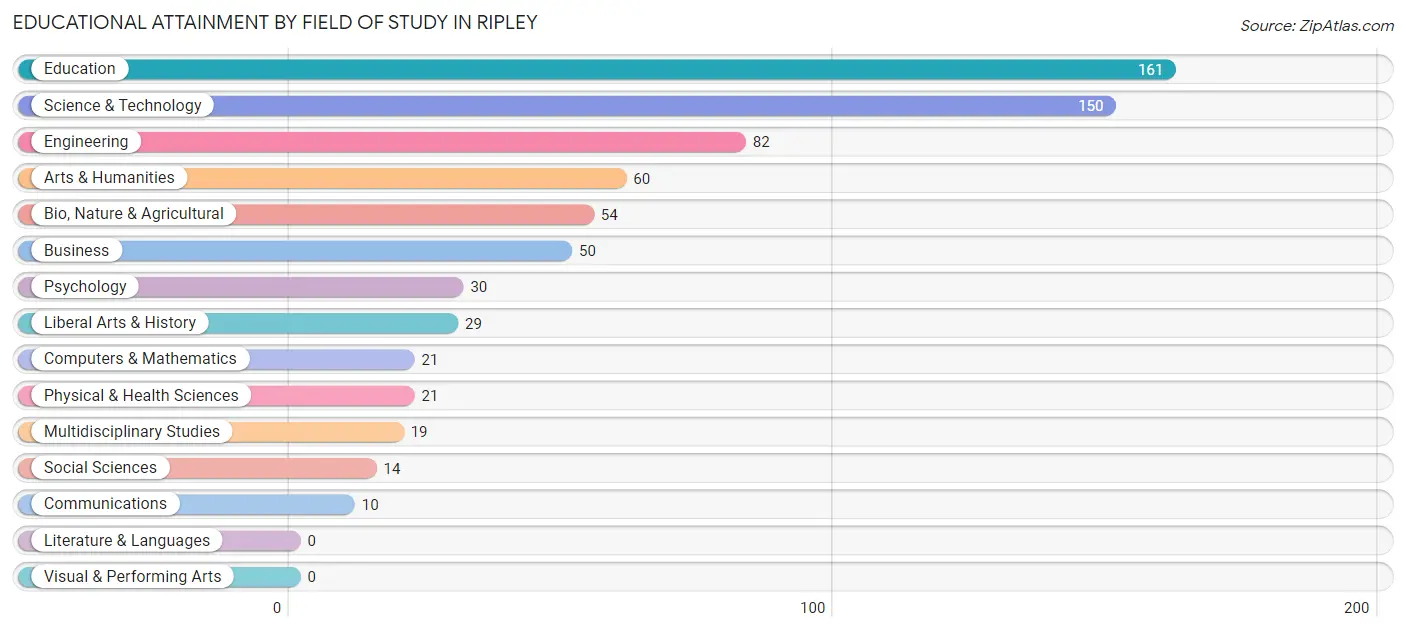
| Field of Study | # Graduates | % Graduates |
| Computers & Mathematics | 21 | 3.0% |
| Bio, Nature & Agricultural | 54 | 7.7% |
| Physical & Health Sciences | 21 | 3.0% |
| Psychology | 30 | 4.3% |
| Social Sciences | 14 | 2.0% |
| Engineering | 82 | 11.7% |
| Multidisciplinary Studies | 19 | 2.7% |
| Science & Technology | 150 | 21.4% |
| Business | 50 | 7.1% |
| Education | 161 | 23.0% |
| Literature & Languages | 0 | 0.0% |
| Liberal Arts & History | 29 | 4.1% |
| Visual & Performing Arts | 0 | 0.0% |
| Communications | 10 | 1.4% |
| Arts & Humanities | 60 | 8.6% |
| Total | 701 | 100.0% |
Transportation & Commute in Ripley
Vehicle Availability by Sex in Ripley
The most prevalent vehicle ownership categories in Ripley are males with 2 vehicles (634, accounting for 43.1%) and females with 2 vehicles (462, making up 52.1%).
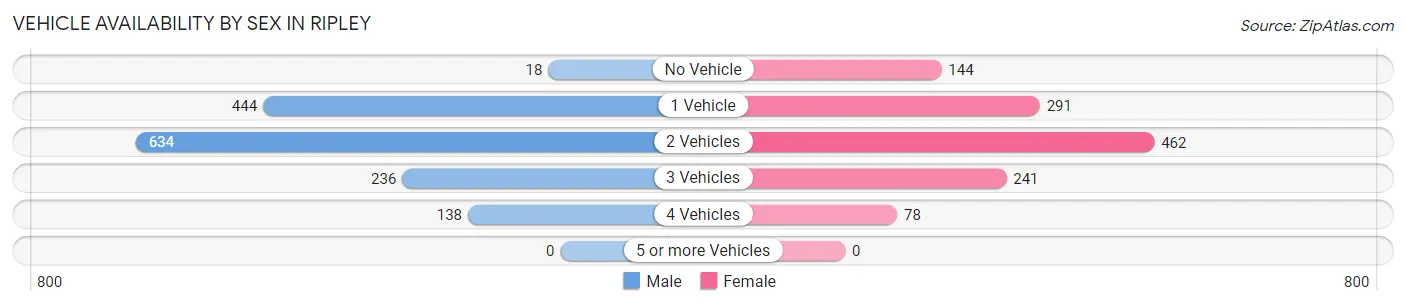
| Vehicles Available | Male | Female |
| No Vehicle | 18 (1.2%) | 144 (11.8%) |
| 1 Vehicle | 444 (30.2%) | 291 (23.9%) |
| 2 Vehicles | 634 (43.1%) | 462 (38.0%) |
| 3 Vehicles | 236 (16.1%) | 241 (19.8%) |
| 4 Vehicles | 138 (9.4%) | 78 (6.4%) |
| 5 or more Vehicles | 0 (0.0%) | 0 (0.0%) |
| Total | 1,470 (100.0%) | 1,216 (100.0%) |
Commute Time in Ripley
The most frequently occuring commute durations in Ripley are 5 to 9 minutes (545 commuters, 20.8%), 10 to 14 minutes (470 commuters, 18.0%), and 15 to 19 minutes (443 commuters, 16.9%).
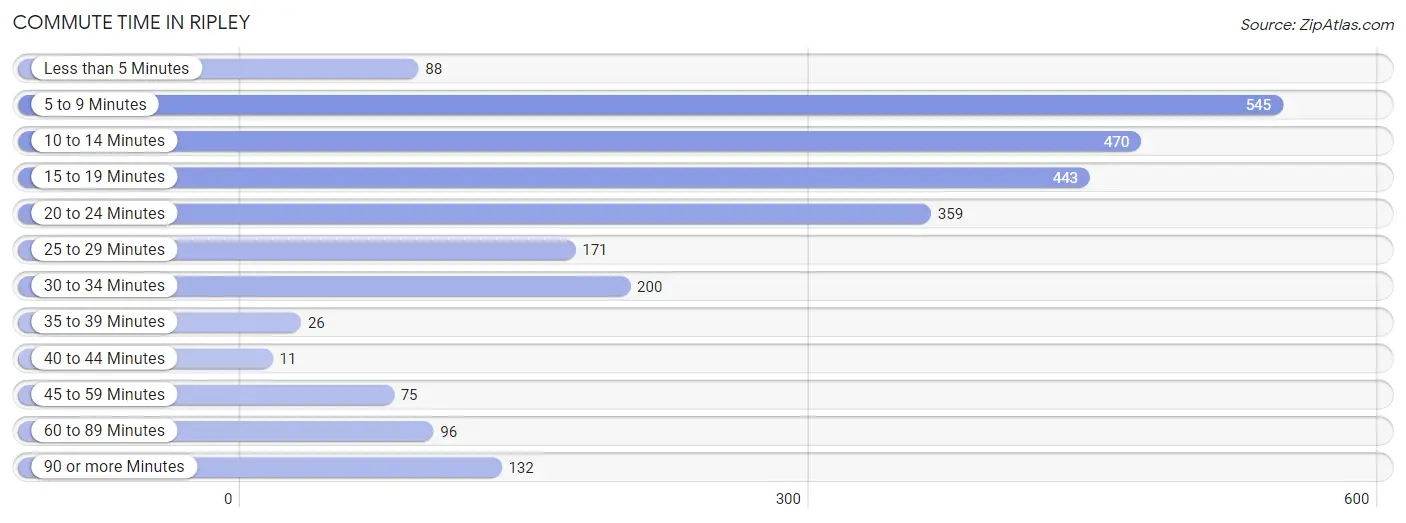
| Commute Time | # Commuters | % Commuters |
| Less than 5 Minutes | 88 | 3.4% |
| 5 to 9 Minutes | 545 | 20.8% |
| 10 to 14 Minutes | 470 | 18.0% |
| 15 to 19 Minutes | 443 | 16.9% |
| 20 to 24 Minutes | 359 | 13.7% |
| 25 to 29 Minutes | 171 | 6.5% |
| 30 to 34 Minutes | 200 | 7.6% |
| 35 to 39 Minutes | 26 | 1.0% |
| 40 to 44 Minutes | 11 | 0.4% |
| 45 to 59 Minutes | 75 | 2.9% |
| 60 to 89 Minutes | 96 | 3.7% |
| 90 or more Minutes | 132 | 5.1% |
Commute Time by Sex in Ripley
The most common commute times in Ripley are 5 to 9 minutes (304 commuters, 21.4%) for males and 5 to 9 minutes (241 commuters, 20.1%) for females.
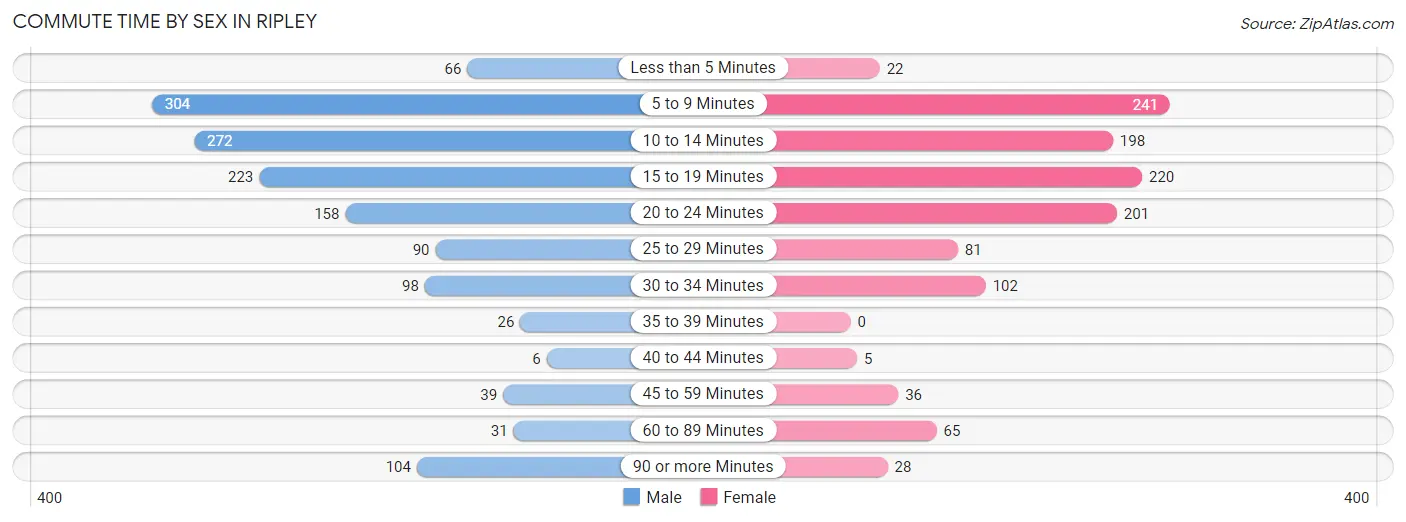
| Commute Time | Male | Female |
| Less than 5 Minutes | 66 (4.7%) | 22 (1.8%) |
| 5 to 9 Minutes | 304 (21.4%) | 241 (20.1%) |
| 10 to 14 Minutes | 272 (19.2%) | 198 (16.5%) |
| 15 to 19 Minutes | 223 (15.7%) | 220 (18.3%) |
| 20 to 24 Minutes | 158 (11.2%) | 201 (16.8%) |
| 25 to 29 Minutes | 90 (6.4%) | 81 (6.8%) |
| 30 to 34 Minutes | 98 (6.9%) | 102 (8.5%) |
| 35 to 39 Minutes | 26 (1.8%) | 0 (0.0%) |
| 40 to 44 Minutes | 6 (0.4%) | 5 (0.4%) |
| 45 to 59 Minutes | 39 (2.8%) | 36 (3.0%) |
| 60 to 89 Minutes | 31 (2.2%) | 65 (5.4%) |
| 90 or more Minutes | 104 (7.3%) | 28 (2.3%) |
Time of Departure to Work by Sex in Ripley
The most frequent times of departure to work in Ripley are 4:00 PM to 11:59 PM (332, 23.4%) for males and 7:00 AM to 7:29 AM (254, 21.2%) for females.
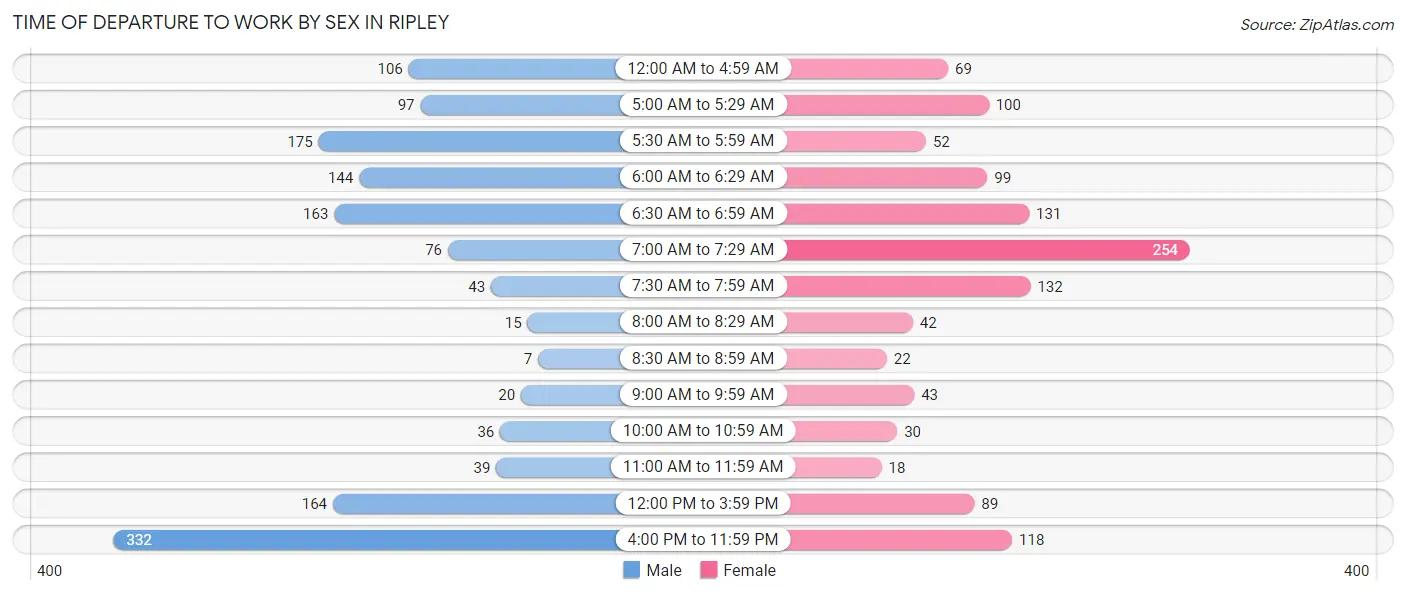
| Time of Departure | Male | Female |
| 12:00 AM to 4:59 AM | 106 (7.5%) | 69 (5.8%) |
| 5:00 AM to 5:29 AM | 97 (6.9%) | 100 (8.3%) |
| 5:30 AM to 5:59 AM | 175 (12.3%) | 52 (4.3%) |
| 6:00 AM to 6:29 AM | 144 (10.2%) | 99 (8.3%) |
| 6:30 AM to 6:59 AM | 163 (11.5%) | 131 (10.9%) |
| 7:00 AM to 7:29 AM | 76 (5.4%) | 254 (21.2%) |
| 7:30 AM to 7:59 AM | 43 (3.0%) | 132 (11.0%) |
| 8:00 AM to 8:29 AM | 15 (1.1%) | 42 (3.5%) |
| 8:30 AM to 8:59 AM | 7 (0.5%) | 22 (1.8%) |
| 9:00 AM to 9:59 AM | 20 (1.4%) | 43 (3.6%) |
| 10:00 AM to 10:59 AM | 36 (2.5%) | 30 (2.5%) |
| 11:00 AM to 11:59 AM | 39 (2.8%) | 18 (1.5%) |
| 12:00 PM to 3:59 PM | 164 (11.6%) | 89 (7.4%) |
| 4:00 PM to 11:59 PM | 332 (23.4%) | 118 (9.8%) |
| Total | 1,417 (100.0%) | 1,199 (100.0%) |
Housing Occupancy in Ripley
Occupancy by Ownership in Ripley
Of the total 2,873 dwellings in Ripley, owner-occupied units account for 1,299 (45.2%), while renter-occupied units make up 1,574 (54.8%).
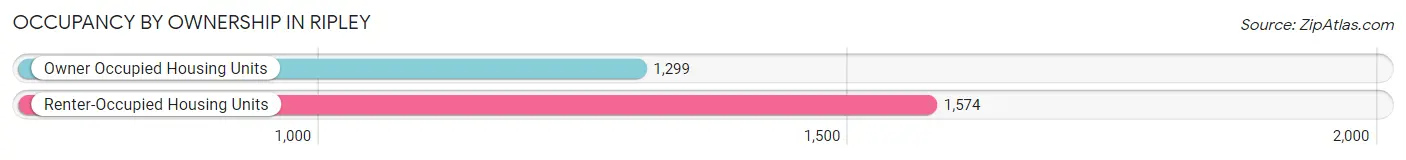
| Occupancy | # Housing Units | % Housing Units |
| Owner Occupied Housing Units | 1,299 | 45.2% |
| Renter-Occupied Housing Units | 1,574 | 54.8% |
| Total Occupied Housing Units | 2,873 | 100.0% |
Occupancy by Household Size in Ripley
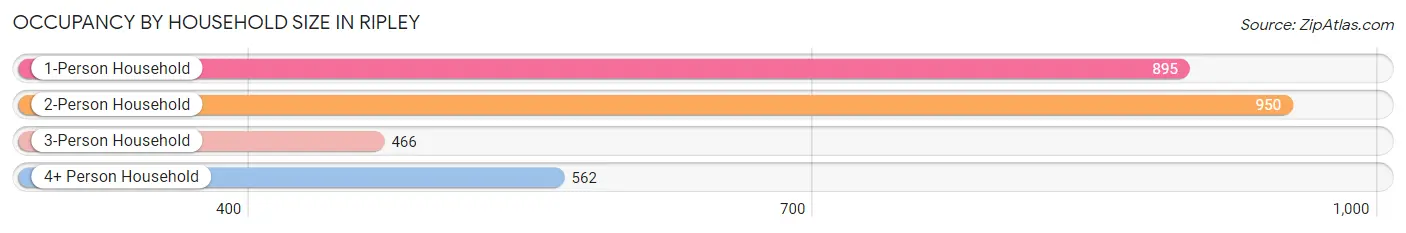
| Household Size | # Housing Units | % Housing Units |
| 1-Person Household | 895 | 31.1% |
| 2-Person Household | 950 | 33.1% |
| 3-Person Household | 466 | 16.2% |
| 4+ Person Household | 562 | 19.6% |
| Total Housing Units | 2,873 | 100.0% |
Occupancy by Ownership by Household Size in Ripley
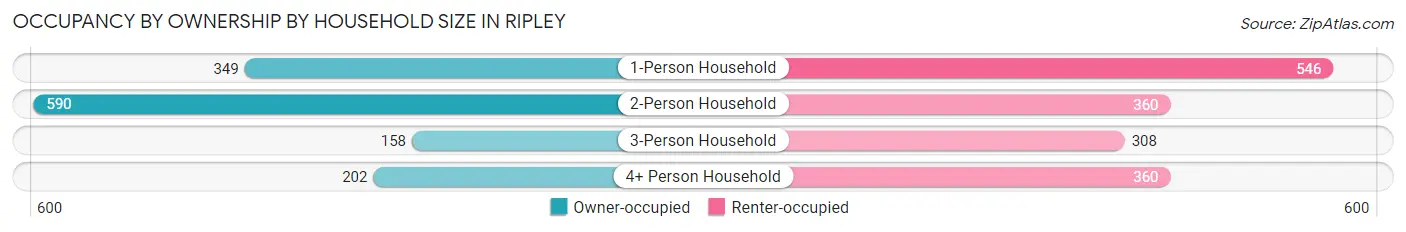
| Household Size | Owner-occupied | Renter-occupied |
| 1-Person Household | 349 (39.0%) | 546 (61.0%) |
| 2-Person Household | 590 (62.1%) | 360 (37.9%) |
| 3-Person Household | 158 (33.9%) | 308 (66.1%) |
| 4+ Person Household | 202 (35.9%) | 360 (64.1%) |
| Total Housing Units | 1,299 (45.2%) | 1,574 (54.8%) |
Occupancy by Educational Attainment in Ripley
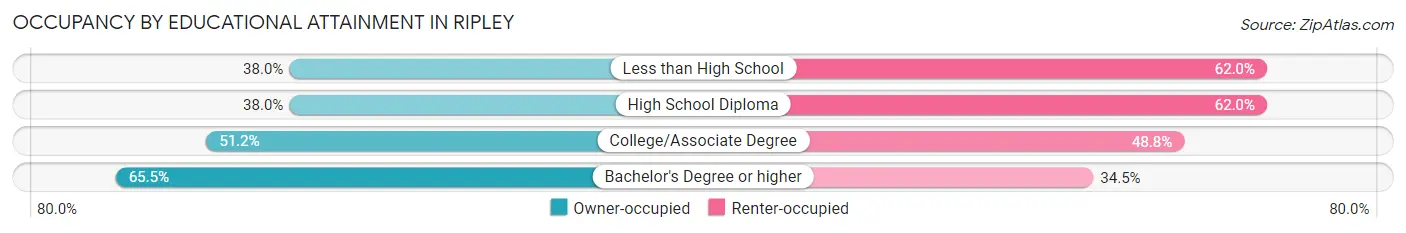
| Household Size | Owner-occupied | Renter-occupied |
| Less than High School | 186 (38.0%) | 303 (62.0%) |
| High School Diploma | 469 (38.0%) | 764 (62.0%) |
| College/Associate Degree | 393 (51.2%) | 375 (48.8%) |
| Bachelor's Degree or higher | 251 (65.5%) | 132 (34.5%) |
Occupancy by Age of Householder in Ripley
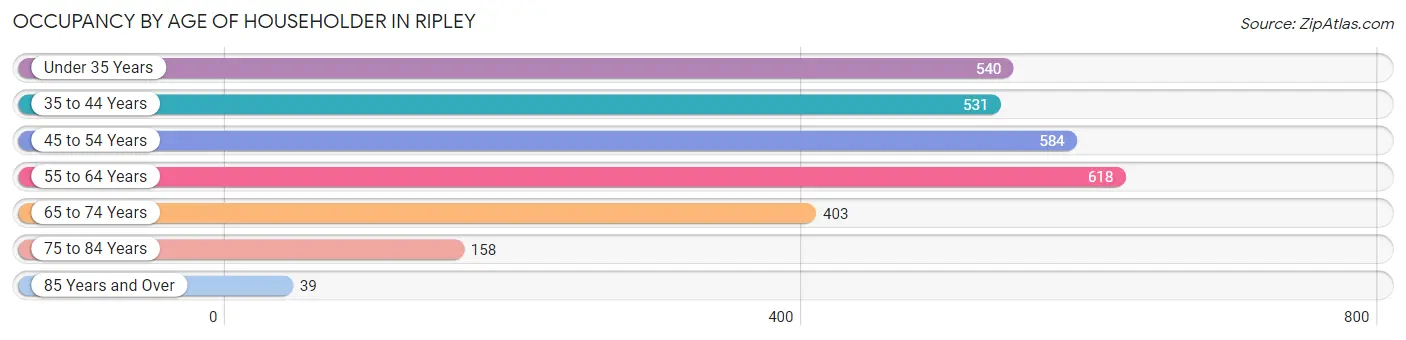
| Age Bracket | # Households | % Households |
| Under 35 Years | 540 | 18.8% |
| 35 to 44 Years | 531 | 18.5% |
| 45 to 54 Years | 584 | 20.3% |
| 55 to 64 Years | 618 | 21.5% |
| 65 to 74 Years | 403 | 14.0% |
| 75 to 84 Years | 158 | 5.5% |
| 85 Years and Over | 39 | 1.4% |
| Total | 2,873 | 100.0% |
Housing Finances in Ripley
Median Income by Occupancy in Ripley
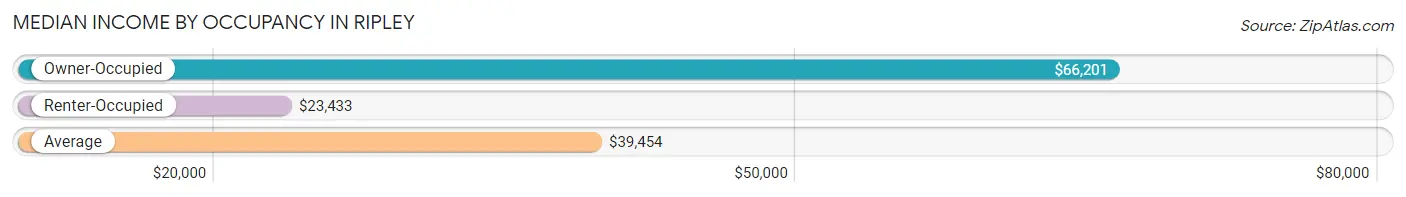
| Occupancy Type | # Households | Median Income |
| Owner-Occupied | 1,299 (45.2%) | $66,201 |
| Renter-Occupied | 1,574 (54.8%) | $23,433 |
| Average | 2,873 (100.0%) | $39,454 |
Occupancy by Householder Income Bracket in Ripley
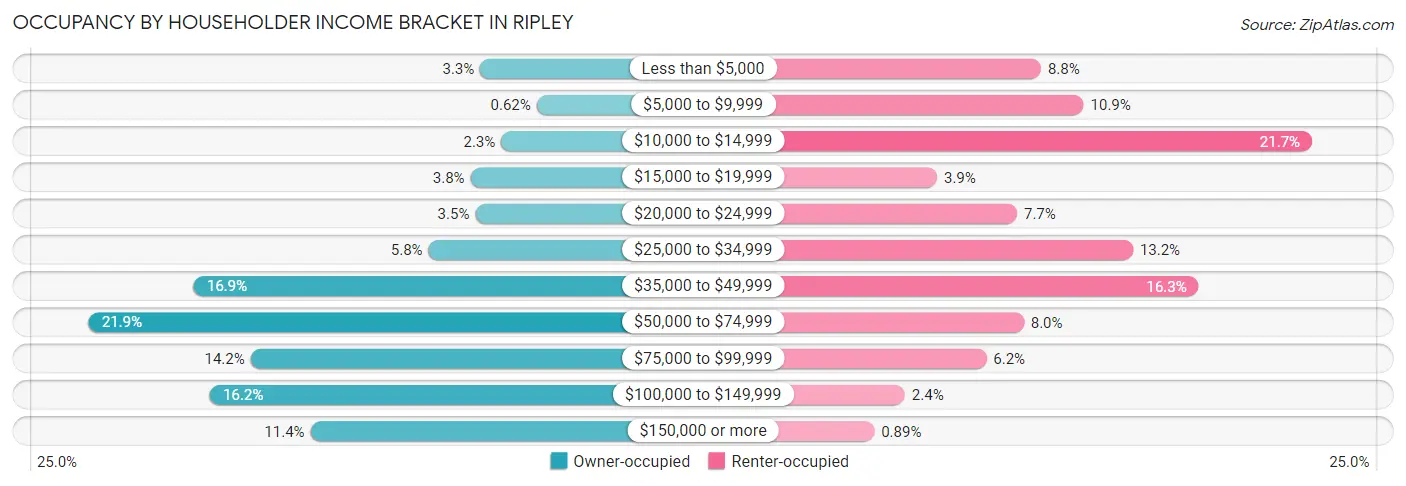
| Income Bracket | Owner-occupied | Renter-occupied |
| Less than $5,000 | 43 (3.3%) | 139 (8.8%) |
| $5,000 to $9,999 | 8 (0.6%) | 171 (10.9%) |
| $10,000 to $14,999 | 30 (2.3%) | 342 (21.7%) |
| $15,000 to $19,999 | 49 (3.8%) | 61 (3.9%) |
| $20,000 to $24,999 | 46 (3.5%) | 121 (7.7%) |
| $25,000 to $34,999 | 75 (5.8%) | 208 (13.2%) |
| $35,000 to $49,999 | 220 (16.9%) | 257 (16.3%) |
| $50,000 to $74,999 | 285 (21.9%) | 126 (8.0%) |
| $75,000 to $99,999 | 185 (14.2%) | 98 (6.2%) |
| $100,000 to $149,999 | 210 (16.2%) | 37 (2.4%) |
| $150,000 or more | 148 (11.4%) | 14 (0.9%) |
| Total | 1,299 (100.0%) | 1,574 (100.0%) |
Monthly Housing Cost Tiers in Ripley
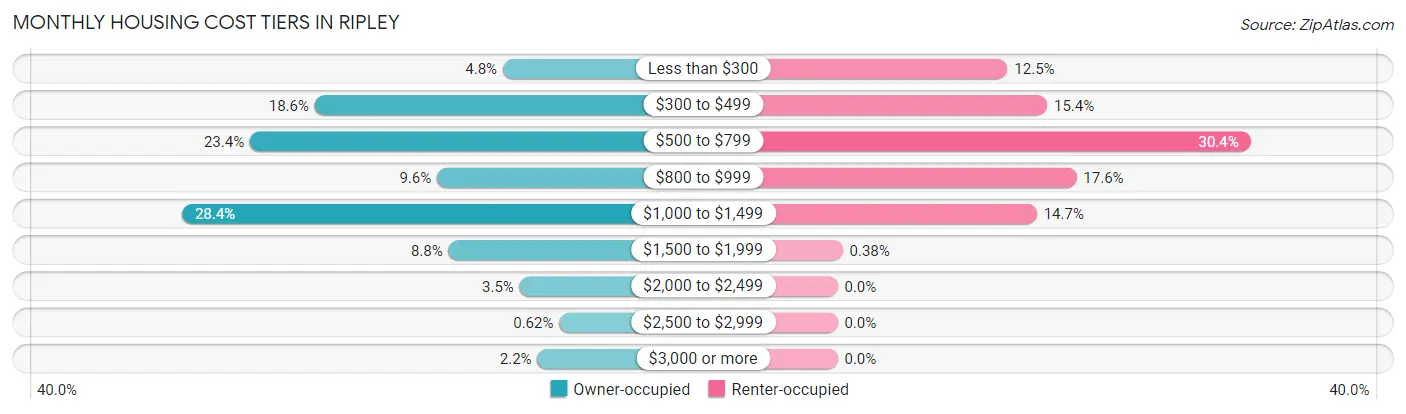
| Monthly Cost | Owner-occupied | Renter-occupied |
| Less than $300 | 62 (4.8%) | 197 (12.5%) |
| $300 to $499 | 242 (18.6%) | 243 (15.4%) |
| $500 to $799 | 304 (23.4%) | 479 (30.4%) |
| $800 to $999 | 125 (9.6%) | 277 (17.6%) |
| $1,000 to $1,499 | 369 (28.4%) | 231 (14.7%) |
| $1,500 to $1,999 | 114 (8.8%) | 6 (0.4%) |
| $2,000 to $2,499 | 46 (3.5%) | 0 (0.0%) |
| $2,500 to $2,999 | 8 (0.6%) | 0 (0.0%) |
| $3,000 or more | 29 (2.2%) | 0 (0.0%) |
| Total | 1,299 (100.0%) | 1,574 (100.0%) |
Physical Housing Characteristics in Ripley
Housing Structures in Ripley
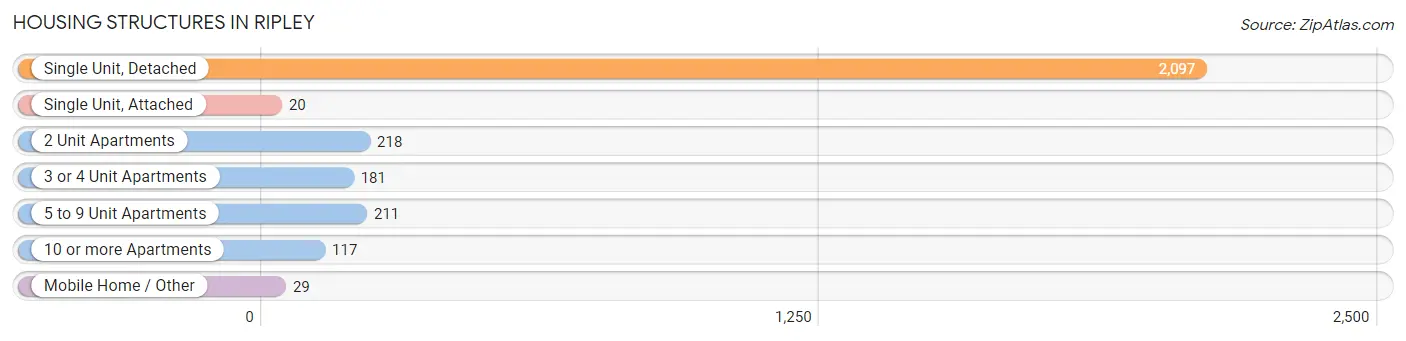
| Structure Type | # Housing Units | % Housing Units |
| Single Unit, Detached | 2,097 | 73.0% |
| Single Unit, Attached | 20 | 0.7% |
| 2 Unit Apartments | 218 | 7.6% |
| 3 or 4 Unit Apartments | 181 | 6.3% |
| 5 to 9 Unit Apartments | 211 | 7.3% |
| 10 or more Apartments | 117 | 4.1% |
| Mobile Home / Other | 29 | 1.0% |
| Total | 2,873 | 100.0% |
Housing Structures by Occupancy in Ripley
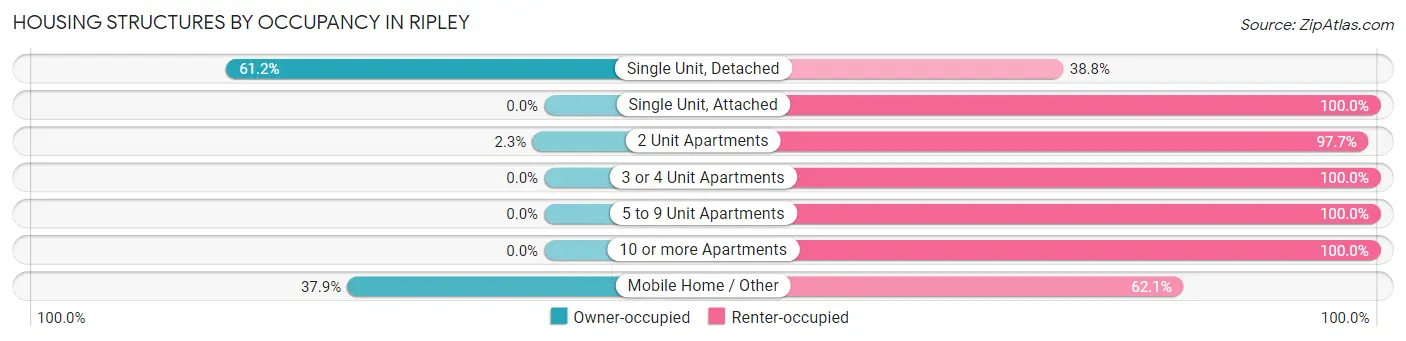
| Structure Type | Owner-occupied | Renter-occupied |
| Single Unit, Detached | 1,283 (61.2%) | 814 (38.8%) |
| Single Unit, Attached | 0 (0.0%) | 20 (100.0%) |
| 2 Unit Apartments | 5 (2.3%) | 213 (97.7%) |
| 3 or 4 Unit Apartments | 0 (0.0%) | 181 (100.0%) |
| 5 to 9 Unit Apartments | 0 (0.0%) | 211 (100.0%) |
| 10 or more Apartments | 0 (0.0%) | 117 (100.0%) |
| Mobile Home / Other | 11 (37.9%) | 18 (62.1%) |
| Total | 1,299 (45.2%) | 1,574 (54.8%) |
Housing Structures by Number of Rooms in Ripley
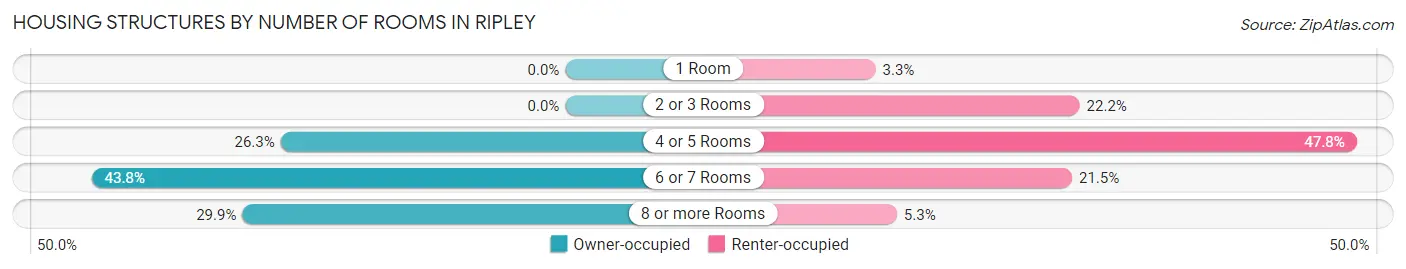
| Number of Rooms | Owner-occupied | Renter-occupied |
| 1 Room | 0 (0.0%) | 52 (3.3%) |
| 2 or 3 Rooms | 0 (0.0%) | 349 (22.2%) |
| 4 or 5 Rooms | 342 (26.3%) | 752 (47.8%) |
| 6 or 7 Rooms | 569 (43.8%) | 338 (21.5%) |
| 8 or more Rooms | 388 (29.9%) | 83 (5.3%) |
| Total | 1,299 (100.0%) | 1,574 (100.0%) |
Housing Structure by Heating Type in Ripley
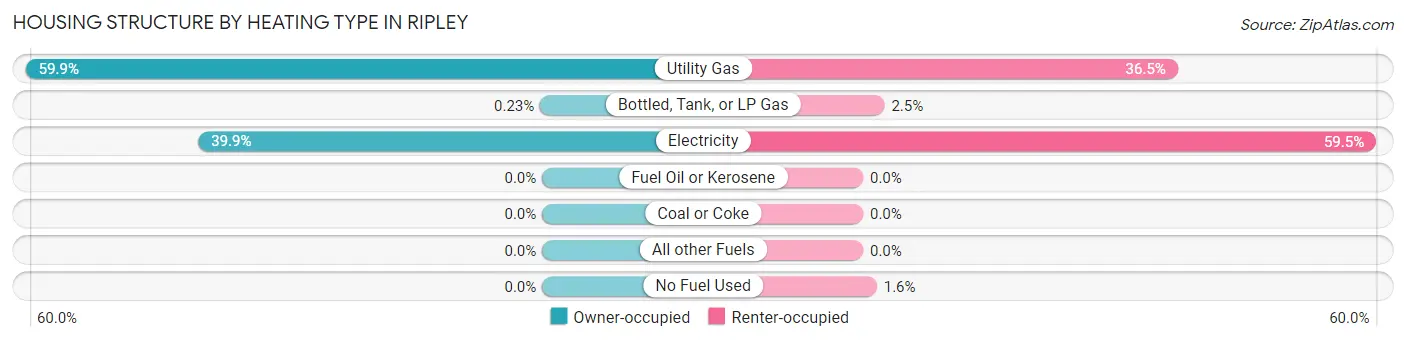
| Heating Type | Owner-occupied | Renter-occupied |
| Utility Gas | 778 (59.9%) | 574 (36.5%) |
| Bottled, Tank, or LP Gas | 3 (0.2%) | 39 (2.5%) |
| Electricity | 518 (39.9%) | 936 (59.5%) |
| Fuel Oil or Kerosene | 0 (0.0%) | 0 (0.0%) |
| Coal or Coke | 0 (0.0%) | 0 (0.0%) |
| All other Fuels | 0 (0.0%) | 0 (0.0%) |
| No Fuel Used | 0 (0.0%) | 25 (1.6%) |
| Total | 1,299 (100.0%) | 1,574 (100.0%) |
Household Vehicle Usage in Ripley
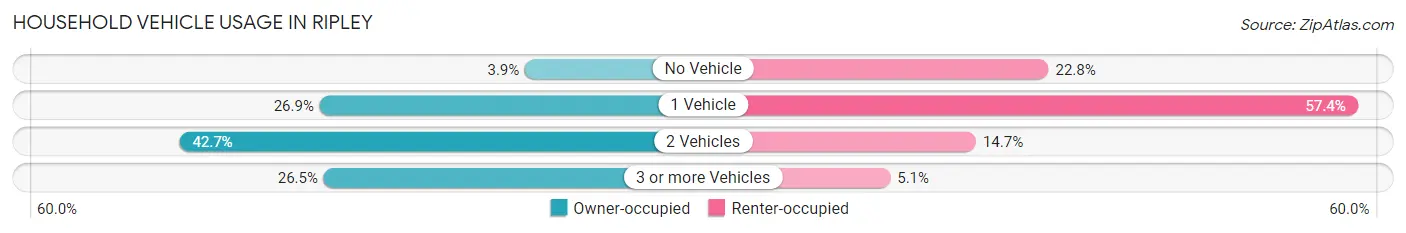
| Vehicles per Household | Owner-occupied | Renter-occupied |
| No Vehicle | 51 (3.9%) | 359 (22.8%) |
| 1 Vehicle | 350 (26.9%) | 904 (57.4%) |
| 2 Vehicles | 554 (42.6%) | 231 (14.7%) |
| 3 or more Vehicles | 344 (26.5%) | 80 (5.1%) |
| Total | 1,299 (100.0%) | 1,574 (100.0%) |
Real Estate & Mortgages in Ripley
Real Estate and Mortgage Overview in Ripley
| Characteristic | Without Mortgage | With Mortgage |
| Housing Units | 547 | 752 |
| Median Property Value | $100,800 | $159,800 |
| Median Household Income | $57,813 | $103 |
| Monthly Housing Costs | $464 | $29 |
| Real Estate Taxes | $1,122 | $5 |
Property Value by Mortgage Status in Ripley
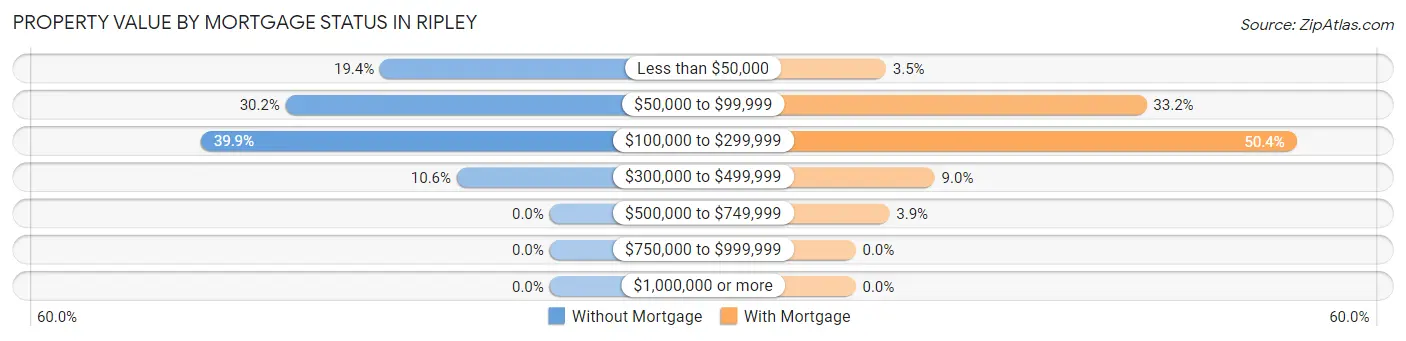
| Property Value | Without Mortgage | With Mortgage |
| Less than $50,000 | 106 (19.4%) | 26 (3.5%) |
| $50,000 to $99,999 | 165 (30.2%) | 250 (33.2%) |
| $100,000 to $299,999 | 218 (39.9%) | 379 (50.4%) |
| $300,000 to $499,999 | 58 (10.6%) | 68 (9.0%) |
| $500,000 to $749,999 | 0 (0.0%) | 29 (3.9%) |
| $750,000 to $999,999 | 0 (0.0%) | 0 (0.0%) |
| $1,000,000 or more | 0 (0.0%) | 0 (0.0%) |
| Total | 547 (100.0%) | 752 (100.0%) |
Household Income by Mortgage Status in Ripley
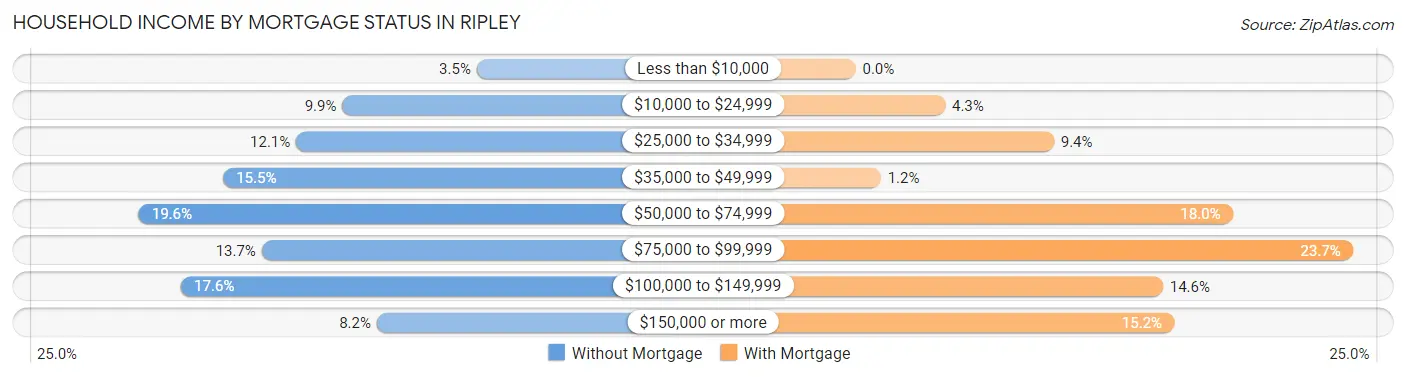
| Household Income | Without Mortgage | With Mortgage |
| Less than $10,000 | 19 (3.5%) | 0 (0.0%) |
| $10,000 to $24,999 | 54 (9.9%) | 32 (4.3%) |
| $25,000 to $34,999 | 66 (12.1%) | 71 (9.4%) |
| $35,000 to $49,999 | 85 (15.5%) | 9 (1.2%) |
| $50,000 to $74,999 | 107 (19.6%) | 135 (17.9%) |
| $75,000 to $99,999 | 75 (13.7%) | 178 (23.7%) |
| $100,000 to $149,999 | 96 (17.5%) | 110 (14.6%) |
| $150,000 or more | 45 (8.2%) | 114 (15.2%) |
| Total | 547 (100.0%) | 752 (100.0%) |
Property Value to Household Income Ratio in Ripley
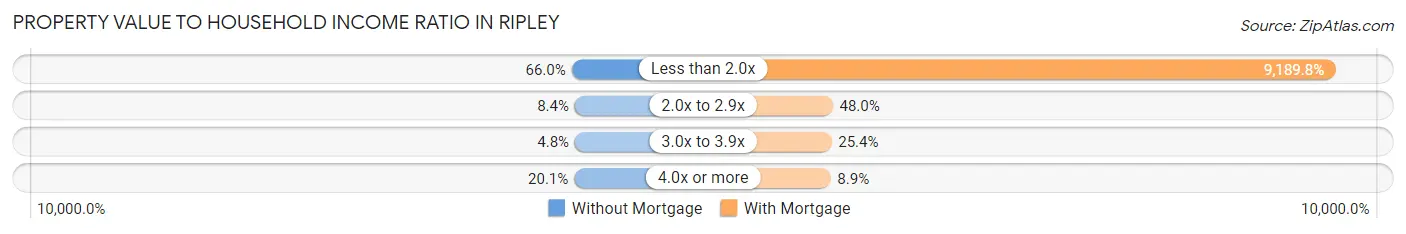
| Value-to-Income Ratio | Without Mortgage | With Mortgage |
| Less than 2.0x | 361 (66.0%) | 69,107 (9,189.8%) |
| 2.0x to 2.9x | 46 (8.4%) | 361 (48.0%) |
| 3.0x to 3.9x | 26 (4.8%) | 191 (25.4%) |
| 4.0x or more | 110 (20.1%) | 67 (8.9%) |
| Total | 547 (100.0%) | 752 (100.0%) |
Real Estate Taxes by Mortgage Status in Ripley
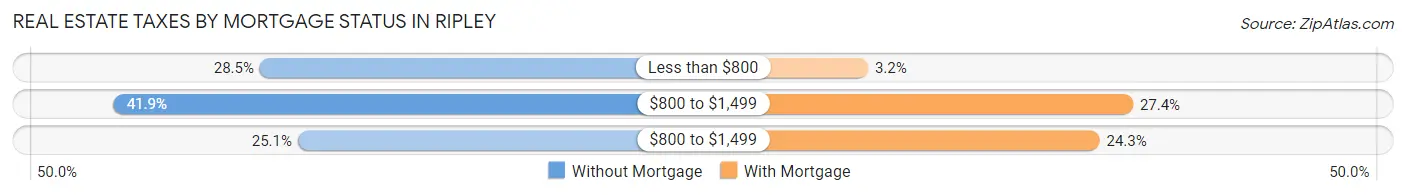
| Property Taxes | Without Mortgage | With Mortgage |
| Less than $800 | 156 (28.5%) | 24 (3.2%) |
| $800 to $1,499 | 229 (41.9%) | 206 (27.4%) |
| $800 to $1,499 | 137 (25.1%) | 183 (24.3%) |
| Total | 547 (100.0%) | 752 (100.0%) |
Health & Disability in Ripley
Health Insurance Coverage by Age in Ripley
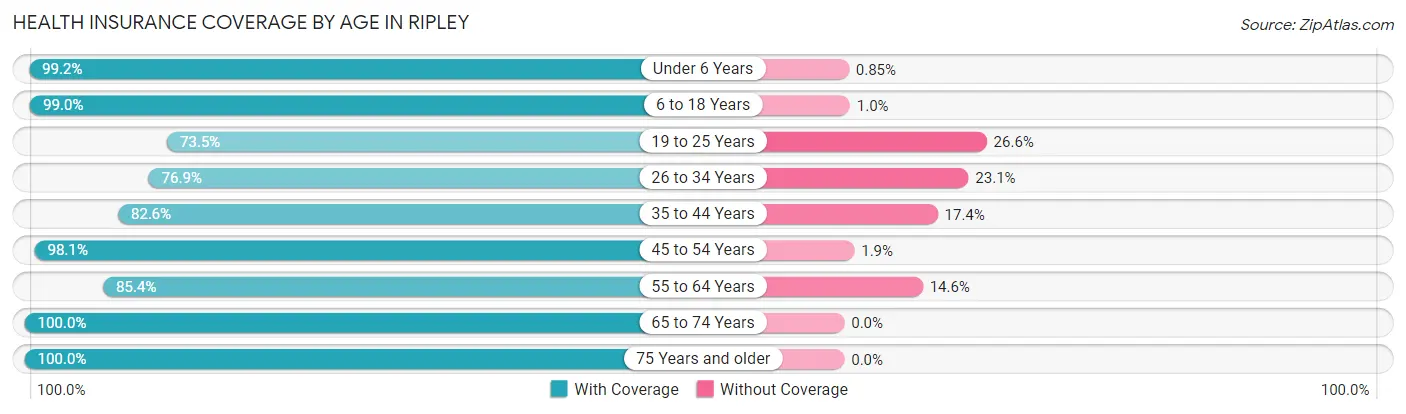
| Age Bracket | With Coverage | Without Coverage |
| Under 6 Years | 697 (99.2%) | 6 (0.9%) |
| 6 to 18 Years | 1,350 (99.0%) | 14 (1.0%) |
| 19 to 25 Years | 697 (73.5%) | 252 (26.6%) |
| 26 to 34 Years | 558 (76.9%) | 168 (23.1%) |
| 35 to 44 Years | 821 (82.6%) | 173 (17.4%) |
| 45 to 54 Years | 842 (98.1%) | 16 (1.9%) |
| 55 to 64 Years | 899 (85.4%) | 154 (14.6%) |
| 65 to 74 Years | 670 (100.0%) | 0 (0.0%) |
| 75 Years and older | 255 (100.0%) | 0 (0.0%) |
| Total | 6,789 (89.7%) | 783 (10.3%) |
Health Insurance Coverage by Citizenship Status in Ripley
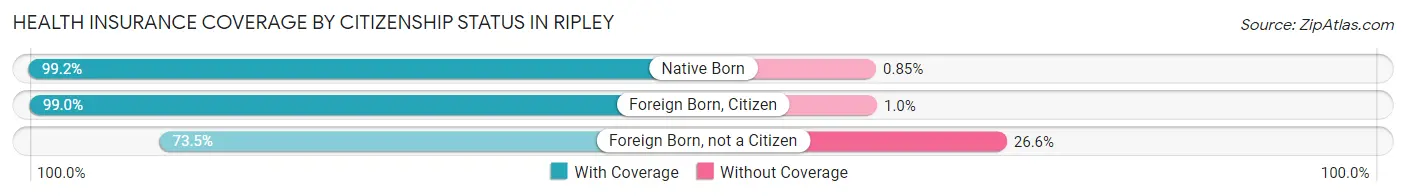
| Citizenship Status | With Coverage | Without Coverage |
| Native Born | 697 (99.2%) | 6 (0.9%) |
| Foreign Born, Citizen | 1,350 (99.0%) | 14 (1.0%) |
| Foreign Born, not a Citizen | 697 (73.5%) | 252 (26.6%) |
Health Insurance Coverage by Household Income in Ripley
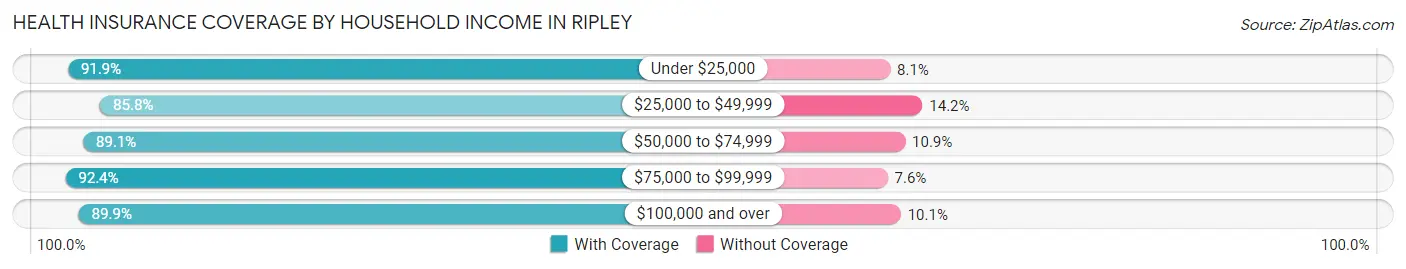
| Household Income | With Coverage | Without Coverage |
| Under $25,000 | 1,757 (91.9%) | 155 (8.1%) |
| $25,000 to $49,999 | 1,607 (85.8%) | 265 (14.2%) |
| $50,000 to $74,999 | 978 (89.1%) | 120 (10.9%) |
| $75,000 to $99,999 | 1,076 (92.4%) | 89 (7.6%) |
| $100,000 and over | 1,369 (89.9%) | 154 (10.1%) |
Public vs Private Health Insurance Coverage by Age in Ripley
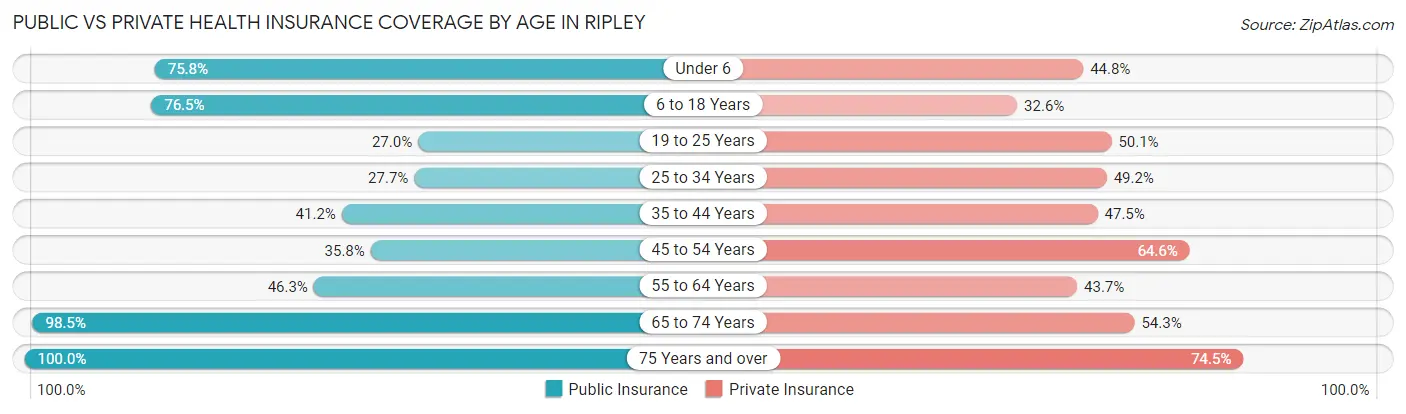
| Age Bracket | Public Insurance | Private Insurance |
| Under 6 | 533 (75.8%) | 315 (44.8%) |
| 6 to 18 Years | 1,043 (76.5%) | 444 (32.6%) |
| 19 to 25 Years | 256 (27.0%) | 475 (50.0%) |
| 25 to 34 Years | 201 (27.7%) | 357 (49.2%) |
| 35 to 44 Years | 409 (41.1%) | 472 (47.5%) |
| 45 to 54 Years | 307 (35.8%) | 554 (64.6%) |
| 55 to 64 Years | 488 (46.3%) | 460 (43.7%) |
| 65 to 74 Years | 660 (98.5%) | 364 (54.3%) |
| 75 Years and over | 255 (100.0%) | 190 (74.5%) |
| Total | 4,152 (54.8%) | 3,631 (47.9%) |
Disability Status by Sex by Age in Ripley
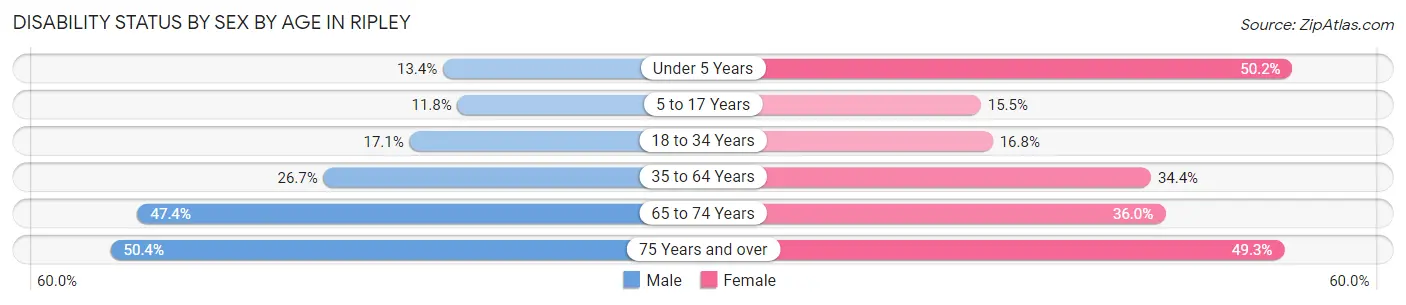
| Age Bracket | Male | Female |
| Under 5 Years | 39 (13.4%) | 139 (50.2%) |
| 5 to 17 Years | 84 (11.8%) | 100 (15.5%) |
| 18 to 34 Years | 154 (17.1%) | 154 (16.8%) |
| 35 to 64 Years | 360 (26.7%) | 536 (34.4%) |
| 65 to 74 Years | 128 (47.4%) | 144 (36.0%) |
| 75 Years and over | 60 (50.4%) | 67 (49.3%) |
Disability Class by Sex by Age in Ripley
Disability Class: Hearing Difficulty
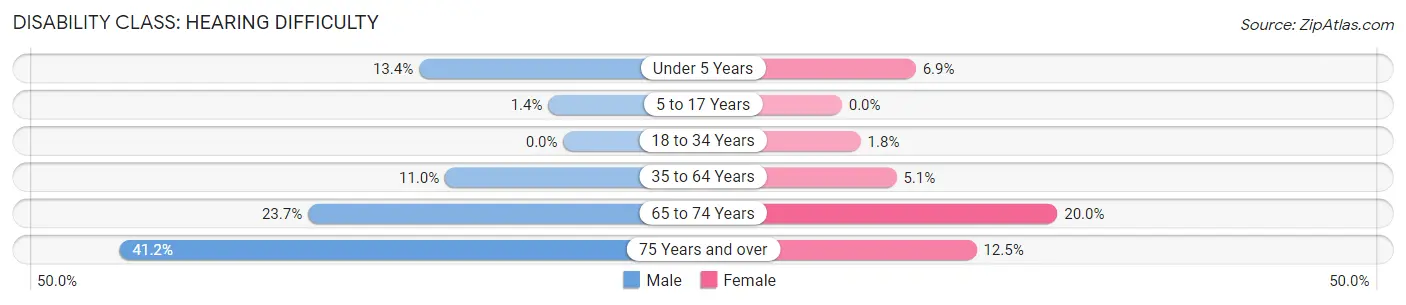
| Age Bracket | Male | Female |
| Under 5 Years | 39 (13.4%) | 19 (6.9%) |
| 5 to 17 Years | 10 (1.4%) | 0 (0.0%) |
| 18 to 34 Years | 0 (0.0%) | 16 (1.8%) |
| 35 to 64 Years | 148 (11.0%) | 79 (5.1%) |
| 65 to 74 Years | 64 (23.7%) | 80 (20.0%) |
| 75 Years and over | 49 (41.2%) | 17 (12.5%) |
Disability Class: Vision Difficulty
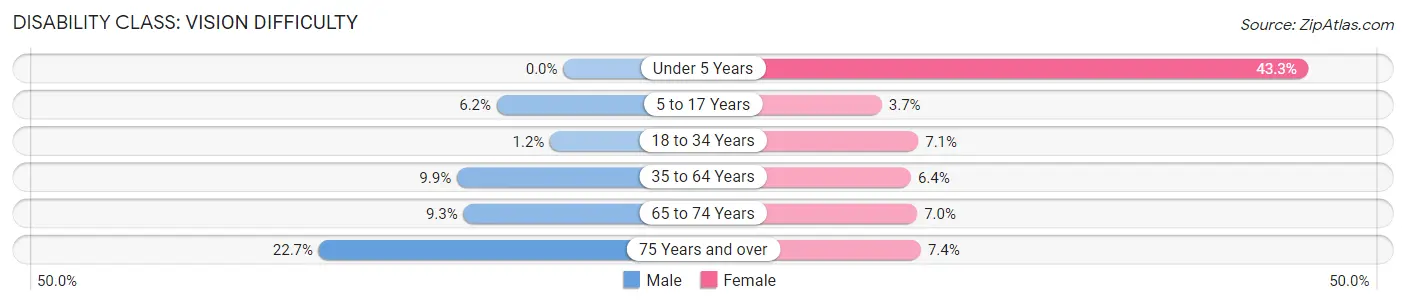
| Age Bracket | Male | Female |
| Under 5 Years | 0 (0.0%) | 120 (43.3%) |
| 5 to 17 Years | 44 (6.2%) | 24 (3.7%) |
| 18 to 34 Years | 11 (1.2%) | 65 (7.1%) |
| 35 to 64 Years | 133 (9.9%) | 100 (6.4%) |
| 65 to 74 Years | 25 (9.3%) | 28 (7.0%) |
| 75 Years and over | 27 (22.7%) | 10 (7.3%) |
Disability Class: Cognitive Difficulty
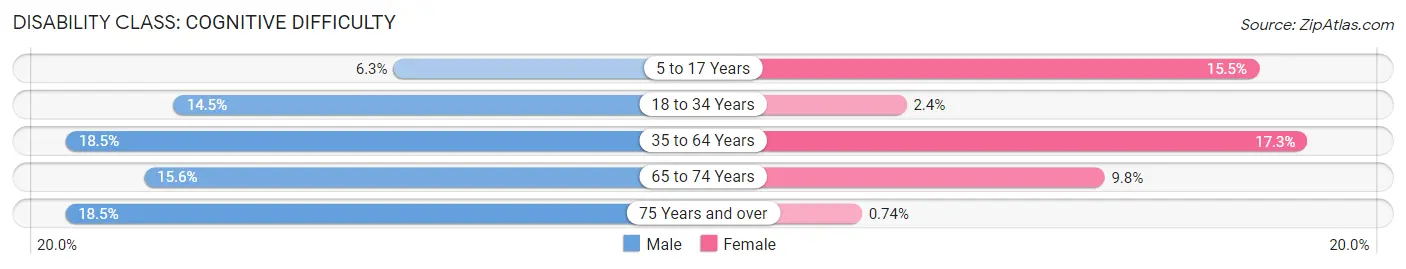
| Age Bracket | Male | Female |
| 5 to 17 Years | 45 (6.3%) | 100 (15.5%) |
| 18 to 34 Years | 130 (14.5%) | 22 (2.4%) |
| 35 to 64 Years | 249 (18.5%) | 269 (17.3%) |
| 65 to 74 Years | 42 (15.6%) | 39 (9.8%) |
| 75 Years and over | 22 (18.5%) | 1 (0.7%) |
Disability Class: Ambulatory Difficulty
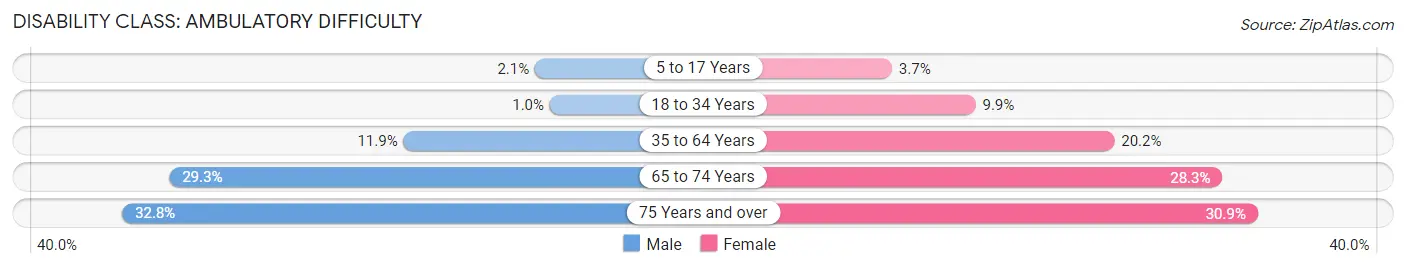
| Age Bracket | Male | Female |
| 5 to 17 Years | 15 (2.1%) | 24 (3.7%) |
| 18 to 34 Years | 9 (1.0%) | 91 (9.9%) |
| 35 to 64 Years | 160 (11.9%) | 315 (20.2%) |
| 65 to 74 Years | 79 (29.3%) | 113 (28.2%) |
| 75 Years and over | 39 (32.8%) | 42 (30.9%) |
Disability Class: Self-Care Difficulty
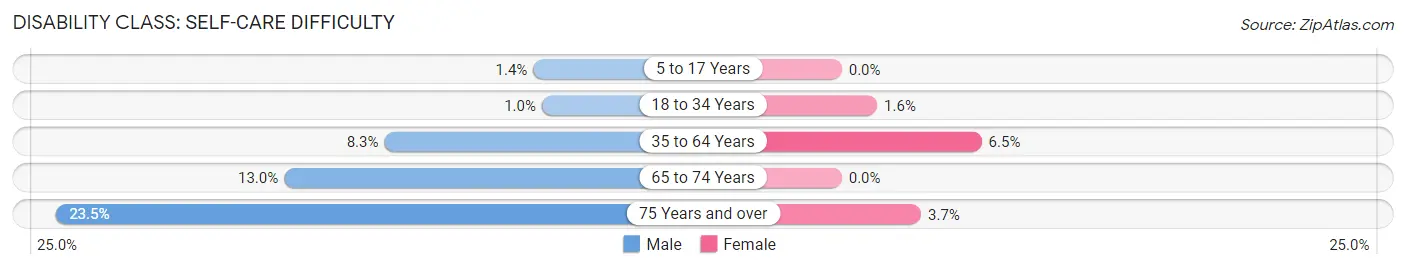
| Age Bracket | Male | Female |
| 5 to 17 Years | 10 (1.4%) | 0 (0.0%) |
| 18 to 34 Years | 9 (1.0%) | 15 (1.6%) |
| 35 to 64 Years | 112 (8.3%) | 101 (6.5%) |
| 65 to 74 Years | 35 (13.0%) | 0 (0.0%) |
| 75 Years and over | 28 (23.5%) | 5 (3.7%) |
Technology Access in Ripley
Computing Device Access in Ripley
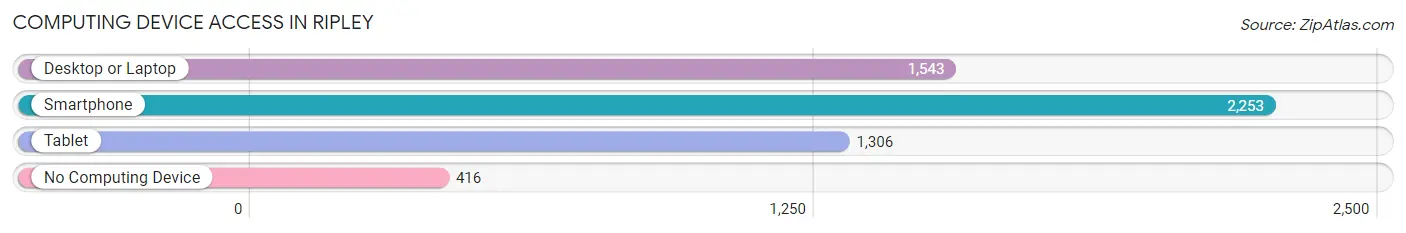
| Device Type | # Households | % Households |
| Desktop or Laptop | 1,543 | 53.7% |
| Smartphone | 2,253 | 78.4% |
| Tablet | 1,306 | 45.5% |
| No Computing Device | 416 | 14.5% |
| Total | 2,873 | 100.0% |
Internet Access in Ripley
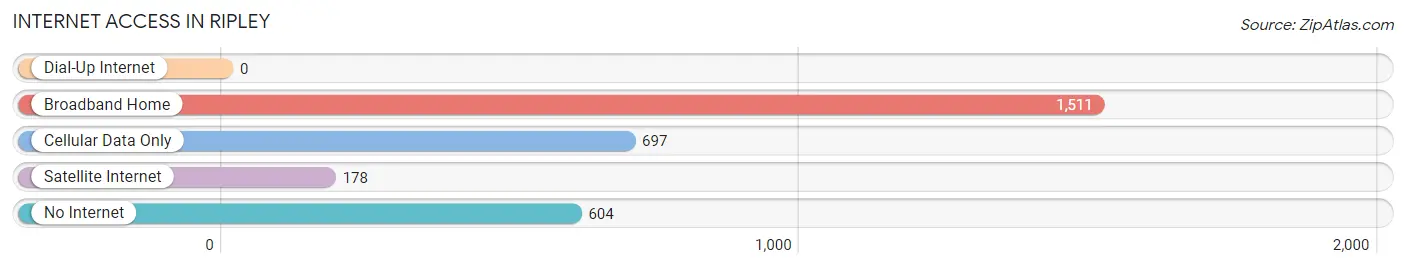
| Internet Type | # Households | % Households |
| Dial-Up Internet | 0 | 0.0% |
| Broadband Home | 1,511 | 52.6% |
| Cellular Data Only | 697 | 24.3% |
| Satellite Internet | 178 | 6.2% |
| No Internet | 604 | 21.0% |
| Total | 2,873 | 100.0% |
Ripley Summary
Ripley, Tennessee is a small town located in Lauderdale County, in the western part of the state. It is situated on the banks of the Hatchie River, about halfway between Memphis and Nashville. The town was founded in 1824 and named after the Revolutionary War hero, General Eleazer Wheelock Ripley. It is the county seat of Lauderdale County and has a population of around 7,000 people.
Geography
Ripley is located in the western part of Tennessee, in Lauderdale County. It is situated on the banks of the Hatchie River, about halfway between Memphis and Nashville. The town is surrounded by rolling hills and farmland, and is located in the Mississippi Delta region. The climate is humid subtropical, with hot summers and mild winters.
Economy
Ripley’s economy is largely based on agriculture and manufacturing. The town is home to several large factories, including a Tyson Foods plant, a Nestle plant, and a Kellogg’s plant. The town also has a thriving retail sector, with several stores and restaurants. The town is also home to a number of small businesses, including a local newspaper, a radio station, and a number of small shops.
Demographics
Ripley has a population of around 7,000 people. The town is predominantly white, with a small African American population. The median household income is around $35,000, and the median home value is around $90,000. The town has a low unemployment rate, and the poverty rate is below the national average.
History
Ripley was founded in 1824 and named after the Revolutionary War hero, General Eleazer Wheelock Ripley. The town was originally a trading post, and it quickly grew into a thriving community. The town was the site of a major Civil War battle in 1862, and it was also the site of a major railroad junction. The town was also home to a number of prominent figures, including the author William Faulkner and the civil rights leader Medgar Evers.
Ripley has a long and rich history, and it is still a thriving community today. The town is home to a number of businesses, and it is a popular destination for tourists. The town is also home to a number of historic sites, including the Hatchie River Museum and the Ripley Historic District. Ripley is a great place to live, work, and visit, and it is a great example of small-town life in Tennessee.
Common Questions
What is Per Capita Income in Ripley?
Per Capita income in Ripley is $22,503.
What is the Median Family Income in Ripley?
Median Family Income in Ripley is $47,256.
What is the Median Household income in Ripley?
Median Household Income in Ripley is $39,454.
What is Income or Wage Gap in Ripley?
Income or Wage Gap in Ripley is 32.7%.
Women in Ripley earn 67.3 cents for every dollar earned by a man.
What is Family Income Deficit in Ripley?
Family Income Deficit in Ripley is $14,003.
Families that are below poverty line in Ripley earn $14,003 less on average than the poverty threshold level.
What is Inequality or Gini Index in Ripley?
Inequality or Gini Index in Ripley is 0.48.
What is the Total Population of Ripley?
Total Population of Ripley is 7,794.
What is the Total Male Population of Ripley?
Total Male Population of Ripley is 3,783.
What is the Total Female Population of Ripley?
Total Female Population of Ripley is 4,011.
What is the Ratio of Males per 100 Females in Ripley?
There are 94.32 Males per 100 Females in Ripley.
What is the Ratio of Females per 100 Males in Ripley?
There are 106.03 Females per 100 Males in Ripley.
What is the Median Population Age in Ripley?
Median Population Age in Ripley is 36.7 Years.
What is the Average Family Size in Ripley
Average Family Size in Ripley is 3.3 People.
What is the Average Household Size in Ripley
Average Household Size in Ripley is 2.6 People.
How Large is the Labor Force in Ripley?
There are 3,070 People in the Labor Forcein in Ripley.
What is the Percentage of People in the Labor Force in Ripley?
50.0% of People are in the Labor Force in Ripley.
What is the Unemployment Rate in Ripley?
Unemployment Rate in Ripley is 9.6%.