Zip Codes with the Highest Percentage of Black / African American Population in Millington, TN
RELATED REPORTS & OPTIONS
Black / African American
Millington
Compare Zip Codes
Map of Zip Codes with the Highest Percentage of Black / African American Population in Millington
8.2%
25.1%
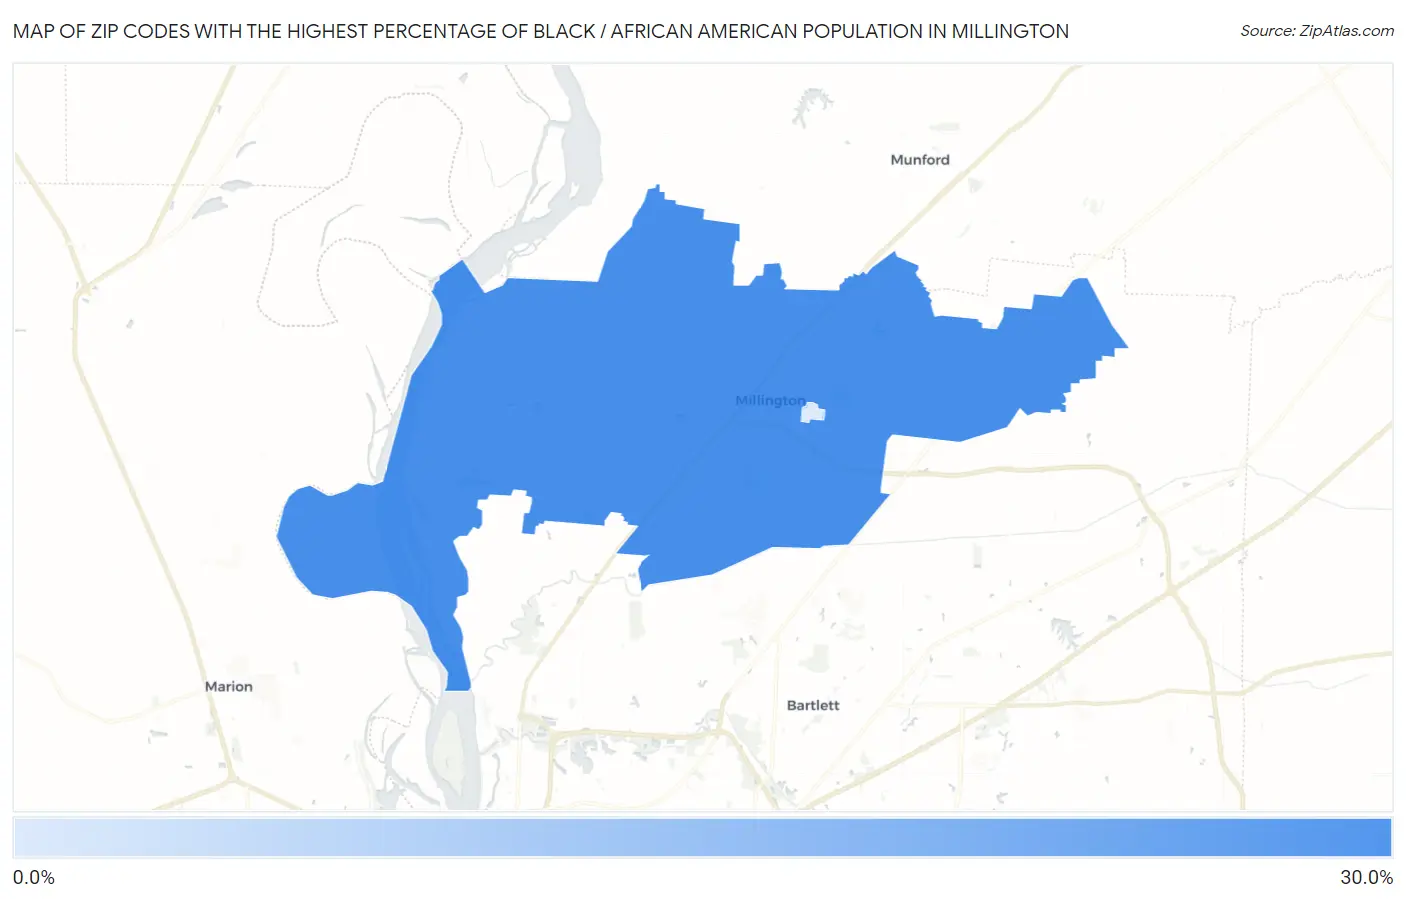
Zip Codes with the Highest Percentage of Black / African American Population in Millington, TN
| Zip Code | Black / African American | vs State | vs National | |
| 1. | 38053 | 25.1% | 16.3%(+8.83)#79 | 12.5%(+12.6)#3,200 |
| 2. | 38054 | 8.2% | 16.3%(-8.10)#164 | 12.5%(-4.29)#7,453 |
1
Common Questions
What are the Top Zip Codes with the Highest Percentage of Black / African American Population in Millington, TN?
Top Zip Codes with the Highest Percentage of Black / African American Population in Millington, TN are:
What zip code has the Highest Percentage of Black / African American Population in Millington, TN?
38053 has the Highest Percentage of Black / African American Population in Millington, TN with 25.1%.
What is the Percentage of Black / African American Population in Millington, TN?
Percentage of Black / African American Population in Millington is 30.7%.
What is the Percentage of Black / African American Population in Tennessee?
Percentage of Black / African American Population in Tennessee is 16.3%.
What is the Percentage of Black / African American Population in the United States?
Percentage of Black / African American Population in the United States is 12.5%.