Pikeville, TN Map & Demographics
Pikeville Map
Pikeville Overview
$17,210
PER CAPITA INCOME
$36,917
AVG FAMILY INCOME
$27,240
AVG HOUSEHOLD INCOME
$12,043
FAMILY INCOME DEFICIT
0.50
INEQUALITY / GINI INDEX
2,541
TOTAL POPULATION
1,627
MALE POPULATION
914
FEMALE POPULATION
178.01
MALES / 100 FEMALES
56.18
FEMALES / 100 MALES
28.9
MEDIAN AGE
4.5
AVG FAMILY SIZE
3.8
AVG HOUSEHOLD SIZE
1,030
LABOR FORCE [ PEOPLE ]
55.9%
PERCENT IN LABOR FORCE
6.7%
UNEMPLOYMENT RATE
Pikeville Zip Codes
Pikeville Area Codes
Income in Pikeville
Income Overview in Pikeville
Per Capita Income in Pikeville is $17,210, while median incomes of families and households are $36,917 and $27,240 respectively.
| Characteristic | Number | Measure |
| Per Capita Income | 2,541 | $17,210 |
| Median Family Income | 385 | $36,917 |
| Mean Family Income | 385 | $50,657 |
| Median Household Income | 623 | $27,240 |
| Mean Household Income | 623 | $43,525 |
| Income Deficit | 385 | $12,043 |
| Wage / Income Gap (%) | 2,541 | 0.00% |
| Wage / Income Gap ($) | 2,541 | 100.00¢ per $1 |
| Gini / Inequality Index | 2,541 | 0.50 |
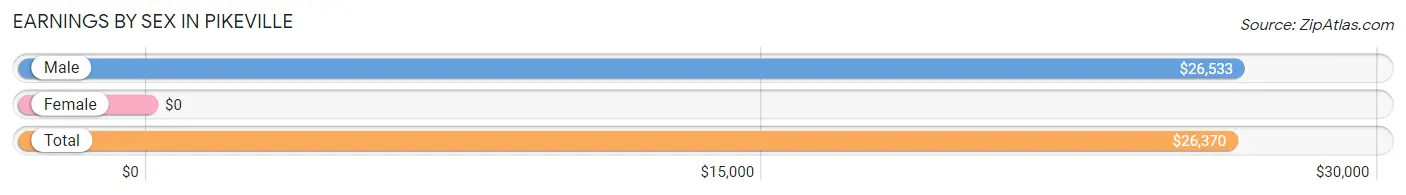
Earnings by Sex in Pikeville
| Sex | Number | Average Earnings |
| Male | 703 (67.5%) | $26,533 |
| Female | 339 (32.5%) | $0 |
| Total | 1,042 (100.0%) | $26,370 |
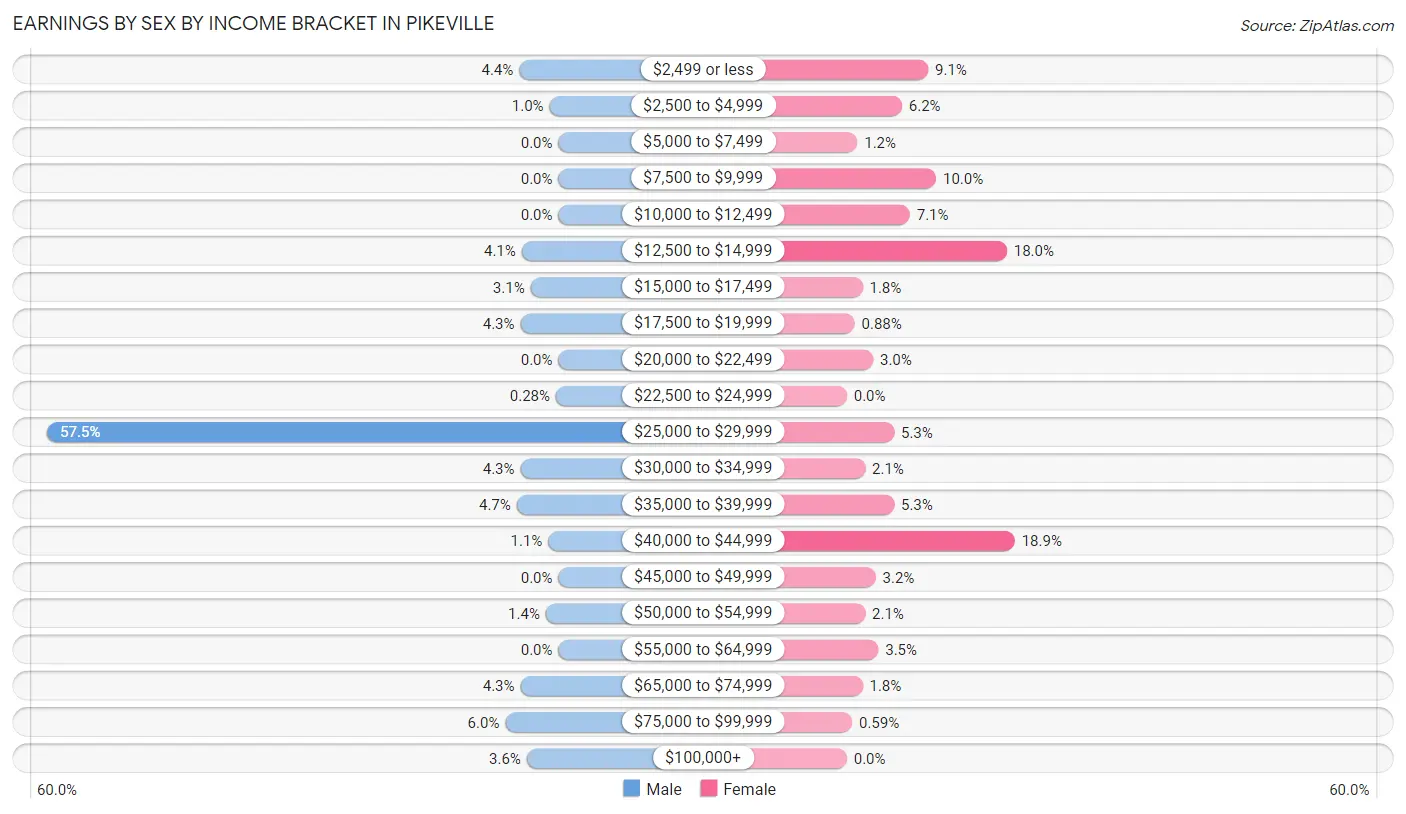
Earnings by Sex by Income Bracket in Pikeville
The most common earnings brackets in Pikeville are $25,000 to $29,999 for men (404 | 57.5%) and $40,000 to $44,999 for women (64 | 18.9%).
| Income | Male | Female |
| $2,499 or less | 31 (4.4%) | 31 (9.1%) |
| $2,500 to $4,999 | 7 (1.0%) | 21 (6.2%) |
| $5,000 to $7,499 | 0 (0.0%) | 4 (1.2%) |
| $7,500 to $9,999 | 0 (0.0%) | 34 (10.0%) |
| $10,000 to $12,499 | 0 (0.0%) | 24 (7.1%) |
| $12,500 to $14,999 | 29 (4.1%) | 61 (18.0%) |
| $15,000 to $17,499 | 22 (3.1%) | 6 (1.8%) |
| $17,500 to $19,999 | 30 (4.3%) | 3 (0.9%) |
| $20,000 to $22,499 | 0 (0.0%) | 10 (2.9%) |
| $22,500 to $24,999 | 2 (0.3%) | 0 (0.0%) |
| $25,000 to $29,999 | 404 (57.5%) | 18 (5.3%) |
| $30,000 to $34,999 | 30 (4.3%) | 7 (2.1%) |
| $35,000 to $39,999 | 33 (4.7%) | 18 (5.3%) |
| $40,000 to $44,999 | 8 (1.1%) | 64 (18.9%) |
| $45,000 to $49,999 | 0 (0.0%) | 11 (3.2%) |
| $50,000 to $54,999 | 10 (1.4%) | 7 (2.1%) |
| $55,000 to $64,999 | 0 (0.0%) | 12 (3.5%) |
| $65,000 to $74,999 | 30 (4.3%) | 6 (1.8%) |
| $75,000 to $99,999 | 42 (6.0%) | 2 (0.6%) |
| $100,000+ | 25 (3.6%) | 0 (0.0%) |
| Total | 703 (100.0%) | 339 (100.0%) |
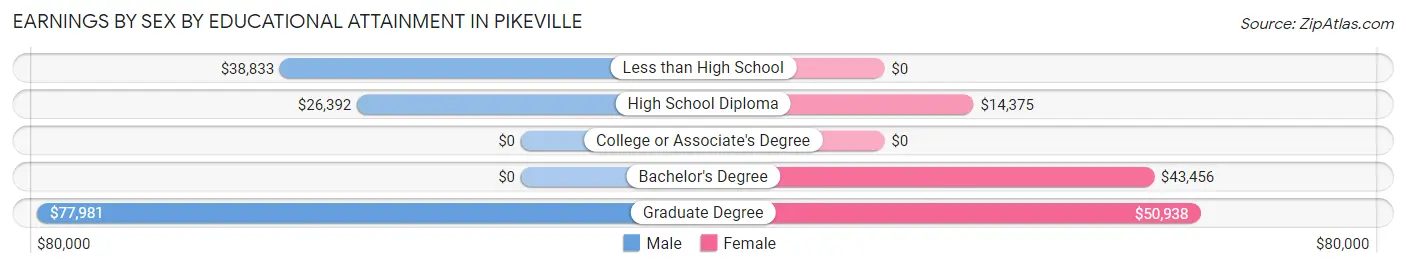
Earnings by Sex by Educational Attainment in Pikeville
Average earnings in Pikeville are $26,430 for men and $28,523 for women, a difference of 7.3%. Men with an educational attainment of graduate degree enjoy the highest average annual earnings of $77,981, while those with high school diploma education earn the least with $26,392. Women with an educational attainment of graduate degree earn the most with the average annual earnings of $50,938, while those with high school diploma education have the smallest earnings of $14,375.
| Educational Attainment | Male Income | Female Income |
| Less than High School | $38,833 | $0 |
| High School Diploma | $26,392 | $14,375 |
| College or Associate's Degree | - | - |
| Bachelor's Degree | - | - |
| Graduate Degree | $77,981 | $50,938 |
| Total | $26,430 | $28,523 |
Family Income in Pikeville
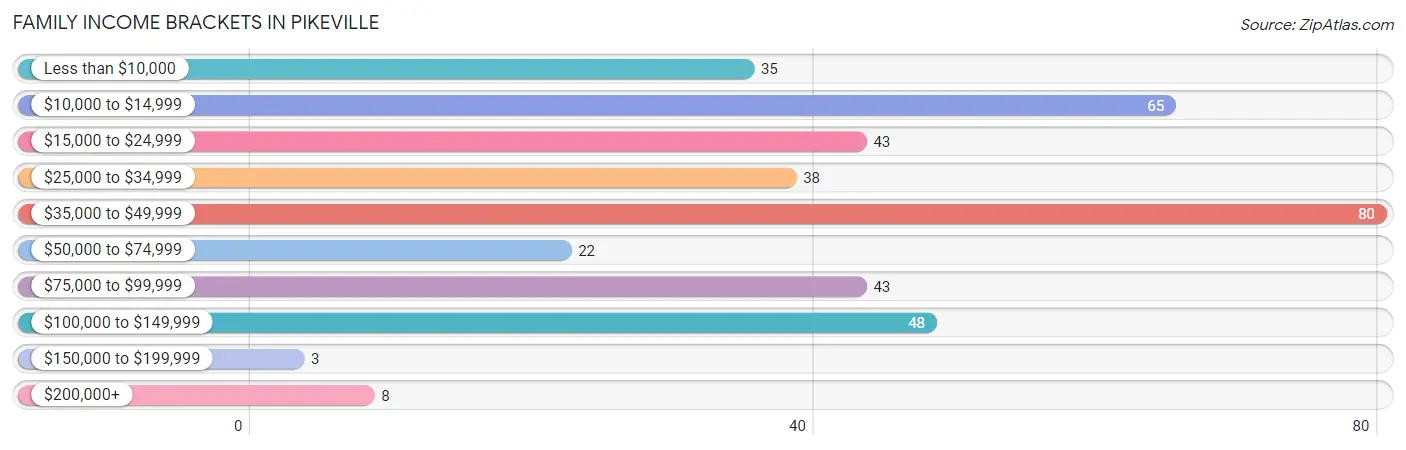
Family Income Brackets in Pikeville
According to the Pikeville family income data, there are 80 families falling into the $35,000 to $49,999 income range, which is the most common income bracket and makes up 20.8% of all families. Conversely, the $150,000 to $199,999 income bracket is the least frequent group with only 3 families (0.8%) belonging to this category.
| Income Bracket | # Families | % Families |
| Less than $10,000 | 35 | 9.1% |
| $10,000 to $14,999 | 65 | 16.9% |
| $15,000 to $24,999 | 43 | 11.2% |
| $25,000 to $34,999 | 38 | 9.9% |
| $35,000 to $49,999 | 80 | 20.8% |
| $50,000 to $74,999 | 22 | 5.7% |
| $75,000 to $99,999 | 43 | 11.2% |
| $100,000 to $149,999 | 48 | 12.5% |
| $150,000 to $199,999 | 3 | 0.8% |
| $200,000+ | 8 | 2.1% |
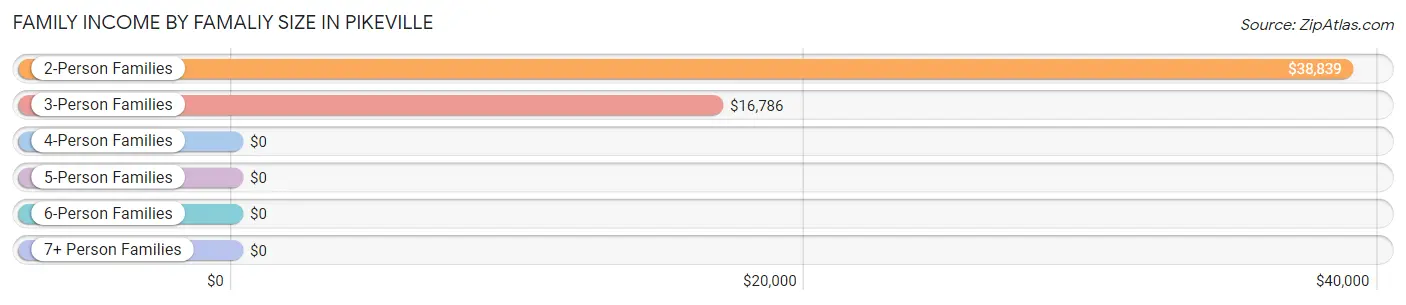
Family Income by Famaliy Size in Pikeville
2-person families (163 | 42.3%) account for the highest median family income in Pikeville with $38,839 per family, while 2-person families (163 | 42.3%) have the highest median income of $19,420 per family member.
| Income Bracket | # Families | Median Income |
| 2-Person Families | 163 (42.3%) | $38,839 |
| 3-Person Families | 80 (20.8%) | $16,786 |
| 4-Person Families | 60 (15.6%) | $0 |
| 5-Person Families | 36 (9.3%) | $0 |
| 6-Person Families | 19 (4.9%) | $0 |
| 7+ Person Families | 27 (7.0%) | $0 |
| Total | 385 (100.0%) | $36,917 |
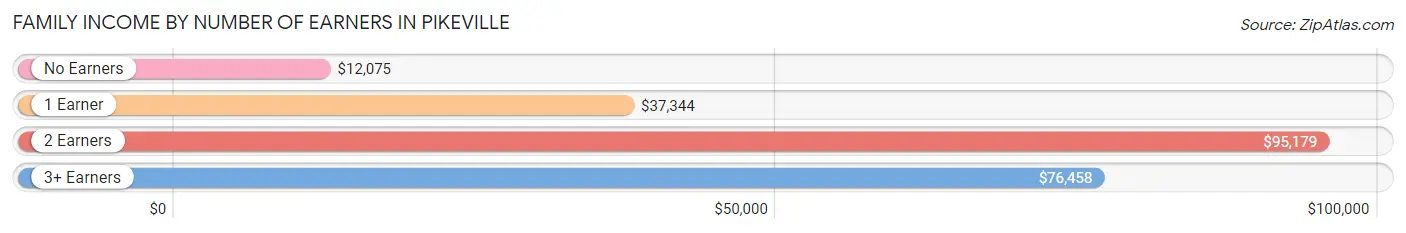
Family Income by Number of Earners in Pikeville
The median family income in Pikeville is $36,917, with families comprising 2 earners (97) having the highest median family income of $95,179, while families with no earners (115) have the lowest median family income of $12,075, accounting for 25.2% and 29.9% of families, respectively.
| Number of Earners | # Families | Median Income |
| No Earners | 115 (29.9%) | $12,075 |
| 1 Earner | 145 (37.7%) | $37,344 |
| 2 Earners | 97 (25.2%) | $95,179 |
| 3+ Earners | 28 (7.3%) | $76,458 |
| Total | 385 (100.0%) | $36,917 |
Household Income in Pikeville
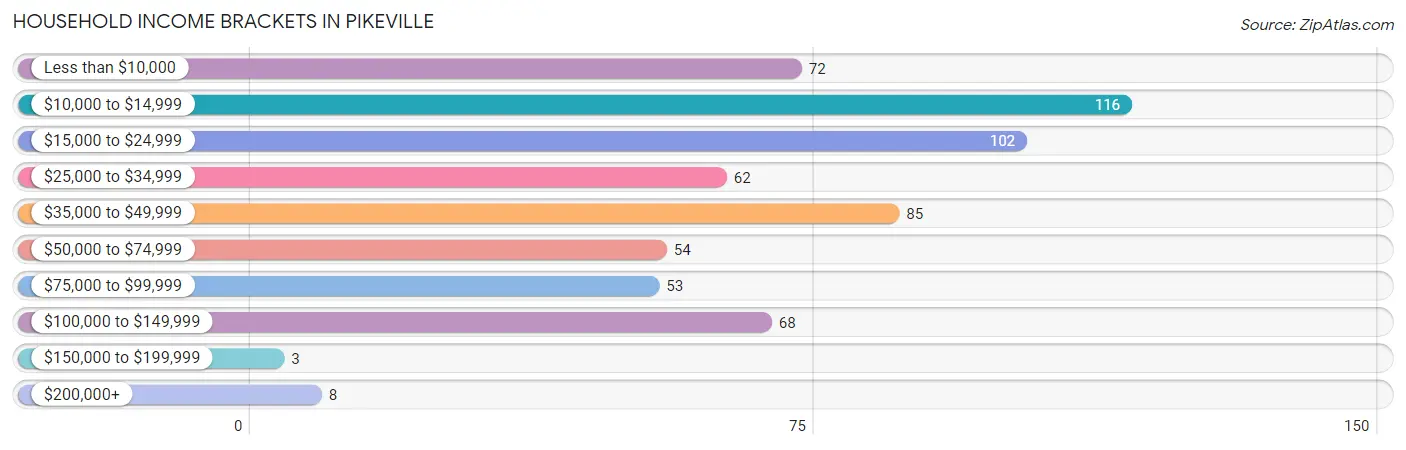
Household Income Brackets in Pikeville
With 116 households falling in the category, the $10,000 to $14,999 income range is the most frequent in Pikeville, accounting for 18.6% of all households. In contrast, only 3 households (0.5%) fall into the $150,000 to $199,999 income bracket, making it the least populous group.
| Income Bracket | # Households | % Households |
| Less than $10,000 | 72 | 11.6% |
| $10,000 to $14,999 | 116 | 18.6% |
| $15,000 to $24,999 | 102 | 16.4% |
| $25,000 to $34,999 | 62 | 10.0% |
| $35,000 to $49,999 | 85 | 13.6% |
| $50,000 to $74,999 | 54 | 8.7% |
| $75,000 to $99,999 | 53 | 8.5% |
| $100,000 to $149,999 | 68 | 10.9% |
| $150,000 to $199,999 | 3 | 0.5% |
| $200,000+ | 8 | 1.3% |
Household Income by Householder Age in Pikeville
The median household income in Pikeville is $27,240, with the highest median household income of $30,417 found in the 65+ years age bracket for the primary householder. A total of 209 households (33.6%) fall into this category. Meanwhile, the 45 to 64 years age bracket for the primary householder has the lowest median household income of $0, with 220 households (35.3%) in this group.
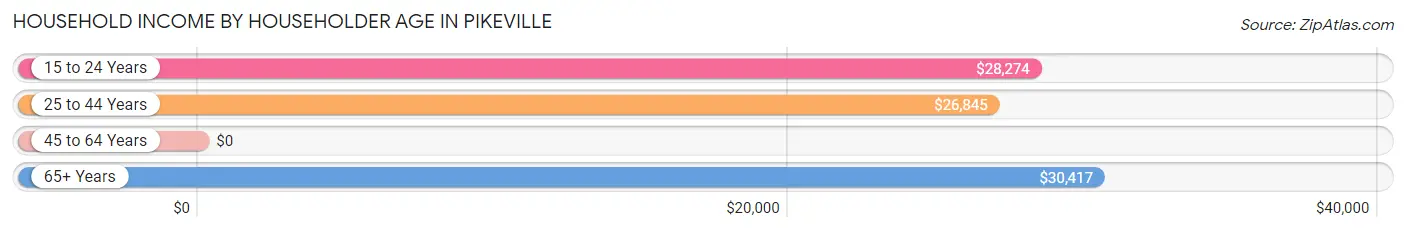
| Income Bracket | # Households | Median Income |
| 15 to 24 Years | 35 (5.6%) | $28,274 |
| 25 to 44 Years | 159 (25.5%) | $26,845 |
| 45 to 64 Years | 220 (35.3%) | $0 |
| 65+ Years | 209 (33.6%) | $30,417 |
| Total | 623 (100.0%) | $27,240 |
Poverty in Pikeville
Income Below Poverty by Sex and Age in Pikeville
With 40.2% poverty level for males and 48.1% for females among the residents of Pikeville, 15 year old males and 5 year old females are the most vulnerable to poverty, with 18 males (100.0%) and 5 females (100.0%) in their respective age groups living below the poverty level.
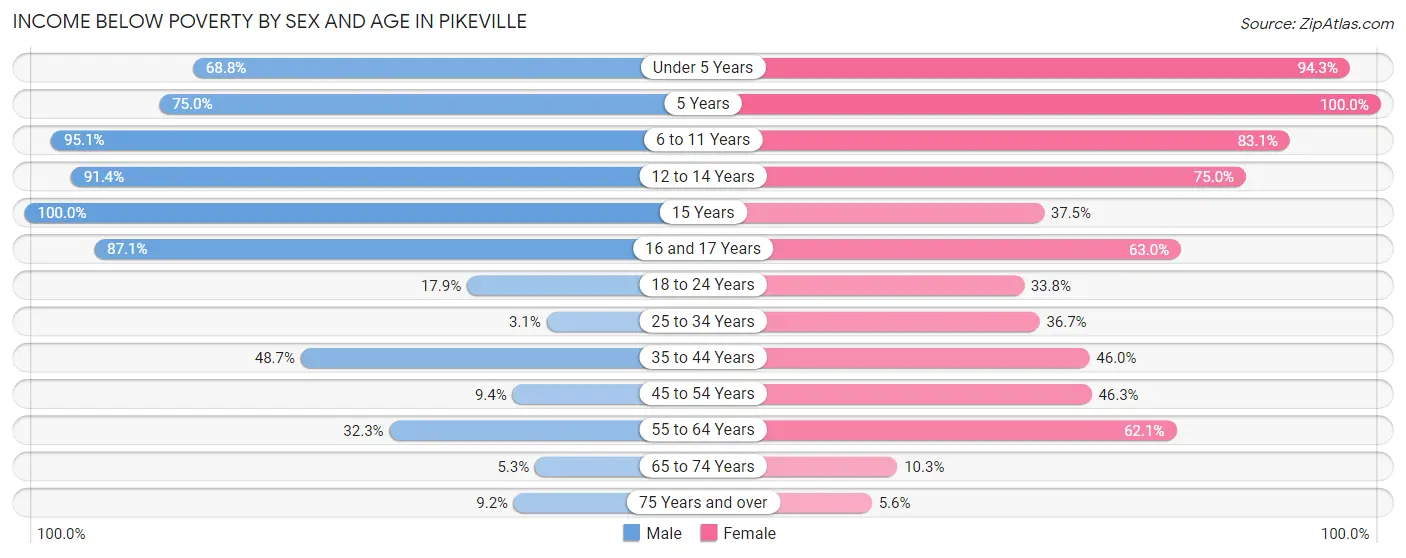
| Age Bracket | Male | Female |
| Under 5 Years | 110 (68.8%) | 66 (94.3%) |
| 5 Years | 9 (75.0%) | 5 (100.0%) |
| 6 to 11 Years | 154 (95.1%) | 69 (83.1%) |
| 12 to 14 Years | 149 (91.4%) | 9 (75.0%) |
| 15 Years | 18 (100.0%) | 3 (37.5%) |
| 16 and 17 Years | 27 (87.1%) | 17 (63.0%) |
| 18 to 24 Years | 17 (17.9%) | 26 (33.8%) |
| 25 to 34 Years | 13 (3.1%) | 51 (36.7%) |
| 35 to 44 Years | 77 (48.7%) | 34 (46.0%) |
| 45 to 54 Years | 5 (9.4%) | 38 (46.3%) |
| 55 to 64 Years | 31 (32.3%) | 72 (62.1%) |
| 65 to 74 Years | 4 (5.3%) | 7 (10.3%) |
| 75 Years and over | 10 (9.2%) | 4 (5.6%) |
| Total | 624 (40.2%) | 401 (48.1%) |
Income Above Poverty by Sex and Age in Pikeville
According to the poverty statistics in Pikeville, males aged 25 to 34 years and females aged 75 years and over are the age groups that are most secure financially, with 96.9% of males and 94.4% of females in these age groups living above the poverty line.
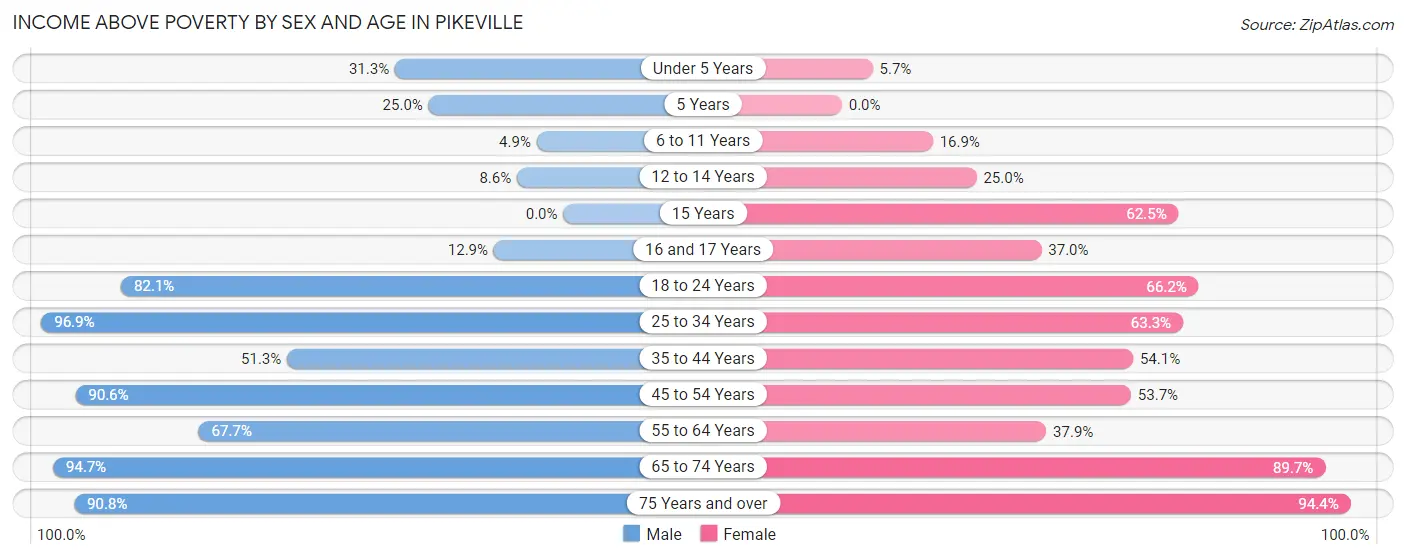
| Age Bracket | Male | Female |
| Under 5 Years | 50 (31.2%) | 4 (5.7%) |
| 5 Years | 3 (25.0%) | 0 (0.0%) |
| 6 to 11 Years | 8 (4.9%) | 14 (16.9%) |
| 12 to 14 Years | 14 (8.6%) | 3 (25.0%) |
| 15 Years | 0 (0.0%) | 5 (62.5%) |
| 16 and 17 Years | 4 (12.9%) | 10 (37.0%) |
| 18 to 24 Years | 78 (82.1%) | 51 (66.2%) |
| 25 to 34 Years | 405 (96.9%) | 88 (63.3%) |
| 35 to 44 Years | 81 (51.3%) | 40 (54.0%) |
| 45 to 54 Years | 48 (90.6%) | 44 (53.7%) |
| 55 to 64 Years | 65 (67.7%) | 44 (37.9%) |
| 65 to 74 Years | 72 (94.7%) | 61 (89.7%) |
| 75 Years and over | 99 (90.8%) | 68 (94.4%) |
| Total | 927 (59.8%) | 432 (51.9%) |
Income Below Poverty Among Married-Couple Families in Pikeville
The poverty statistics for married-couple families in Pikeville show that 27.3% or 56 of the total 205 families live below the poverty line. Families with 5 or more children have the highest poverty rate of 100.0%, comprising of 16 families. On the other hand, families with no children have the lowest poverty rate of 7.1%, which includes 9 families.
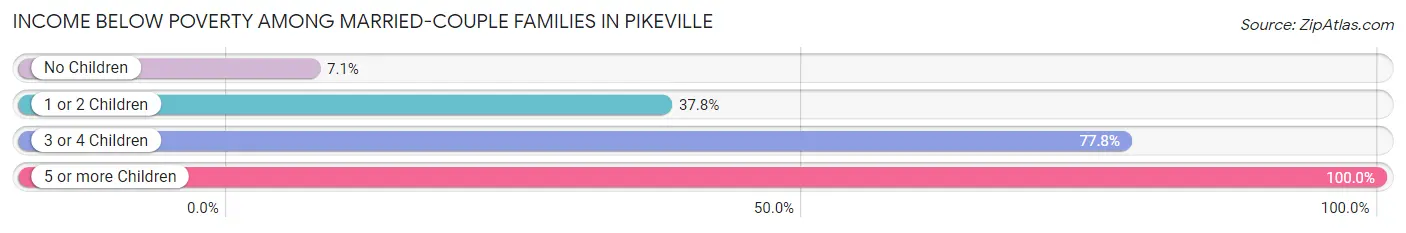
| Children | Above Poverty | Below Poverty |
| No Children | 117 (92.9%) | 9 (7.1%) |
| 1 or 2 Children | 28 (62.2%) | 17 (37.8%) |
| 3 or 4 Children | 4 (22.2%) | 14 (77.8%) |
| 5 or more Children | 0 (0.0%) | 16 (100.0%) |
| Total | 149 (72.7%) | 56 (27.3%) |
Income Below Poverty Among Single-Parent Households in Pikeville
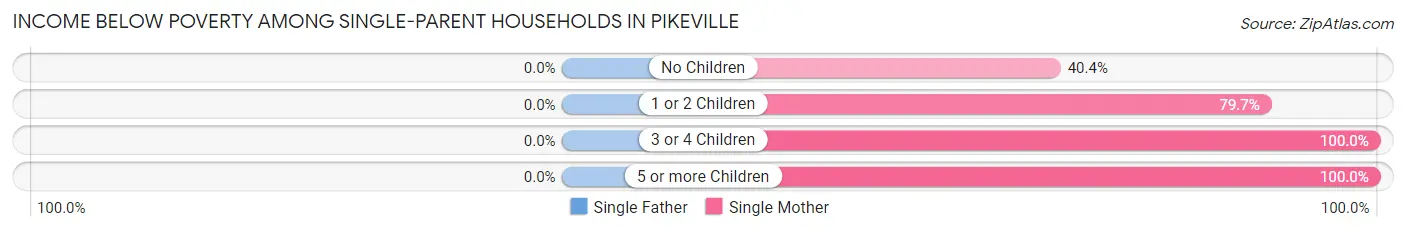
| Children | Single Father | Single Mother |
| No Children | 0 (0.0%) | 19 (40.4%) |
| 1 or 2 Children | 0 (0.0%) | 51 (79.7%) |
| 3 or 4 Children | 0 (0.0%) | 27 (100.0%) |
| 5 or more Children | 0 (0.0%) | 11 (100.0%) |
| Total | 0 (0.0%) | 108 (72.5%) |
Income Below Poverty Among Married-Couple vs Single-Parent Households in Pikeville
The poverty data for Pikeville shows that 56 of the married-couple family households (27.3%) and 108 of the single-parent households (60.0%) are living below the poverty level. Within the married-couple family households, those with 5 or more children have the highest poverty rate, with 16 households (100.0%) falling below the poverty line. Among the single-parent households, those with 5 or more children have the highest poverty rate, with 11 household (100.0%) living below poverty.
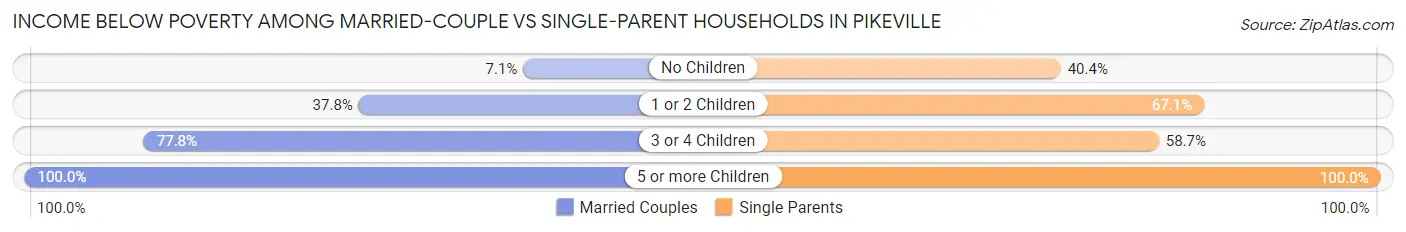
| Children | Married-Couple Families | Single-Parent Households |
| No Children | 9 (7.1%) | 19 (40.4%) |
| 1 or 2 Children | 17 (37.8%) | 51 (67.1%) |
| 3 or 4 Children | 14 (77.8%) | 27 (58.7%) |
| 5 or more Children | 16 (100.0%) | 11 (100.0%) |
| Total | 56 (27.3%) | 108 (60.0%) |
Race in Pikeville
The most populous races in Pikeville are White / Caucasian (1,523 | 59.9%), Black / African American (517 | 20.3%), and Two or more Races (446 | 17.5%).
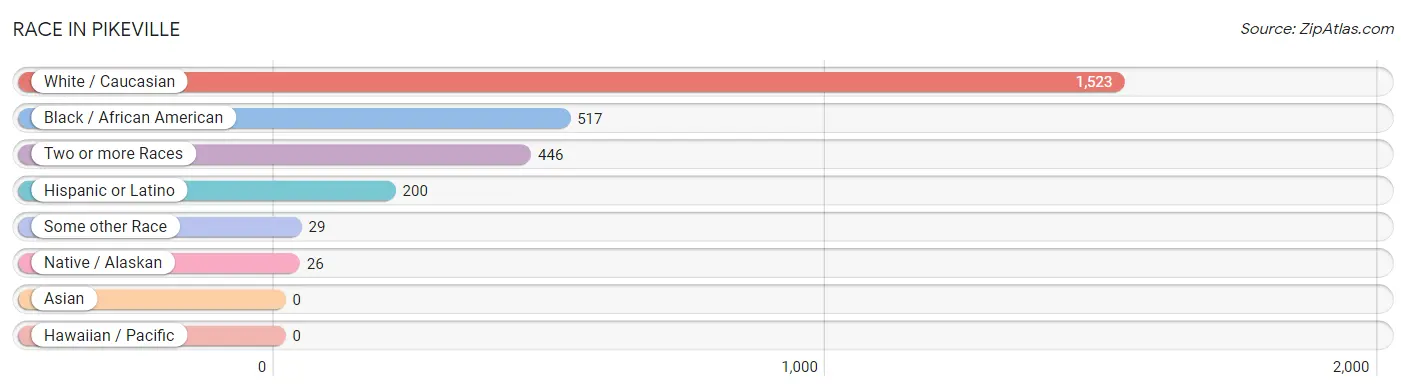
| Race | # Population | % Population |
| Asian | 0 | 0.0% |
| Black / African American | 517 | 20.3% |
| Hawaiian / Pacific | 0 | 0.0% |
| Hispanic or Latino | 200 | 7.9% |
| Native / Alaskan | 26 | 1.0% |
| White / Caucasian | 1,523 | 59.9% |
| Two or more Races | 446 | 17.5% |
| Some other Race | 29 | 1.1% |
| Total | 2,541 | 100.0% |
Ancestry in Pikeville
The most populous ancestries reported in Pikeville are American (293 | 11.5%), Irish (271 | 10.7%), German (159 | 6.3%), Mexican (153 | 6.0%), and English (110 | 4.3%), together accounting for 38.8% of all Pikeville residents.
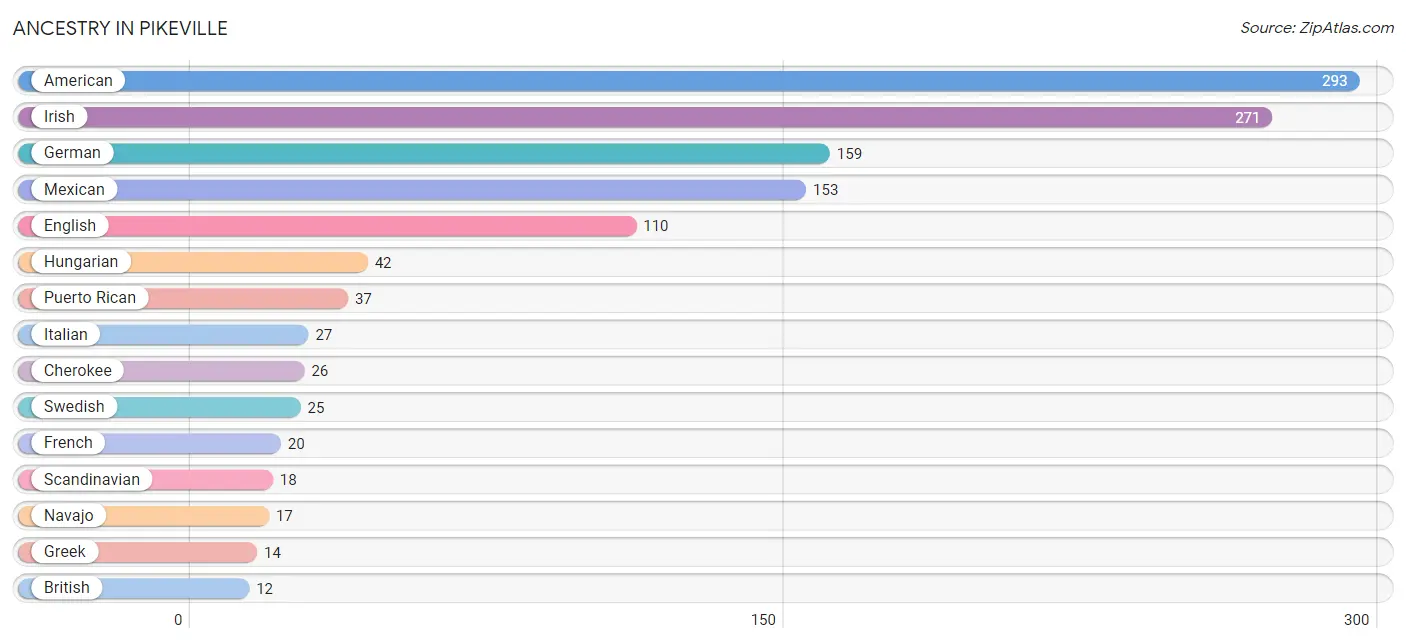
| Ancestry | # Population | % Population |
| African | 6 | 0.2% |
| American | 293 | 11.5% |
| Arab | 1 | 0.0% |
| Brazilian | 5 | 0.2% |
| British | 12 | 0.5% |
| Central American | 10 | 0.4% |
| Cherokee | 26 | 1.0% |
| Choctaw | 8 | 0.3% |
| Dutch | 2 | 0.1% |
| English | 110 | 4.3% |
| European | 3 | 0.1% |
| French | 20 | 0.8% |
| German | 159 | 6.3% |
| Greek | 14 | 0.5% |
| Guatemalan | 10 | 0.4% |
| Hungarian | 42 | 1.7% |
| Irish | 271 | 10.7% |
| Italian | 27 | 1.1% |
| Korean | 7 | 0.3% |
| Mexican | 153 | 6.0% |
| Navajo | 17 | 0.7% |
| Norwegian | 5 | 0.2% |
| Polish | 8 | 0.3% |
| Portuguese | 3 | 0.1% |
| Puerto Rican | 37 | 1.5% |
| Scandinavian | 18 | 0.7% |
| Scotch-Irish | 12 | 0.5% |
| Subsaharan African | 6 | 0.2% |
| Swedish | 25 | 1.0% |
| Trinidadian and Tobagonian | 4 | 0.2% | View All 30 Rows |
Immigrants in Pikeville
The most numerous immigrant groups reported in Pikeville came from Latin America (132 | 5.2%), Central America (127 | 5.0%), Mexico (127 | 5.0%), Asia (18 | 0.7%), and Pakistan (18 | 0.7%), together accounting for 16.6% of all Pikeville residents.
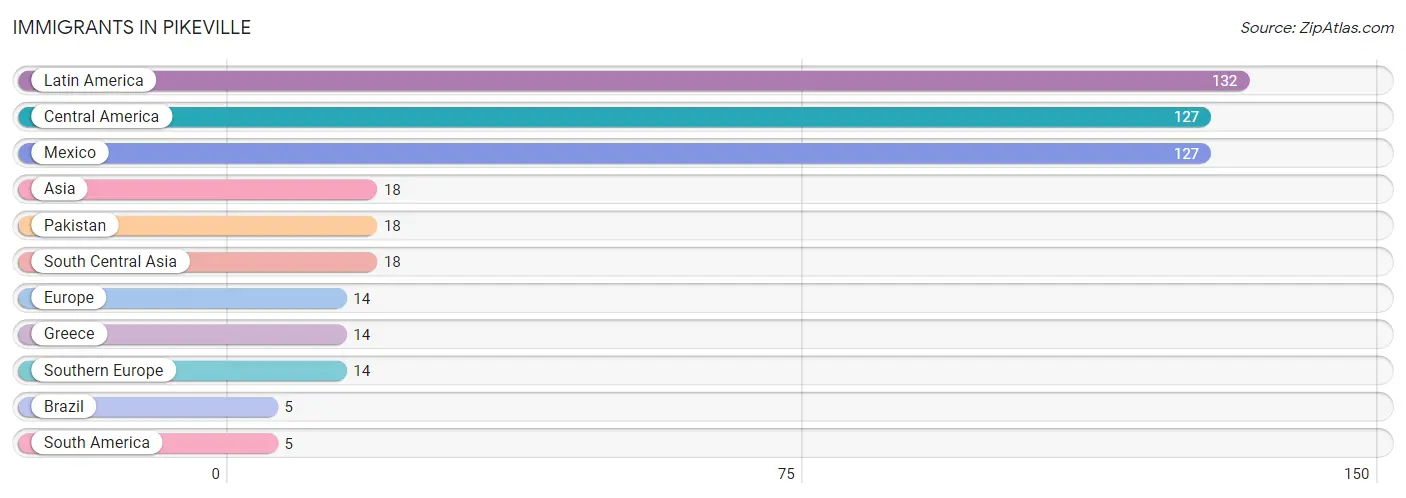
| Immigration Origin | # Population | % Population |
| Asia | 18 | 0.7% |
| Brazil | 5 | 0.2% |
| Central America | 127 | 5.0% |
| Europe | 14 | 0.5% |
| Greece | 14 | 0.5% |
| Latin America | 132 | 5.2% |
| Mexico | 127 | 5.0% |
| Pakistan | 18 | 0.7% |
| South America | 5 | 0.2% |
| South Central Asia | 18 | 0.7% |
| Southern Europe | 14 | 0.5% | View All 11 Rows |
Sex and Age in Pikeville
Sex and Age in Pikeville
The most populous age groups in Pikeville are 25 to 29 Years (342 | 21.0%) for men and 30 to 34 Years (98 | 10.7%) for women.
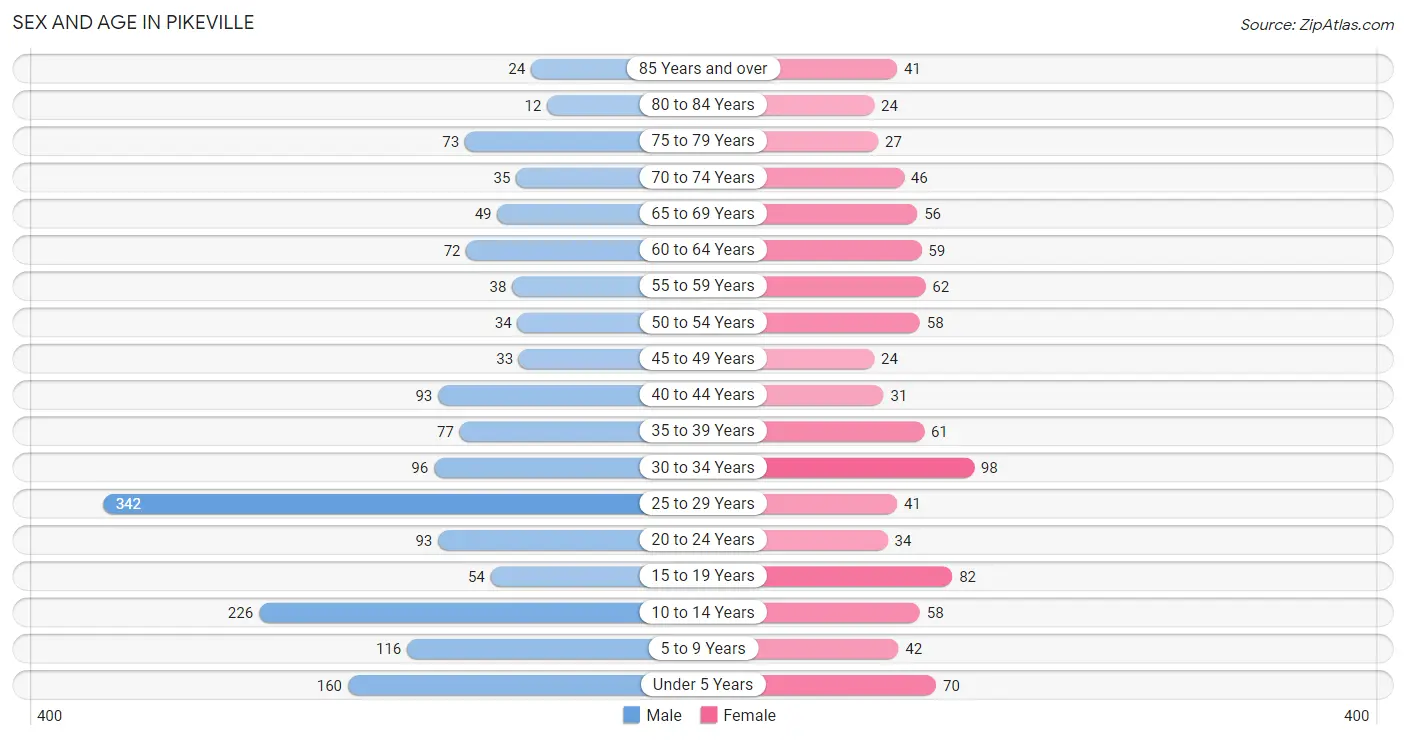
| Age Bracket | Male | Female |
| Under 5 Years | 160 (9.8%) | 70 (7.7%) |
| 5 to 9 Years | 116 (7.1%) | 42 (4.6%) |
| 10 to 14 Years | 226 (13.9%) | 58 (6.4%) |
| 15 to 19 Years | 54 (3.3%) | 82 (9.0%) |
| 20 to 24 Years | 93 (5.7%) | 34 (3.7%) |
| 25 to 29 Years | 342 (21.0%) | 41 (4.5%) |
| 30 to 34 Years | 96 (5.9%) | 98 (10.7%) |
| 35 to 39 Years | 77 (4.7%) | 61 (6.7%) |
| 40 to 44 Years | 93 (5.7%) | 31 (3.4%) |
| 45 to 49 Years | 33 (2.0%) | 24 (2.6%) |
| 50 to 54 Years | 34 (2.1%) | 58 (6.4%) |
| 55 to 59 Years | 38 (2.3%) | 62 (6.8%) |
| 60 to 64 Years | 72 (4.4%) | 59 (6.5%) |
| 65 to 69 Years | 49 (3.0%) | 56 (6.1%) |
| 70 to 74 Years | 35 (2.1%) | 46 (5.0%) |
| 75 to 79 Years | 73 (4.5%) | 27 (2.9%) |
| 80 to 84 Years | 12 (0.7%) | 24 (2.6%) |
| 85 Years and over | 24 (1.5%) | 41 (4.5%) |
| Total | 1,627 (100.0%) | 914 (100.0%) |
Families and Households in Pikeville
Median Family Size in Pikeville
The median family size in Pikeville is 4.53 persons per family, with single female/mother families (149 | 38.7%) accounting for the largest median family size of 6.23 persons per family. On the other hand, married-couple families (205 | 53.2%) represent the smallest median family size with 3.16 persons per family.
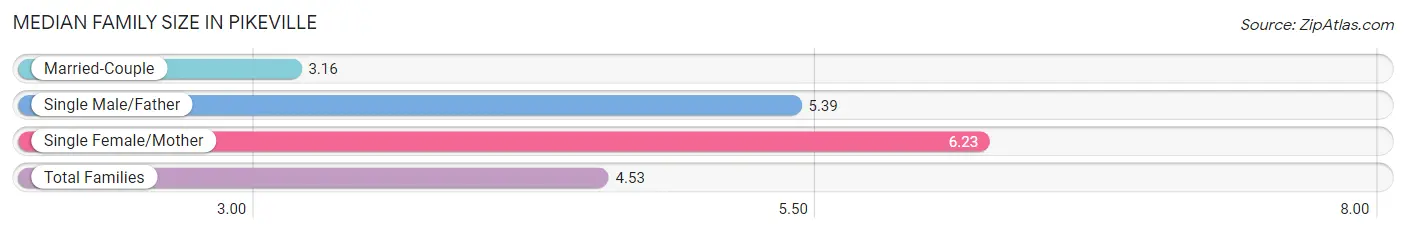
| Family Type | # Families | Family Size |
| Married-Couple | 205 (53.2%) | 3.16 |
| Single Male/Father | 31 (8.1%) | 5.39 |
| Single Female/Mother | 149 (38.7%) | 6.23 |
| Total Families | 385 (100.0%) | 4.53 |
Median Household Size in Pikeville
The median household size in Pikeville is 3.81 persons per household, with single female/mother households (149 | 23.9%) accounting for the largest median household size of 8.59 persons per household. non-family households (238 | 38.2%) represent the smallest median household size with 1.16 persons per household.
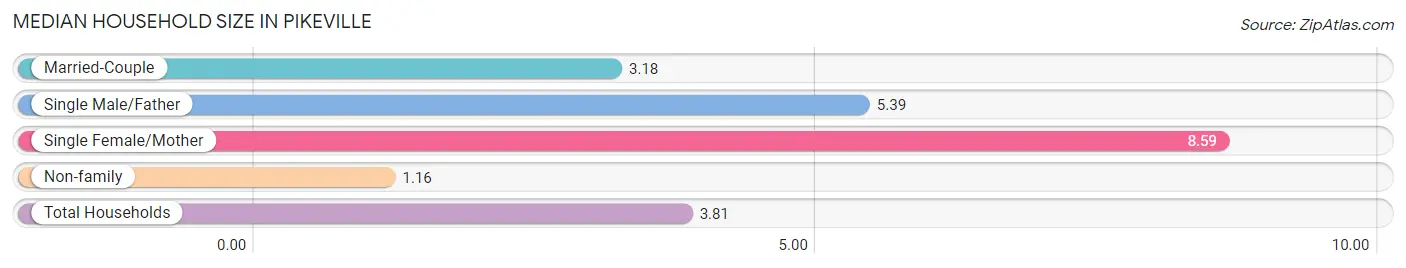
| Household Type | # Households | Household Size |
| Married-Couple | 205 (32.9%) | 3.18 |
| Single Male/Father | 31 (5.0%) | 5.39 |
| Single Female/Mother | 149 (23.9%) | 8.59 |
| Non-family | 238 (38.2%) | 1.16 |
| Total Households | 623 (100.0%) | 3.81 |
Household Size by Marriage Status in Pikeville
Out of a total of 623 households in Pikeville, 385 (61.8%) are family households, while 238 (38.2%) are nonfamily households. The most numerous type of family households are 2-person households, comprising 148, and the most common type of nonfamily households are 1-person households, comprising 213.
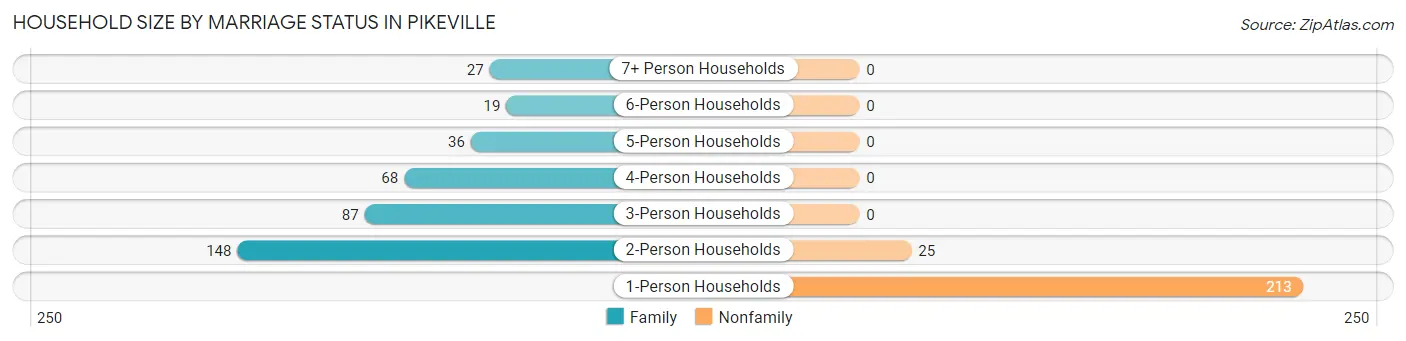
| Household Size | Family Households | Nonfamily Households |
| 1-Person Households | - | 213 (34.2%) |
| 2-Person Households | 148 (23.8%) | 25 (4.0%) |
| 3-Person Households | 87 (14.0%) | 0 (0.0%) |
| 4-Person Households | 68 (10.9%) | 0 (0.0%) |
| 5-Person Households | 36 (5.8%) | 0 (0.0%) |
| 6-Person Households | 19 (3.0%) | 0 (0.0%) |
| 7+ Person Households | 27 (4.3%) | 0 (0.0%) |
| Total | 385 (61.8%) | 238 (38.2%) |
Female Fertility in Pikeville
Fertility by Age in Pikeville
Average fertility rate in Pikeville is 8.0 births per 1,000 women. Women in the age bracket of 15 to 19 years have the highest fertility rate with 12.0 births per 1,000 women. Women in the age bracket of 20 to 34 years acount for 66.7% of all women with births.
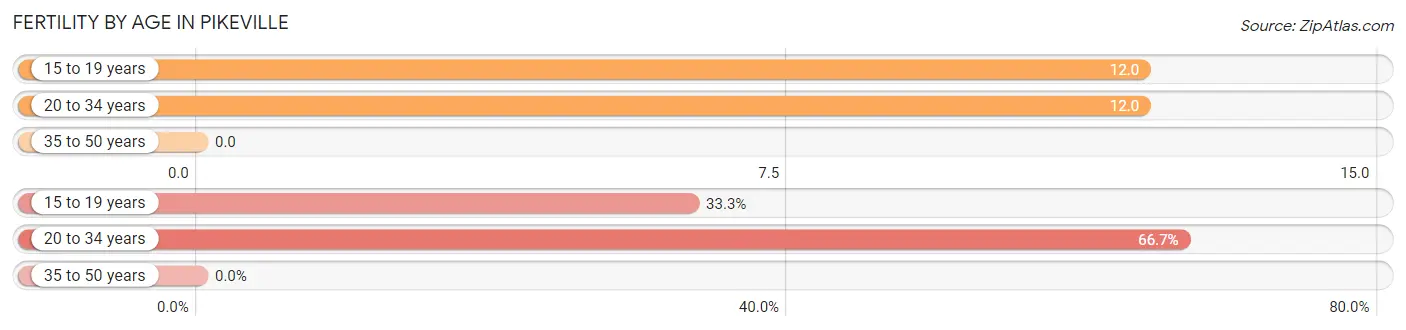
| Age Bracket | Women with Births | Births / 1,000 Women |
| 15 to 19 years | 1 (33.3%) | 12.0 |
| 20 to 34 years | 2 (66.7%) | 12.0 |
| 35 to 50 years | 0 (0.0%) | 0.0 |
| Total | 3 (100.0%) | 8.0 |
Fertility by Age by Marriage Status in Pikeville
66.7% of women with births (3) in Pikeville are married. The highest percentage of unmarried women with births falls into 15 to 19 years age bracket with 100.0% of them unmarried at the time of birth, while the lowest percentage of unmarried women with births belong to 20 to 34 years age bracket with 0.0% of them unmarried.
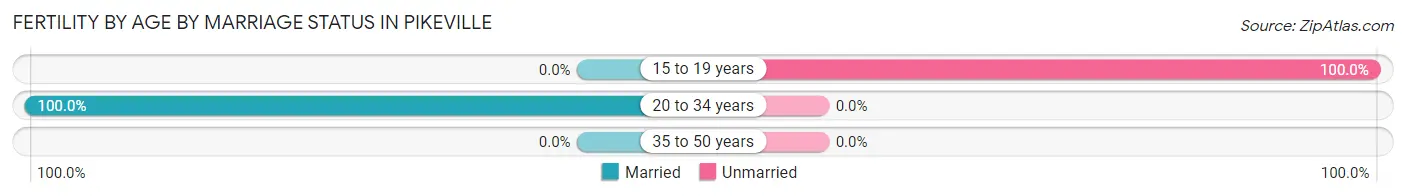
| Age Bracket | Married | Unmarried |
| 15 to 19 years | 0 (0.0%) | 1 (100.0%) |
| 20 to 34 years | 2 (100.0%) | 0 (0.0%) |
| 35 to 50 years | 0 (0.0%) | 0 (0.0%) |
| Total | 2 (66.7%) | 1 (33.3%) |
Fertility by Education in Pikeville
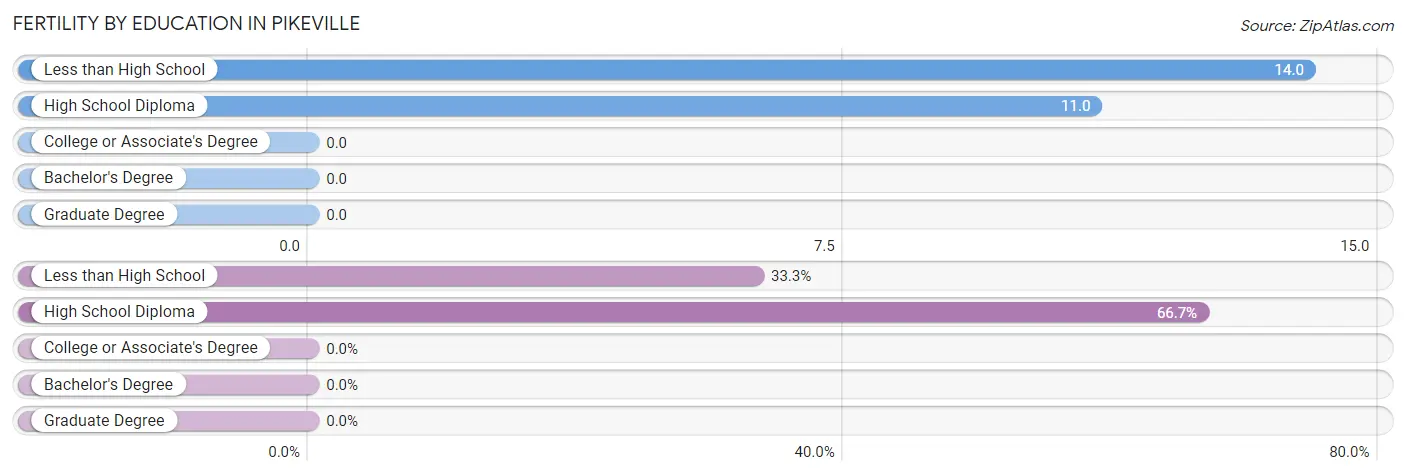
| Educational Attainment | Women with Births | Births / 1,000 Women |
| Less than High School | 1 (33.3%) | 14.0 |
| High School Diploma | 2 (66.7%) | 11.0 |
| College or Associate's Degree | 0 (0.0%) | 0.0 |
| Bachelor's Degree | 0 (0.0%) | 0.0 |
| Graduate Degree | 0 (0.0%) | 0.0 |
| Total | 3 (100.0%) | 8.0 |
Fertility by Education by Marriage Status in Pikeville
33.3% of women with births in Pikeville are unmarried. Women with the educational attainment of high school diploma are most likely to be married with 100.0% of them married at childbirth, while women with the educational attainment of less than high school are least likely to be married with 100.0% of them unmarried at childbirth.
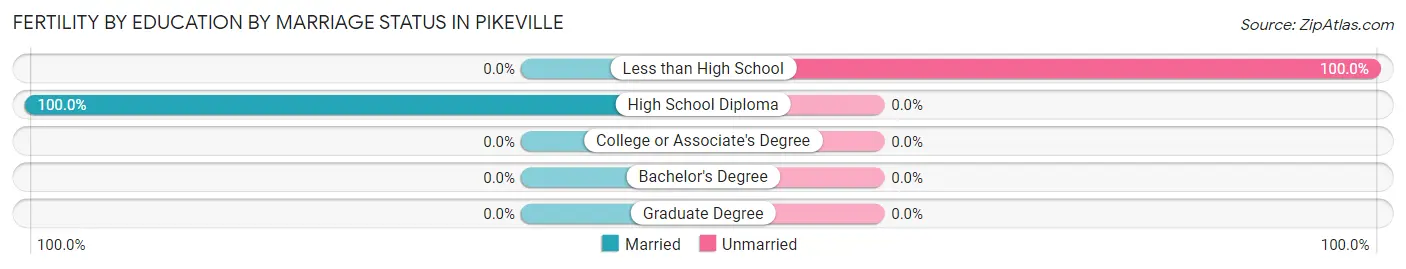
| Educational Attainment | Married | Unmarried |
| Less than High School | 0 (0.0%) | 1 (100.0%) |
| High School Diploma | 2 (100.0%) | 0 (0.0%) |
| College or Associate's Degree | 0 (0.0%) | 0 (0.0%) |
| Bachelor's Degree | 0 (0.0%) | 0 (0.0%) |
| Graduate Degree | 0 (0.0%) | 0 (0.0%) |
| Total | 2 (66.7%) | 1 (33.3%) |
Employment Characteristics in Pikeville
Employment by Class of Employer in Pikeville
Among the 961 employed individuals in Pikeville, private company employees (791 | 82.3%), state government employees (52 | 5.4%), and self-employed (not incorporated) (50 | 5.2%) make up the most common classes of employment.
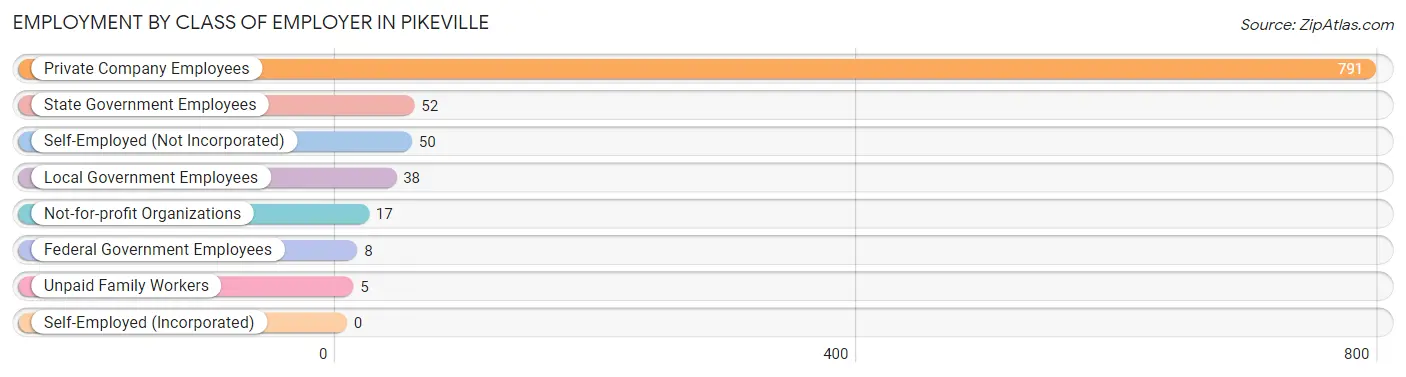
| Employer Class | # Employees | % Employees |
| Private Company Employees | 791 | 82.3% |
| Self-Employed (Incorporated) | 0 | 0.0% |
| Self-Employed (Not Incorporated) | 50 | 5.2% |
| Not-for-profit Organizations | 17 | 1.8% |
| Local Government Employees | 38 | 4.0% |
| State Government Employees | 52 | 5.4% |
| Federal Government Employees | 8 | 0.8% |
| Unpaid Family Workers | 5 | 0.5% |
| Total | 961 | 100.0% |
Employment Status by Age in Pikeville
According to the labor force statistics for Pikeville, out of the total population over 16 years of age (1,843), 55.9% or 1,030 individuals are in the labor force, with 6.7% or 69 of them unemployed. The age group with the highest labor force participation rate is 25 to 29 years, with 95.3% or 365 individuals in the labor force. Within the labor force, the 20 to 24 years age range has the highest percentage of unemployed individuals, with 41.9% or 36 of them being unemployed.
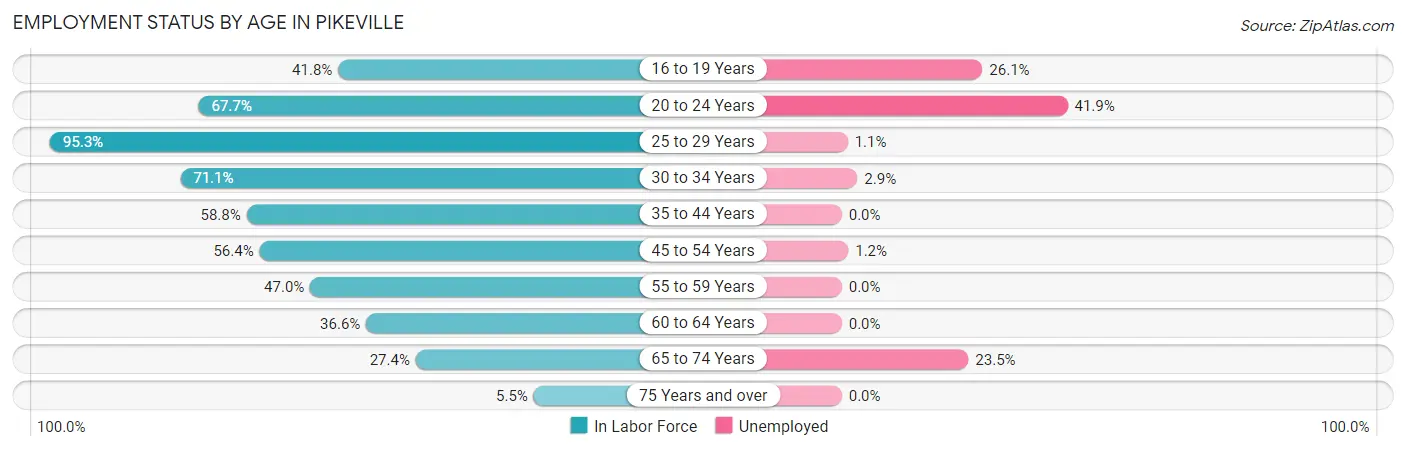
| Age Bracket | In Labor Force | Unemployed |
| 16 to 19 Years | 46 (41.8%) | 12 (26.1%) |
| 20 to 24 Years | 86 (67.7%) | 36 (41.9%) |
| 25 to 29 Years | 365 (95.3%) | 4 (1.1%) |
| 30 to 34 Years | 138 (71.1%) | 4 (2.9%) |
| 35 to 44 Years | 154 (58.8%) | 0 (0.0%) |
| 45 to 54 Years | 84 (56.4%) | 1 (1.2%) |
| 55 to 59 Years | 47 (47.0%) | 0 (0.0%) |
| 60 to 64 Years | 48 (36.6%) | 0 (0.0%) |
| 65 to 74 Years | 51 (27.4%) | 12 (23.5%) |
| 75 Years and over | 11 (5.5%) | 0 (0.0%) |
| Total | 1,030 (55.9%) | 69 (6.7%) |
Employment Status by Educational Attainment in Pikeville
According to labor force statistics for Pikeville, 68.6% of individuals (836) out of the total population between 25 and 64 years of age (1,219) are in the labor force, with 1.1% or 9 of them being unemployed. The group with the highest labor force participation rate are those with the educational attainment of bachelor's degree or higher, with 79.5% or 101 individuals in the labor force. Within the labor force, individuals with less than high school education have the highest percentage of unemployment, with 12.5% or 1 of them being unemployed.
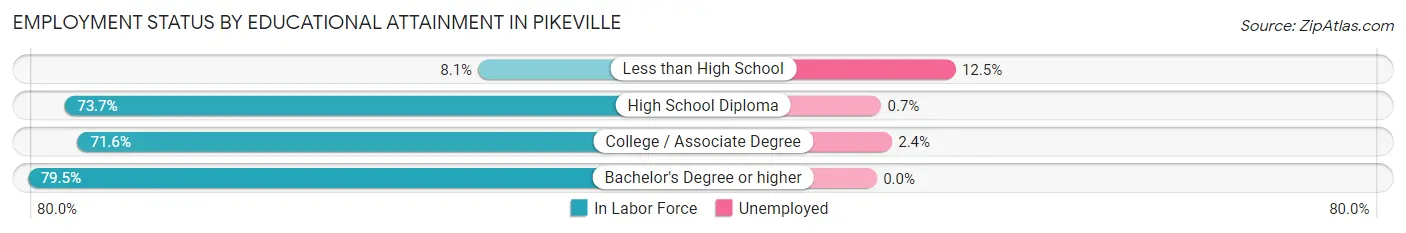
| Educational Attainment | In Labor Force | Unemployed |
| Less than High School | 8 (8.1%) | 12 (12.5%) |
| High School Diploma | 558 (73.7%) | 5 (0.7%) |
| College / Associate Degree | 169 (71.6%) | 6 (2.4%) |
| Bachelor's Degree or higher | 101 (79.5%) | 0 (0.0%) |
| Total | 836 (68.6%) | 13 (1.1%) |
Employment Occupations by Sex in Pikeville
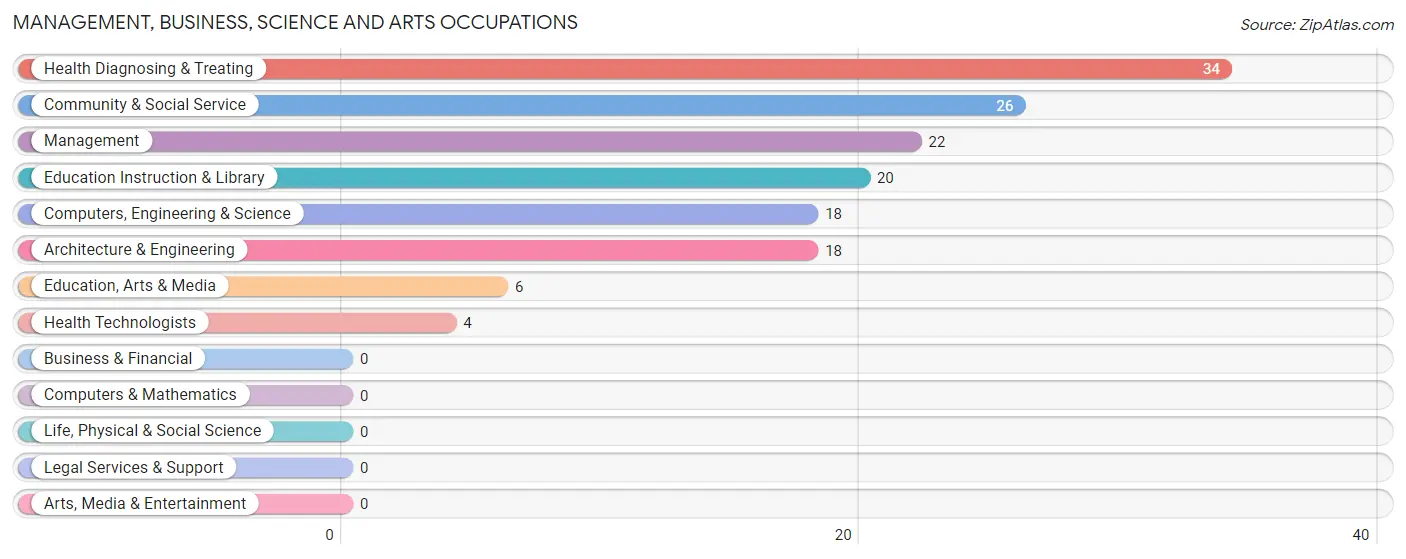
Management, Business, Science and Arts Occupations
The most common Management, Business, Science and Arts occupations in Pikeville are Health Diagnosing & Treating (34 | 3.5%), Community & Social Service (26 | 2.7%), Management (22 | 2.3%), Education Instruction & Library (20 | 2.1%), and Computers, Engineering & Science (18 | 1.9%).
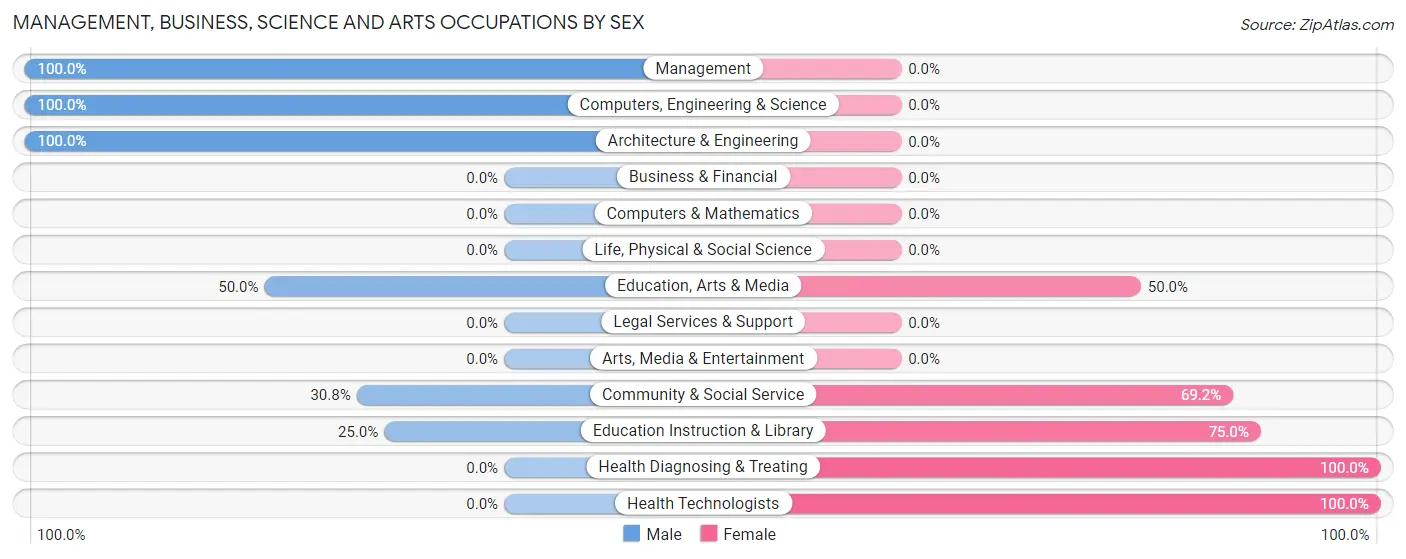
Management, Business, Science and Arts Occupations by Sex
Within the Management, Business, Science and Arts occupations in Pikeville, the most male-oriented occupations are Management (100.0%), Computers, Engineering & Science (100.0%), and Architecture & Engineering (100.0%), while the most female-oriented occupations are Health Diagnosing & Treating (100.0%), Health Technologists (100.0%), and Education Instruction & Library (75.0%).
| Occupation | Male | Female |
| Management | 22 (100.0%) | 0 (0.0%) |
| Business & Financial | 0 (0.0%) | 0 (0.0%) |
| Computers, Engineering & Science | 18 (100.0%) | 0 (0.0%) |
| Computers & Mathematics | 0 (0.0%) | 0 (0.0%) |
| Architecture & Engineering | 18 (100.0%) | 0 (0.0%) |
| Life, Physical & Social Science | 0 (0.0%) | 0 (0.0%) |
| Community & Social Service | 8 (30.8%) | 18 (69.2%) |
| Education, Arts & Media | 3 (50.0%) | 3 (50.0%) |
| Legal Services & Support | 0 (0.0%) | 0 (0.0%) |
| Education Instruction & Library | 5 (25.0%) | 15 (75.0%) |
| Arts, Media & Entertainment | 0 (0.0%) | 0 (0.0%) |
| Health Diagnosing & Treating | 0 (0.0%) | 34 (100.0%) |
| Health Technologists | 0 (0.0%) | 4 (100.0%) |
| Total (Category) | 48 (48.0%) | 52 (52.0%) |
| Total (Overall) | 693 (72.1%) | 268 (27.9%) |
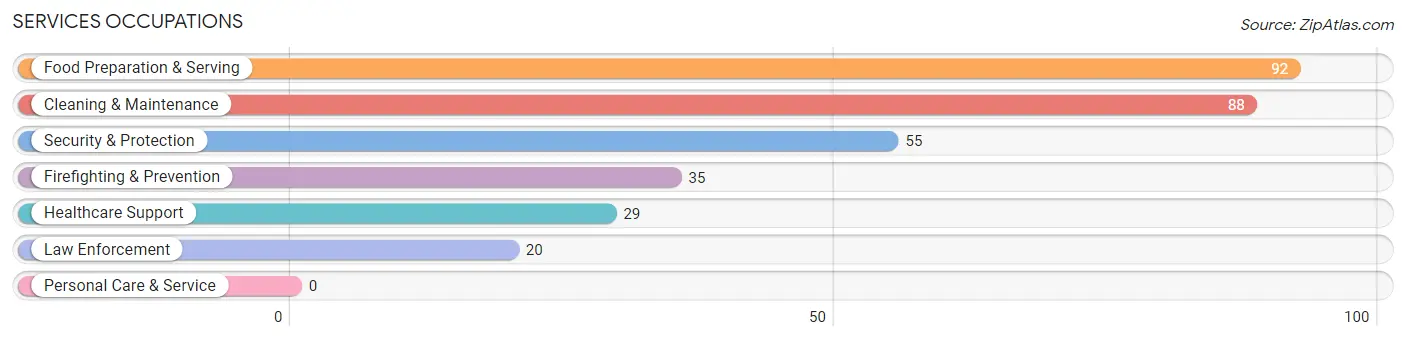
Services Occupations
The most common Services occupations in Pikeville are Food Preparation & Serving (92 | 9.6%), Cleaning & Maintenance (88 | 9.2%), Security & Protection (55 | 5.7%), Firefighting & Prevention (35 | 3.6%), and Healthcare Support (29 | 3.0%).
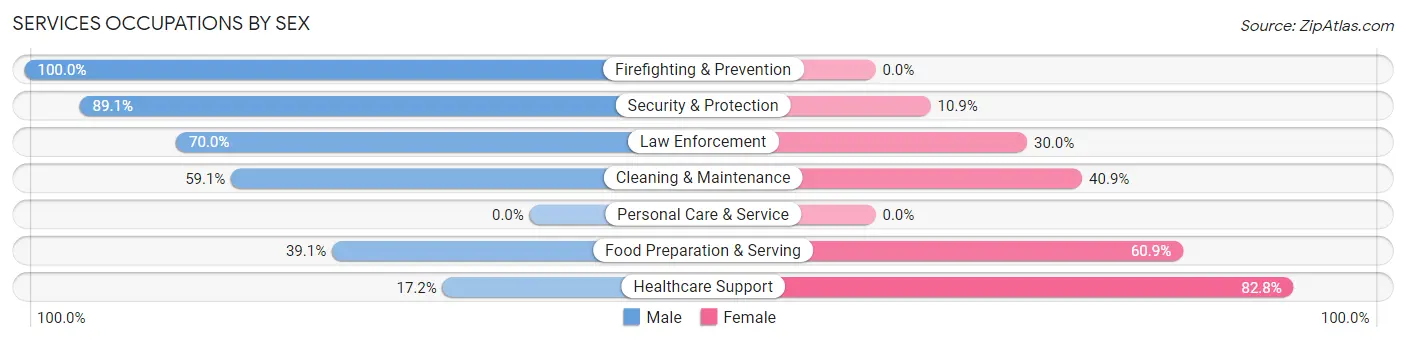
Services Occupations by Sex
Within the Services occupations in Pikeville, the most male-oriented occupations are Firefighting & Prevention (100.0%), Security & Protection (89.1%), and Law Enforcement (70.0%), while the most female-oriented occupations are Healthcare Support (82.8%), Food Preparation & Serving (60.9%), and Cleaning & Maintenance (40.9%).
| Occupation | Male | Female |
| Healthcare Support | 5 (17.2%) | 24 (82.8%) |
| Security & Protection | 49 (89.1%) | 6 (10.9%) |
| Firefighting & Prevention | 35 (100.0%) | 0 (0.0%) |
| Law Enforcement | 14 (70.0%) | 6 (30.0%) |
| Food Preparation & Serving | 36 (39.1%) | 56 (60.9%) |
| Cleaning & Maintenance | 52 (59.1%) | 36 (40.9%) |
| Personal Care & Service | 0 (0.0%) | 0 (0.0%) |
| Total (Category) | 142 (53.8%) | 122 (46.2%) |
| Total (Overall) | 693 (72.1%) | 268 (27.9%) |
Sales and Office Occupations
The most common Sales and Office occupations in Pikeville are Office & Administration (22 | 2.3%), and Sales & Related (18 | 1.9%).

Sales and Office Occupations by Sex

| Occupation | Male | Female |
| Sales & Related | 15 (83.3%) | 3 (16.7%) |
| Office & Administration | 7 (31.8%) | 15 (68.2%) |
| Total (Category) | 22 (55.0%) | 18 (45.0%) |
| Total (Overall) | 693 (72.1%) | 268 (27.9%) |
Natural Resources, Construction and Maintenance Occupations
The most common Natural Resources, Construction and Maintenance occupations in Pikeville are Farming, Fishing & Forestry (402 | 41.8%), Construction & Extraction (41 | 4.3%), and Installation, Maintenance & Repair (3 | 0.3%).

Natural Resources, Construction and Maintenance Occupations by Sex

| Occupation | Male | Female |
| Farming, Fishing & Forestry | 362 (90.0%) | 40 (10.0%) |
| Construction & Extraction | 41 (100.0%) | 0 (0.0%) |
| Installation, Maintenance & Repair | 1 (33.3%) | 2 (66.7%) |
| Total (Category) | 404 (90.6%) | 42 (9.4%) |
| Total (Overall) | 693 (72.1%) | 268 (27.9%) |
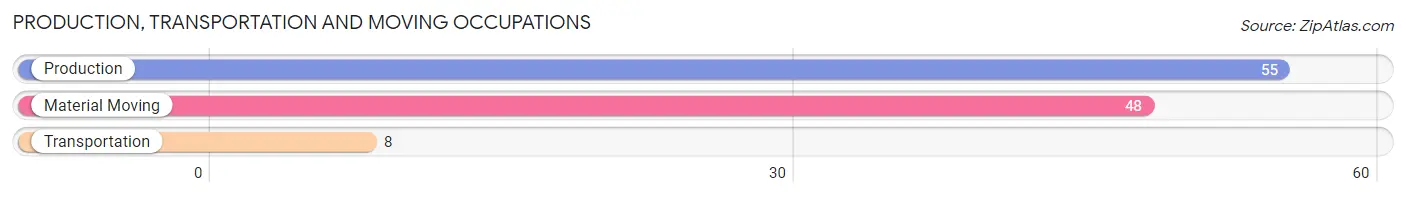
Production, Transportation and Moving Occupations
The most common Production, Transportation and Moving occupations in Pikeville are Production (55 | 5.7%), Material Moving (48 | 5.0%), and Transportation (8 | 0.8%).
Production, Transportation and Moving Occupations by Sex
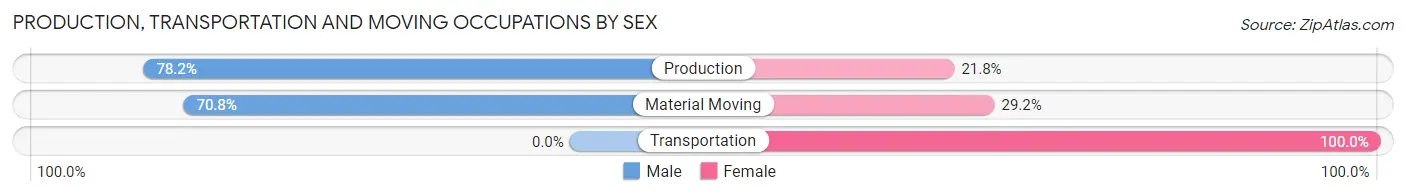
| Occupation | Male | Female |
| Production | 43 (78.2%) | 12 (21.8%) |
| Transportation | 0 (0.0%) | 8 (100.0%) |
| Material Moving | 34 (70.8%) | 14 (29.2%) |
| Total (Category) | 77 (69.4%) | 34 (30.6%) |
| Total (Overall) | 693 (72.1%) | 268 (27.9%) |
Employment Industries by Sex in Pikeville
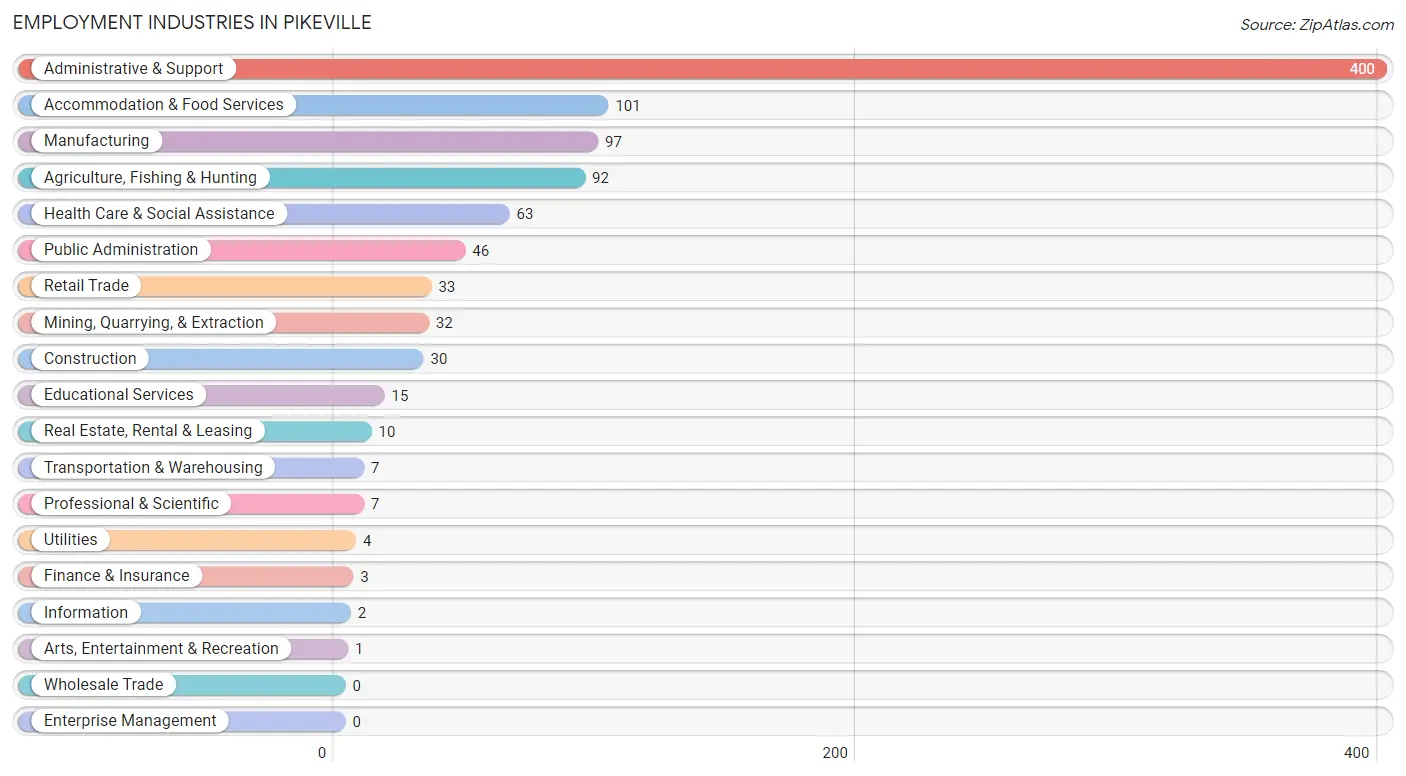
Employment Industries in Pikeville
The major employment industries in Pikeville include Administrative & Support (400 | 41.6%), Accommodation & Food Services (101 | 10.5%), Manufacturing (97 | 10.1%), Agriculture, Fishing & Hunting (92 | 9.6%), and Health Care & Social Assistance (63 | 6.6%).
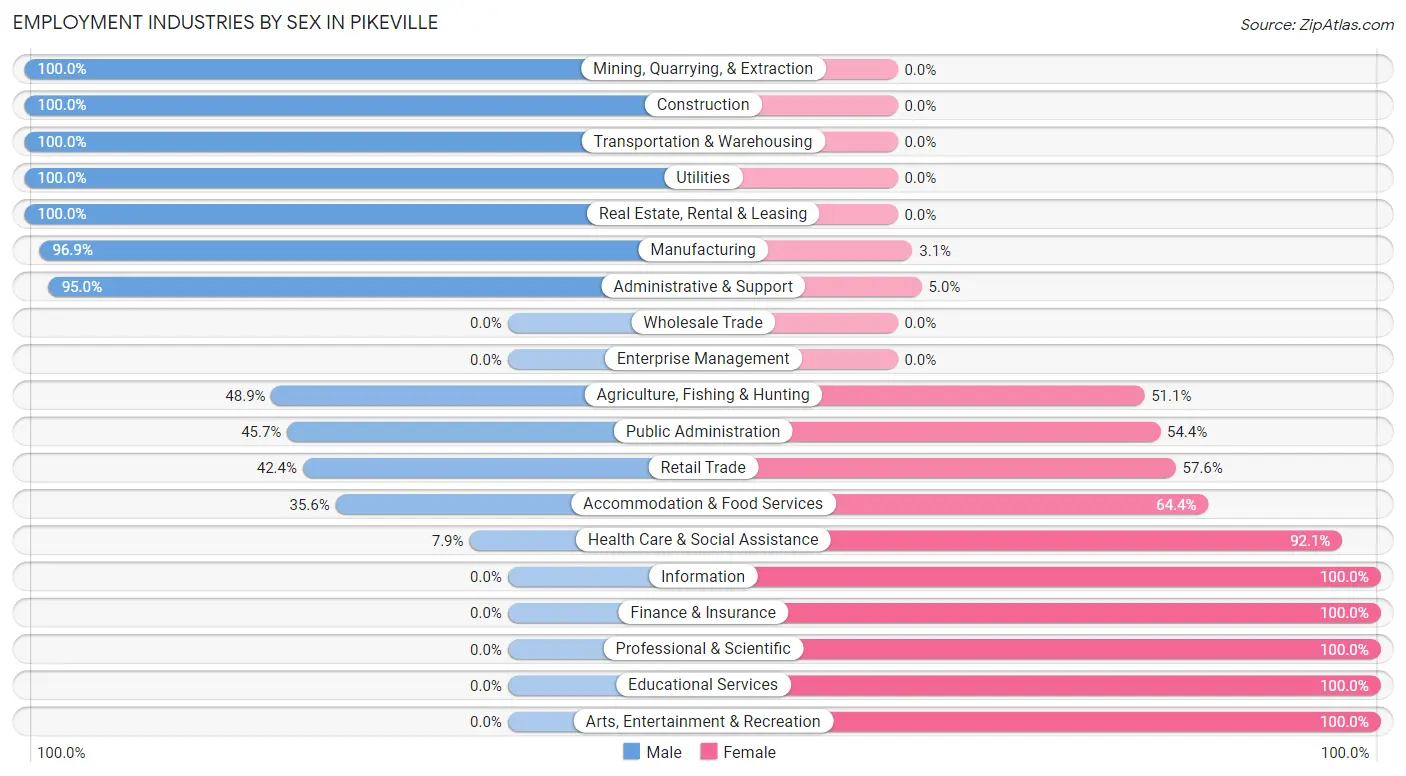
Employment Industries by Sex in Pikeville
The Pikeville industries that see more men than women are Mining, Quarrying, & Extraction (100.0%), Construction (100.0%), and Transportation & Warehousing (100.0%), whereas the industries that tend to have a higher number of women are Information (100.0%), Finance & Insurance (100.0%), and Professional & Scientific (100.0%).
| Industry | Male | Female |
| Agriculture, Fishing & Hunting | 45 (48.9%) | 47 (51.1%) |
| Mining, Quarrying, & Extraction | 32 (100.0%) | 0 (0.0%) |
| Construction | 30 (100.0%) | 0 (0.0%) |
| Manufacturing | 94 (96.9%) | 3 (3.1%) |
| Wholesale Trade | 0 (0.0%) | 0 (0.0%) |
| Retail Trade | 14 (42.4%) | 19 (57.6%) |
| Transportation & Warehousing | 7 (100.0%) | 0 (0.0%) |
| Utilities | 4 (100.0%) | 0 (0.0%) |
| Information | 0 (0.0%) | 2 (100.0%) |
| Finance & Insurance | 0 (0.0%) | 3 (100.0%) |
| Real Estate, Rental & Leasing | 10 (100.0%) | 0 (0.0%) |
| Professional & Scientific | 0 (0.0%) | 7 (100.0%) |
| Enterprise Management | 0 (0.0%) | 0 (0.0%) |
| Administrative & Support | 380 (95.0%) | 20 (5.0%) |
| Educational Services | 0 (0.0%) | 15 (100.0%) |
| Health Care & Social Assistance | 5 (7.9%) | 58 (92.1%) |
| Arts, Entertainment & Recreation | 0 (0.0%) | 1 (100.0%) |
| Accommodation & Food Services | 36 (35.6%) | 65 (64.4%) |
| Public Administration | 21 (45.7%) | 25 (54.3%) |
| Total | 693 (72.1%) | 268 (27.9%) |
Education in Pikeville
School Enrollment in Pikeville
The most common levels of schooling among the 577 students in Pikeville are middle school (252 | 43.7%), high school (114 | 19.8%), and elementary school (106 | 18.4%).
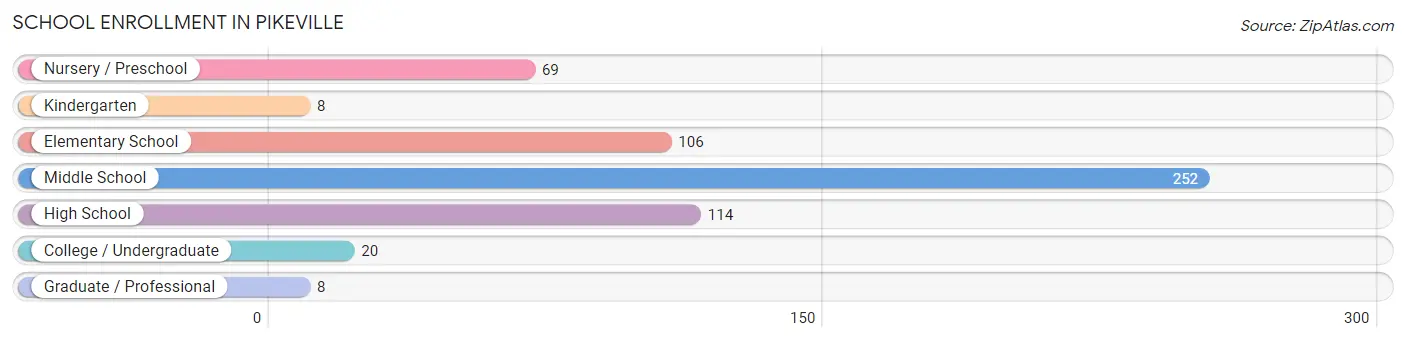
| School Level | # Students | % Students |
| Nursery / Preschool | 69 | 12.0% |
| Kindergarten | 8 | 1.4% |
| Elementary School | 106 | 18.4% |
| Middle School | 252 | 43.7% |
| High School | 114 | 19.8% |
| College / Undergraduate | 20 | 3.5% |
| Graduate / Professional | 8 | 1.4% |
| Total | 577 | 100.0% |
School Enrollment by Age by Funding Source in Pikeville
Out of a total of 577 students who are enrolled in schools in Pikeville, 25 (4.3%) attend a private institution, while the remaining 552 (95.7%) are enrolled in public schools. The age group of 20 to 24 year olds has the highest likelihood of being enrolled in private schools, with 10 (66.7% in the age bracket) enrolled. Conversely, the age group of 3 to 4 year olds has the lowest likelihood of being enrolled in a private school, with 69 (100.0% in the age bracket) attending a public institution.
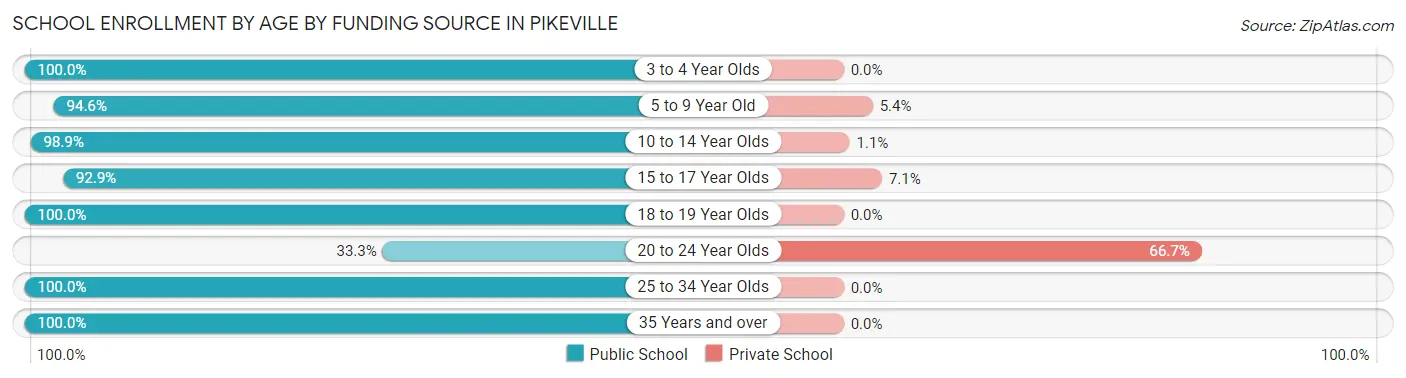
| Age Bracket | Public School | Private School |
| 3 to 4 Year Olds | 69 (100.0%) | 0 (0.0%) |
| 5 to 9 Year Old | 105 (94.6%) | 6 (5.4%) |
| 10 to 14 Year Olds | 270 (98.9%) | 3 (1.1%) |
| 15 to 17 Year Olds | 78 (92.9%) | 6 (7.1%) |
| 18 to 19 Year Olds | 2 (100.0%) | 0 (0.0%) |
| 20 to 24 Year Olds | 5 (33.3%) | 10 (66.7%) |
| 25 to 34 Year Olds | 15 (100.0%) | 0 (0.0%) |
| 35 Years and over | 8 (100.0%) | 0 (0.0%) |
| Total | 552 (95.7%) | 25 (4.3%) |
Educational Attainment by Field of Study in Pikeville
Education (41 | 23.3%), psychology (35 | 19.9%), science & technology (30 | 17.1%), business (29 | 16.5%), and social sciences (26 | 14.8%) are the most common fields of study among 176 individuals in Pikeville who have obtained a bachelor's degree or higher.
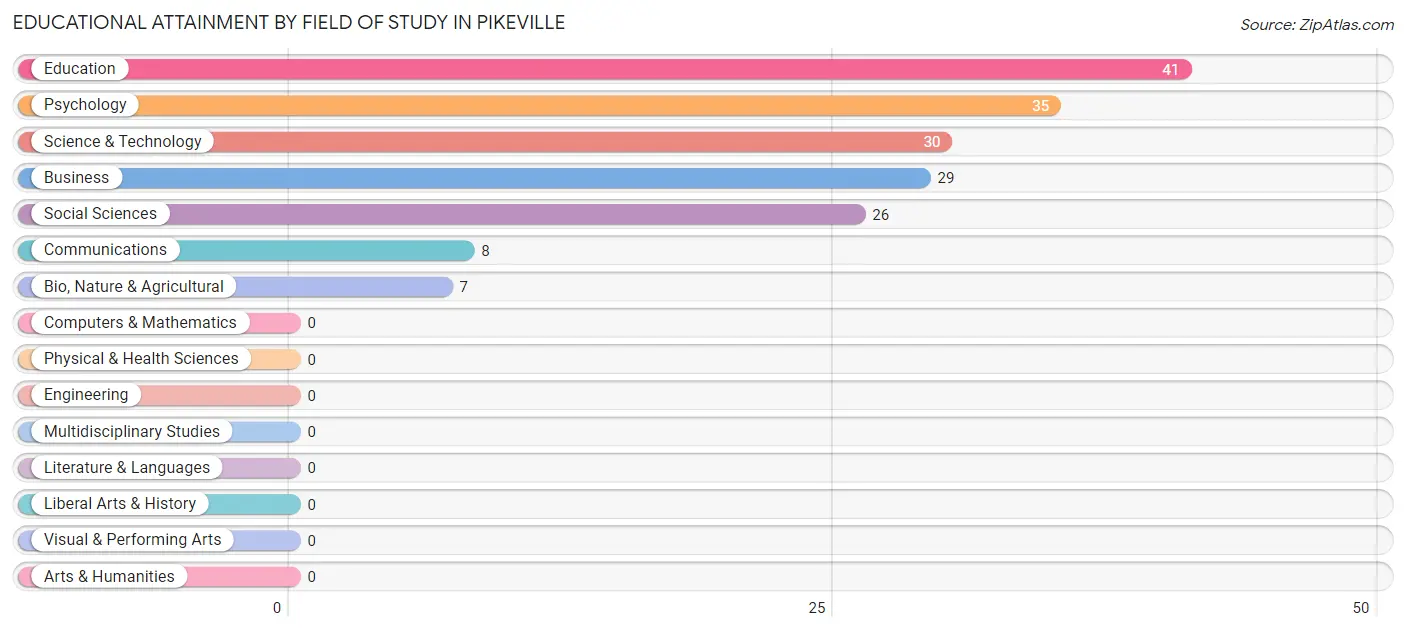
| Field of Study | # Graduates | % Graduates |
| Computers & Mathematics | 0 | 0.0% |
| Bio, Nature & Agricultural | 7 | 4.0% |
| Physical & Health Sciences | 0 | 0.0% |
| Psychology | 35 | 19.9% |
| Social Sciences | 26 | 14.8% |
| Engineering | 0 | 0.0% |
| Multidisciplinary Studies | 0 | 0.0% |
| Science & Technology | 30 | 17.1% |
| Business | 29 | 16.5% |
| Education | 41 | 23.3% |
| Literature & Languages | 0 | 0.0% |
| Liberal Arts & History | 0 | 0.0% |
| Visual & Performing Arts | 0 | 0.0% |
| Communications | 8 | 4.5% |
| Arts & Humanities | 0 | 0.0% |
| Total | 176 | 100.0% |
Transportation & Commute in Pikeville
Vehicle Availability by Sex in Pikeville
The most prevalent vehicle ownership categories in Pikeville are males with 2 vehicles (450, accounting for 65.1%) and females with 2 vehicles (46, making up 167.9%).
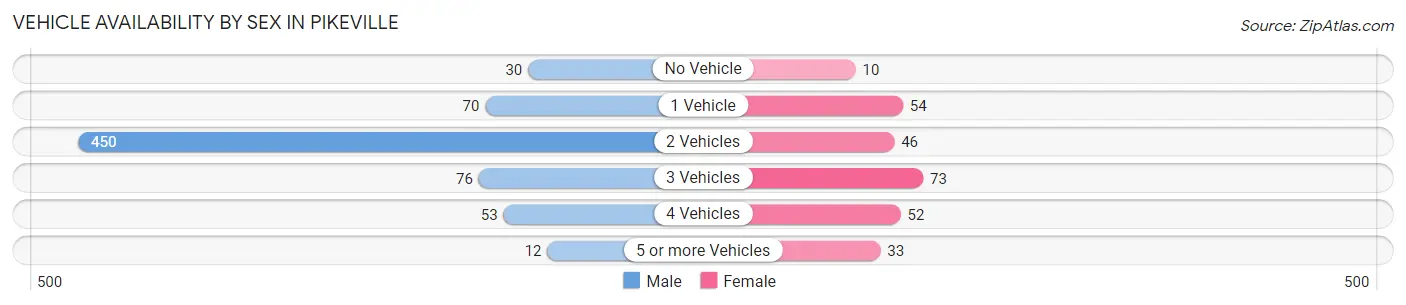
| Vehicles Available | Male | Female |
| No Vehicle | 30 (4.3%) | 10 (3.7%) |
| 1 Vehicle | 70 (10.1%) | 54 (20.2%) |
| 2 Vehicles | 450 (65.1%) | 46 (17.2%) |
| 3 Vehicles | 76 (11.0%) | 73 (27.2%) |
| 4 Vehicles | 53 (7.7%) | 52 (19.4%) |
| 5 or more Vehicles | 12 (1.7%) | 33 (12.3%) |
| Total | 691 (100.0%) | 268 (100.0%) |
Commute Time in Pikeville
The most frequently occuring commute durations in Pikeville are 15 to 19 minutes (348 commuters, 36.4%), 5 to 9 minutes (166 commuters, 17.3%), and 30 to 34 minutes (151 commuters, 15.8%).
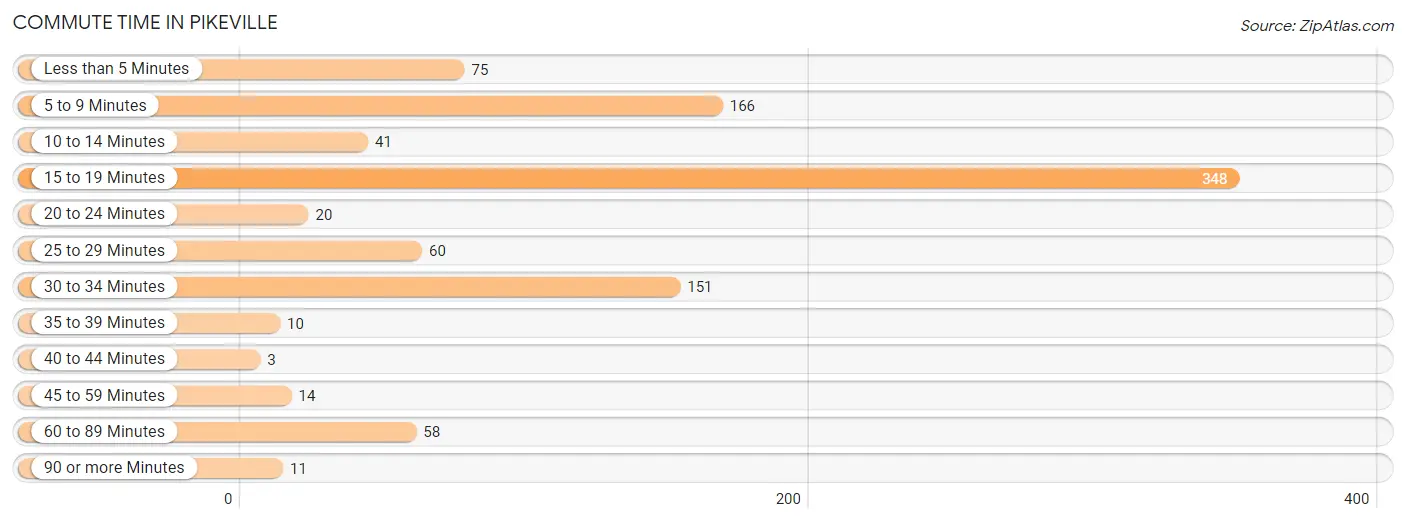
| Commute Time | # Commuters | % Commuters |
| Less than 5 Minutes | 75 | 7.8% |
| 5 to 9 Minutes | 166 | 17.3% |
| 10 to 14 Minutes | 41 | 4.3% |
| 15 to 19 Minutes | 348 | 36.4% |
| 20 to 24 Minutes | 20 | 2.1% |
| 25 to 29 Minutes | 60 | 6.3% |
| 30 to 34 Minutes | 151 | 15.8% |
| 35 to 39 Minutes | 10 | 1.0% |
| 40 to 44 Minutes | 3 | 0.3% |
| 45 to 59 Minutes | 14 | 1.5% |
| 60 to 89 Minutes | 58 | 6.1% |
| 90 or more Minutes | 11 | 1.1% |
Commute Time by Sex in Pikeville
The most common commute times in Pikeville are 15 to 19 minutes (345 commuters, 49.8%) for males and 5 to 9 minutes (96 commuters, 36.4%) for females.
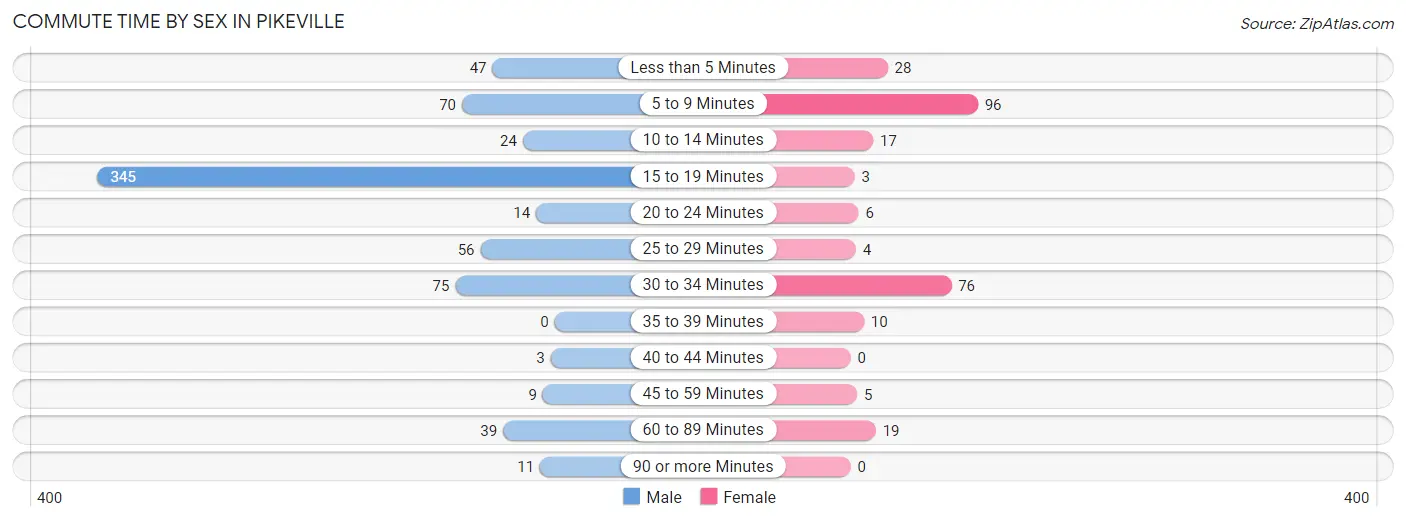
| Commute Time | Male | Female |
| Less than 5 Minutes | 47 (6.8%) | 28 (10.6%) |
| 5 to 9 Minutes | 70 (10.1%) | 96 (36.4%) |
| 10 to 14 Minutes | 24 (3.5%) | 17 (6.4%) |
| 15 to 19 Minutes | 345 (49.8%) | 3 (1.1%) |
| 20 to 24 Minutes | 14 (2.0%) | 6 (2.3%) |
| 25 to 29 Minutes | 56 (8.1%) | 4 (1.5%) |
| 30 to 34 Minutes | 75 (10.8%) | 76 (28.8%) |
| 35 to 39 Minutes | 0 (0.0%) | 10 (3.8%) |
| 40 to 44 Minutes | 3 (0.4%) | 0 (0.0%) |
| 45 to 59 Minutes | 9 (1.3%) | 5 (1.9%) |
| 60 to 89 Minutes | 39 (5.6%) | 19 (7.2%) |
| 90 or more Minutes | 11 (1.6%) | 0 (0.0%) |
Time of Departure to Work by Sex in Pikeville
The most frequent times of departure to work in Pikeville are 4:00 PM to 11:59 PM (420, 60.6%) for males and 6:00 AM to 6:29 AM (50, 18.9%) for females.
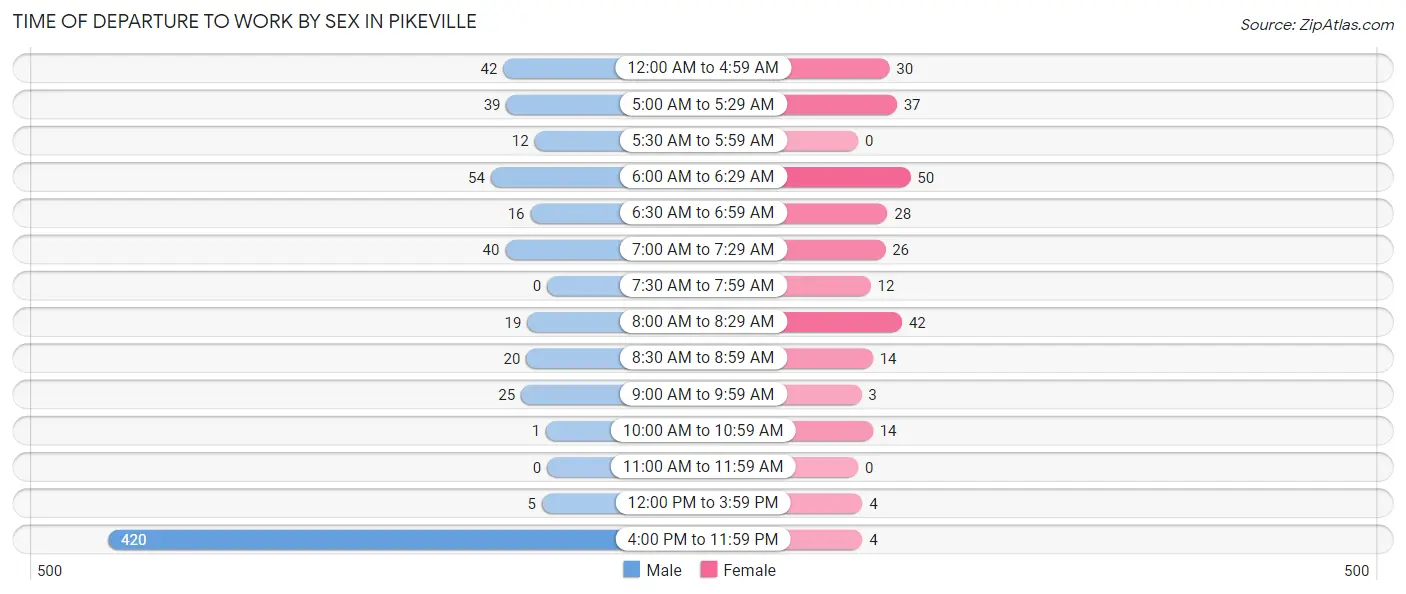
| Time of Departure | Male | Female |
| 12:00 AM to 4:59 AM | 42 (6.1%) | 30 (11.4%) |
| 5:00 AM to 5:29 AM | 39 (5.6%) | 37 (14.0%) |
| 5:30 AM to 5:59 AM | 12 (1.7%) | 0 (0.0%) |
| 6:00 AM to 6:29 AM | 54 (7.8%) | 50 (18.9%) |
| 6:30 AM to 6:59 AM | 16 (2.3%) | 28 (10.6%) |
| 7:00 AM to 7:29 AM | 40 (5.8%) | 26 (9.9%) |
| 7:30 AM to 7:59 AM | 0 (0.0%) | 12 (4.5%) |
| 8:00 AM to 8:29 AM | 19 (2.7%) | 42 (15.9%) |
| 8:30 AM to 8:59 AM | 20 (2.9%) | 14 (5.3%) |
| 9:00 AM to 9:59 AM | 25 (3.6%) | 3 (1.1%) |
| 10:00 AM to 10:59 AM | 1 (0.1%) | 14 (5.3%) |
| 11:00 AM to 11:59 AM | 0 (0.0%) | 0 (0.0%) |
| 12:00 PM to 3:59 PM | 5 (0.7%) | 4 (1.5%) |
| 4:00 PM to 11:59 PM | 420 (60.6%) | 4 (1.5%) |
| Total | 693 (100.0%) | 264 (100.0%) |
Housing Occupancy in Pikeville
Occupancy by Ownership in Pikeville
Of the total 623 dwellings in Pikeville, owner-occupied units account for 269 (43.2%), while renter-occupied units make up 354 (56.8%).
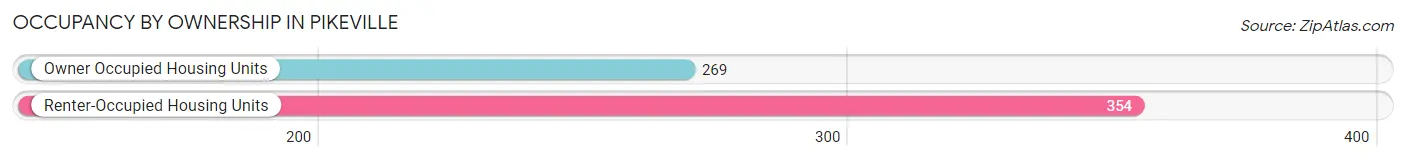
| Occupancy | # Housing Units | % Housing Units |
| Owner Occupied Housing Units | 269 | 43.2% |
| Renter-Occupied Housing Units | 354 | 56.8% |
| Total Occupied Housing Units | 623 | 100.0% |
Occupancy by Household Size in Pikeville
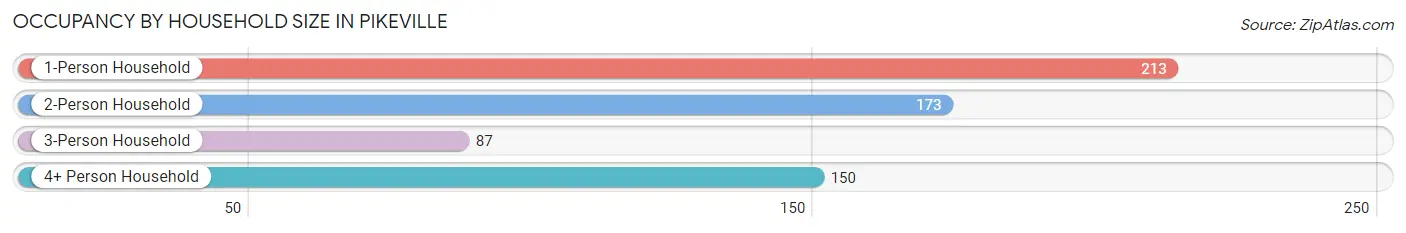
| Household Size | # Housing Units | % Housing Units |
| 1-Person Household | 213 | 34.2% |
| 2-Person Household | 173 | 27.8% |
| 3-Person Household | 87 | 14.0% |
| 4+ Person Household | 150 | 24.1% |
| Total Housing Units | 623 | 100.0% |
Occupancy by Ownership by Household Size in Pikeville
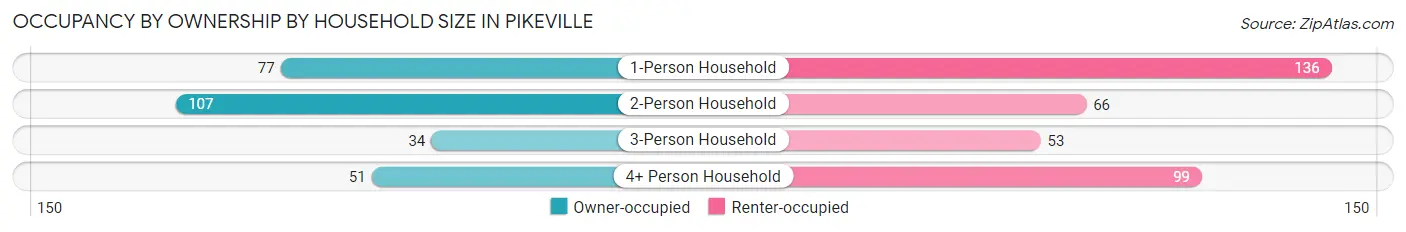
| Household Size | Owner-occupied | Renter-occupied |
| 1-Person Household | 77 (36.1%) | 136 (63.8%) |
| 2-Person Household | 107 (61.9%) | 66 (38.2%) |
| 3-Person Household | 34 (39.1%) | 53 (60.9%) |
| 4+ Person Household | 51 (34.0%) | 99 (66.0%) |
| Total Housing Units | 269 (43.2%) | 354 (56.8%) |
Occupancy by Educational Attainment in Pikeville
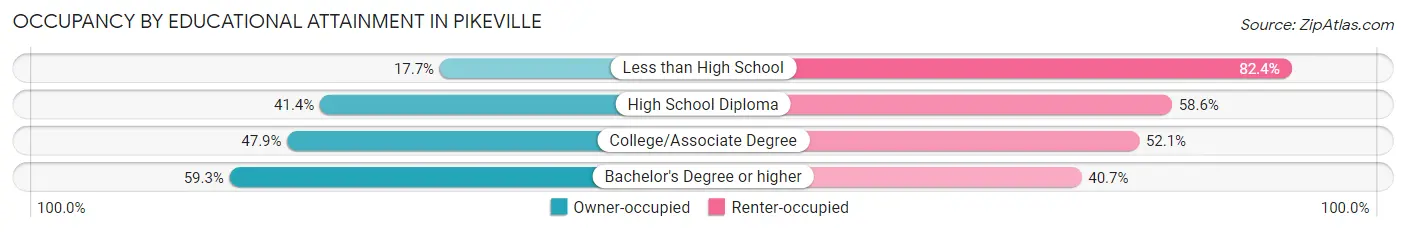
| Household Size | Owner-occupied | Renter-occupied |
| Less than High School | 12 (17.6%) | 56 (82.4%) |
| High School Diploma | 123 (41.4%) | 174 (58.6%) |
| College/Associate Degree | 80 (47.9%) | 87 (52.1%) |
| Bachelor's Degree or higher | 54 (59.3%) | 37 (40.7%) |
Occupancy by Age of Householder in Pikeville
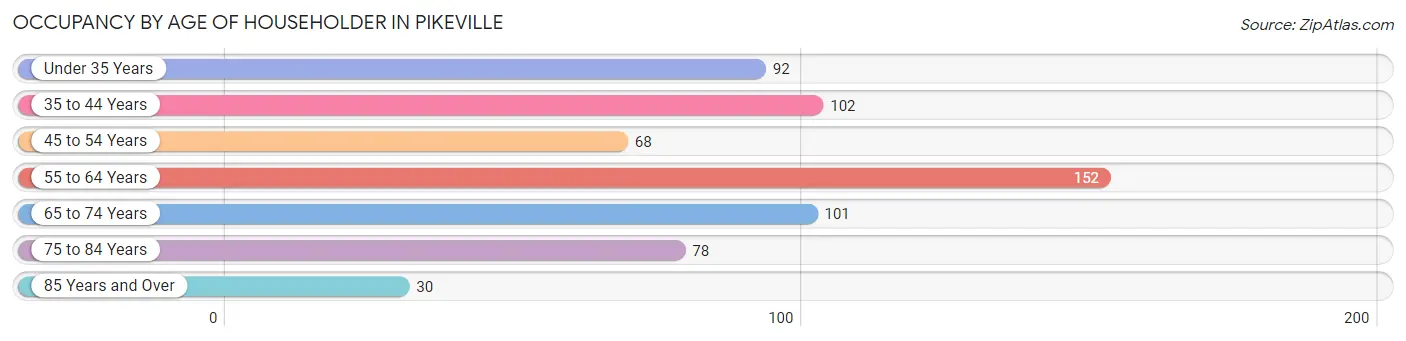
| Age Bracket | # Households | % Households |
| Under 35 Years | 92 | 14.8% |
| 35 to 44 Years | 102 | 16.4% |
| 45 to 54 Years | 68 | 10.9% |
| 55 to 64 Years | 152 | 24.4% |
| 65 to 74 Years | 101 | 16.2% |
| 75 to 84 Years | 78 | 12.5% |
| 85 Years and Over | 30 | 4.8% |
| Total | 623 | 100.0% |
Housing Finances in Pikeville
Median Income by Occupancy in Pikeville
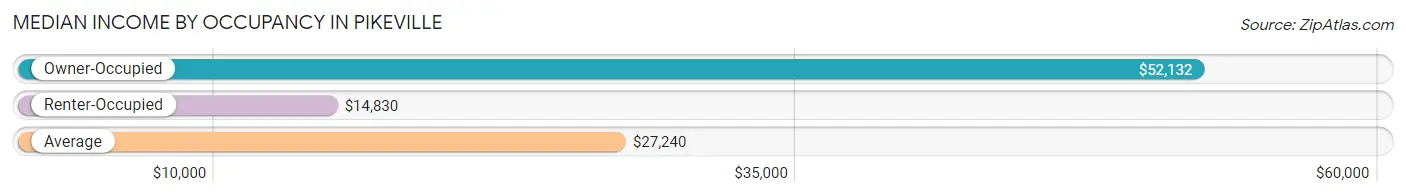
| Occupancy Type | # Households | Median Income |
| Owner-Occupied | 269 (43.2%) | $52,132 |
| Renter-Occupied | 354 (56.8%) | $14,830 |
| Average | 623 (100.0%) | $27,240 |
Occupancy by Householder Income Bracket in Pikeville
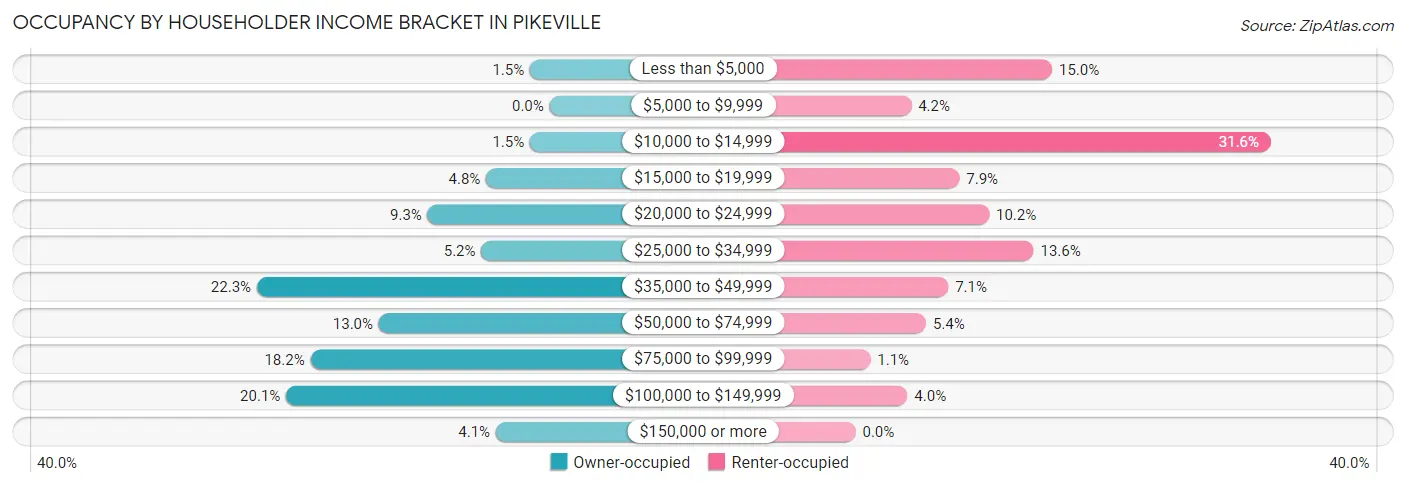
| Income Bracket | Owner-occupied | Renter-occupied |
| Less than $5,000 | 4 (1.5%) | 53 (15.0%) |
| $5,000 to $9,999 | 0 (0.0%) | 15 (4.2%) |
| $10,000 to $14,999 | 4 (1.5%) | 112 (31.6%) |
| $15,000 to $19,999 | 13 (4.8%) | 28 (7.9%) |
| $20,000 to $24,999 | 25 (9.3%) | 36 (10.2%) |
| $25,000 to $34,999 | 14 (5.2%) | 48 (13.6%) |
| $35,000 to $49,999 | 60 (22.3%) | 25 (7.1%) |
| $50,000 to $74,999 | 35 (13.0%) | 19 (5.4%) |
| $75,000 to $99,999 | 49 (18.2%) | 4 (1.1%) |
| $100,000 to $149,999 | 54 (20.1%) | 14 (4.0%) |
| $150,000 or more | 11 (4.1%) | 0 (0.0%) |
| Total | 269 (100.0%) | 354 (100.0%) |
Monthly Housing Cost Tiers in Pikeville
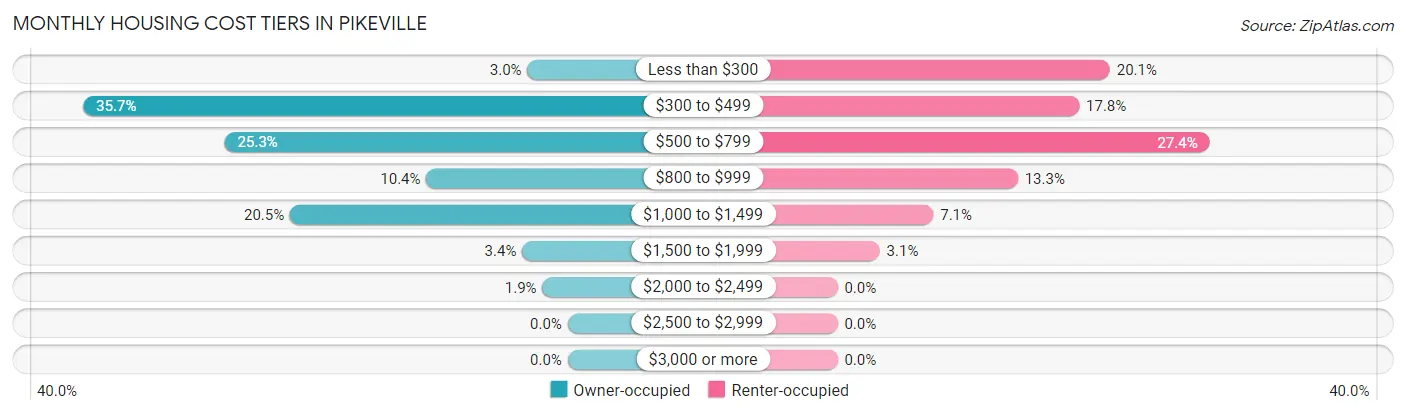
| Monthly Cost | Owner-occupied | Renter-occupied |
| Less than $300 | 8 (3.0%) | 71 (20.1%) |
| $300 to $499 | 96 (35.7%) | 63 (17.8%) |
| $500 to $799 | 68 (25.3%) | 97 (27.4%) |
| $800 to $999 | 28 (10.4%) | 47 (13.3%) |
| $1,000 to $1,499 | 55 (20.4%) | 25 (7.1%) |
| $1,500 to $1,999 | 9 (3.4%) | 11 (3.1%) |
| $2,000 to $2,499 | 5 (1.9%) | 0 (0.0%) |
| $2,500 to $2,999 | 0 (0.0%) | 0 (0.0%) |
| $3,000 or more | 0 (0.0%) | 0 (0.0%) |
| Total | 269 (100.0%) | 354 (100.0%) |
Physical Housing Characteristics in Pikeville
Housing Structures in Pikeville
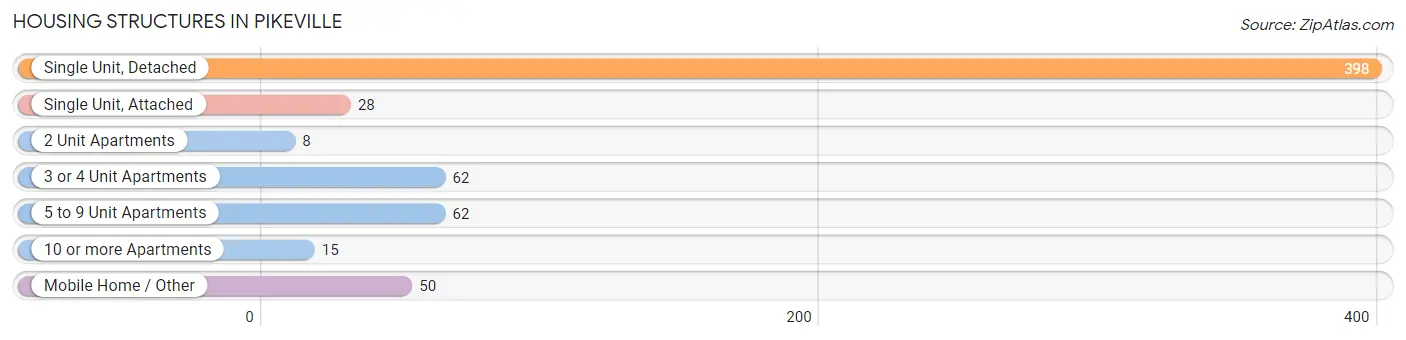
| Structure Type | # Housing Units | % Housing Units |
| Single Unit, Detached | 398 | 63.9% |
| Single Unit, Attached | 28 | 4.5% |
| 2 Unit Apartments | 8 | 1.3% |
| 3 or 4 Unit Apartments | 62 | 10.0% |
| 5 to 9 Unit Apartments | 62 | 10.0% |
| 10 or more Apartments | 15 | 2.4% |
| Mobile Home / Other | 50 | 8.0% |
| Total | 623 | 100.0% |
Housing Structures by Occupancy in Pikeville
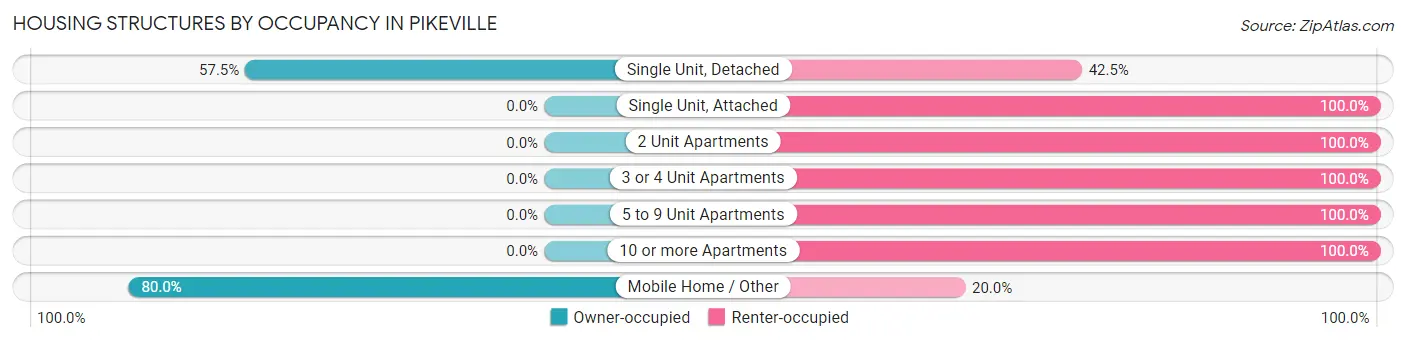
| Structure Type | Owner-occupied | Renter-occupied |
| Single Unit, Detached | 229 (57.5%) | 169 (42.5%) |
| Single Unit, Attached | 0 (0.0%) | 28 (100.0%) |
| 2 Unit Apartments | 0 (0.0%) | 8 (100.0%) |
| 3 or 4 Unit Apartments | 0 (0.0%) | 62 (100.0%) |
| 5 to 9 Unit Apartments | 0 (0.0%) | 62 (100.0%) |
| 10 or more Apartments | 0 (0.0%) | 15 (100.0%) |
| Mobile Home / Other | 40 (80.0%) | 10 (20.0%) |
| Total | 269 (43.2%) | 354 (56.8%) |
Housing Structures by Number of Rooms in Pikeville
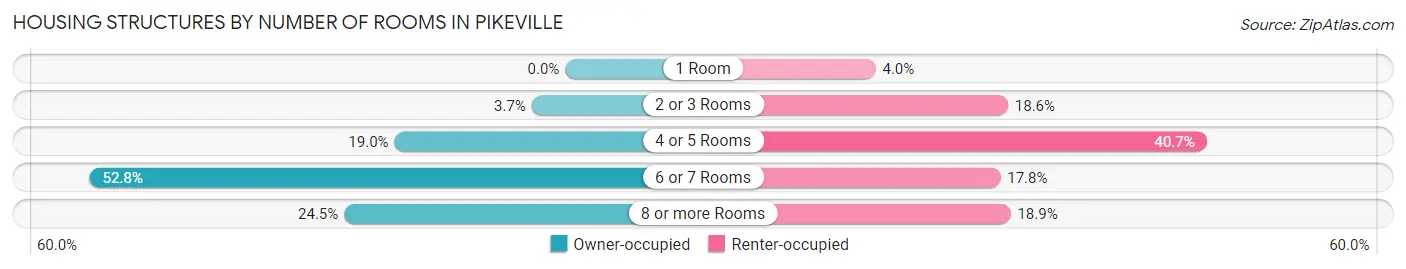
| Number of Rooms | Owner-occupied | Renter-occupied |
| 1 Room | 0 (0.0%) | 14 (4.0%) |
| 2 or 3 Rooms | 10 (3.7%) | 66 (18.6%) |
| 4 or 5 Rooms | 51 (19.0%) | 144 (40.7%) |
| 6 or 7 Rooms | 142 (52.8%) | 63 (17.8%) |
| 8 or more Rooms | 66 (24.5%) | 67 (18.9%) |
| Total | 269 (100.0%) | 354 (100.0%) |
Housing Structure by Heating Type in Pikeville
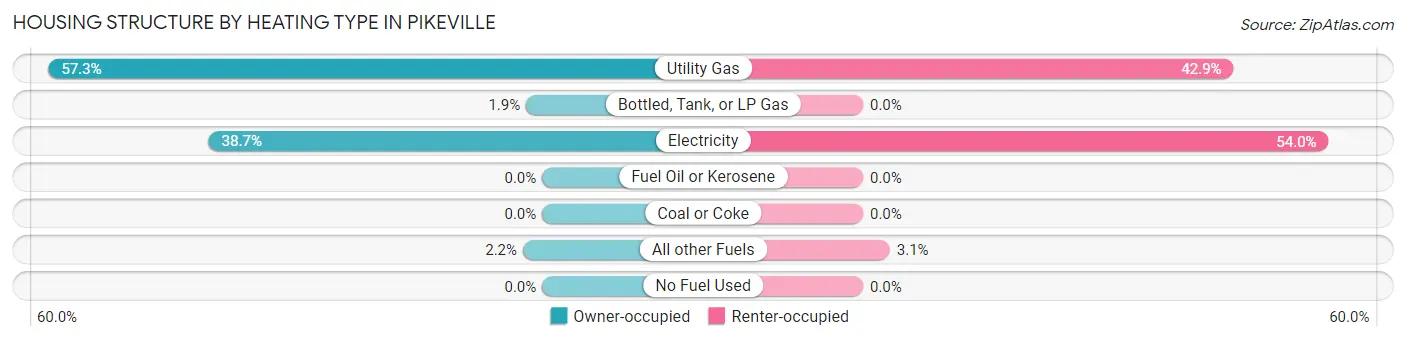
| Heating Type | Owner-occupied | Renter-occupied |
| Utility Gas | 154 (57.3%) | 152 (42.9%) |
| Bottled, Tank, or LP Gas | 5 (1.9%) | 0 (0.0%) |
| Electricity | 104 (38.7%) | 191 (53.9%) |
| Fuel Oil or Kerosene | 0 (0.0%) | 0 (0.0%) |
| Coal or Coke | 0 (0.0%) | 0 (0.0%) |
| All other Fuels | 6 (2.2%) | 11 (3.1%) |
| No Fuel Used | 0 (0.0%) | 0 (0.0%) |
| Total | 269 (100.0%) | 354 (100.0%) |
Household Vehicle Usage in Pikeville
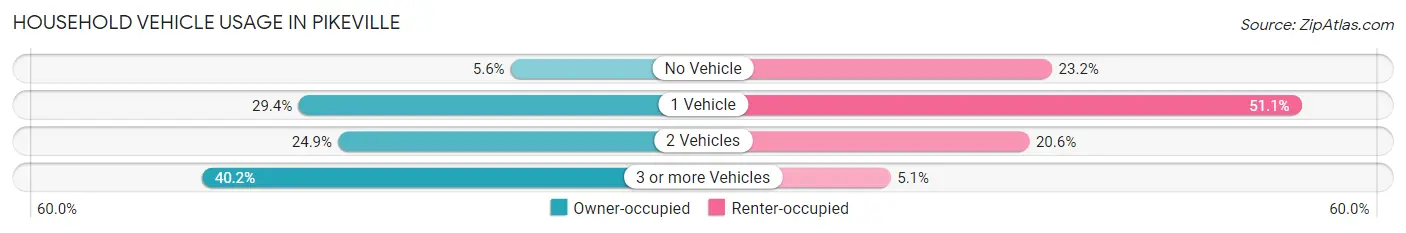
| Vehicles per Household | Owner-occupied | Renter-occupied |
| No Vehicle | 15 (5.6%) | 82 (23.2%) |
| 1 Vehicle | 79 (29.4%) | 181 (51.1%) |
| 2 Vehicles | 67 (24.9%) | 73 (20.6%) |
| 3 or more Vehicles | 108 (40.2%) | 18 (5.1%) |
| Total | 269 (100.0%) | 354 (100.0%) |
Real Estate & Mortgages in Pikeville
Real Estate and Mortgage Overview in Pikeville
| Characteristic | Without Mortgage | With Mortgage |
| Housing Units | 173 | 96 |
| Median Property Value | $119,600 | $170,500 |
| Median Household Income | $45,972 | $4 |
| Monthly Housing Costs | $452 | $0 |
| Real Estate Taxes | $641 | $0 |
Property Value by Mortgage Status in Pikeville
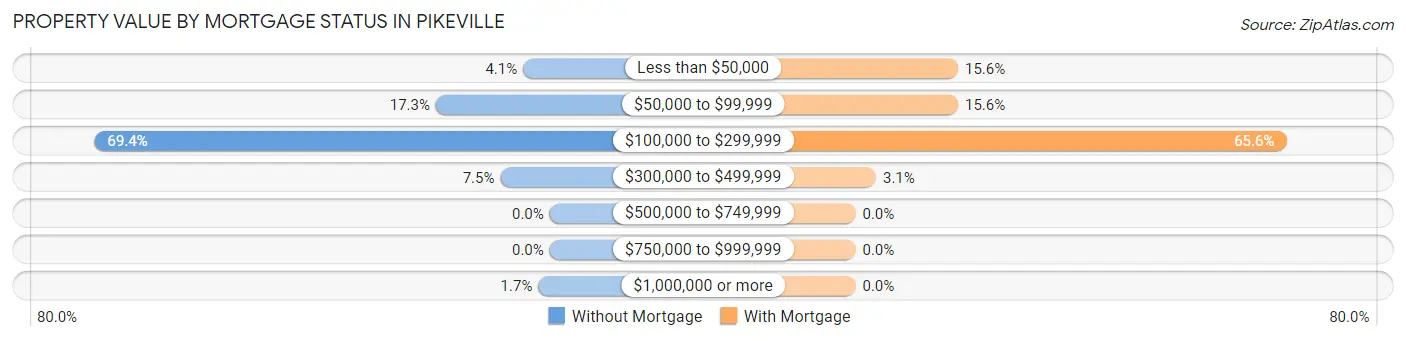
| Property Value | Without Mortgage | With Mortgage |
| Less than $50,000 | 7 (4.1%) | 15 (15.6%) |
| $50,000 to $99,999 | 30 (17.3%) | 15 (15.6%) |
| $100,000 to $299,999 | 120 (69.4%) | 63 (65.6%) |
| $300,000 to $499,999 | 13 (7.5%) | 3 (3.1%) |
| $500,000 to $749,999 | 0 (0.0%) | 0 (0.0%) |
| $750,000 to $999,999 | 0 (0.0%) | 0 (0.0%) |
| $1,000,000 or more | 3 (1.7%) | 0 (0.0%) |
| Total | 173 (100.0%) | 96 (100.0%) |
Household Income by Mortgage Status in Pikeville
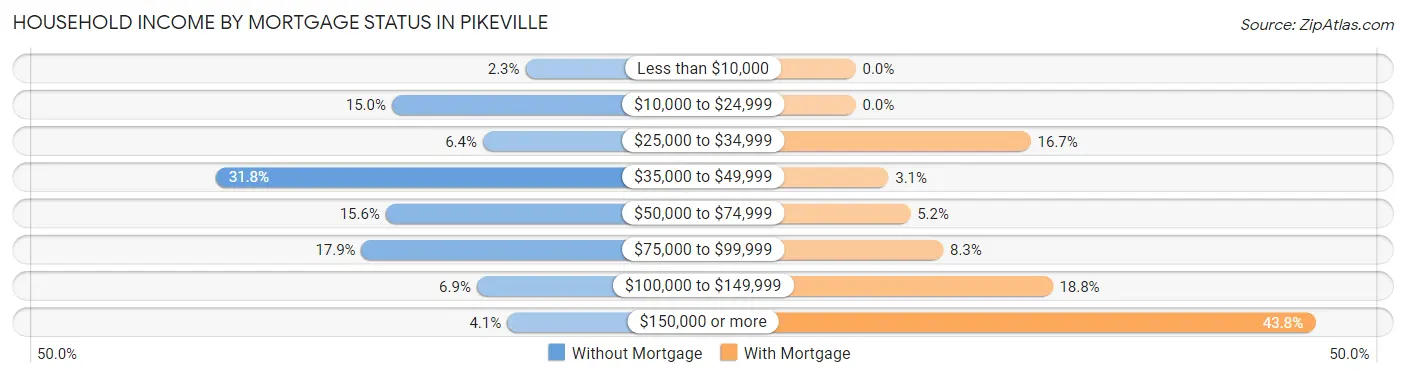
| Household Income | Without Mortgage | With Mortgage |
| Less than $10,000 | 4 (2.3%) | 0 (0.0%) |
| $10,000 to $24,999 | 26 (15.0%) | 0 (0.0%) |
| $25,000 to $34,999 | 11 (6.4%) | 16 (16.7%) |
| $35,000 to $49,999 | 55 (31.8%) | 3 (3.1%) |
| $50,000 to $74,999 | 27 (15.6%) | 5 (5.2%) |
| $75,000 to $99,999 | 31 (17.9%) | 8 (8.3%) |
| $100,000 to $149,999 | 12 (6.9%) | 18 (18.8%) |
| $150,000 or more | 7 (4.1%) | 42 (43.8%) |
| Total | 173 (100.0%) | 96 (100.0%) |
Property Value to Household Income Ratio in Pikeville
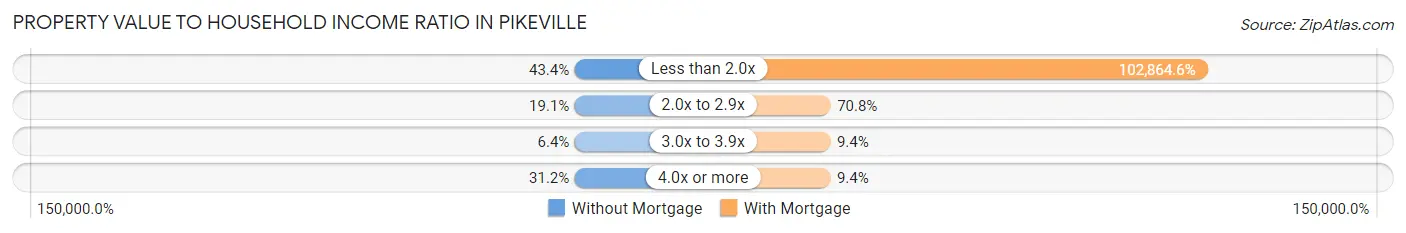
| Value-to-Income Ratio | Without Mortgage | With Mortgage |
| Less than 2.0x | 75 (43.3%) | 98,750 (102,864.6%) |
| 2.0x to 2.9x | 33 (19.1%) | 68 (70.8%) |
| 3.0x to 3.9x | 11 (6.4%) | 9 (9.4%) |
| 4.0x or more | 54 (31.2%) | 9 (9.4%) |
| Total | 173 (100.0%) | 96 (100.0%) |
Real Estate Taxes by Mortgage Status in Pikeville
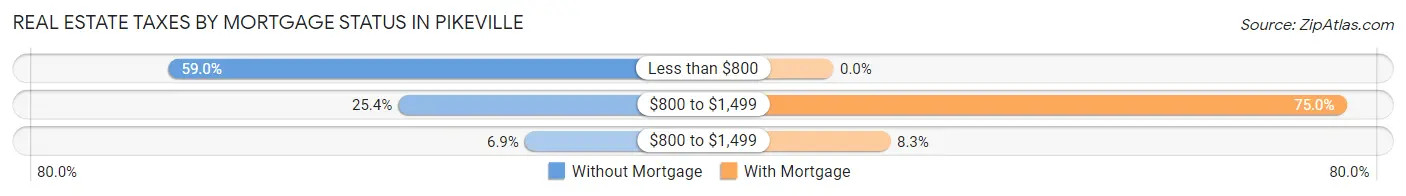
| Property Taxes | Without Mortgage | With Mortgage |
| Less than $800 | 102 (59.0%) | 0 (0.0%) |
| $800 to $1,499 | 44 (25.4%) | 72 (75.0%) |
| $800 to $1,499 | 12 (6.9%) | 8 (8.3%) |
| Total | 173 (100.0%) | 96 (100.0%) |
Health & Disability in Pikeville
Health Insurance Coverage by Age in Pikeville
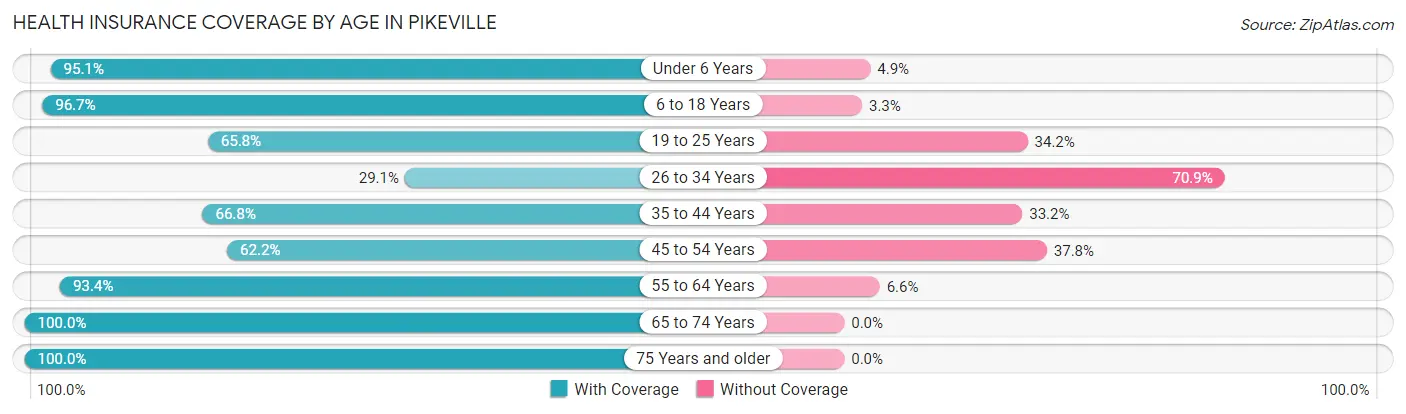
| Age Bracket | With Coverage | Without Coverage |
| Under 6 Years | 235 (95.1%) | 12 (4.9%) |
| 6 to 18 Years | 526 (96.7%) | 18 (3.3%) |
| 19 to 25 Years | 104 (65.8%) | 54 (34.2%) |
| 26 to 34 Years | 156 (29.1%) | 380 (70.9%) |
| 35 to 44 Years | 155 (66.8%) | 77 (33.2%) |
| 45 to 54 Years | 84 (62.2%) | 51 (37.8%) |
| 55 to 64 Years | 198 (93.4%) | 14 (6.6%) |
| 65 to 74 Years | 144 (100.0%) | 0 (0.0%) |
| 75 Years and older | 181 (100.0%) | 0 (0.0%) |
| Total | 1,783 (74.6%) | 606 (25.4%) |
Health Insurance Coverage by Citizenship Status in Pikeville

| Citizenship Status | With Coverage | Without Coverage |
| Native Born | 235 (95.1%) | 12 (4.9%) |
| Foreign Born, Citizen | 526 (96.7%) | 18 (3.3%) |
| Foreign Born, not a Citizen | 104 (65.8%) | 54 (34.2%) |
Health Insurance Coverage by Household Income in Pikeville
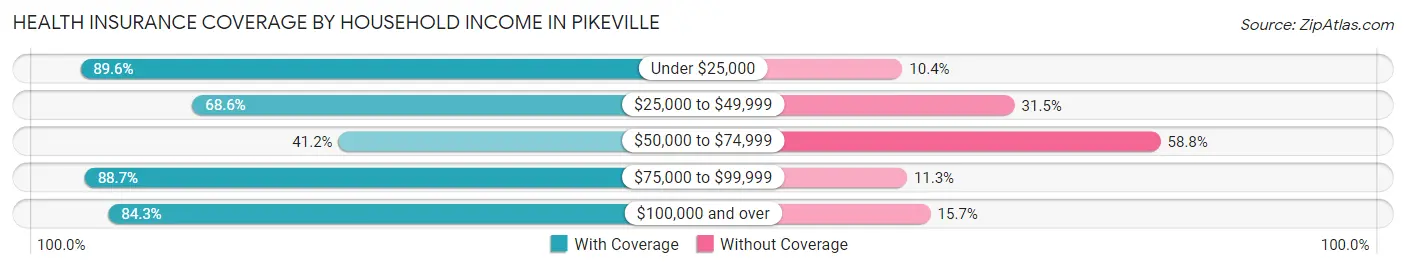
| Household Income | With Coverage | Without Coverage |
| Under $25,000 | 731 (89.6%) | 85 (10.4%) |
| $25,000 to $49,999 | 218 (68.5%) | 100 (31.5%) |
| $50,000 to $74,999 | 225 (41.2%) | 321 (58.8%) |
| $75,000 to $99,999 | 181 (88.7%) | 23 (11.3%) |
| $100,000 and over | 413 (84.3%) | 77 (15.7%) |
Public vs Private Health Insurance Coverage by Age in Pikeville
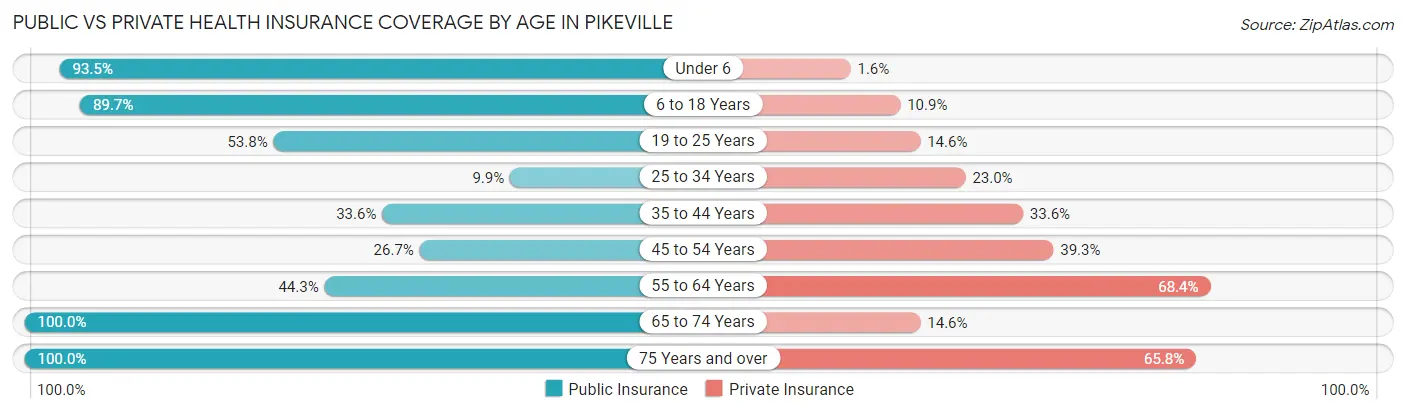
| Age Bracket | Public Insurance | Private Insurance |
| Under 6 | 231 (93.5%) | 4 (1.6%) |
| 6 to 18 Years | 488 (89.7%) | 59 (10.8%) |
| 19 to 25 Years | 85 (53.8%) | 23 (14.6%) |
| 25 to 34 Years | 53 (9.9%) | 123 (23.0%) |
| 35 to 44 Years | 78 (33.6%) | 78 (33.6%) |
| 45 to 54 Years | 36 (26.7%) | 53 (39.3%) |
| 55 to 64 Years | 94 (44.3%) | 145 (68.4%) |
| 65 to 74 Years | 144 (100.0%) | 21 (14.6%) |
| 75 Years and over | 181 (100.0%) | 119 (65.7%) |
| Total | 1,390 (58.2%) | 625 (26.2%) |
Disability Status by Sex by Age in Pikeville
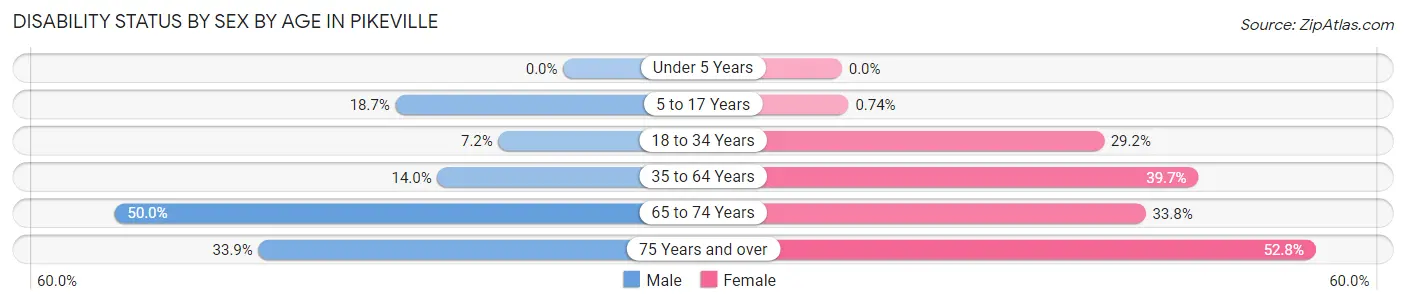
| Age Bracket | Male | Female |
| Under 5 Years | 0 (0.0%) | 0 (0.0%) |
| 5 to 17 Years | 73 (18.7%) | 1 (0.7%) |
| 18 to 34 Years | 37 (7.2%) | 63 (29.2%) |
| 35 to 64 Years | 43 (14.0%) | 108 (39.7%) |
| 65 to 74 Years | 38 (50.0%) | 23 (33.8%) |
| 75 Years and over | 37 (33.9%) | 38 (52.8%) |
Disability Class by Sex by Age in Pikeville
Disability Class: Hearing Difficulty
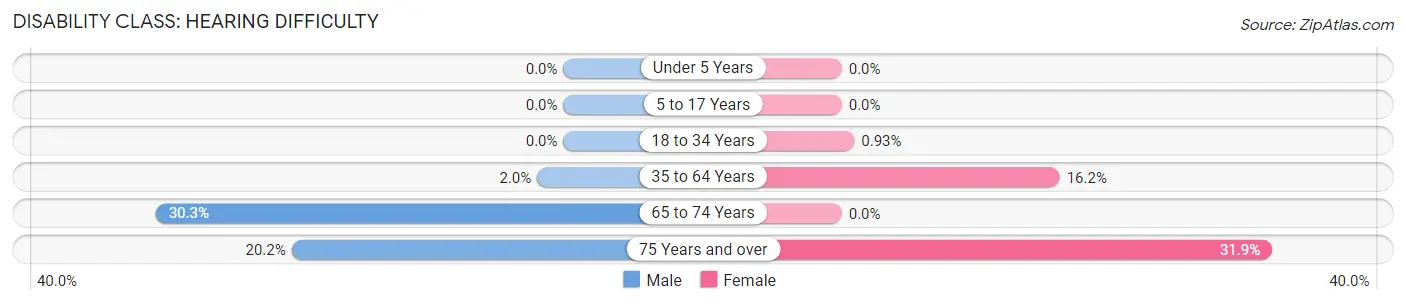
| Age Bracket | Male | Female |
| Under 5 Years | 0 (0.0%) | 0 (0.0%) |
| 5 to 17 Years | 0 (0.0%) | 0 (0.0%) |
| 18 to 34 Years | 0 (0.0%) | 2 (0.9%) |
| 35 to 64 Years | 6 (1.9%) | 44 (16.2%) |
| 65 to 74 Years | 23 (30.3%) | 0 (0.0%) |
| 75 Years and over | 22 (20.2%) | 23 (31.9%) |
Disability Class: Vision Difficulty
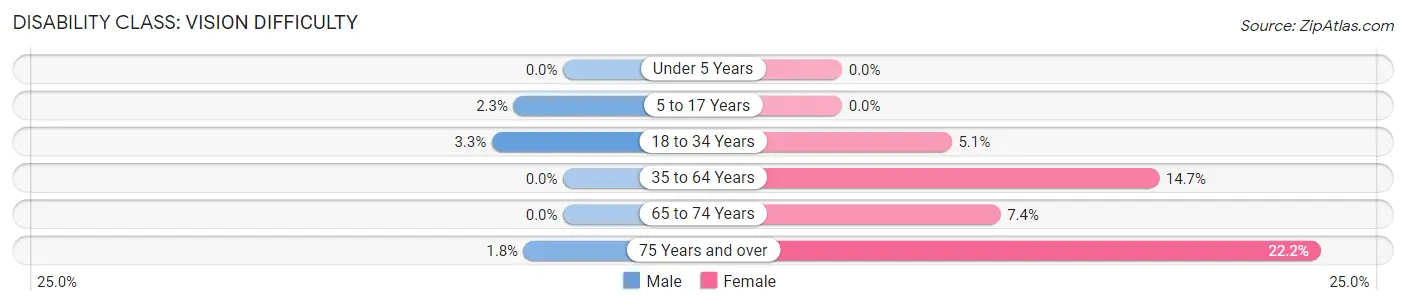
| Age Bracket | Male | Female |
| Under 5 Years | 0 (0.0%) | 0 (0.0%) |
| 5 to 17 Years | 9 (2.3%) | 0 (0.0%) |
| 18 to 34 Years | 17 (3.3%) | 11 (5.1%) |
| 35 to 64 Years | 0 (0.0%) | 40 (14.7%) |
| 65 to 74 Years | 0 (0.0%) | 5 (7.3%) |
| 75 Years and over | 2 (1.8%) | 16 (22.2%) |
Disability Class: Cognitive Difficulty
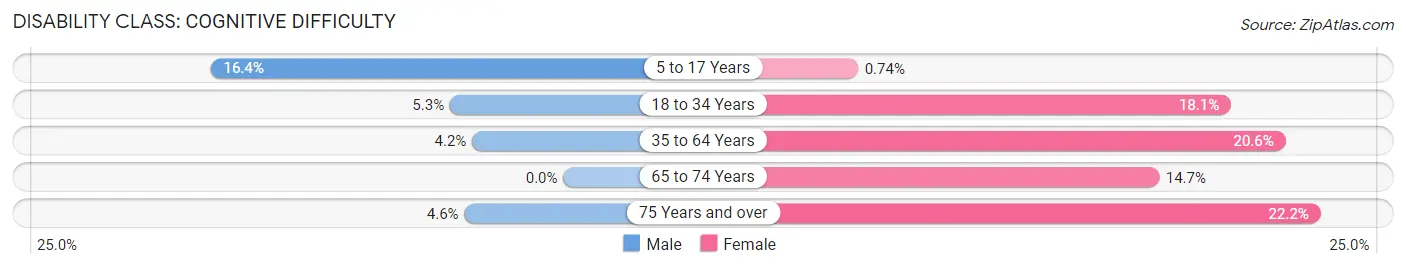
| Age Bracket | Male | Female |
| 5 to 17 Years | 64 (16.4%) | 1 (0.7%) |
| 18 to 34 Years | 27 (5.3%) | 39 (18.1%) |
| 35 to 64 Years | 13 (4.2%) | 56 (20.6%) |
| 65 to 74 Years | 0 (0.0%) | 10 (14.7%) |
| 75 Years and over | 5 (4.6%) | 16 (22.2%) |
Disability Class: Ambulatory Difficulty
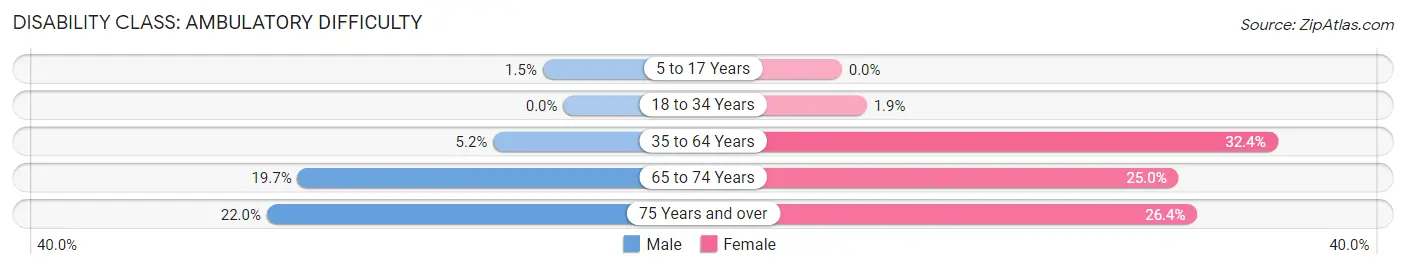
| Age Bracket | Male | Female |
| 5 to 17 Years | 6 (1.5%) | 0 (0.0%) |
| 18 to 34 Years | 0 (0.0%) | 4 (1.8%) |
| 35 to 64 Years | 16 (5.2%) | 88 (32.4%) |
| 65 to 74 Years | 15 (19.7%) | 17 (25.0%) |
| 75 Years and over | 24 (22.0%) | 19 (26.4%) |
Disability Class: Self-Care Difficulty
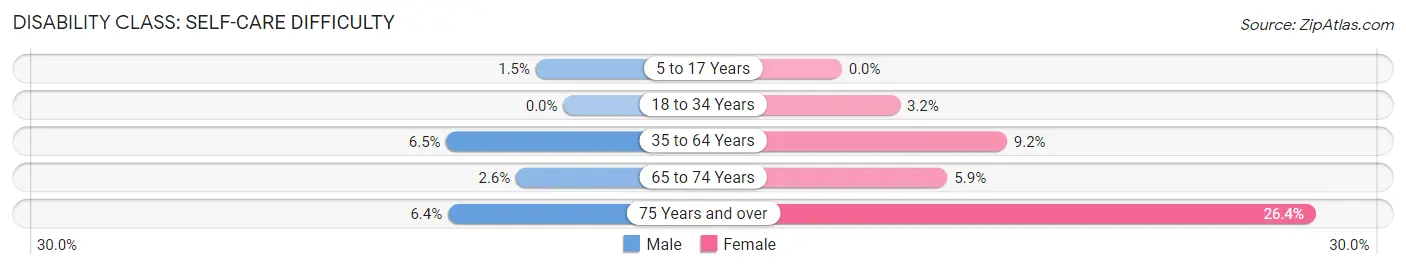
| Age Bracket | Male | Female |
| 5 to 17 Years | 6 (1.5%) | 0 (0.0%) |
| 18 to 34 Years | 0 (0.0%) | 7 (3.2%) |
| 35 to 64 Years | 20 (6.5%) | 25 (9.2%) |
| 65 to 74 Years | 2 (2.6%) | 4 (5.9%) |
| 75 Years and over | 7 (6.4%) | 19 (26.4%) |
Technology Access in Pikeville
Computing Device Access in Pikeville
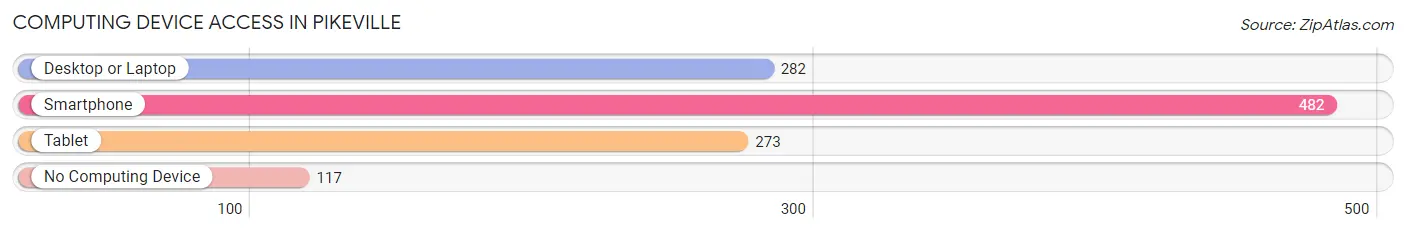
| Device Type | # Households | % Households |
| Desktop or Laptop | 282 | 45.3% |
| Smartphone | 482 | 77.4% |
| Tablet | 273 | 43.8% |
| No Computing Device | 117 | 18.8% |
| Total | 623 | 100.0% |
Internet Access in Pikeville
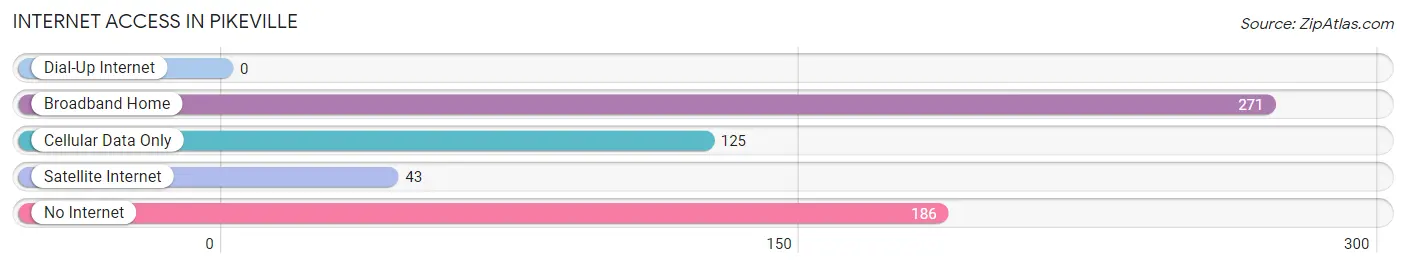
| Internet Type | # Households | % Households |
| Dial-Up Internet | 0 | 0.0% |
| Broadband Home | 271 | 43.5% |
| Cellular Data Only | 125 | 20.1% |
| Satellite Internet | 43 | 6.9% |
| No Internet | 186 | 29.9% |
| Total | 623 | 100.0% |
Pikeville Summary
Pikeville, Tennessee is a small town located in Bledsoe County, Tennessee. It is situated in the foothills of the Cumberland Mountains and is part of the Chattanooga metropolitan area. The town has a population of approximately 1,500 people and is the county seat of Bledsoe County.
History
Pikeville was founded in 1820 by William Pike, a Revolutionary War veteran. The town was originally known as Pikeville Station, and was a stop on the stagecoach route between Nashville and Chattanooga. The town was officially incorporated in 1872.
In the late 19th century, Pikeville was a thriving agricultural center, with a large number of farms and orchards in the area. The town was also home to several sawmills and gristmills. In the early 20th century, the town began to decline as the railroad bypassed it and the population began to move away.
Geography
Pikeville is located in the foothills of the Cumberland Mountains in Bledsoe County, Tennessee. The town is situated at an elevation of 1,000 feet above sea level. The town is located approximately 25 miles east of Chattanooga and is part of the Chattanooga metropolitan area.
The town is located in a valley surrounded by hills and mountains. The Sequatchie River runs through the town and is a popular spot for fishing and canoeing. The town is also home to several parks, including the Bledsoe County Park and the Sequatchie Valley Nature Center.
Economy
The economy of Pikeville is largely based on agriculture and tourism. The town is home to several farms and orchards, as well as a number of small businesses. The town is also home to several tourist attractions, including the Sequatchie Valley Nature Center and the Bledsoe County Park.
Demographics
As of the 2010 census, the population of Pikeville was 1,500. The town is predominantly white, with a small African American population. The median household income is $30,000 and the median home value is $90,000. The town has a low unemployment rate of 4.2%.
Conclusion
Pikeville, Tennessee is a small town located in Bledsoe County, Tennessee. It is situated in the foothills of the Cumberland Mountains and is part of the Chattanooga metropolitan area. The town has a population of approximately 1,500 people and is the county seat of Bledsoe County. The economy of Pikeville is largely based on agriculture and tourism, and the town is home to several farms and orchards, as well as a number of small businesses. The town is predominantly white, with a small African American population. The median household income is $30,000 and the median home value is $90,000. The town has a low unemployment rate of 4.2%.
Common Questions
What is Per Capita Income in Pikeville?
Per Capita income in Pikeville is $17,210.
What is the Median Family Income in Pikeville?
Median Family Income in Pikeville is $36,917.
What is the Median Household income in Pikeville?
Median Household Income in Pikeville is $27,240.
What is Family Income Deficit in Pikeville?
Family Income Deficit in Pikeville is $12,043.
Families that are below poverty line in Pikeville earn $12,043 less on average than the poverty threshold level.
What is Inequality or Gini Index in Pikeville?
Inequality or Gini Index in Pikeville is 0.50.
What is the Total Population of Pikeville?
Total Population of Pikeville is 2,541.
What is the Total Male Population of Pikeville?
Total Male Population of Pikeville is 1,627.
What is the Total Female Population of Pikeville?
Total Female Population of Pikeville is 914.
What is the Ratio of Males per 100 Females in Pikeville?
There are 178.01 Males per 100 Females in Pikeville.
What is the Ratio of Females per 100 Males in Pikeville?
There are 56.18 Females per 100 Males in Pikeville.
What is the Median Population Age in Pikeville?
Median Population Age in Pikeville is 28.9 Years.
What is the Average Family Size in Pikeville
Average Family Size in Pikeville is 4.5 People.
What is the Average Household Size in Pikeville
Average Household Size in Pikeville is 3.8 People.
How Large is the Labor Force in Pikeville?
There are 1,030 People in the Labor Forcein in Pikeville.
What is the Percentage of People in the Labor Force in Pikeville?
55.9% of People are in the Labor Force in Pikeville.
What is the Unemployment Rate in Pikeville?
Unemployment Rate in Pikeville is 6.7%.