Guys, TN Map & Demographics
Guys Map
Guys Overview
$32,739
PER CAPITA INCOME
$51,875
AVG FAMILY INCOME
$41,563
AVG HOUSEHOLD INCOME
34.4%
WAGE / INCOME GAP [ % ]
65.6¢/ $1
WAGE / INCOME GAP [ $ ]
0.53
INEQUALITY / GINI INDEX
385
TOTAL POPULATION
143
MALE POPULATION
242
FEMALE POPULATION
59.09
MALES / 100 FEMALES
169.23
FEMALES / 100 MALES
51.0
MEDIAN AGE
3.0
AVG FAMILY SIZE
2.3
AVG HOUSEHOLD SIZE
188
LABOR FORCE [ PEOPLE ]
56.0%
PERCENT IN LABOR FORCE
12.8%
UNEMPLOYMENT RATE
Guys Zip Codes
Guys Area Codes
Income in Guys
Income Overview in Guys
Per Capita Income in Guys is $32,739, while median incomes of families and households are $51,875 and $41,563 respectively.
| Characteristic | Number | Measure |
| Per Capita Income | 385 | $32,739 |
| Median Family Income | 99 | $51,875 |
| Mean Family Income | 99 | $95,287 |
| Median Household Income | 170 | $41,563 |
| Mean Household Income | 170 | $69,660 |
| Income Deficit | 99 | $0 |
| Wage / Income Gap (%) | 385 | 34.36% |
| Wage / Income Gap ($) | 385 | 65.64¢ per $1 |
| Gini / Inequality Index | 385 | 0.53 |
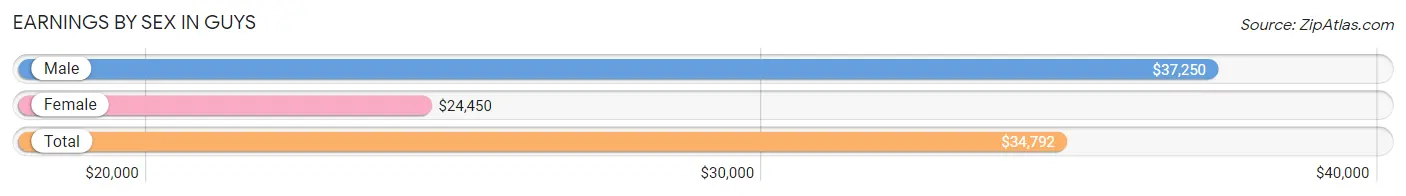
Earnings by Sex in Guys
Average Earnings in Guys are $34,792, $37,250 for men and $24,450 for women, a difference of 34.4%.
| Sex | Number | Average Earnings |
| Male | 83 (47.2%) | $37,250 |
| Female | 93 (52.8%) | $24,450 |
| Total | 176 (100.0%) | $34,792 |
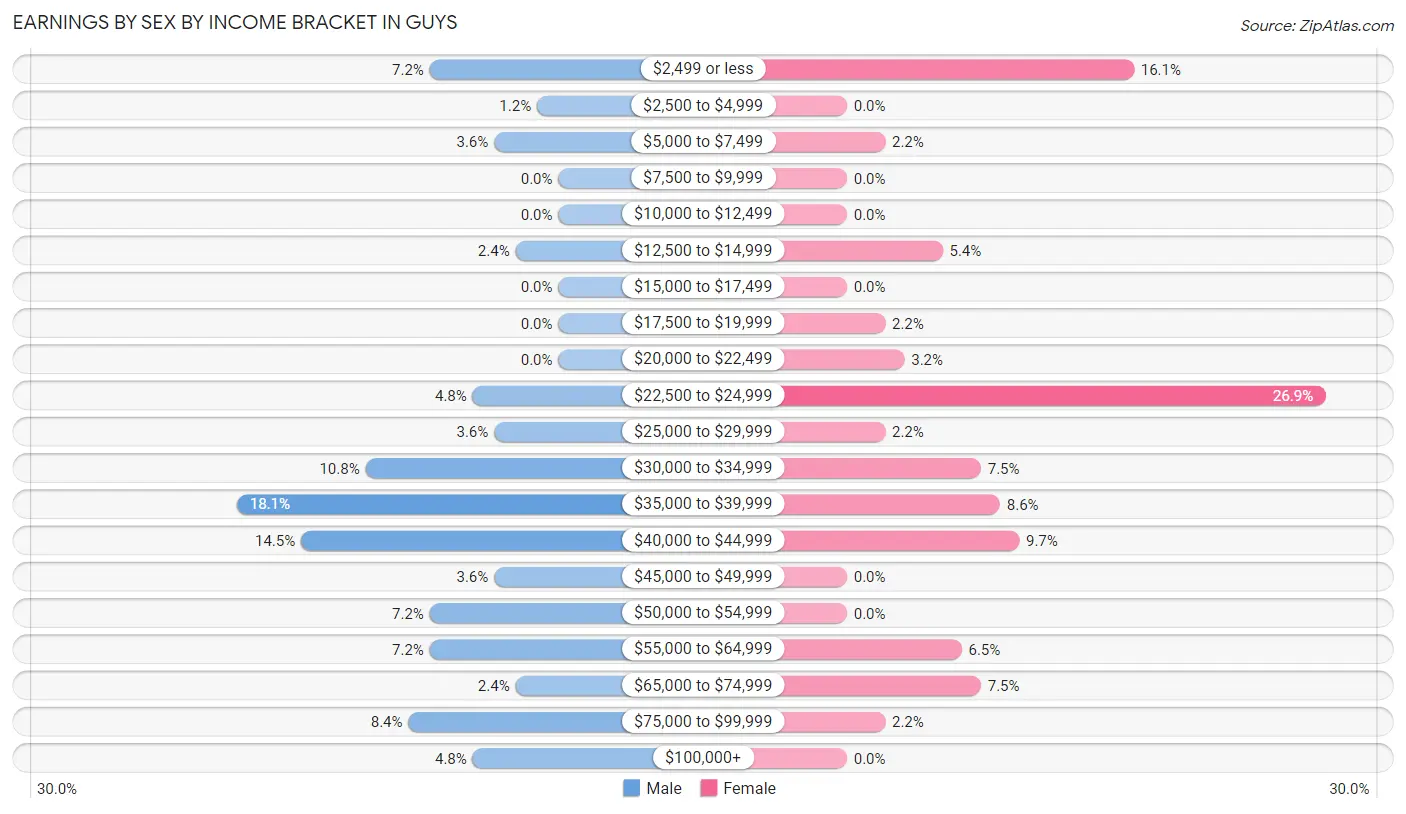
Earnings by Sex by Income Bracket in Guys
The most common earnings brackets in Guys are $35,000 to $39,999 for men (15 | 18.1%) and $22,500 to $24,999 for women (25 | 26.9%).
| Income | Male | Female |
| $2,499 or less | 6 (7.2%) | 15 (16.1%) |
| $2,500 to $4,999 | 1 (1.2%) | 0 (0.0%) |
| $5,000 to $7,499 | 3 (3.6%) | 2 (2.1%) |
| $7,500 to $9,999 | 0 (0.0%) | 0 (0.0%) |
| $10,000 to $12,499 | 0 (0.0%) | 0 (0.0%) |
| $12,500 to $14,999 | 2 (2.4%) | 5 (5.4%) |
| $15,000 to $17,499 | 0 (0.0%) | 0 (0.0%) |
| $17,500 to $19,999 | 0 (0.0%) | 2 (2.1%) |
| $20,000 to $22,499 | 0 (0.0%) | 3 (3.2%) |
| $22,500 to $24,999 | 4 (4.8%) | 25 (26.9%) |
| $25,000 to $29,999 | 3 (3.6%) | 2 (2.1%) |
| $30,000 to $34,999 | 9 (10.8%) | 7 (7.5%) |
| $35,000 to $39,999 | 15 (18.1%) | 8 (8.6%) |
| $40,000 to $44,999 | 12 (14.5%) | 9 (9.7%) |
| $45,000 to $49,999 | 3 (3.6%) | 0 (0.0%) |
| $50,000 to $54,999 | 6 (7.2%) | 0 (0.0%) |
| $55,000 to $64,999 | 6 (7.2%) | 6 (6.5%) |
| $65,000 to $74,999 | 2 (2.4%) | 7 (7.5%) |
| $75,000 to $99,999 | 7 (8.4%) | 2 (2.1%) |
| $100,000+ | 4 (4.8%) | 0 (0.0%) |
| Total | 83 (100.0%) | 93 (100.0%) |
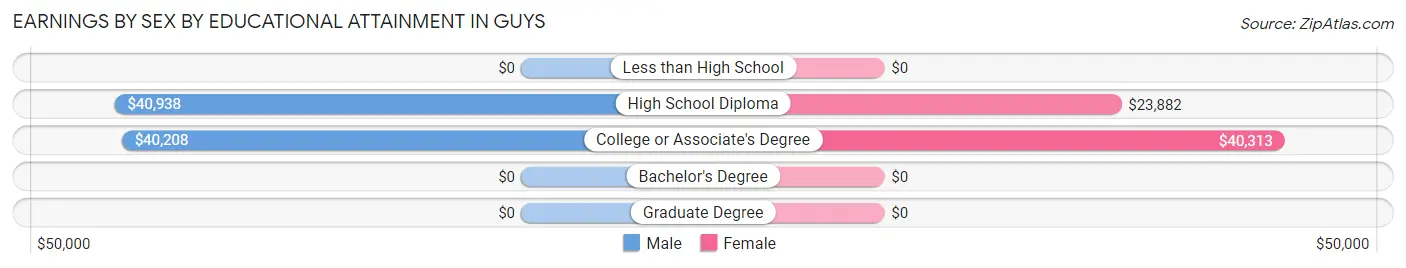
Earnings by Sex by Educational Attainment in Guys
Average earnings in Guys are $40,500 for men and $24,850 for women, a difference of 38.6%. Men with an educational attainment of high school diploma enjoy the highest average annual earnings of $40,938, while those with college or associate's degree education earn the least with $40,208. Women with an educational attainment of college or associate's degree earn the most with the average annual earnings of $40,313, while those with high school diploma education have the smallest earnings of $23,882.
| Educational Attainment | Male Income | Female Income |
| Less than High School | - | - |
| High School Diploma | $40,938 | $23,882 |
| College or Associate's Degree | $40,208 | $40,313 |
| Bachelor's Degree | - | - |
| Graduate Degree | - | - |
| Total | $40,500 | $24,850 |
Family Income in Guys
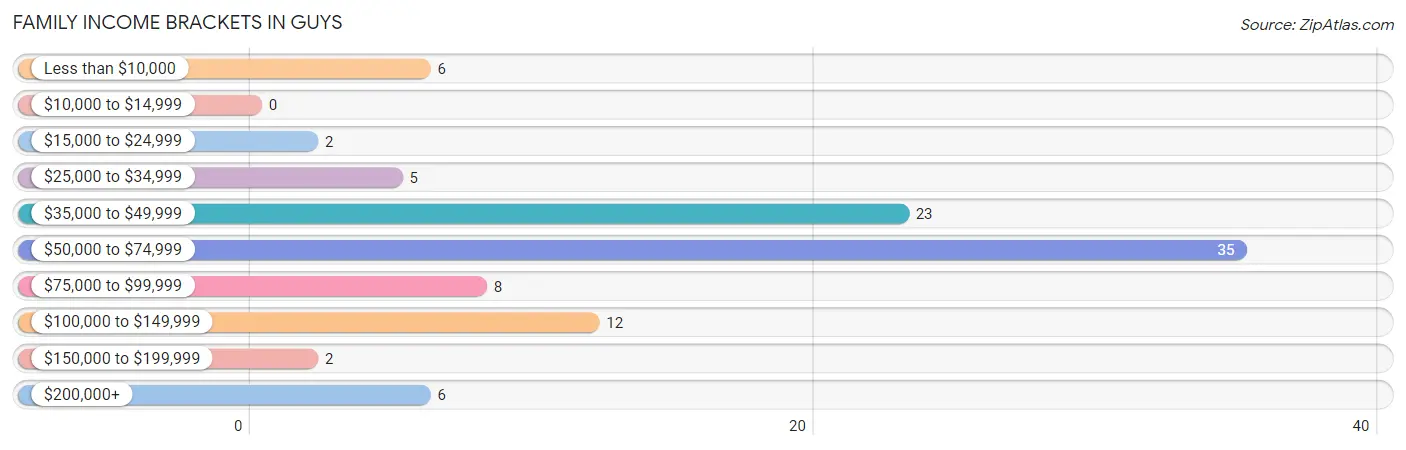
Family Income Brackets in Guys
According to the Guys family income data, there are 35 families falling into the $50,000 to $74,999 income range, which is the most common income bracket and makes up 35.3% of all families.
| Income Bracket | # Families | % Families |
| Less than $10,000 | 6 | 6.1% |
| $10,000 to $14,999 | 0 | 0.0% |
| $15,000 to $24,999 | 2 | 2.0% |
| $25,000 to $34,999 | 5 | 5.1% |
| $35,000 to $49,999 | 23 | 23.2% |
| $50,000 to $74,999 | 35 | 35.4% |
| $75,000 to $99,999 | 8 | 8.1% |
| $100,000 to $149,999 | 12 | 12.1% |
| $150,000 to $199,999 | 2 | 2.0% |
| $200,000+ | 6 | 6.1% |
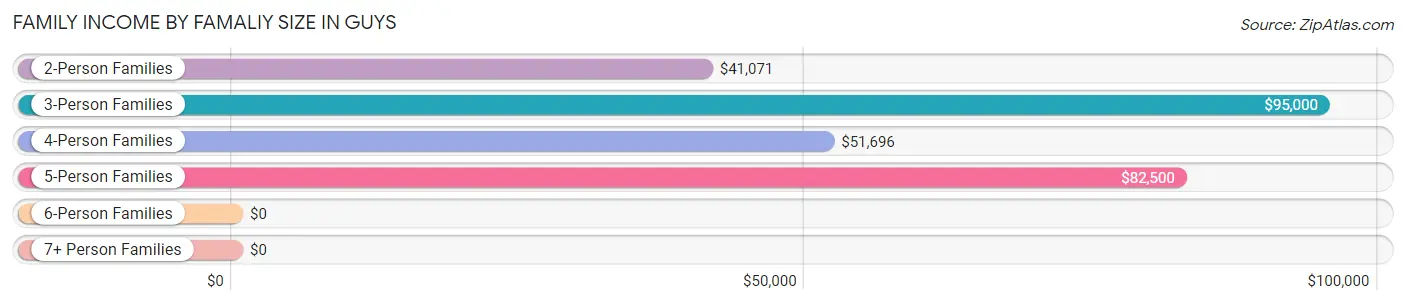
Family Income by Famaliy Size in Guys
3-person families (12 | 12.1%) account for the highest median family income in Guys with $95,000 per family, while 3-person families (12 | 12.1%) have the highest median income of $31,667 per family member.
| Income Bracket | # Families | Median Income |
| 2-Person Families | 62 (62.6%) | $41,071 |
| 3-Person Families | 12 (12.1%) | $95,000 |
| 4-Person Families | 19 (19.2%) | $51,696 |
| 5-Person Families | 6 (6.1%) | $82,500 |
| 6-Person Families | 0 (0.0%) | $0 |
| 7+ Person Families | 0 (0.0%) | $0 |
| Total | 99 (100.0%) | $51,875 |
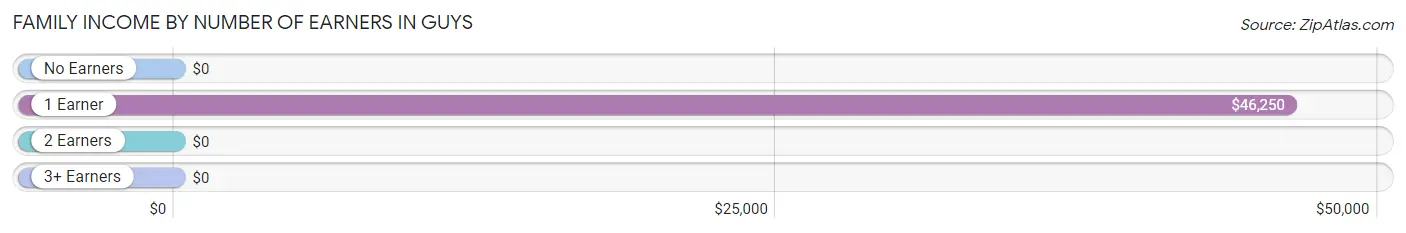
Family Income by Number of Earners in Guys
| Number of Earners | # Families | Median Income |
| No Earners | 13 (13.1%) | $0 |
| 1 Earner | 60 (60.6%) | $46,250 |
| 2 Earners | 19 (19.2%) | $0 |
| 3+ Earners | 7 (7.1%) | $0 |
| Total | 99 (100.0%) | $51,875 |
Household Income in Guys
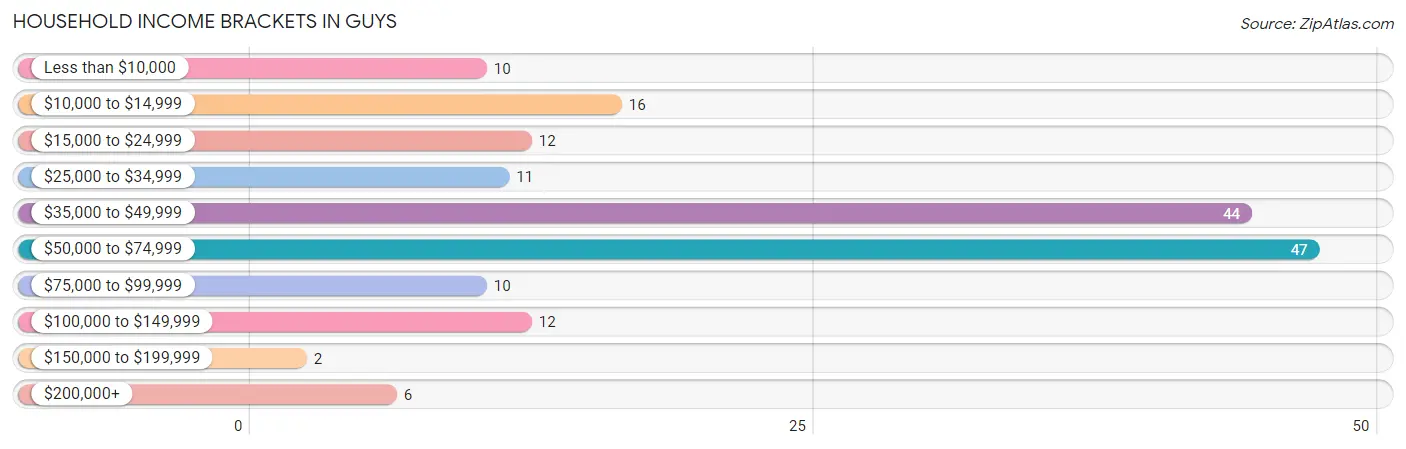
Household Income Brackets in Guys
With 47 households falling in the category, the $50,000 to $74,999 income range is the most frequent in Guys, accounting for 27.7% of all households. In contrast, only 2 households (1.2%) fall into the $150,000 to $199,999 income bracket, making it the least populous group.
| Income Bracket | # Households | % Households |
| Less than $10,000 | 10 | 5.9% |
| $10,000 to $14,999 | 16 | 9.4% |
| $15,000 to $24,999 | 12 | 7.1% |
| $25,000 to $34,999 | 11 | 6.5% |
| $35,000 to $49,999 | 44 | 25.9% |
| $50,000 to $74,999 | 47 | 27.6% |
| $75,000 to $99,999 | 10 | 5.9% |
| $100,000 to $149,999 | 12 | 7.1% |
| $150,000 to $199,999 | 2 | 1.2% |
| $200,000+ | 6 | 3.5% |
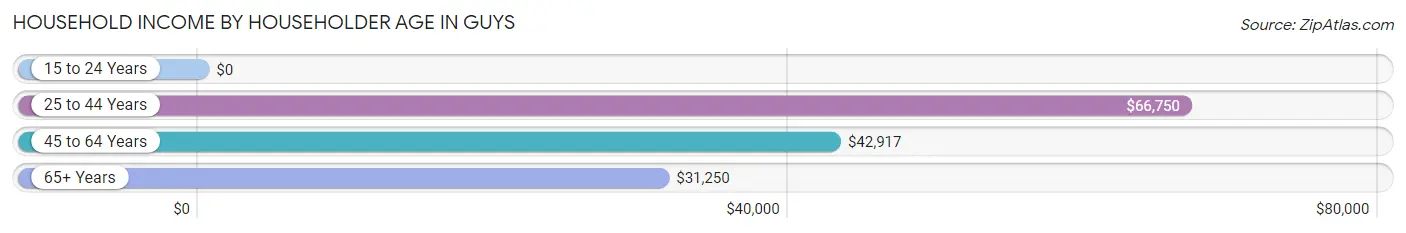
Household Income by Householder Age in Guys
The median household income in Guys is $41,563, with the highest median household income of $66,750 found in the 25 to 44 years age bracket for the primary householder. A total of 23 households (13.5%) fall into this category. Meanwhile, the 15 to 24 years age bracket for the primary householder has the lowest median household income of $0, with 1 households (0.6%) in this group.
| Income Bracket | # Households | Median Income |
| 15 to 24 Years | 1 (0.6%) | $0 |
| 25 to 44 Years | 23 (13.5%) | $66,750 |
| 45 to 64 Years | 95 (55.9%) | $42,917 |
| 65+ Years | 51 (30.0%) | $31,250 |
| Total | 170 (100.0%) | $41,563 |
Poverty in Guys
Income Below Poverty by Sex and Age in Guys
With 10.2% poverty level for males and 12.2% for females among the residents of Guys, 6 to 11 year old males and 25 to 34 year old females are the most vulnerable to poverty, with 3 males (33.3%) and 7 females (46.7%) in their respective age groups living below the poverty level.
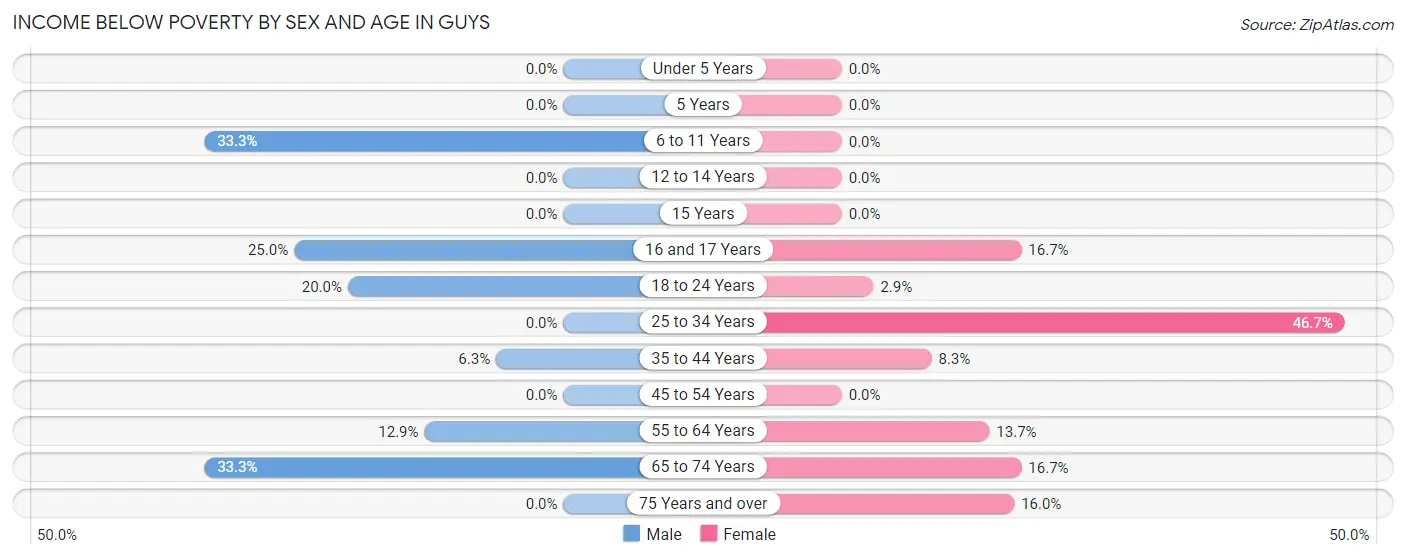
| Age Bracket | Male | Female |
| Under 5 Years | 0 (0.0%) | 0 (0.0%) |
| 5 Years | 0 (0.0%) | 0 (0.0%) |
| 6 to 11 Years | 3 (33.3%) | 0 (0.0%) |
| 12 to 14 Years | 0 (0.0%) | 0 (0.0%) |
| 15 Years | 0 (0.0%) | 0 (0.0%) |
| 16 and 17 Years | 1 (25.0%) | 2 (16.7%) |
| 18 to 24 Years | 2 (20.0%) | 1 (2.9%) |
| 25 to 34 Years | 0 (0.0%) | 7 (46.7%) |
| 35 to 44 Years | 1 (6.2%) | 2 (8.3%) |
| 45 to 54 Years | 0 (0.0%) | 0 (0.0%) |
| 55 to 64 Years | 4 (12.9%) | 10 (13.7%) |
| 65 to 74 Years | 3 (33.3%) | 3 (16.7%) |
| 75 Years and over | 0 (0.0%) | 4 (16.0%) |
| Total | 14 (10.2%) | 29 (12.2%) |
Income Above Poverty by Sex and Age in Guys
According to the poverty statistics in Guys, males aged 12 to 14 years and females aged 6 to 11 years are the age groups that are most secure financially, with 100.0% of males and 100.0% of females in these age groups living above the poverty line.
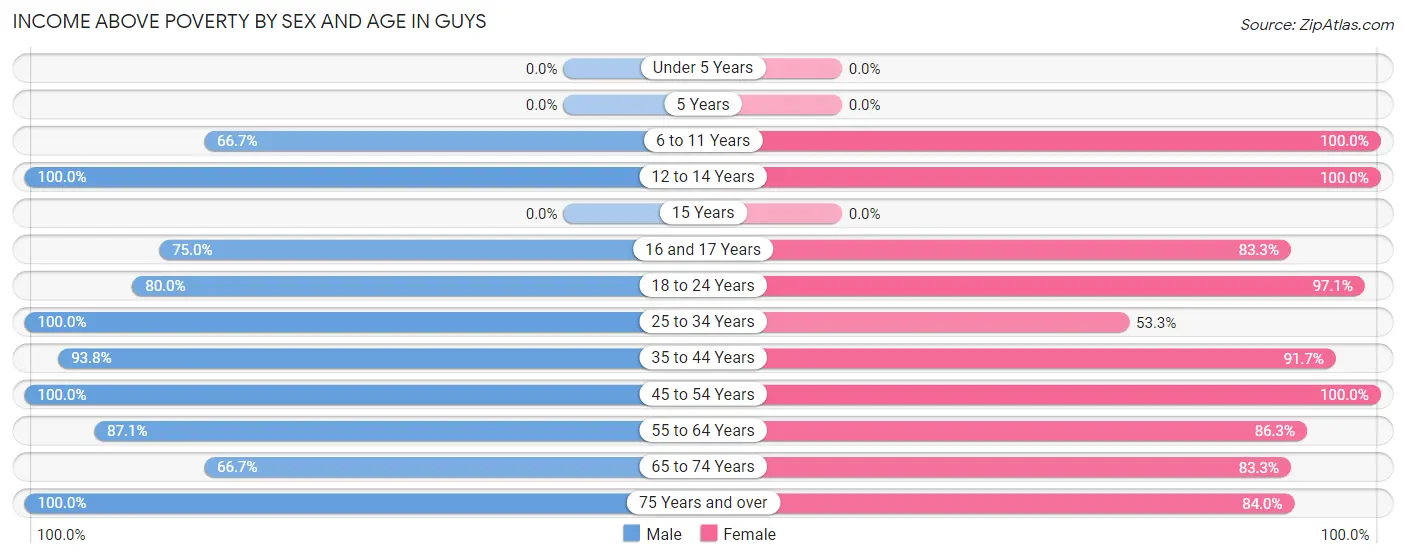
| Age Bracket | Male | Female |
| Under 5 Years | 0 (0.0%) | 0 (0.0%) |
| 5 Years | 0 (0.0%) | 0 (0.0%) |
| 6 to 11 Years | 6 (66.7%) | 8 (100.0%) |
| 12 to 14 Years | 12 (100.0%) | 9 (100.0%) |
| 15 Years | 0 (0.0%) | 0 (0.0%) |
| 16 and 17 Years | 3 (75.0%) | 10 (83.3%) |
| 18 to 24 Years | 8 (80.0%) | 33 (97.1%) |
| 25 to 34 Years | 9 (100.0%) | 8 (53.3%) |
| 35 to 44 Years | 15 (93.8%) | 22 (91.7%) |
| 45 to 54 Years | 26 (100.0%) | 19 (100.0%) |
| 55 to 64 Years | 27 (87.1%) | 63 (86.3%) |
| 65 to 74 Years | 6 (66.7%) | 15 (83.3%) |
| 75 Years and over | 11 (100.0%) | 21 (84.0%) |
| Total | 123 (89.8%) | 208 (87.8%) |
Income Below Poverty Among Married-Couple Families in Guys
The poverty statistics for married-couple families in Guys show that 3.1% or 2 of the total 64 families live below the poverty line. Families with no children have the highest poverty rate of 3.1%, comprising of 1 families. On the other hand, families with no children have the lowest poverty rate of 3.1%, which includes 1 families.
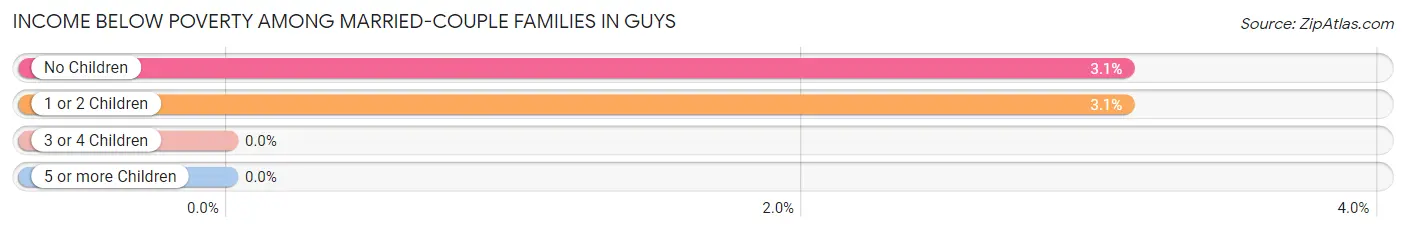
| Children | Above Poverty | Below Poverty |
| No Children | 31 (96.9%) | 1 (3.1%) |
| 1 or 2 Children | 31 (96.9%) | 1 (3.1%) |
| 3 or 4 Children | 0 (0.0%) | 0 (0.0%) |
| 5 or more Children | 0 (0.0%) | 0 (0.0%) |
| Total | 62 (96.9%) | 2 (3.1%) |
Income Below Poverty Among Single-Parent Households in Guys
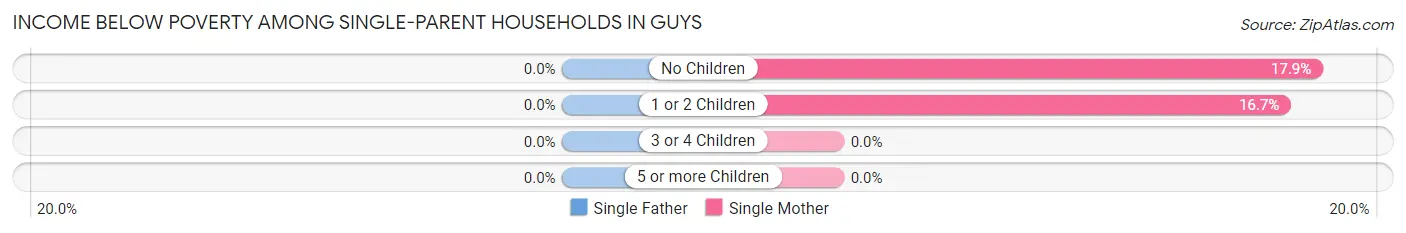
| Children | Single Father | Single Mother |
| No Children | 0 (0.0%) | 5 (17.9%) |
| 1 or 2 Children | 0 (0.0%) | 1 (16.7%) |
| 3 or 4 Children | 0 (0.0%) | 0 (0.0%) |
| 5 or more Children | 0 (0.0%) | 0 (0.0%) |
| Total | 0 (0.0%) | 6 (17.6%) |
Income Below Poverty Among Married-Couple vs Single-Parent Households in Guys
The poverty data for Guys shows that 2 of the married-couple family households (3.1%) and 6 of the single-parent households (17.1%) are living below the poverty level. Within the married-couple family households, those with no children have the highest poverty rate, with 1 households (3.1%) falling below the poverty line. Among the single-parent households, those with no children have the highest poverty rate, with 5 household (17.2%) living below poverty.
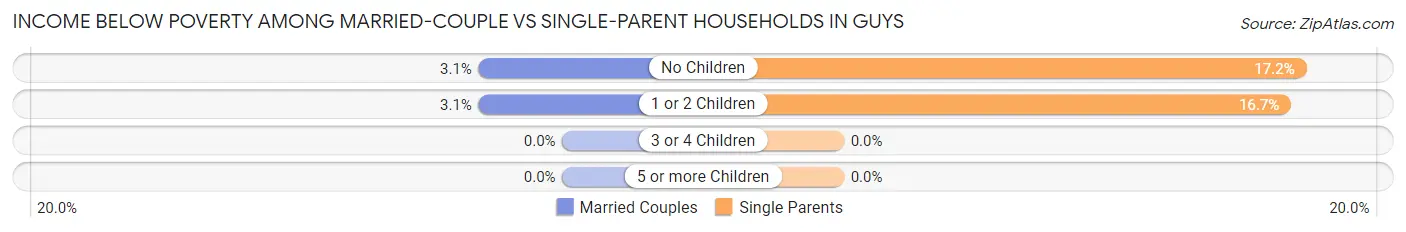
| Children | Married-Couple Families | Single-Parent Households |
| No Children | 1 (3.1%) | 5 (17.2%) |
| 1 or 2 Children | 1 (3.1%) | 1 (16.7%) |
| 3 or 4 Children | 0 (0.0%) | 0 (0.0%) |
| 5 or more Children | 0 (0.0%) | 0 (0.0%) |
| Total | 2 (3.1%) | 6 (17.1%) |
Race in Guys
The most populous races in Guys are White / Caucasian (236 | 61.3%), Black / African American (145 | 37.7%), and Hispanic or Latino (8 | 2.1%).
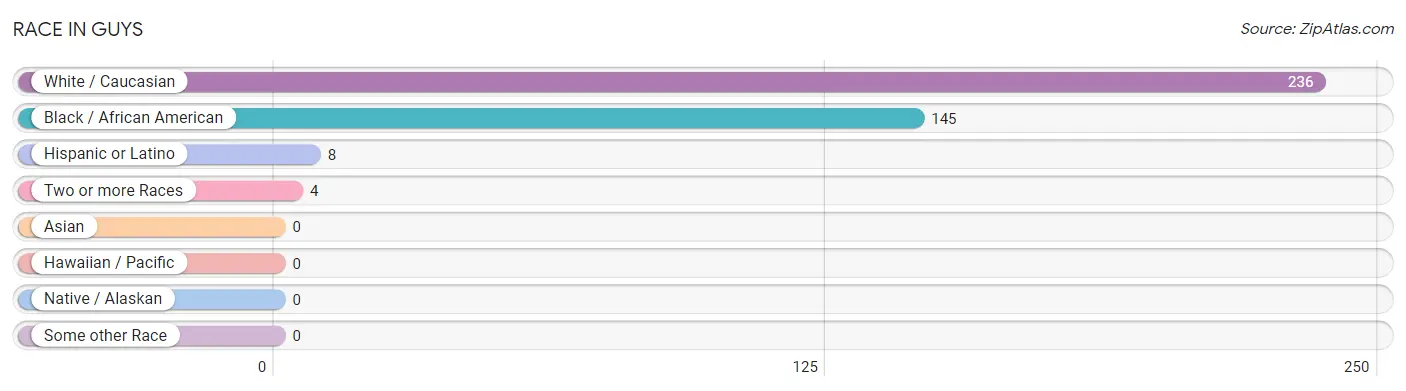
| Race | # Population | % Population |
| Asian | 0 | 0.0% |
| Black / African American | 145 | 37.7% |
| Hawaiian / Pacific | 0 | 0.0% |
| Hispanic or Latino | 8 | 2.1% |
| Native / Alaskan | 0 | 0.0% |
| White / Caucasian | 236 | 61.3% |
| Two or more Races | 4 | 1.0% |
| Some other Race | 0 | 0.0% |
| Total | 385 | 100.0% |
Ancestry in Guys
The most populous ancestries reported in Guys are African (74 | 19.2%), Subsaharan African (74 | 19.2%), English (37 | 9.6%), American (25 | 6.5%), and Irish (18 | 4.7%), together accounting for 59.2% of all Guys residents.
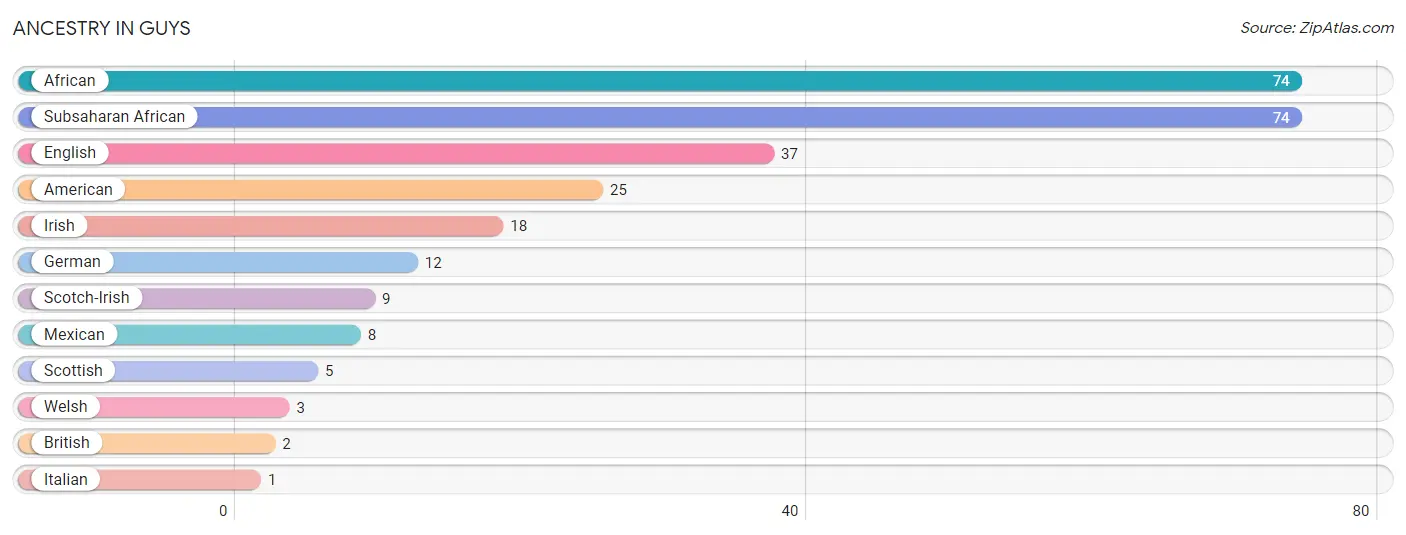
| Ancestry | # Population | % Population |
| African | 74 | 19.2% |
| American | 25 | 6.5% |
| British | 2 | 0.5% |
| English | 37 | 9.6% |
| German | 12 | 3.1% |
| Irish | 18 | 4.7% |
| Italian | 1 | 0.3% |
| Mexican | 8 | 2.1% |
| Scotch-Irish | 9 | 2.3% |
| Scottish | 5 | 1.3% |
| Subsaharan African | 74 | 19.2% |
| Welsh | 3 | 0.8% | View All 12 Rows |
Immigrants in Guys
The most numerous immigrant groups reported in Guys came from , and Canada (1 | 0.3%), together accounting for 0.3% of all Guys residents.

| Immigration Origin | # Population | % Population |
| Canada | 1 | 0.3% | View All 1 Rows |
Sex and Age in Guys
Sex and Age in Guys
The most populous age groups in Guys are 10 to 14 Years (21 | 14.7%) for men and 55 to 59 Years (39 | 16.1%) for women.
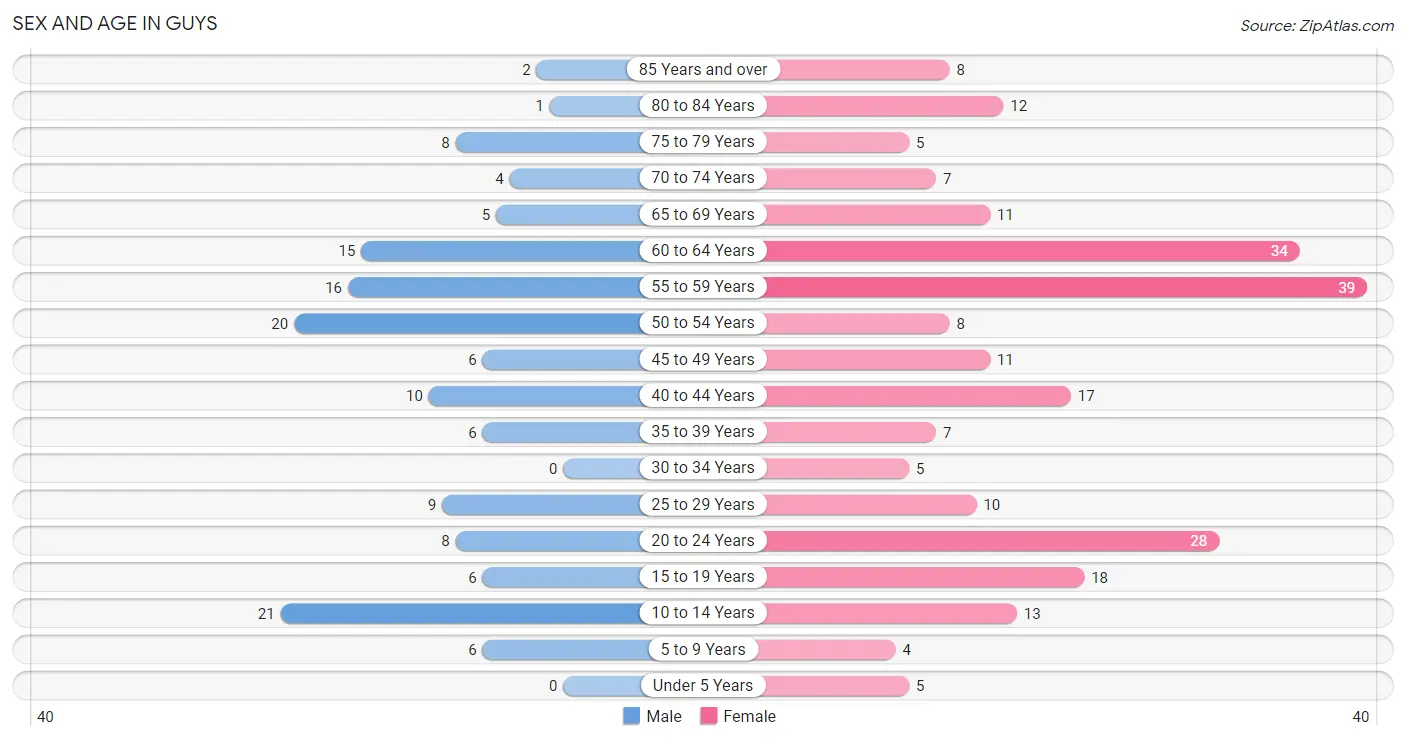
| Age Bracket | Male | Female |
| Under 5 Years | 0 (0.0%) | 5 (2.1%) |
| 5 to 9 Years | 6 (4.2%) | 4 (1.7%) |
| 10 to 14 Years | 21 (14.7%) | 13 (5.4%) |
| 15 to 19 Years | 6 (4.2%) | 18 (7.4%) |
| 20 to 24 Years | 8 (5.6%) | 28 (11.6%) |
| 25 to 29 Years | 9 (6.3%) | 10 (4.1%) |
| 30 to 34 Years | 0 (0.0%) | 5 (2.1%) |
| 35 to 39 Years | 6 (4.2%) | 7 (2.9%) |
| 40 to 44 Years | 10 (7.0%) | 17 (7.0%) |
| 45 to 49 Years | 6 (4.2%) | 11 (4.5%) |
| 50 to 54 Years | 20 (14.0%) | 8 (3.3%) |
| 55 to 59 Years | 16 (11.2%) | 39 (16.1%) |
| 60 to 64 Years | 15 (10.5%) | 34 (14.1%) |
| 65 to 69 Years | 5 (3.5%) | 11 (4.5%) |
| 70 to 74 Years | 4 (2.8%) | 7 (2.9%) |
| 75 to 79 Years | 8 (5.6%) | 5 (2.1%) |
| 80 to 84 Years | 1 (0.7%) | 12 (5.0%) |
| 85 Years and over | 2 (1.4%) | 8 (3.3%) |
| Total | 143 (100.0%) | 242 (100.0%) |
Families and Households in Guys
Median Family Size in Guys
The median family size in Guys is 2.99 persons per family, with single male/father families (1 | 1.0%) accounting for the largest median family size of 4 persons per family. On the other hand, single female/mother families (34 | 34.3%) represent the smallest median family size with 2.59 persons per family.
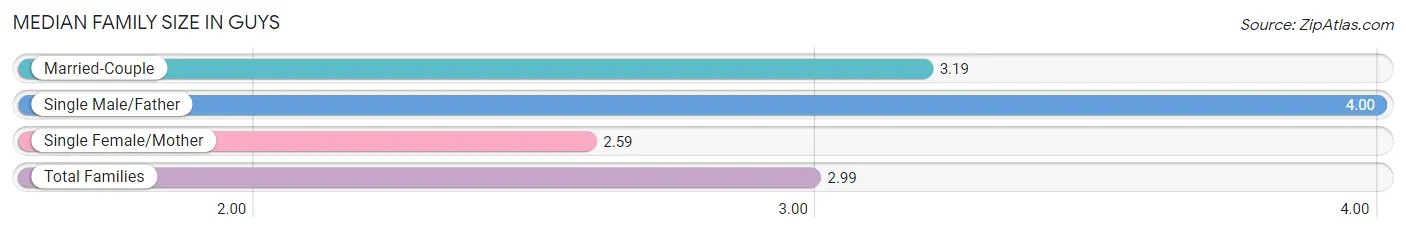
| Family Type | # Families | Family Size |
| Married-Couple | 64 (64.6%) | 3.19 |
| Single Male/Father | 1 (1.0%) | 4.00 |
| Single Female/Mother | 34 (34.3%) | 2.59 |
| Total Families | 99 (100.0%) | 2.99 |
Median Household Size in Guys
The median household size in Guys is 2.26 persons per household, with single male/father households (1 | 0.6%) accounting for the largest median household size of 4 persons per household. non-family households (71 | 41.8%) represent the smallest median household size with 1.10 persons per household.
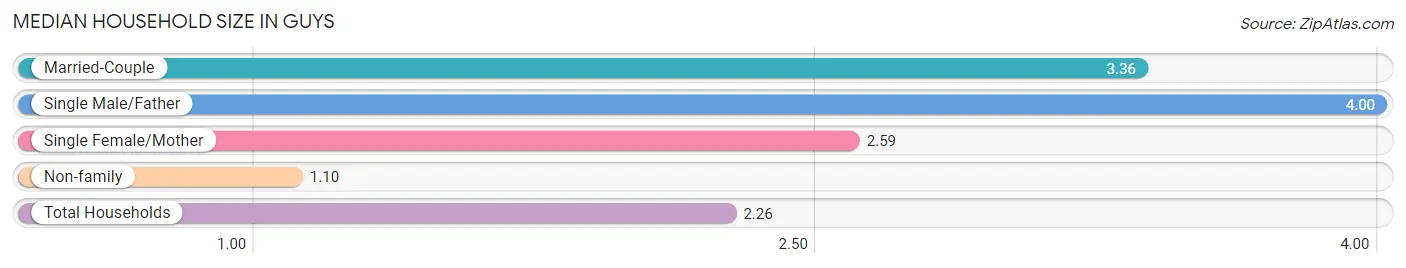
| Household Type | # Households | Household Size |
| Married-Couple | 64 (37.7%) | 3.36 |
| Single Male/Father | 1 (0.6%) | 4.00 |
| Single Female/Mother | 34 (20.0%) | 2.59 |
| Non-family | 71 (41.8%) | 1.10 |
| Total Households | 170 (100.0%) | 2.26 |
Household Size by Marriage Status in Guys
Out of a total of 170 households in Guys, 99 (58.2%) are family households, while 71 (41.8%) are nonfamily households. The most numerous type of family households are 2-person households, comprising 59, and the most common type of nonfamily households are 1-person households, comprising 66.
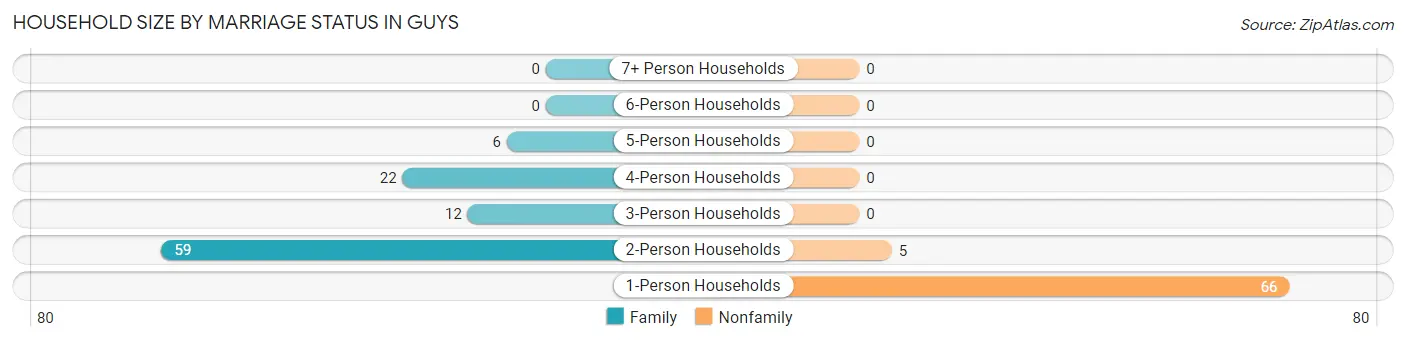
| Household Size | Family Households | Nonfamily Households |
| 1-Person Households | - | 66 (38.8%) |
| 2-Person Households | 59 (34.7%) | 5 (2.9%) |
| 3-Person Households | 12 (7.1%) | 0 (0.0%) |
| 4-Person Households | 22 (12.9%) | 0 (0.0%) |
| 5-Person Households | 6 (3.5%) | 0 (0.0%) |
| 6-Person Households | 0 (0.0%) | 0 (0.0%) |
| 7+ Person Households | 0 (0.0%) | 0 (0.0%) |
| Total | 99 (58.2%) | 71 (41.8%) |
Female Fertility in Guys
Fertility by Age in Guys
| Age Bracket | Women with Births | Births / 1,000 Women |
| 15 to 19 years | 0 (0.0%) | 0.0 |
| 20 to 34 years | 0 (0.0%) | 0.0 |
| 35 to 50 years | 0 (0.0%) | 0.0 |
| Total | 0 (0.0%) | 0.0 |
Fertility by Age by Marriage Status in Guys
| Age Bracket | Married | Unmarried |
| 15 to 19 years | 0 (0.0%) | 0 (0.0%) |
| 20 to 34 years | 0 (0.0%) | 0 (0.0%) |
| 35 to 50 years | 0 (0.0%) | 0 (0.0%) |
| Total | 0 (0.0%) | 0 (0.0%) |
Fertility by Education in Guys
| Educational Attainment | Women with Births | Births / 1,000 Women |
| Less than High School | 0 (0.0%) | 0.0 |
| High School Diploma | 0 (0.0%) | 0.0 |
| College or Associate's Degree | 0 (0.0%) | 0.0 |
| Bachelor's Degree | 0 (0.0%) | 0.0 |
| Graduate Degree | 0 (0.0%) | 0.0 |
| Total | 0 (0.0%) | 0.0 |
Fertility by Education by Marriage Status in Guys
| Educational Attainment | Married | Unmarried |
| Less than High School | 0 (0.0%) | 0 (0.0%) |
| High School Diploma | 0 (0.0%) | 0 (0.0%) |
| College or Associate's Degree | 0 (0.0%) | 0 (0.0%) |
| Bachelor's Degree | 0 (0.0%) | 0 (0.0%) |
| Graduate Degree | 0 (0.0%) | 0 (0.0%) |
| Total | 0 (0.0%) | 0 (0.0%) |
Employment Characteristics in Guys
Employment by Class of Employer in Guys
Among the 157 employed individuals in Guys, private company employees (119 | 75.8%), local government employees (16 | 10.2%), and state government employees (6 | 3.8%) make up the most common classes of employment.
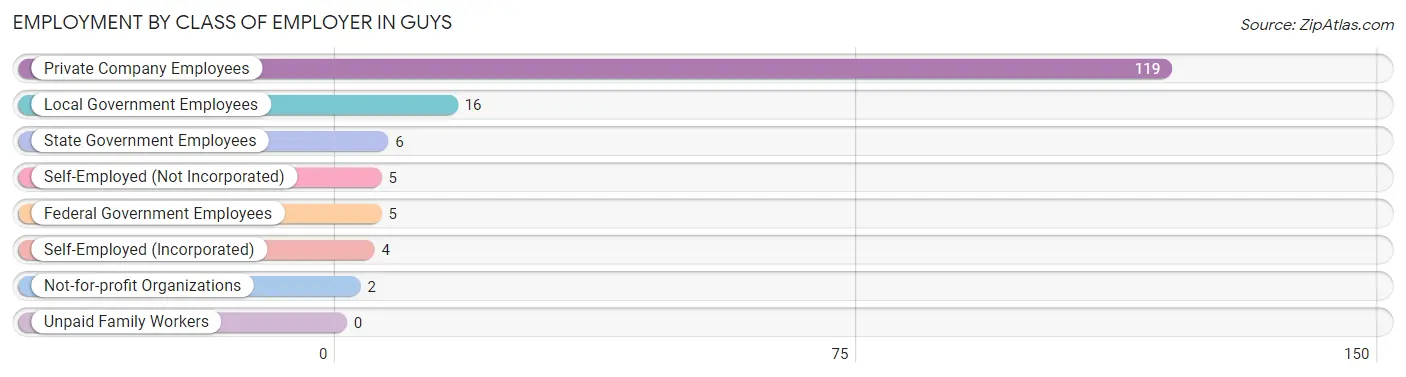
| Employer Class | # Employees | % Employees |
| Private Company Employees | 119 | 75.8% |
| Self-Employed (Incorporated) | 4 | 2.5% |
| Self-Employed (Not Incorporated) | 5 | 3.2% |
| Not-for-profit Organizations | 2 | 1.3% |
| Local Government Employees | 16 | 10.2% |
| State Government Employees | 6 | 3.8% |
| Federal Government Employees | 5 | 3.2% |
| Unpaid Family Workers | 0 | 0.0% |
| Total | 157 | 100.0% |
Employment Status by Age in Guys
According to the labor force statistics for Guys, out of the total population over 16 years of age (336), 56.0% or 188 individuals are in the labor force, with 12.8% or 24 of them unemployed. The age group with the highest labor force participation rate is 30 to 34 years, with 100.0% or 5 individuals in the labor force. Within the labor force, the 20 to 24 years age range has the highest percentage of unemployed individuals, with 85.2% or 23 of them being unemployed.
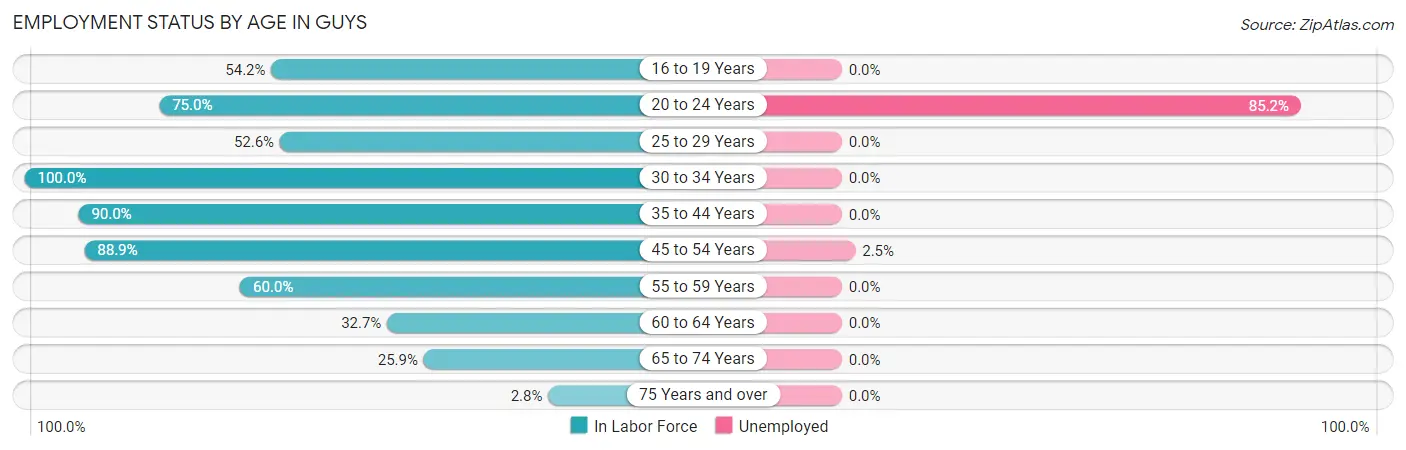
| Age Bracket | In Labor Force | Unemployed |
| 16 to 19 Years | 13 (54.2%) | 0 (0.0%) |
| 20 to 24 Years | 27 (75.0%) | 23 (85.2%) |
| 25 to 29 Years | 10 (52.6%) | 0 (0.0%) |
| 30 to 34 Years | 5 (100.0%) | 0 (0.0%) |
| 35 to 44 Years | 36 (90.0%) | 0 (0.0%) |
| 45 to 54 Years | 40 (88.9%) | 1 (2.5%) |
| 55 to 59 Years | 33 (60.0%) | 0 (0.0%) |
| 60 to 64 Years | 16 (32.7%) | 0 (0.0%) |
| 65 to 74 Years | 7 (25.9%) | 0 (0.0%) |
| 75 Years and over | 1 (2.8%) | 0 (0.0%) |
| Total | 188 (56.0%) | 24 (12.8%) |
Employment Status by Educational Attainment in Guys
According to labor force statistics for Guys, 65.7% of individuals (140) out of the total population between 25 and 64 years of age (213) are in the labor force, with 0.7% or 1 of them being unemployed. The group with the highest labor force participation rate are those with the educational attainment of bachelor's degree or higher, with 75.0% or 9 individuals in the labor force. Within the labor force, individuals with bachelor's degree or higher education have the highest percentage of unemployment, with 11.1% or 1 of them being unemployed.
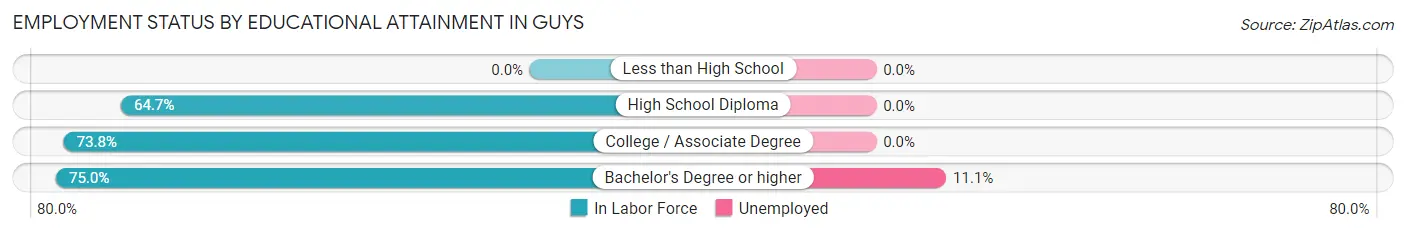
| Educational Attainment | In Labor Force | Unemployed |
| Less than High School | 0 (0.0%) | 0 (0.0%) |
| High School Diploma | 86 (64.7%) | 0 (0.0%) |
| College / Associate Degree | 45 (73.8%) | 0 (0.0%) |
| Bachelor's Degree or higher | 9 (75.0%) | 1 (11.1%) |
| Total | 140 (65.7%) | 1 (0.7%) |
Employment Occupations by Sex in Guys
Management, Business, Science and Arts Occupations
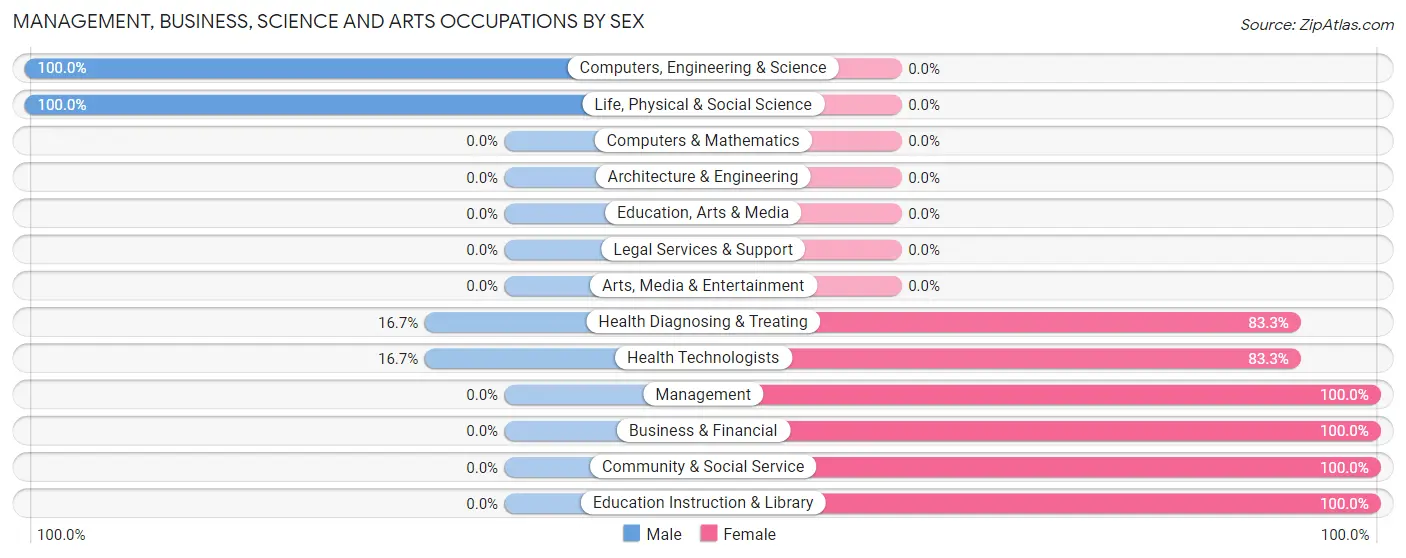
The most common Management, Business, Science and Arts occupations in Guys are Community & Social Service (10 | 6.1%), Education Instruction & Library (10 | 6.1%), Health Diagnosing & Treating (6 | 3.7%), Health Technologists (6 | 3.7%), and Management (4 | 2.4%).
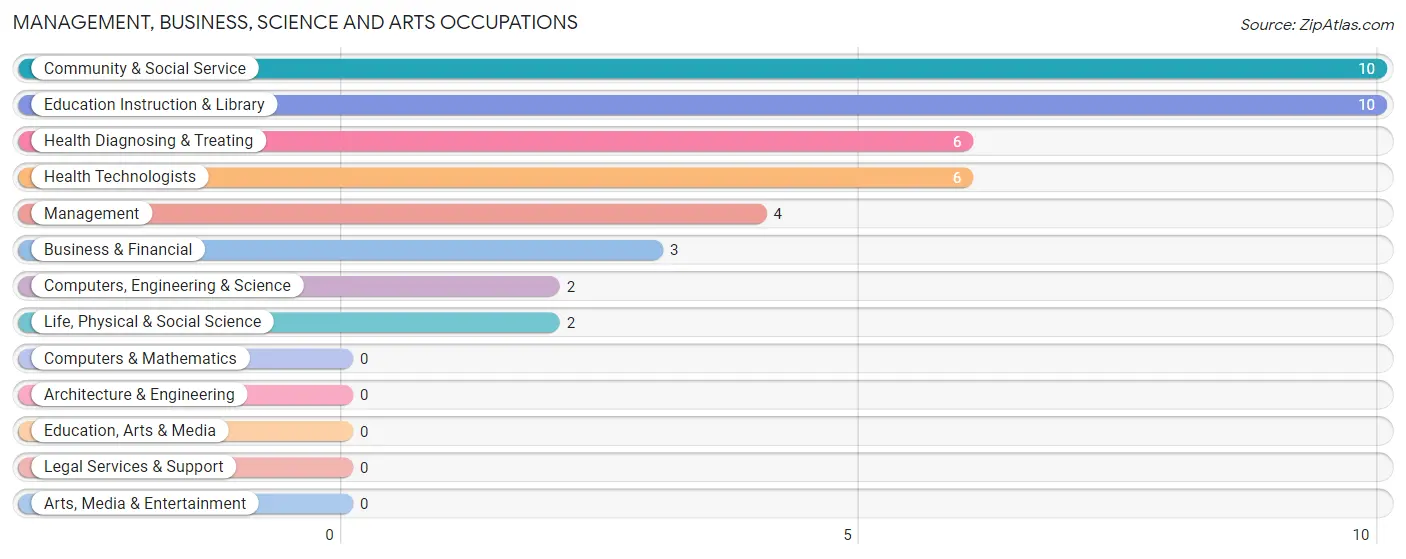
Management, Business, Science and Arts Occupations by Sex
Within the Management, Business, Science and Arts occupations in Guys, the most male-oriented occupations are Computers, Engineering & Science (100.0%), Life, Physical & Social Science (100.0%), and Health Diagnosing & Treating (16.7%), while the most female-oriented occupations are Management (100.0%), Business & Financial (100.0%), and Community & Social Service (100.0%).
| Occupation | Male | Female |
| Management | 0 (0.0%) | 4 (100.0%) |
| Business & Financial | 0 (0.0%) | 3 (100.0%) |
| Computers, Engineering & Science | 2 (100.0%) | 0 (0.0%) |
| Computers & Mathematics | 0 (0.0%) | 0 (0.0%) |
| Architecture & Engineering | 0 (0.0%) | 0 (0.0%) |
| Life, Physical & Social Science | 2 (100.0%) | 0 (0.0%) |
| Community & Social Service | 0 (0.0%) | 10 (100.0%) |
| Education, Arts & Media | 0 (0.0%) | 0 (0.0%) |
| Legal Services & Support | 0 (0.0%) | 0 (0.0%) |
| Education Instruction & Library | 0 (0.0%) | 10 (100.0%) |
| Arts, Media & Entertainment | 0 (0.0%) | 0 (0.0%) |
| Health Diagnosing & Treating | 1 (16.7%) | 5 (83.3%) |
| Health Technologists | 1 (16.7%) | 5 (83.3%) |
| Total (Category) | 3 (12.0%) | 22 (88.0%) |
| Total (Overall) | 75 (45.7%) | 89 (54.3%) |
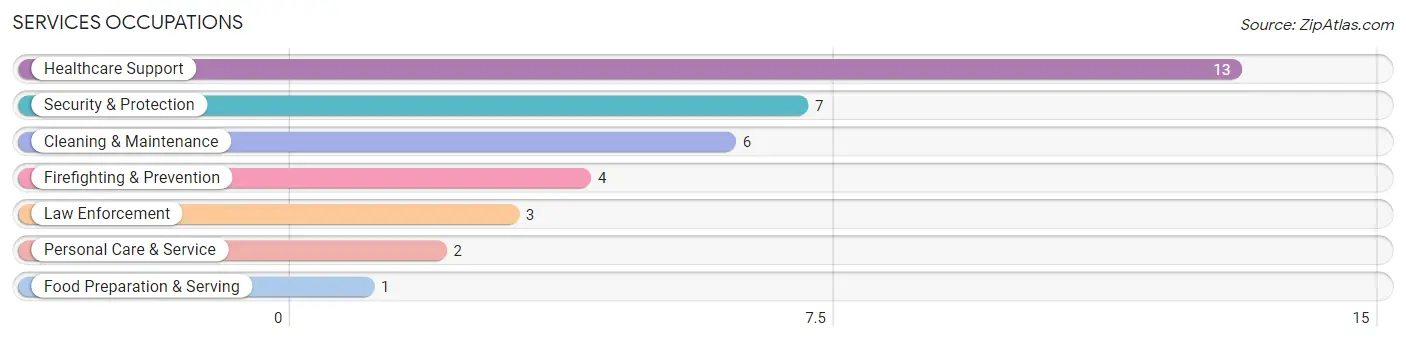
Services Occupations
The most common Services occupations in Guys are Healthcare Support (13 | 7.9%), Security & Protection (7 | 4.3%), Cleaning & Maintenance (6 | 3.7%), Firefighting & Prevention (4 | 2.4%), and Law Enforcement (3 | 1.8%).
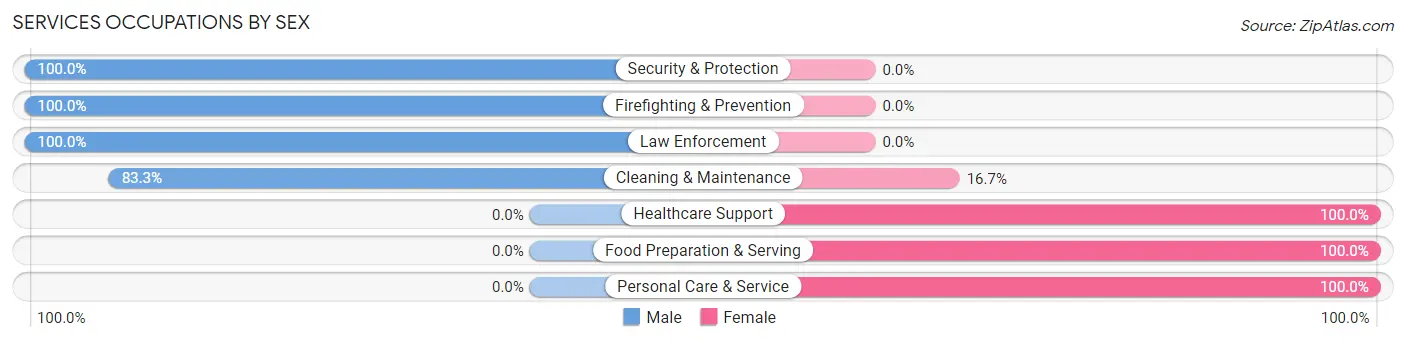
Services Occupations by Sex
Within the Services occupations in Guys, the most male-oriented occupations are Security & Protection (100.0%), Firefighting & Prevention (100.0%), and Law Enforcement (100.0%), while the most female-oriented occupations are Healthcare Support (100.0%), Food Preparation & Serving (100.0%), and Personal Care & Service (100.0%).
| Occupation | Male | Female |
| Healthcare Support | 0 (0.0%) | 13 (100.0%) |
| Security & Protection | 7 (100.0%) | 0 (0.0%) |
| Firefighting & Prevention | 4 (100.0%) | 0 (0.0%) |
| Law Enforcement | 3 (100.0%) | 0 (0.0%) |
| Food Preparation & Serving | 0 (0.0%) | 1 (100.0%) |
| Cleaning & Maintenance | 5 (83.3%) | 1 (16.7%) |
| Personal Care & Service | 0 (0.0%) | 2 (100.0%) |
| Total (Category) | 12 (41.4%) | 17 (58.6%) |
| Total (Overall) | 75 (45.7%) | 89 (54.3%) |
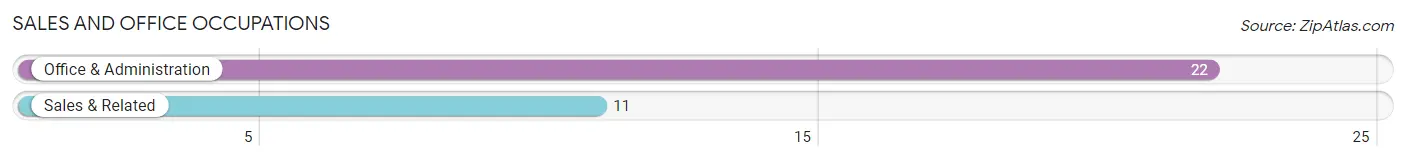
Sales and Office Occupations
The most common Sales and Office occupations in Guys are Office & Administration (22 | 13.4%), and Sales & Related (11 | 6.7%).
Sales and Office Occupations by Sex
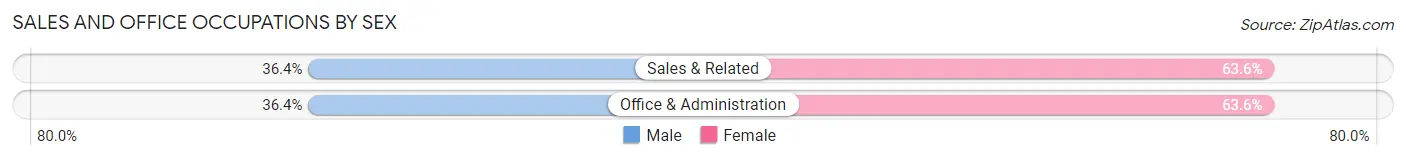
| Occupation | Male | Female |
| Sales & Related | 4 (36.4%) | 7 (63.6%) |
| Office & Administration | 8 (36.4%) | 14 (63.6%) |
| Total (Category) | 12 (36.4%) | 21 (63.6%) |
| Total (Overall) | 75 (45.7%) | 89 (54.3%) |
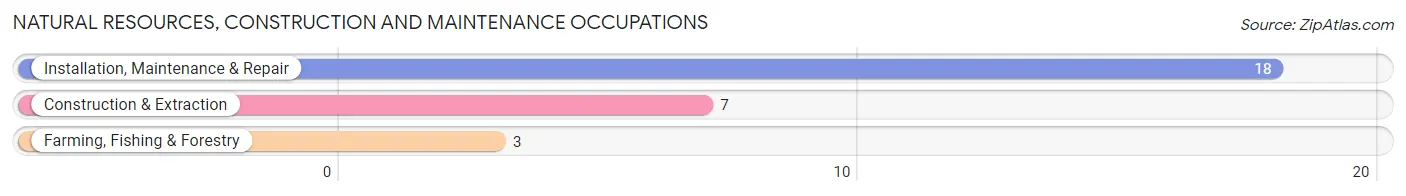
Natural Resources, Construction and Maintenance Occupations
The most common Natural Resources, Construction and Maintenance occupations in Guys are Installation, Maintenance & Repair (18 | 11.0%), Construction & Extraction (7 | 4.3%), and Farming, Fishing & Forestry (3 | 1.8%).
Natural Resources, Construction and Maintenance Occupations by Sex
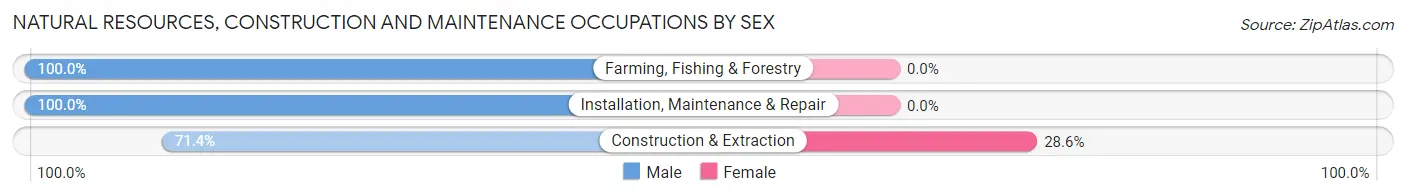
| Occupation | Male | Female |
| Farming, Fishing & Forestry | 3 (100.0%) | 0 (0.0%) |
| Construction & Extraction | 5 (71.4%) | 2 (28.6%) |
| Installation, Maintenance & Repair | 18 (100.0%) | 0 (0.0%) |
| Total (Category) | 26 (92.9%) | 2 (7.1%) |
| Total (Overall) | 75 (45.7%) | 89 (54.3%) |
Production, Transportation and Moving Occupations
The most common Production, Transportation and Moving occupations in Guys are Production (38 | 23.2%), Material Moving (10 | 6.1%), and Transportation (1 | 0.6%).
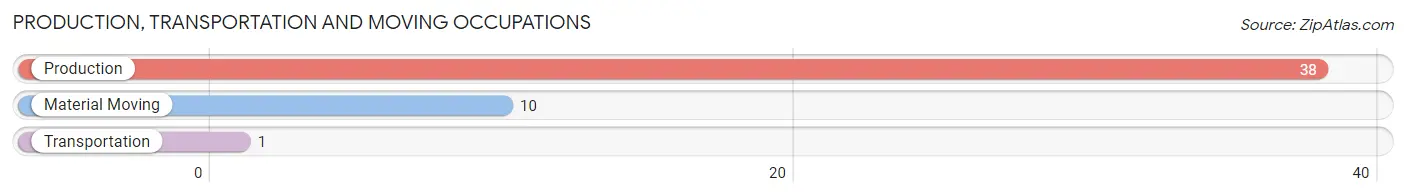
Production, Transportation and Moving Occupations by Sex
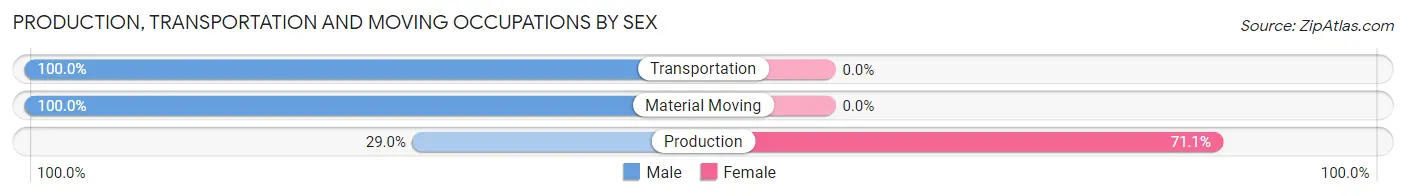
| Occupation | Male | Female |
| Production | 11 (28.9%) | 27 (71.1%) |
| Transportation | 1 (100.0%) | 0 (0.0%) |
| Material Moving | 10 (100.0%) | 0 (0.0%) |
| Total (Category) | 22 (44.9%) | 27 (55.1%) |
| Total (Overall) | 75 (45.7%) | 89 (54.3%) |
Employment Industries by Sex in Guys
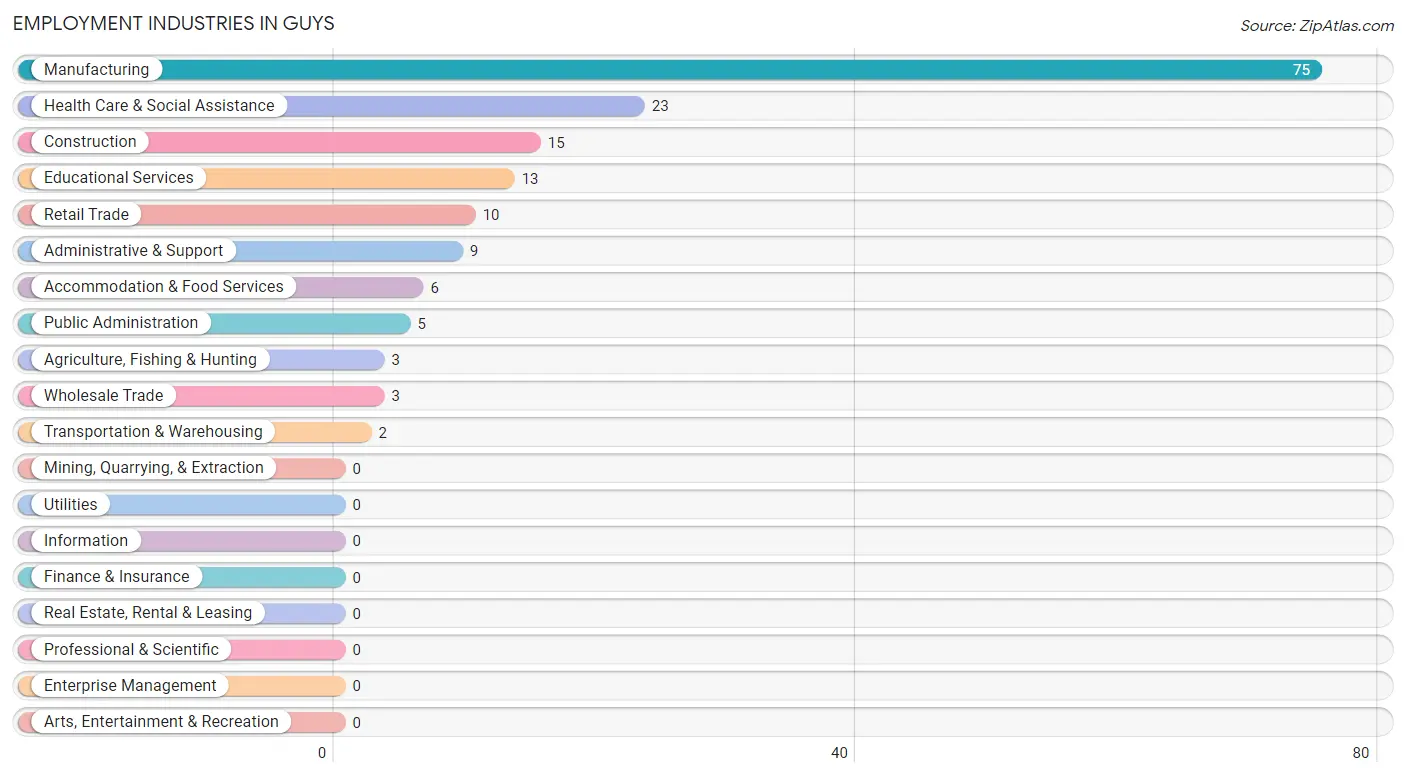
Employment Industries in Guys
The major employment industries in Guys include Manufacturing (75 | 45.7%), Health Care & Social Assistance (23 | 14.0%), Construction (15 | 9.1%), Educational Services (13 | 7.9%), and Retail Trade (10 | 6.1%).
Employment Industries by Sex in Guys
The Guys industries that see more men than women are Agriculture, Fishing & Hunting (100.0%), Administrative & Support (88.9%), and Construction (73.3%), whereas the industries that tend to have a higher number of women are Transportation & Warehousing (100.0%), Accommodation & Food Services (100.0%), and Health Care & Social Assistance (91.3%).
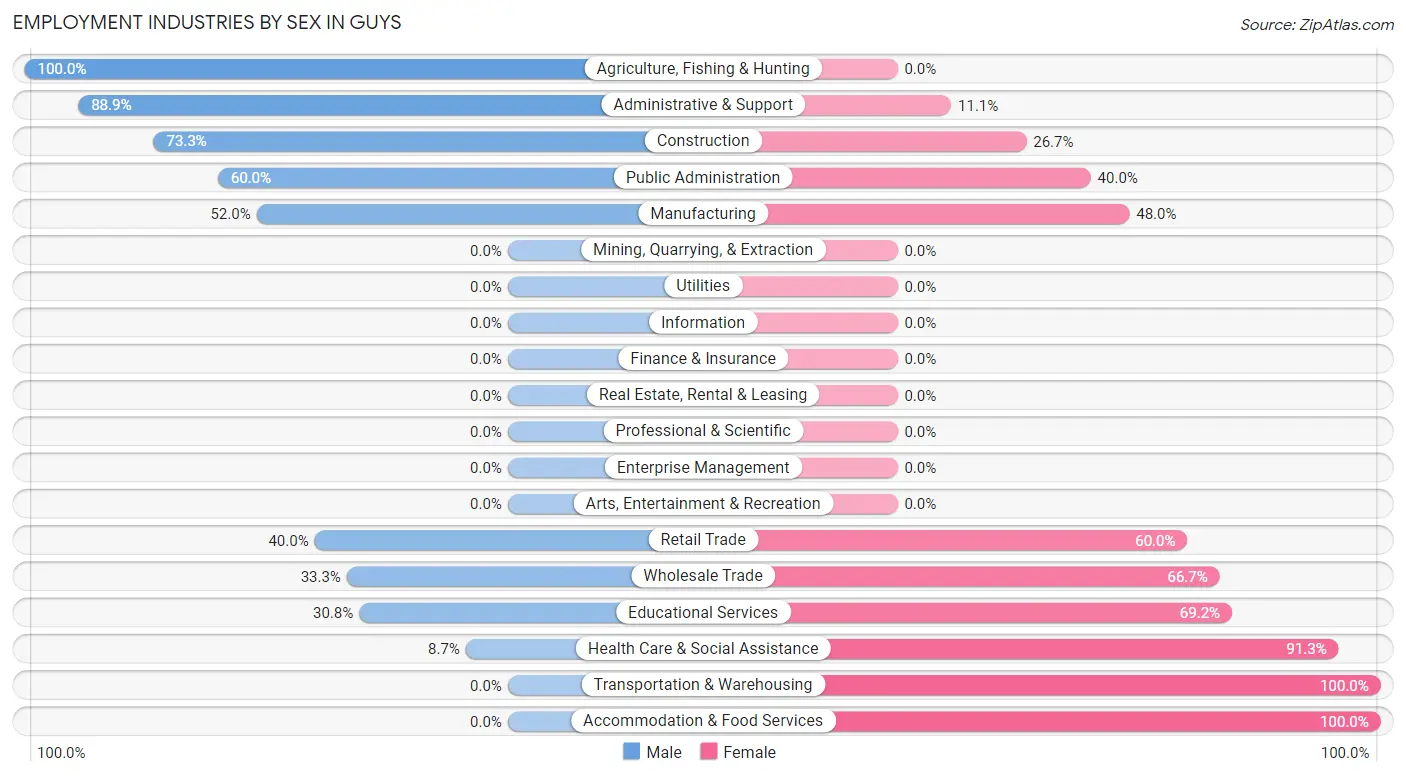
| Industry | Male | Female |
| Agriculture, Fishing & Hunting | 3 (100.0%) | 0 (0.0%) |
| Mining, Quarrying, & Extraction | 0 (0.0%) | 0 (0.0%) |
| Construction | 11 (73.3%) | 4 (26.7%) |
| Manufacturing | 39 (52.0%) | 36 (48.0%) |
| Wholesale Trade | 1 (33.3%) | 2 (66.7%) |
| Retail Trade | 4 (40.0%) | 6 (60.0%) |
| Transportation & Warehousing | 0 (0.0%) | 2 (100.0%) |
| Utilities | 0 (0.0%) | 0 (0.0%) |
| Information | 0 (0.0%) | 0 (0.0%) |
| Finance & Insurance | 0 (0.0%) | 0 (0.0%) |
| Real Estate, Rental & Leasing | 0 (0.0%) | 0 (0.0%) |
| Professional & Scientific | 0 (0.0%) | 0 (0.0%) |
| Enterprise Management | 0 (0.0%) | 0 (0.0%) |
| Administrative & Support | 8 (88.9%) | 1 (11.1%) |
| Educational Services | 4 (30.8%) | 9 (69.2%) |
| Health Care & Social Assistance | 2 (8.7%) | 21 (91.3%) |
| Arts, Entertainment & Recreation | 0 (0.0%) | 0 (0.0%) |
| Accommodation & Food Services | 0 (0.0%) | 6 (100.0%) |
| Public Administration | 3 (60.0%) | 2 (40.0%) |
| Total | 75 (45.7%) | 89 (54.3%) |
Education in Guys
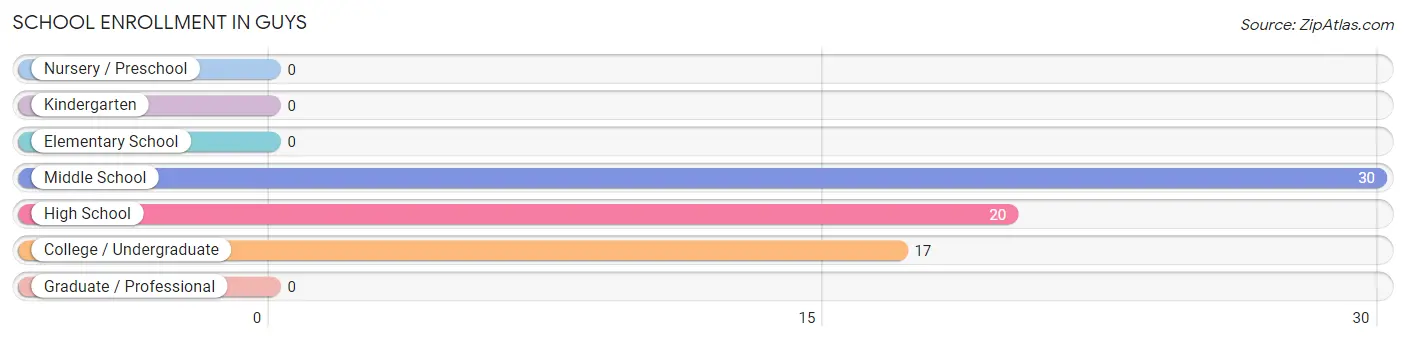
School Enrollment in Guys
The most common levels of schooling among the 67 students in Guys are middle school (30 | 44.8%), high school (20 | 29.8%), and college / undergraduate (17 | 25.4%).
| School Level | # Students | % Students |
| Nursery / Preschool | 0 | 0.0% |
| Kindergarten | 0 | 0.0% |
| Elementary School | 0 | 0.0% |
| Middle School | 30 | 44.8% |
| High School | 20 | 29.8% |
| College / Undergraduate | 17 | 25.4% |
| Graduate / Professional | 0 | 0.0% |
| Total | 67 | 100.0% |
School Enrollment by Age by Funding Source in Guys
Out of a total of 67 students who are enrolled in schools in Guys, 3 (4.5%) attend a private institution, while the remaining 64 (95.5%) are enrolled in public schools. The age group of 18 to 19 year olds has the highest likelihood of being enrolled in private schools, with 3 (42.9% in the age bracket) enrolled. Conversely, the age group of 10 to 14 year olds has the lowest likelihood of being enrolled in a private school, with 30 (100.0% in the age bracket) attending a public institution.
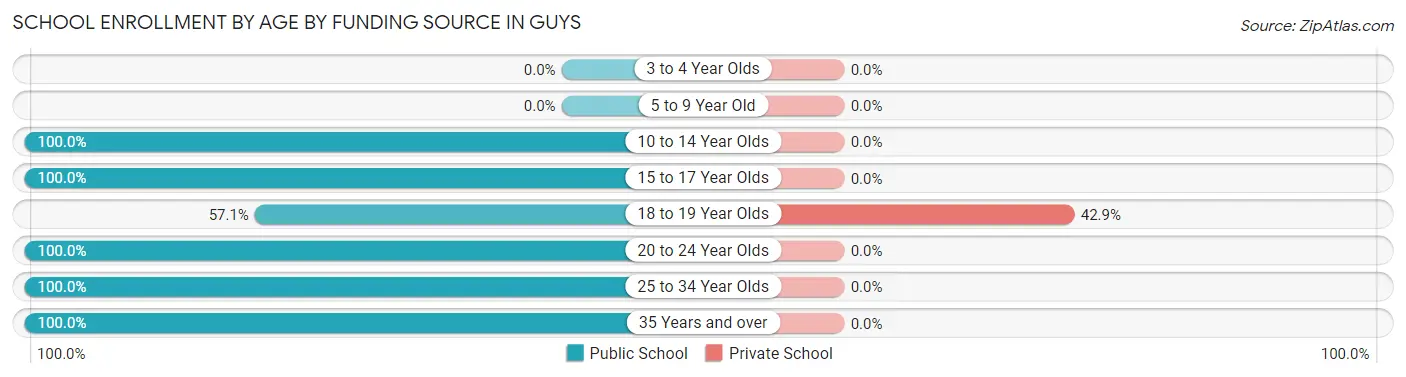
| Age Bracket | Public School | Private School |
| 3 to 4 Year Olds | 0 (0.0%) | 0 (0.0%) |
| 5 to 9 Year Old | 0 (0.0%) | 0 (0.0%) |
| 10 to 14 Year Olds | 30 (100.0%) | 0 (0.0%) |
| 15 to 17 Year Olds | 16 (100.0%) | 0 (0.0%) |
| 18 to 19 Year Olds | 4 (57.1%) | 3 (42.9%) |
| 20 to 24 Year Olds | 7 (100.0%) | 0 (0.0%) |
| 25 to 34 Year Olds | 6 (100.0%) | 0 (0.0%) |
| 35 Years and over | 1 (100.0%) | 0 (0.0%) |
| Total | 64 (95.5%) | 3 (4.5%) |
Educational Attainment by Field of Study in Guys
Education (6 | 33.3%), social sciences (4 | 22.2%), business (4 | 22.2%), psychology (2 | 11.1%), and science & technology (2 | 11.1%) are the most common fields of study among 18 individuals in Guys who have obtained a bachelor's degree or higher.
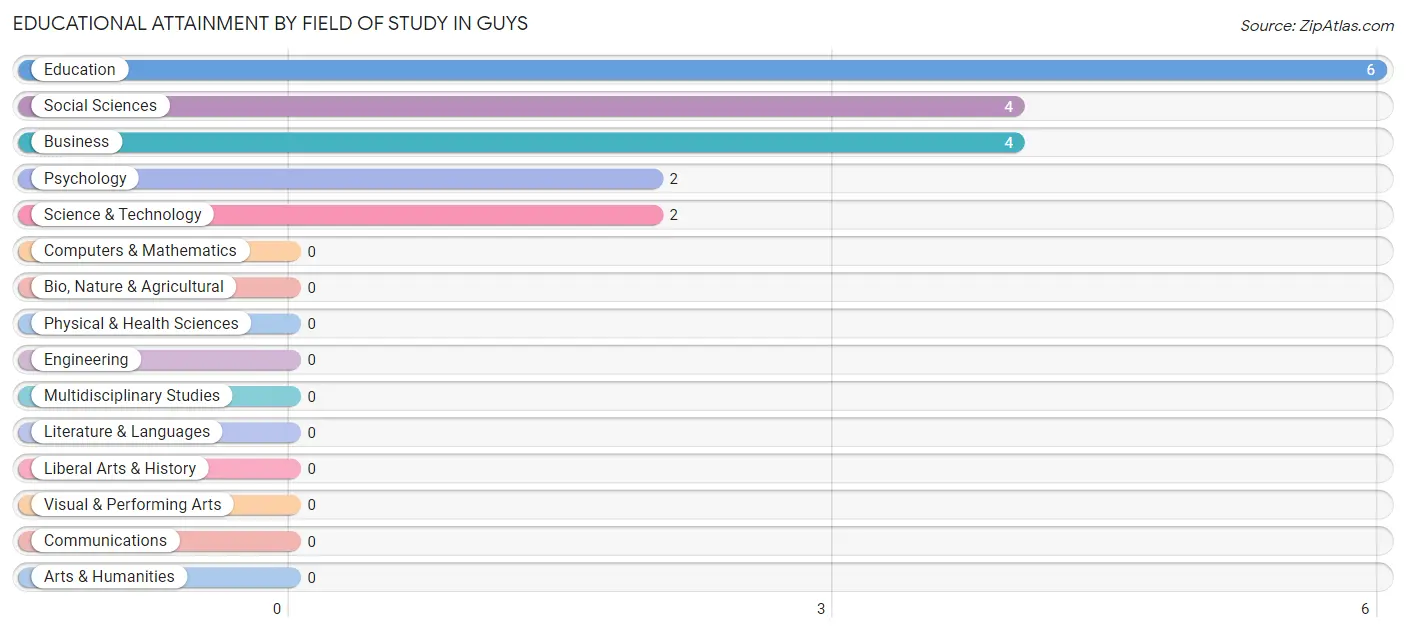
| Field of Study | # Graduates | % Graduates |
| Computers & Mathematics | 0 | 0.0% |
| Bio, Nature & Agricultural | 0 | 0.0% |
| Physical & Health Sciences | 0 | 0.0% |
| Psychology | 2 | 11.1% |
| Social Sciences | 4 | 22.2% |
| Engineering | 0 | 0.0% |
| Multidisciplinary Studies | 0 | 0.0% |
| Science & Technology | 2 | 11.1% |
| Business | 4 | 22.2% |
| Education | 6 | 33.3% |
| Literature & Languages | 0 | 0.0% |
| Liberal Arts & History | 0 | 0.0% |
| Visual & Performing Arts | 0 | 0.0% |
| Communications | 0 | 0.0% |
| Arts & Humanities | 0 | 0.0% |
| Total | 18 | 100.0% |
Transportation & Commute in Guys
Vehicle Availability by Sex in Guys
The most prevalent vehicle ownership categories in Guys are males with 2 vehicles (23, accounting for 31.9%) and females with 2 vehicles (43, making up 27.1%).
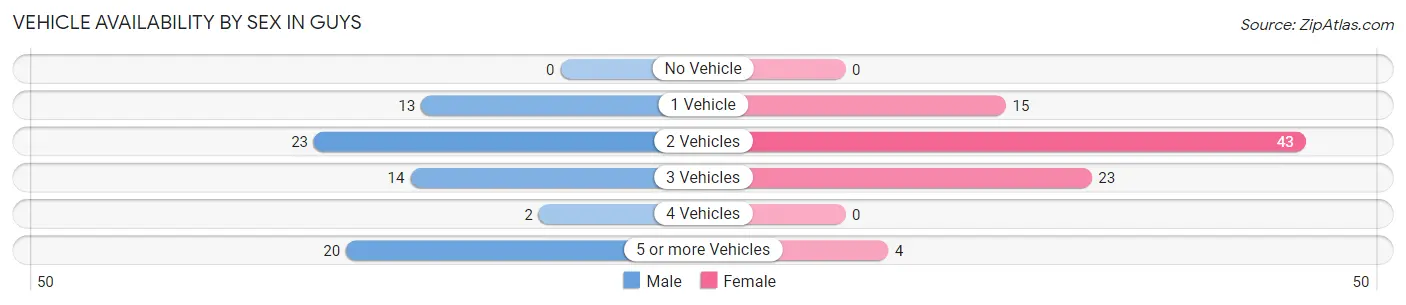
| Vehicles Available | Male | Female |
| No Vehicle | 0 (0.0%) | 0 (0.0%) |
| 1 Vehicle | 13 (18.1%) | 15 (17.6%) |
| 2 Vehicles | 23 (31.9%) | 43 (50.6%) |
| 3 Vehicles | 14 (19.4%) | 23 (27.1%) |
| 4 Vehicles | 2 (2.8%) | 0 (0.0%) |
| 5 or more Vehicles | 20 (27.8%) | 4 (4.7%) |
| Total | 72 (100.0%) | 85 (100.0%) |
Commute Time in Guys
The most frequently occuring commute durations in Guys are 15 to 19 minutes (72 commuters, 46.8%), 30 to 34 minutes (37 commuters, 24.0%), and 10 to 14 minutes (20 commuters, 13.0%).
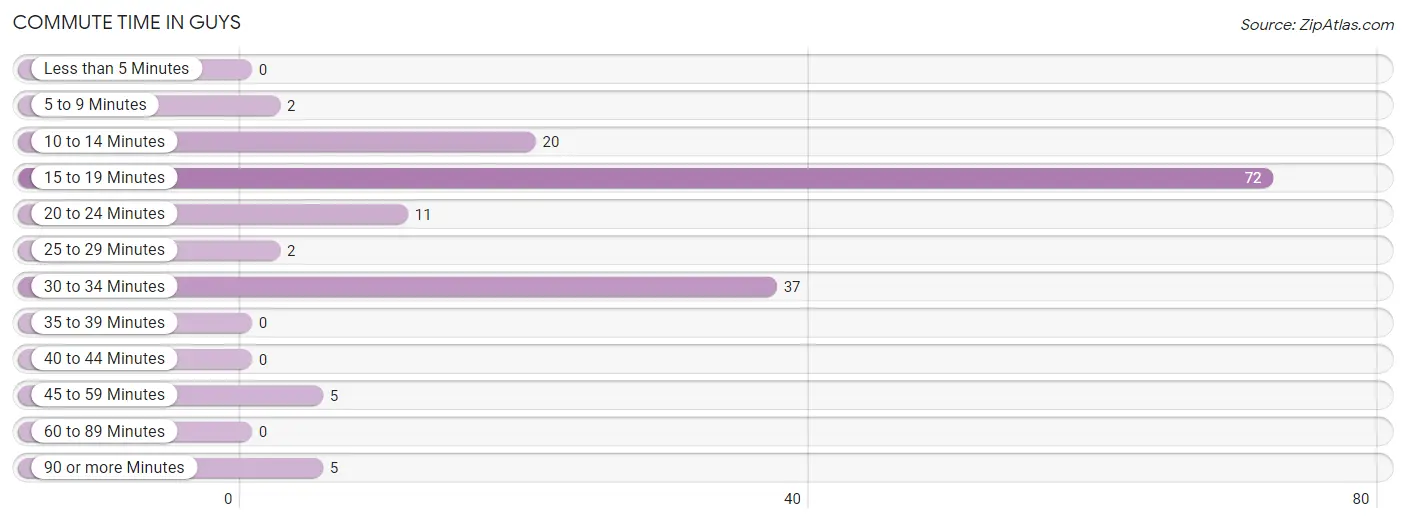
| Commute Time | # Commuters | % Commuters |
| Less than 5 Minutes | 0 | 0.0% |
| 5 to 9 Minutes | 2 | 1.3% |
| 10 to 14 Minutes | 20 | 13.0% |
| 15 to 19 Minutes | 72 | 46.8% |
| 20 to 24 Minutes | 11 | 7.1% |
| 25 to 29 Minutes | 2 | 1.3% |
| 30 to 34 Minutes | 37 | 24.0% |
| 35 to 39 Minutes | 0 | 0.0% |
| 40 to 44 Minutes | 0 | 0.0% |
| 45 to 59 Minutes | 5 | 3.3% |
| 60 to 89 Minutes | 0 | 0.0% |
| 90 or more Minutes | 5 | 3.3% |
Commute Time by Sex in Guys
The most common commute times in Guys are 15 to 19 minutes (36 commuters, 52.2%) for males and 15 to 19 minutes (36 commuters, 42.3%) for females.
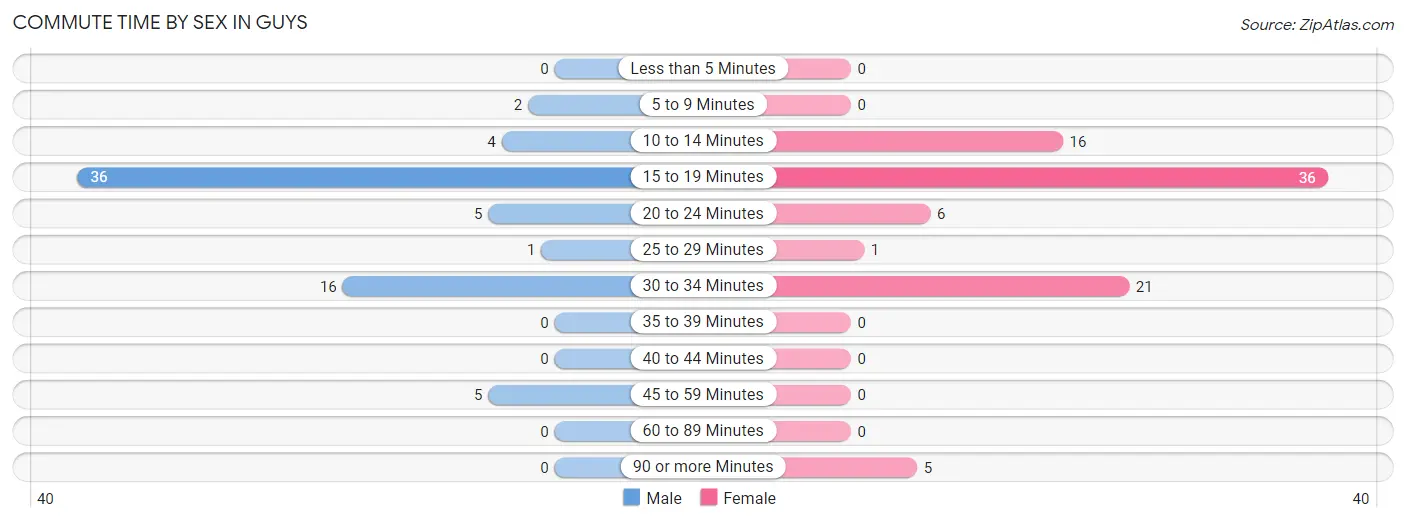
| Commute Time | Male | Female |
| Less than 5 Minutes | 0 (0.0%) | 0 (0.0%) |
| 5 to 9 Minutes | 2 (2.9%) | 0 (0.0%) |
| 10 to 14 Minutes | 4 (5.8%) | 16 (18.8%) |
| 15 to 19 Minutes | 36 (52.2%) | 36 (42.3%) |
| 20 to 24 Minutes | 5 (7.2%) | 6 (7.1%) |
| 25 to 29 Minutes | 1 (1.5%) | 1 (1.2%) |
| 30 to 34 Minutes | 16 (23.2%) | 21 (24.7%) |
| 35 to 39 Minutes | 0 (0.0%) | 0 (0.0%) |
| 40 to 44 Minutes | 0 (0.0%) | 0 (0.0%) |
| 45 to 59 Minutes | 5 (7.2%) | 0 (0.0%) |
| 60 to 89 Minutes | 0 (0.0%) | 0 (0.0%) |
| 90 or more Minutes | 0 (0.0%) | 5 (5.9%) |
Time of Departure to Work by Sex in Guys
The most frequent times of departure to work in Guys are 6:30 AM to 6:59 AM (29, 42.0%) for males and 6:30 AM to 6:59 AM (20, 23.5%) for females.
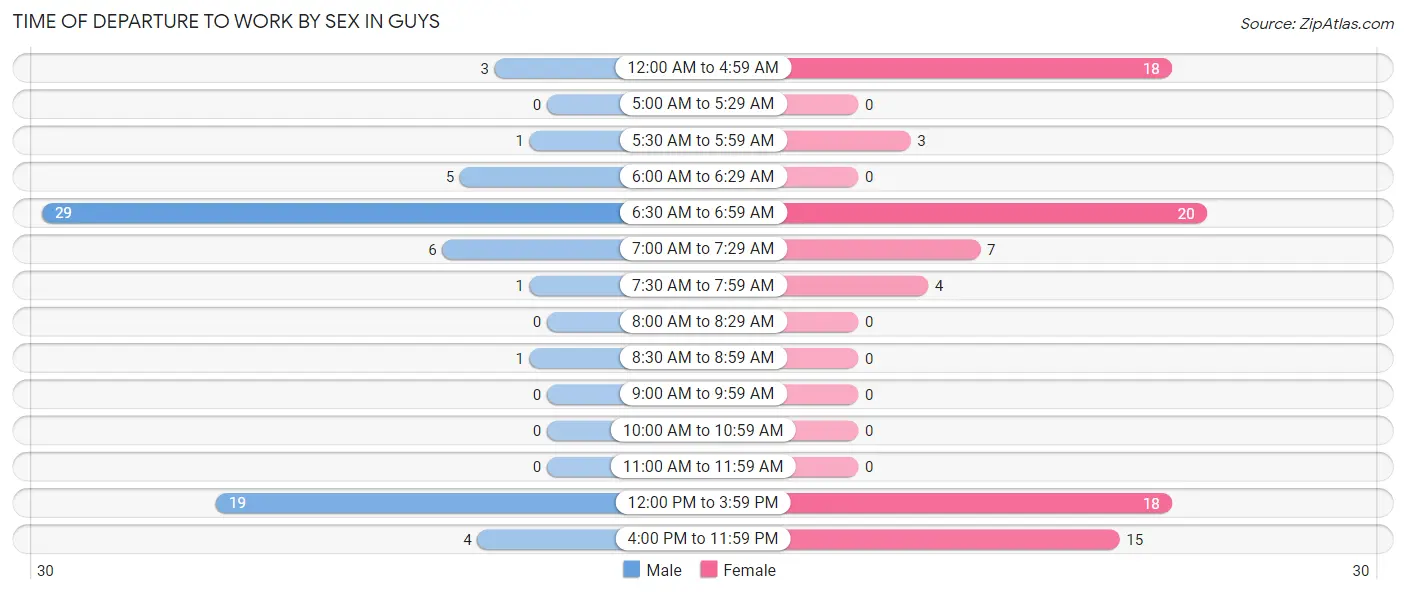
| Time of Departure | Male | Female |
| 12:00 AM to 4:59 AM | 3 (4.3%) | 18 (21.2%) |
| 5:00 AM to 5:29 AM | 0 (0.0%) | 0 (0.0%) |
| 5:30 AM to 5:59 AM | 1 (1.5%) | 3 (3.5%) |
| 6:00 AM to 6:29 AM | 5 (7.2%) | 0 (0.0%) |
| 6:30 AM to 6:59 AM | 29 (42.0%) | 20 (23.5%) |
| 7:00 AM to 7:29 AM | 6 (8.7%) | 7 (8.2%) |
| 7:30 AM to 7:59 AM | 1 (1.5%) | 4 (4.7%) |
| 8:00 AM to 8:29 AM | 0 (0.0%) | 0 (0.0%) |
| 8:30 AM to 8:59 AM | 1 (1.5%) | 0 (0.0%) |
| 9:00 AM to 9:59 AM | 0 (0.0%) | 0 (0.0%) |
| 10:00 AM to 10:59 AM | 0 (0.0%) | 0 (0.0%) |
| 11:00 AM to 11:59 AM | 0 (0.0%) | 0 (0.0%) |
| 12:00 PM to 3:59 PM | 19 (27.5%) | 18 (21.2%) |
| 4:00 PM to 11:59 PM | 4 (5.8%) | 15 (17.6%) |
| Total | 69 (100.0%) | 85 (100.0%) |
Housing Occupancy in Guys
Occupancy by Ownership in Guys
Of the total 170 dwellings in Guys, owner-occupied units account for 121 (71.2%), while renter-occupied units make up 49 (28.8%).
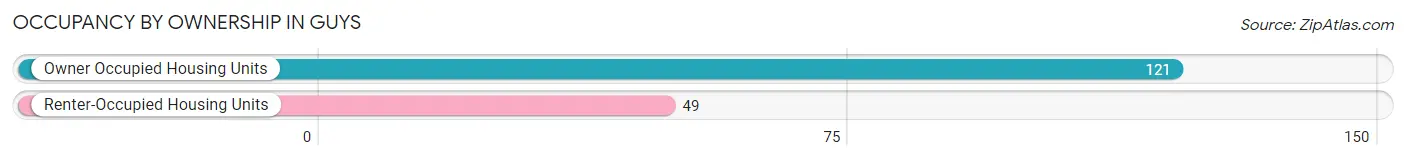
| Occupancy | # Housing Units | % Housing Units |
| Owner Occupied Housing Units | 121 | 71.2% |
| Renter-Occupied Housing Units | 49 | 28.8% |
| Total Occupied Housing Units | 170 | 100.0% |
Occupancy by Household Size in Guys
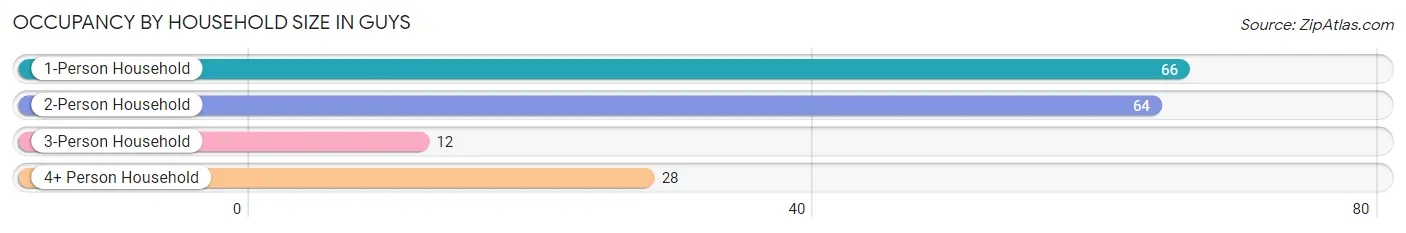
| Household Size | # Housing Units | % Housing Units |
| 1-Person Household | 66 | 38.8% |
| 2-Person Household | 64 | 37.7% |
| 3-Person Household | 12 | 7.1% |
| 4+ Person Household | 28 | 16.5% |
| Total Housing Units | 170 | 100.0% |
Occupancy by Ownership by Household Size in Guys
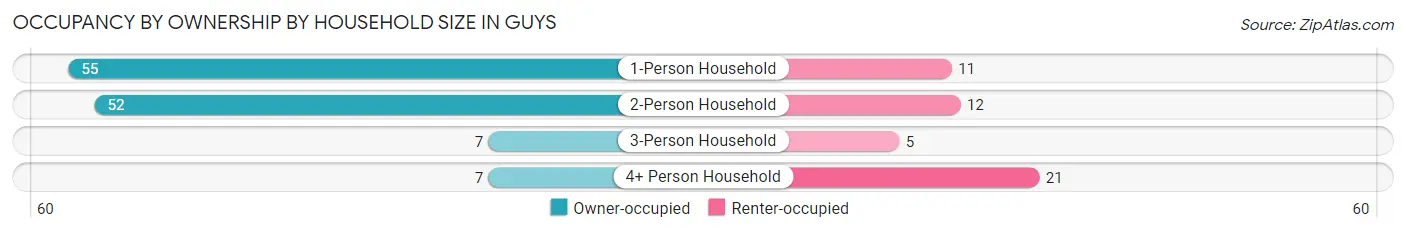
| Household Size | Owner-occupied | Renter-occupied |
| 1-Person Household | 55 (83.3%) | 11 (16.7%) |
| 2-Person Household | 52 (81.2%) | 12 (18.8%) |
| 3-Person Household | 7 (58.3%) | 5 (41.7%) |
| 4+ Person Household | 7 (25.0%) | 21 (75.0%) |
| Total Housing Units | 121 (71.2%) | 49 (28.8%) |
Occupancy by Educational Attainment in Guys
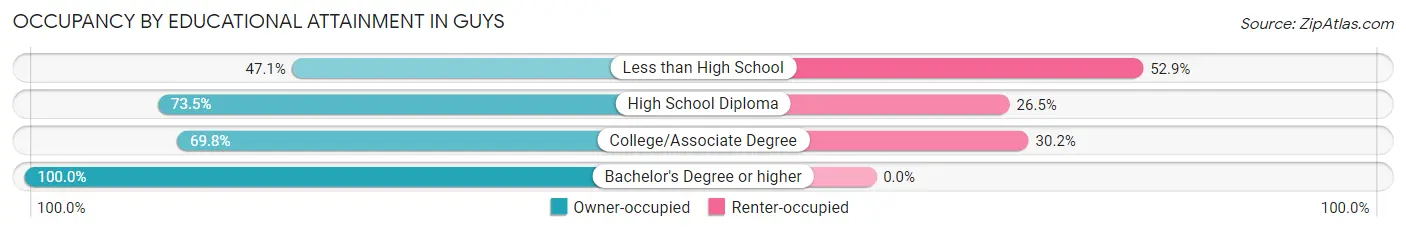
| Household Size | Owner-occupied | Renter-occupied |
| Less than High School | 8 (47.1%) | 9 (52.9%) |
| High School Diploma | 75 (73.5%) | 27 (26.5%) |
| College/Associate Degree | 30 (69.8%) | 13 (30.2%) |
| Bachelor's Degree or higher | 8 (100.0%) | 0 (0.0%) |
Occupancy by Age of Householder in Guys
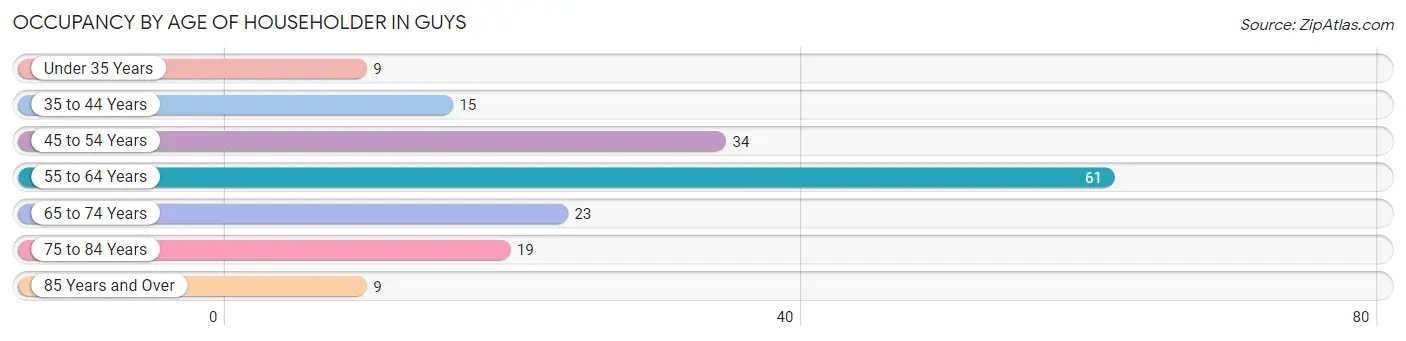
| Age Bracket | # Households | % Households |
| Under 35 Years | 9 | 5.3% |
| 35 to 44 Years | 15 | 8.8% |
| 45 to 54 Years | 34 | 20.0% |
| 55 to 64 Years | 61 | 35.9% |
| 65 to 74 Years | 23 | 13.5% |
| 75 to 84 Years | 19 | 11.2% |
| 85 Years and Over | 9 | 5.3% |
| Total | 170 | 100.0% |
Housing Finances in Guys
Median Income by Occupancy in Guys
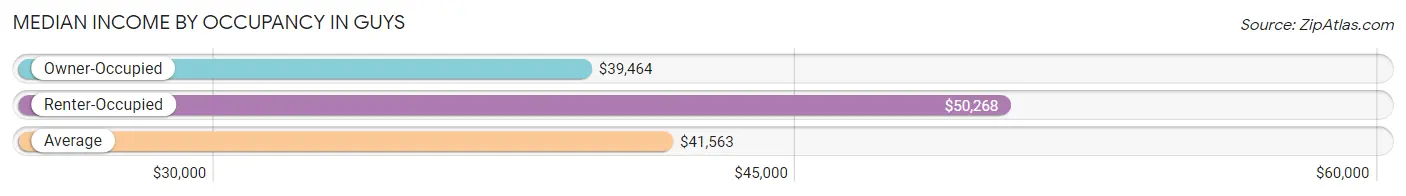
| Occupancy Type | # Households | Median Income |
| Owner-Occupied | 121 (71.2%) | $39,464 |
| Renter-Occupied | 49 (28.8%) | $50,268 |
| Average | 170 (100.0%) | $41,563 |
Occupancy by Householder Income Bracket in Guys
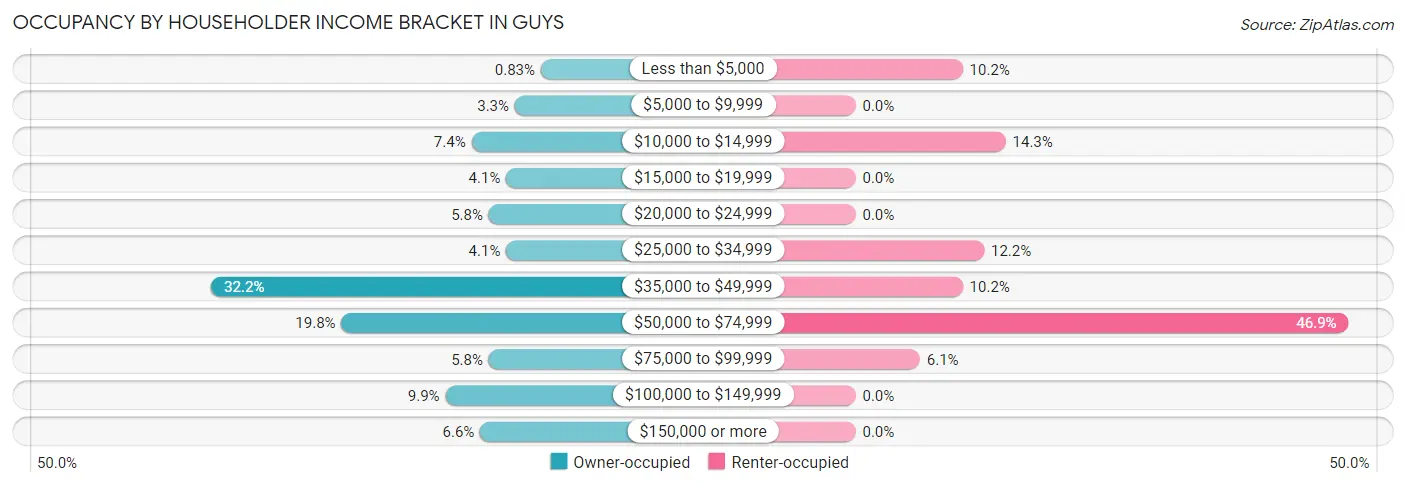
| Income Bracket | Owner-occupied | Renter-occupied |
| Less than $5,000 | 1 (0.8%) | 5 (10.2%) |
| $5,000 to $9,999 | 4 (3.3%) | 0 (0.0%) |
| $10,000 to $14,999 | 9 (7.4%) | 7 (14.3%) |
| $15,000 to $19,999 | 5 (4.1%) | 0 (0.0%) |
| $20,000 to $24,999 | 7 (5.8%) | 0 (0.0%) |
| $25,000 to $34,999 | 5 (4.1%) | 6 (12.2%) |
| $35,000 to $49,999 | 39 (32.2%) | 5 (10.2%) |
| $50,000 to $74,999 | 24 (19.8%) | 23 (46.9%) |
| $75,000 to $99,999 | 7 (5.8%) | 3 (6.1%) |
| $100,000 to $149,999 | 12 (9.9%) | 0 (0.0%) |
| $150,000 or more | 8 (6.6%) | 0 (0.0%) |
| Total | 121 (100.0%) | 49 (100.0%) |
Monthly Housing Cost Tiers in Guys
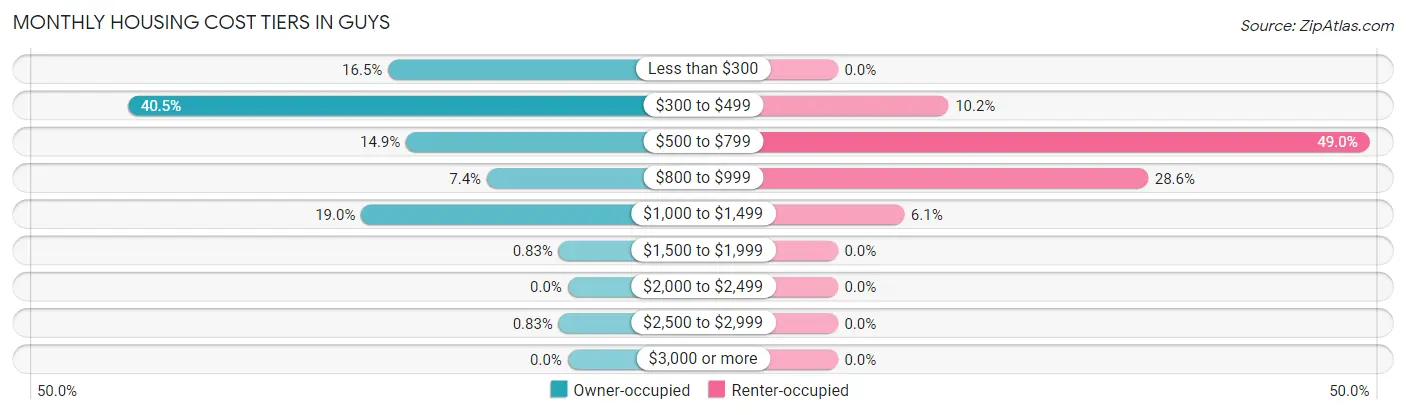
| Monthly Cost | Owner-occupied | Renter-occupied |
| Less than $300 | 20 (16.5%) | 0 (0.0%) |
| $300 to $499 | 49 (40.5%) | 5 (10.2%) |
| $500 to $799 | 18 (14.9%) | 24 (49.0%) |
| $800 to $999 | 9 (7.4%) | 14 (28.6%) |
| $1,000 to $1,499 | 23 (19.0%) | 3 (6.1%) |
| $1,500 to $1,999 | 1 (0.8%) | 0 (0.0%) |
| $2,000 to $2,499 | 0 (0.0%) | 0 (0.0%) |
| $2,500 to $2,999 | 1 (0.8%) | 0 (0.0%) |
| $3,000 or more | 0 (0.0%) | 0 (0.0%) |
| Total | 121 (100.0%) | 49 (100.0%) |
Physical Housing Characteristics in Guys
Housing Structures in Guys
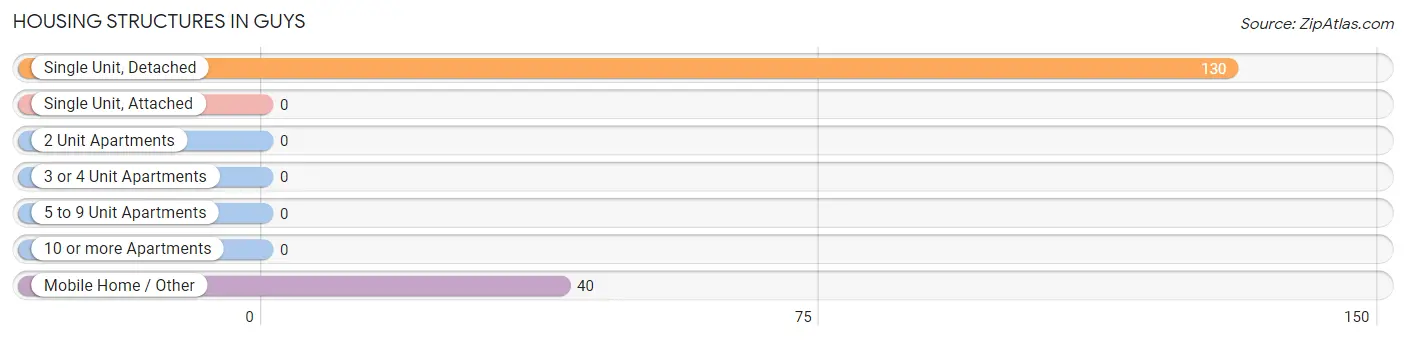
| Structure Type | # Housing Units | % Housing Units |
| Single Unit, Detached | 130 | 76.5% |
| Single Unit, Attached | 0 | 0.0% |
| 2 Unit Apartments | 0 | 0.0% |
| 3 or 4 Unit Apartments | 0 | 0.0% |
| 5 to 9 Unit Apartments | 0 | 0.0% |
| 10 or more Apartments | 0 | 0.0% |
| Mobile Home / Other | 40 | 23.5% |
| Total | 170 | 100.0% |
Housing Structures by Occupancy in Guys
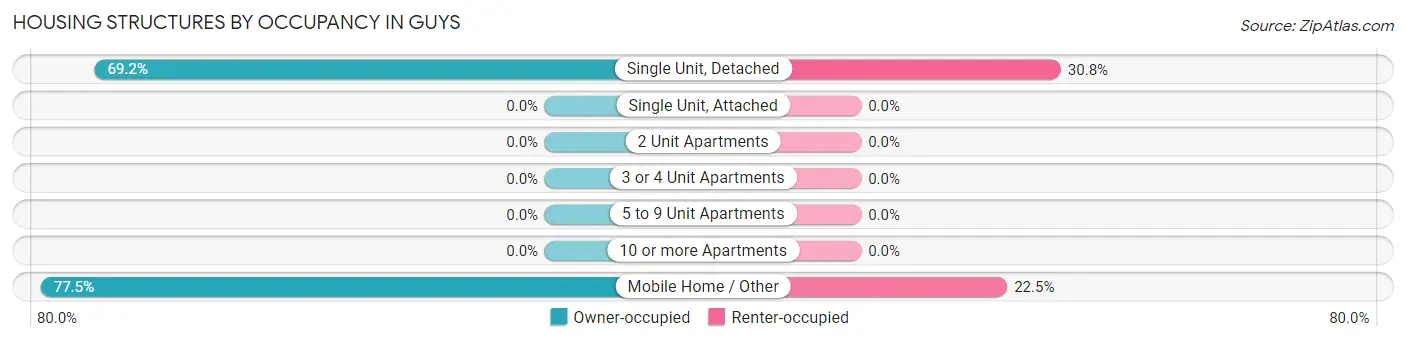
| Structure Type | Owner-occupied | Renter-occupied |
| Single Unit, Detached | 90 (69.2%) | 40 (30.8%) |
| Single Unit, Attached | 0 (0.0%) | 0 (0.0%) |
| 2 Unit Apartments | 0 (0.0%) | 0 (0.0%) |
| 3 or 4 Unit Apartments | 0 (0.0%) | 0 (0.0%) |
| 5 to 9 Unit Apartments | 0 (0.0%) | 0 (0.0%) |
| 10 or more Apartments | 0 (0.0%) | 0 (0.0%) |
| Mobile Home / Other | 31 (77.5%) | 9 (22.5%) |
| Total | 121 (71.2%) | 49 (28.8%) |
Housing Structures by Number of Rooms in Guys
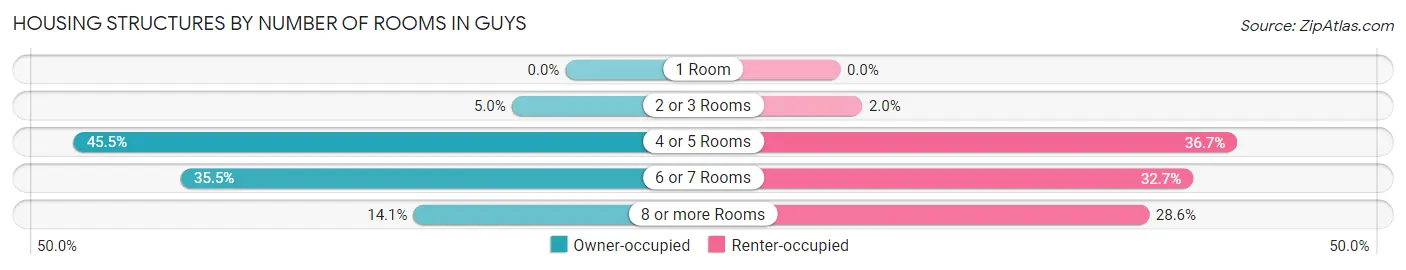
| Number of Rooms | Owner-occupied | Renter-occupied |
| 1 Room | 0 (0.0%) | 0 (0.0%) |
| 2 or 3 Rooms | 6 (5.0%) | 1 (2.0%) |
| 4 or 5 Rooms | 55 (45.5%) | 18 (36.7%) |
| 6 or 7 Rooms | 43 (35.5%) | 16 (32.7%) |
| 8 or more Rooms | 17 (14.1%) | 14 (28.6%) |
| Total | 121 (100.0%) | 49 (100.0%) |
Housing Structure by Heating Type in Guys
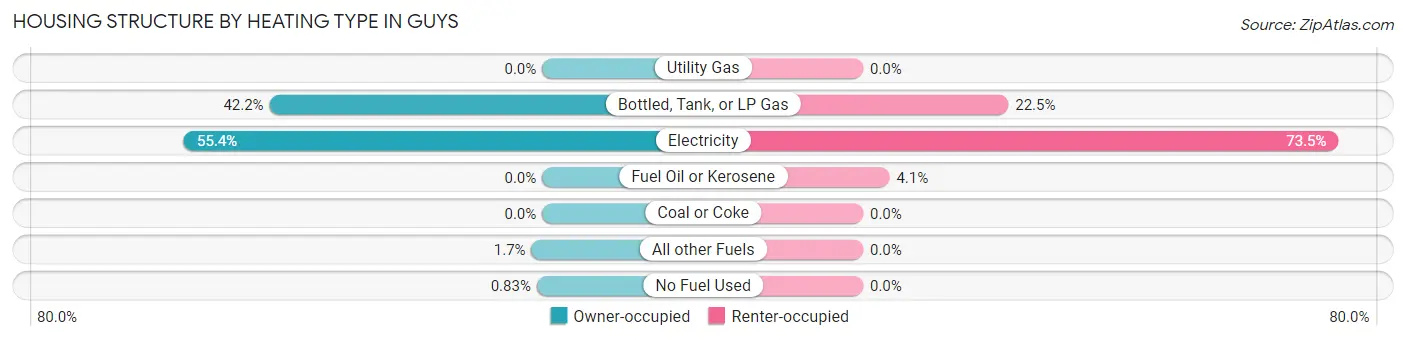
| Heating Type | Owner-occupied | Renter-occupied |
| Utility Gas | 0 (0.0%) | 0 (0.0%) |
| Bottled, Tank, or LP Gas | 51 (42.1%) | 11 (22.5%) |
| Electricity | 67 (55.4%) | 36 (73.5%) |
| Fuel Oil or Kerosene | 0 (0.0%) | 2 (4.1%) |
| Coal or Coke | 0 (0.0%) | 0 (0.0%) |
| All other Fuels | 2 (1.7%) | 0 (0.0%) |
| No Fuel Used | 1 (0.8%) | 0 (0.0%) |
| Total | 121 (100.0%) | 49 (100.0%) |
Household Vehicle Usage in Guys
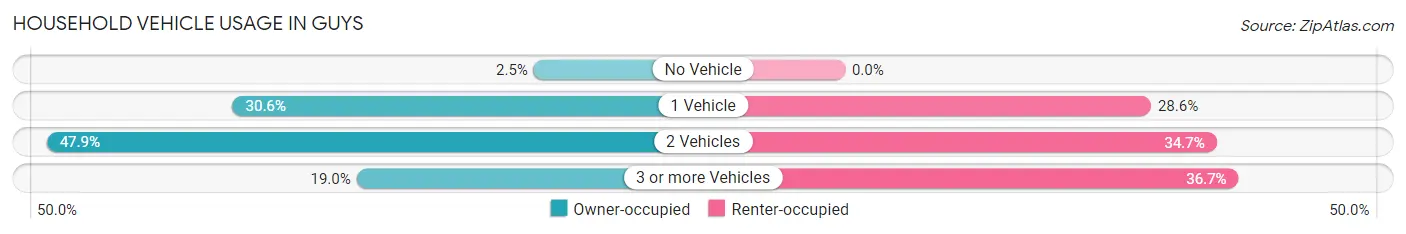
| Vehicles per Household | Owner-occupied | Renter-occupied |
| No Vehicle | 3 (2.5%) | 0 (0.0%) |
| 1 Vehicle | 37 (30.6%) | 14 (28.6%) |
| 2 Vehicles | 58 (47.9%) | 17 (34.7%) |
| 3 or more Vehicles | 23 (19.0%) | 18 (36.7%) |
| Total | 121 (100.0%) | 49 (100.0%) |
Real Estate & Mortgages in Guys
Real Estate and Mortgage Overview in Guys
| Characteristic | Without Mortgage | With Mortgage |
| Housing Units | 84 | 37 |
| Median Property Value | $133,300 | $116,900 |
| Median Household Income | $37,344 | $2 |
| Monthly Housing Costs | $426 | $0 |
| Real Estate Taxes | $378 | $3 |
Property Value by Mortgage Status in Guys
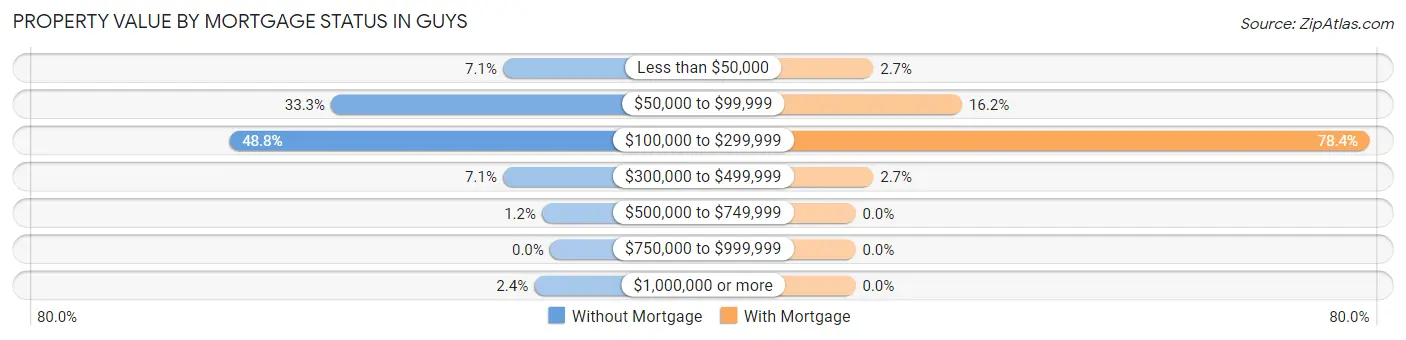
| Property Value | Without Mortgage | With Mortgage |
| Less than $50,000 | 6 (7.1%) | 1 (2.7%) |
| $50,000 to $99,999 | 28 (33.3%) | 6 (16.2%) |
| $100,000 to $299,999 | 41 (48.8%) | 29 (78.4%) |
| $300,000 to $499,999 | 6 (7.1%) | 1 (2.7%) |
| $500,000 to $749,999 | 1 (1.2%) | 0 (0.0%) |
| $750,000 to $999,999 | 0 (0.0%) | 0 (0.0%) |
| $1,000,000 or more | 2 (2.4%) | 0 (0.0%) |
| Total | 84 (100.0%) | 37 (100.0%) |
Household Income by Mortgage Status in Guys
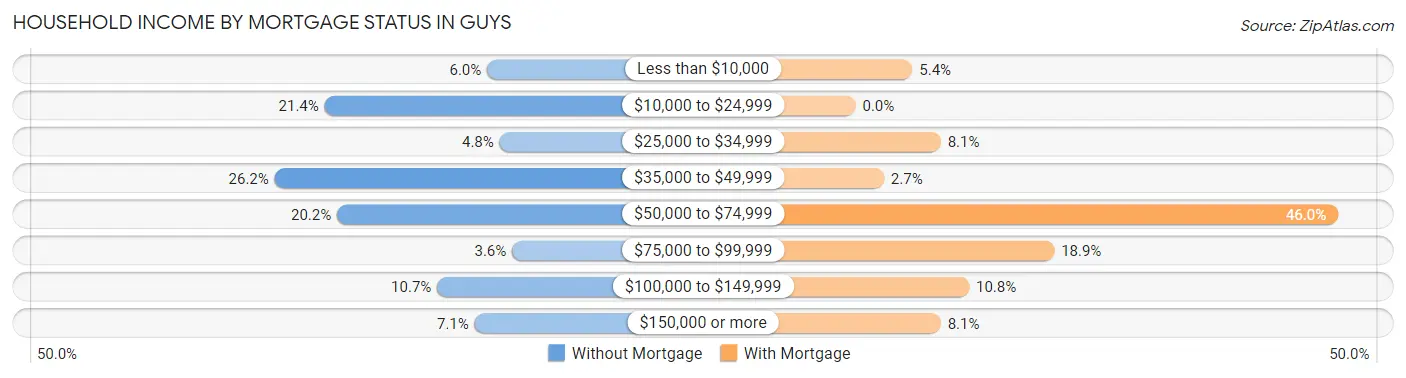
| Household Income | Without Mortgage | With Mortgage |
| Less than $10,000 | 5 (5.9%) | 2 (5.4%) |
| $10,000 to $24,999 | 18 (21.4%) | 0 (0.0%) |
| $25,000 to $34,999 | 4 (4.8%) | 3 (8.1%) |
| $35,000 to $49,999 | 22 (26.2%) | 1 (2.7%) |
| $50,000 to $74,999 | 17 (20.2%) | 17 (46.0%) |
| $75,000 to $99,999 | 3 (3.6%) | 7 (18.9%) |
| $100,000 to $149,999 | 9 (10.7%) | 4 (10.8%) |
| $150,000 or more | 6 (7.1%) | 3 (8.1%) |
| Total | 84 (100.0%) | 37 (100.0%) |
Property Value to Household Income Ratio in Guys
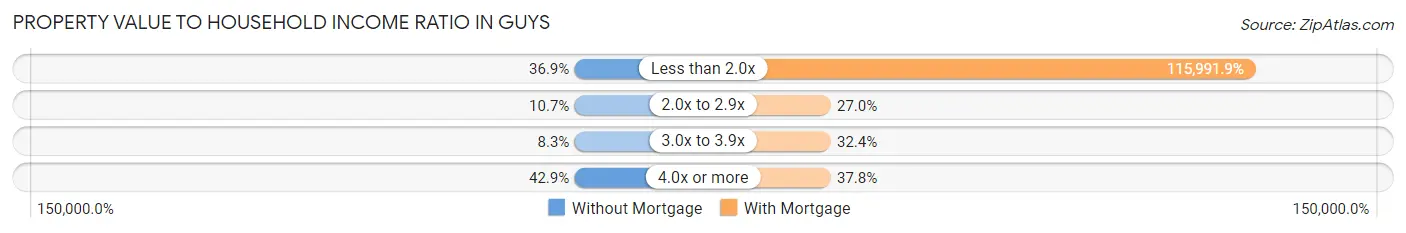
| Value-to-Income Ratio | Without Mortgage | With Mortgage |
| Less than 2.0x | 31 (36.9%) | 42,917 (115,991.9%) |
| 2.0x to 2.9x | 9 (10.7%) | 10 (27.0%) |
| 3.0x to 3.9x | 7 (8.3%) | 12 (32.4%) |
| 4.0x or more | 36 (42.9%) | 14 (37.8%) |
| Total | 84 (100.0%) | 37 (100.0%) |
Real Estate Taxes by Mortgage Status in Guys
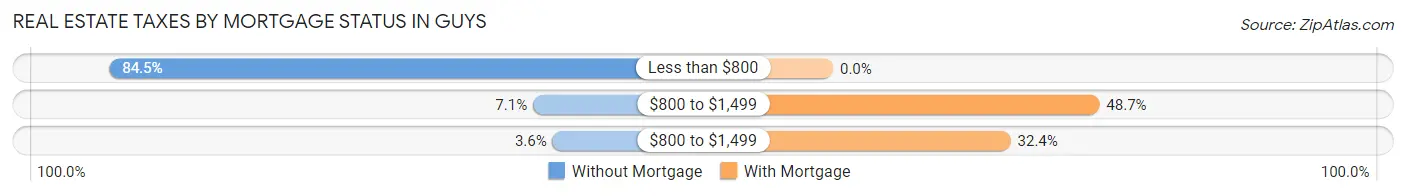
| Property Taxes | Without Mortgage | With Mortgage |
| Less than $800 | 71 (84.5%) | 0 (0.0%) |
| $800 to $1,499 | 6 (7.1%) | 18 (48.6%) |
| $800 to $1,499 | 3 (3.6%) | 12 (32.4%) |
| Total | 84 (100.0%) | 37 (100.0%) |
Health & Disability in Guys
Health Insurance Coverage by Age in Guys
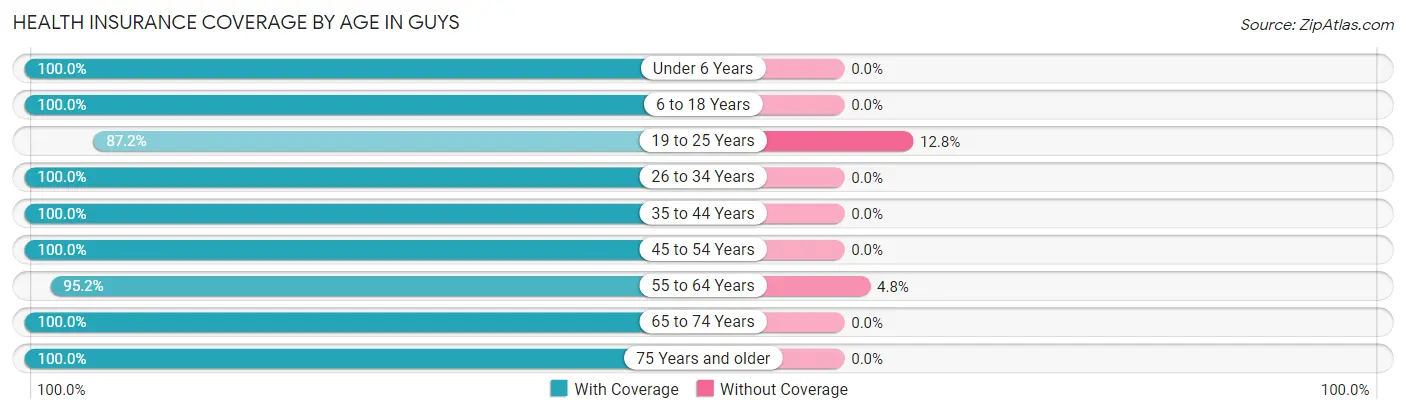
| Age Bracket | With Coverage | Without Coverage |
| Under 6 Years | 11 (100.0%) | 0 (0.0%) |
| 6 to 18 Years | 59 (100.0%) | 0 (0.0%) |
| 19 to 25 Years | 34 (87.2%) | 5 (12.8%) |
| 26 to 34 Years | 24 (100.0%) | 0 (0.0%) |
| 35 to 44 Years | 40 (100.0%) | 0 (0.0%) |
| 45 to 54 Years | 45 (100.0%) | 0 (0.0%) |
| 55 to 64 Years | 99 (95.2%) | 5 (4.8%) |
| 65 to 74 Years | 27 (100.0%) | 0 (0.0%) |
| 75 Years and older | 36 (100.0%) | 0 (0.0%) |
| Total | 375 (97.4%) | 10 (2.6%) |
Health Insurance Coverage by Citizenship Status in Guys
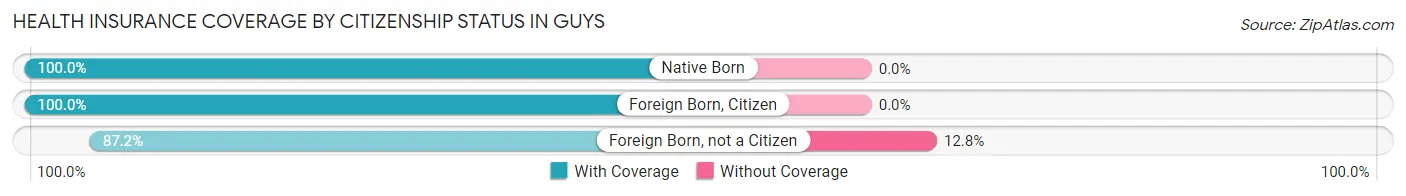
| Citizenship Status | With Coverage | Without Coverage |
| Native Born | 11 (100.0%) | 0 (0.0%) |
| Foreign Born, Citizen | 59 (100.0%) | 0 (0.0%) |
| Foreign Born, not a Citizen | 34 (87.2%) | 5 (12.8%) |
Health Insurance Coverage by Household Income in Guys
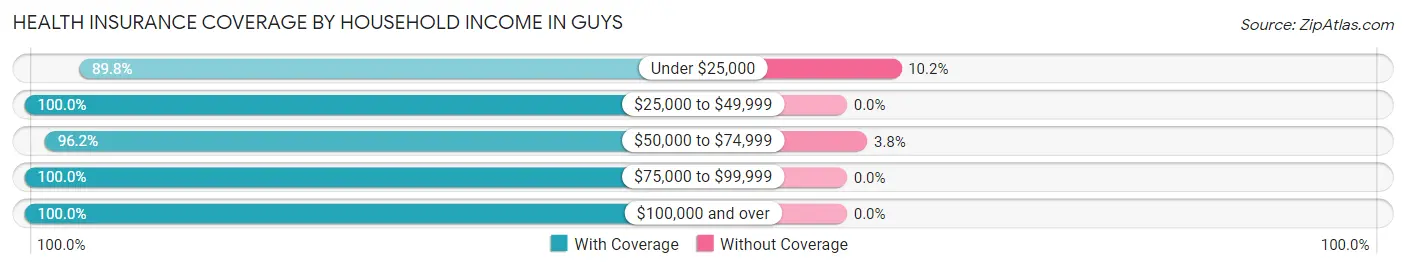
| Household Income | With Coverage | Without Coverage |
| Under $25,000 | 44 (89.8%) | 5 (10.2%) |
| $25,000 to $49,999 | 100 (100.0%) | 0 (0.0%) |
| $50,000 to $74,999 | 127 (96.2%) | 5 (3.8%) |
| $75,000 to $99,999 | 32 (100.0%) | 0 (0.0%) |
| $100,000 and over | 72 (100.0%) | 0 (0.0%) |
Public vs Private Health Insurance Coverage by Age in Guys
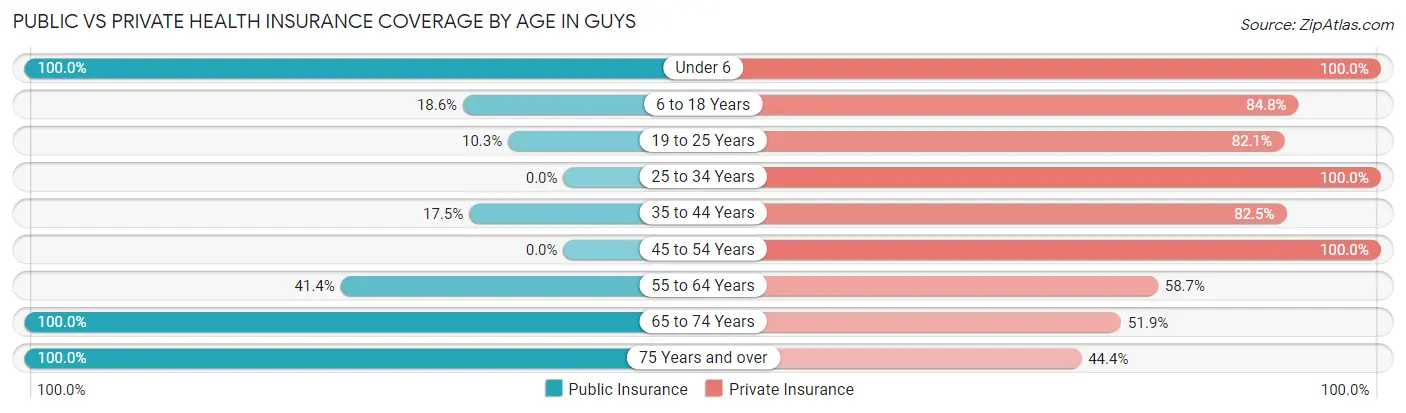
| Age Bracket | Public Insurance | Private Insurance |
| Under 6 | 11 (100.0%) | 11 (100.0%) |
| 6 to 18 Years | 11 (18.6%) | 50 (84.8%) |
| 19 to 25 Years | 4 (10.3%) | 32 (82.1%) |
| 25 to 34 Years | 0 (0.0%) | 24 (100.0%) |
| 35 to 44 Years | 7 (17.5%) | 33 (82.5%) |
| 45 to 54 Years | 0 (0.0%) | 45 (100.0%) |
| 55 to 64 Years | 43 (41.3%) | 61 (58.7%) |
| 65 to 74 Years | 27 (100.0%) | 14 (51.8%) |
| 75 Years and over | 36 (100.0%) | 16 (44.4%) |
| Total | 139 (36.1%) | 286 (74.3%) |
Disability Status by Sex by Age in Guys
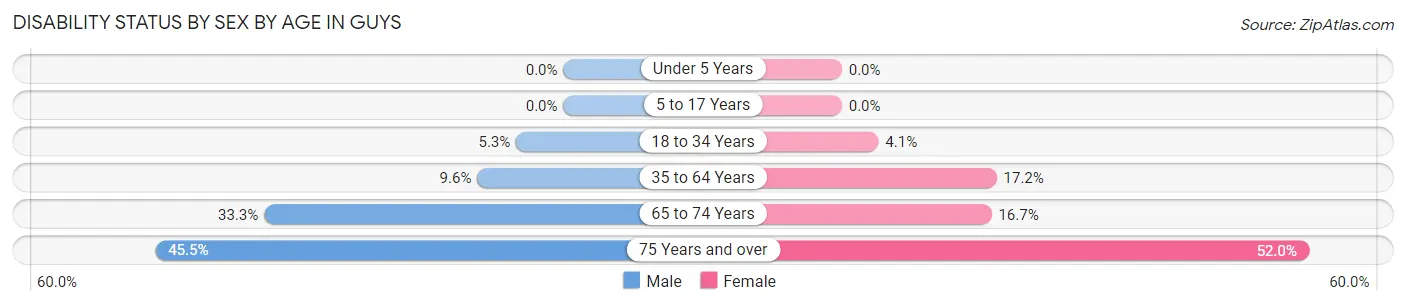
| Age Bracket | Male | Female |
| Under 5 Years | 0 (0.0%) | 0 (0.0%) |
| 5 to 17 Years | 0 (0.0%) | 0 (0.0%) |
| 18 to 34 Years | 1 (5.3%) | 2 (4.1%) |
| 35 to 64 Years | 7 (9.6%) | 20 (17.2%) |
| 65 to 74 Years | 3 (33.3%) | 3 (16.7%) |
| 75 Years and over | 5 (45.5%) | 13 (52.0%) |
Disability Class by Sex by Age in Guys
Disability Class: Hearing Difficulty
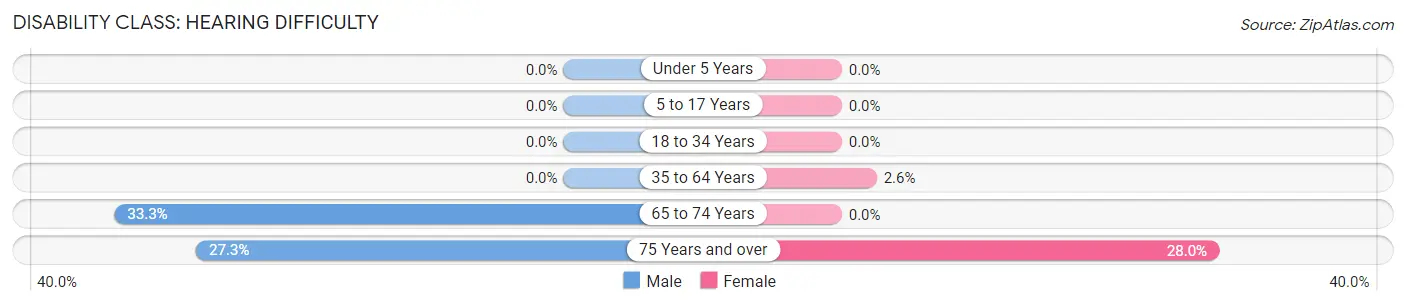
| Age Bracket | Male | Female |
| Under 5 Years | 0 (0.0%) | 0 (0.0%) |
| 5 to 17 Years | 0 (0.0%) | 0 (0.0%) |
| 18 to 34 Years | 0 (0.0%) | 0 (0.0%) |
| 35 to 64 Years | 0 (0.0%) | 3 (2.6%) |
| 65 to 74 Years | 3 (33.3%) | 0 (0.0%) |
| 75 Years and over | 3 (27.3%) | 7 (28.0%) |
Disability Class: Vision Difficulty
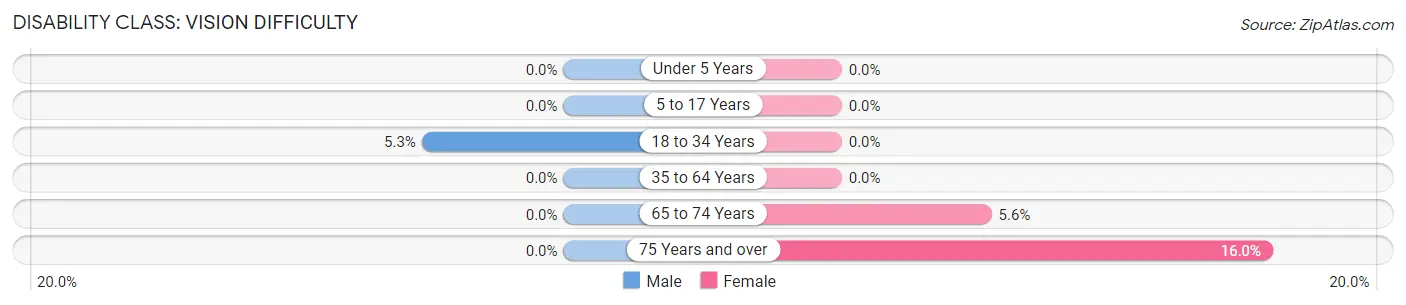
| Age Bracket | Male | Female |
| Under 5 Years | 0 (0.0%) | 0 (0.0%) |
| 5 to 17 Years | 0 (0.0%) | 0 (0.0%) |
| 18 to 34 Years | 1 (5.3%) | 0 (0.0%) |
| 35 to 64 Years | 0 (0.0%) | 0 (0.0%) |
| 65 to 74 Years | 0 (0.0%) | 1 (5.6%) |
| 75 Years and over | 0 (0.0%) | 4 (16.0%) |
Disability Class: Cognitive Difficulty
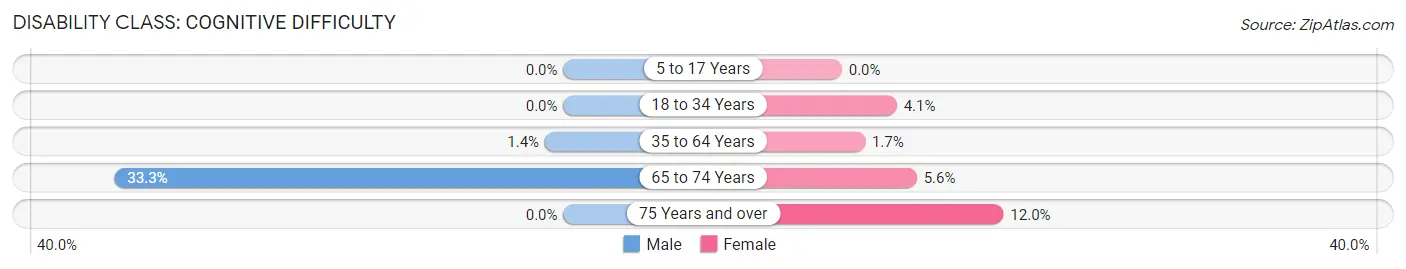
| Age Bracket | Male | Female |
| 5 to 17 Years | 0 (0.0%) | 0 (0.0%) |
| 18 to 34 Years | 0 (0.0%) | 2 (4.1%) |
| 35 to 64 Years | 1 (1.4%) | 2 (1.7%) |
| 65 to 74 Years | 3 (33.3%) | 1 (5.6%) |
| 75 Years and over | 0 (0.0%) | 3 (12.0%) |
Disability Class: Ambulatory Difficulty
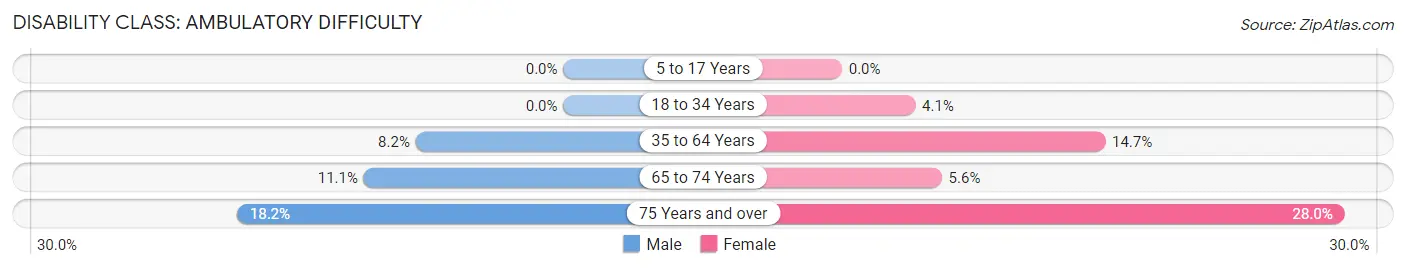
| Age Bracket | Male | Female |
| 5 to 17 Years | 0 (0.0%) | 0 (0.0%) |
| 18 to 34 Years | 0 (0.0%) | 2 (4.1%) |
| 35 to 64 Years | 6 (8.2%) | 17 (14.7%) |
| 65 to 74 Years | 1 (11.1%) | 1 (5.6%) |
| 75 Years and over | 2 (18.2%) | 7 (28.0%) |
Disability Class: Self-Care Difficulty
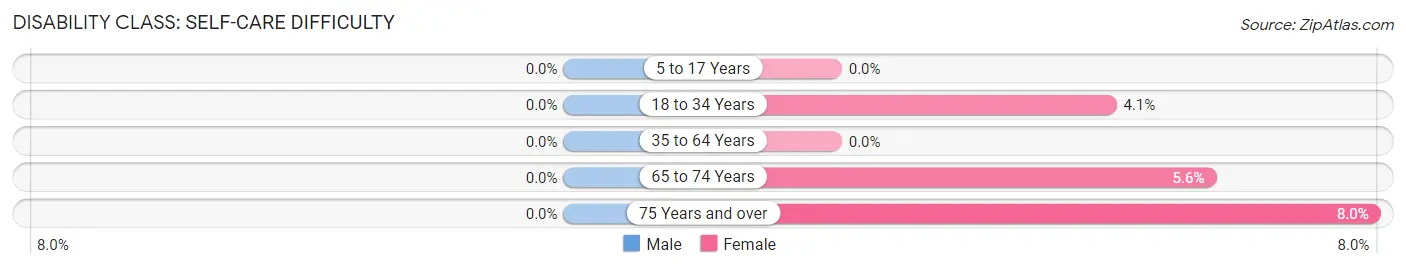
| Age Bracket | Male | Female |
| 5 to 17 Years | 0 (0.0%) | 0 (0.0%) |
| 18 to 34 Years | 0 (0.0%) | 2 (4.1%) |
| 35 to 64 Years | 0 (0.0%) | 0 (0.0%) |
| 65 to 74 Years | 0 (0.0%) | 1 (5.6%) |
| 75 Years and over | 0 (0.0%) | 2 (8.0%) |
Technology Access in Guys
Computing Device Access in Guys
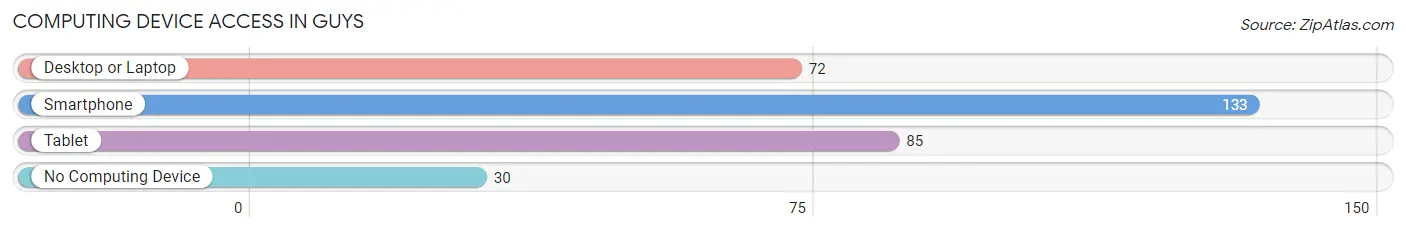
| Device Type | # Households | % Households |
| Desktop or Laptop | 72 | 42.3% |
| Smartphone | 133 | 78.2% |
| Tablet | 85 | 50.0% |
| No Computing Device | 30 | 17.6% |
| Total | 170 | 100.0% |
Internet Access in Guys
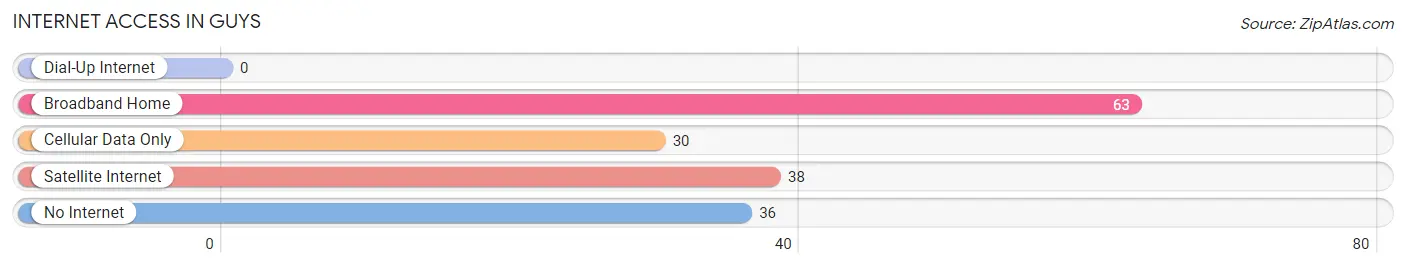
| Internet Type | # Households | % Households |
| Dial-Up Internet | 0 | 0.0% |
| Broadband Home | 63 | 37.1% |
| Cellular Data Only | 30 | 17.6% |
| Satellite Internet | 38 | 22.4% |
| No Internet | 36 | 21.2% |
| Total | 170 | 100.0% |
Guys Summary
Tennessee is a state located in the southeastern region of the United States. It is bordered by eight states, including Kentucky and Virginia to the north, North Carolina to the east, Georgia, Alabama, and Mississippi to the south, and Arkansas and Missouri to the west. Tennessee is the 36th largest state in the United States, with an area of 42,143 square miles, and the 16th most populous, with a population of 6.7 million in 2019. Tennessee is known for its rich history, diverse geography, and vibrant culture.
History
Tennessee has a long and rich history, beginning with the Native American tribes who lived in the area for thousands of years before European settlers arrived. The first Europeans to explore the area were Spanish explorers in the 16th century, followed by French explorers in the 17th century. In 1763, the area became part of the British colonies in North America, and in 1796, it became the 16th state to join the Union.
Tennessee was a major battleground during the Civil War, with some of the most important battles taking place in the state. After the war, Tennessee was the first state to be readmitted to the Union. During the Reconstruction era, Tennessee was a leader in civil rights, becoming the first state to ratify the 15th Amendment, which granted African Americans the right to vote.
Geography
Tennessee is located in the southeastern region of the United States, and is bordered by eight states. It is divided into three distinct geographic regions: the Appalachian Mountains in the east, the Central Basin in the middle, and the Gulf Coastal Plain in the west. The state is home to a variety of landscapes, from the rolling hills of the Appalachian Mountains to the flat plains of the Central Basin.
The highest point in Tennessee is Clingmans Dome, which is located in the Great Smoky Mountains National Park. The lowest point is the Mississippi River, which forms the western border of the state. Tennessee is also home to a number of rivers, including the Tennessee River, the Cumberland River, and the Mississippi River.
Economy
Tennessee has a diverse economy, with a mix of industries including agriculture, manufacturing, and services. Agriculture is the state’s largest industry, with crops such as cotton, soybeans, and tobacco being grown in the state. Manufacturing is also an important part of the economy, with major industries including automotive, chemicals, and textiles. The service sector is also a major contributor to the economy, with tourism being a major source of revenue.
Demographics
As of 2019, the population of Tennessee was estimated to be 6.7 million. The state is home to a diverse population, with the largest ethnic groups being White (77.7%), African American (17.2%), and Hispanic or Latino (4.3%). The largest cities in the state are Memphis, Nashville, Knoxville, and Chattanooga.
Tennessee is also home to a variety of religious groups, with the largest being Protestant (48.2%), followed by Catholic (17.2%), and non-religious (14.3%). The median household income in the state is $50,564, and the median age is 38.7.
Common Questions
What is Per Capita Income in Guys?
Per Capita income in Guys is $32,739.
What is the Median Family Income in Guys?
Median Family Income in Guys is $51,875.
What is the Median Household income in Guys?
Median Household Income in Guys is $41,563.
What is Income or Wage Gap in Guys?
Income or Wage Gap in Guys is 34.4%.
Women in Guys earn 65.6 cents for every dollar earned by a man.
What is Inequality or Gini Index in Guys?
Inequality or Gini Index in Guys is 0.53.
What is the Total Population of Guys?
Total Population of Guys is 385.
What is the Total Male Population of Guys?
Total Male Population of Guys is 143.
What is the Total Female Population of Guys?
Total Female Population of Guys is 242.
What is the Ratio of Males per 100 Females in Guys?
There are 59.09 Males per 100 Females in Guys.
What is the Ratio of Females per 100 Males in Guys?
There are 169.23 Females per 100 Males in Guys.
What is the Median Population Age in Guys?
Median Population Age in Guys is 51.0 Years.
What is the Average Family Size in Guys
Average Family Size in Guys is 3.0 People.
What is the Average Household Size in Guys
Average Household Size in Guys is 2.3 People.
How Large is the Labor Force in Guys?
There are 188 People in the Labor Forcein in Guys.
What is the Percentage of People in the Labor Force in Guys?
56.0% of People are in the Labor Force in Guys.
What is the Unemployment Rate in Guys?
Unemployment Rate in Guys is 12.8%.