Gallaway, TN Map & Demographics
Gallaway Map
Gallaway Overview
$16,702
PER CAPITA INCOME
$34,250
AVG FAMILY INCOME
$31,176
AVG HOUSEHOLD INCOME
12.1%
WAGE / INCOME GAP [ % ]
87.9¢/ $1
WAGE / INCOME GAP [ $ ]
$13,756
FAMILY INCOME DEFICIT
0.40
INEQUALITY / GINI INDEX
664
TOTAL POPULATION
211
MALE POPULATION
453
FEMALE POPULATION
46.58
MALES / 100 FEMALES
214.69
FEMALES / 100 MALES
48.3
MEDIAN AGE
2.6
AVG FAMILY SIZE
1.9
AVG HOUSEHOLD SIZE
216
LABOR FORCE [ PEOPLE ]
36.3%
PERCENT IN LABOR FORCE
24.1%
UNEMPLOYMENT RATE
Gallaway Zip Codes
Gallaway Area Codes
Income in Gallaway
Income Overview in Gallaway
Per Capita Income in Gallaway is $16,702, while median incomes of families and households are $34,250 and $31,176 respectively.
| Characteristic | Number | Measure |
| Per Capita Income | 664 | $16,702 |
| Median Family Income | 145 | $34,250 |
| Mean Family Income | 145 | $39,457 |
| Median Household Income | 286 | $31,176 |
| Mean Household Income | 286 | $30,674 |
| Income Deficit | 145 | $13,756 |
| Wage / Income Gap (%) | 664 | 12.11% |
| Wage / Income Gap ($) | 664 | 87.89¢ per $1 |
| Gini / Inequality Index | 664 | 0.40 |
Earnings by Sex in Gallaway
Average Earnings in Gallaway are $26,172, $28,889 for men and $25,391 for women, a difference of 12.1%.
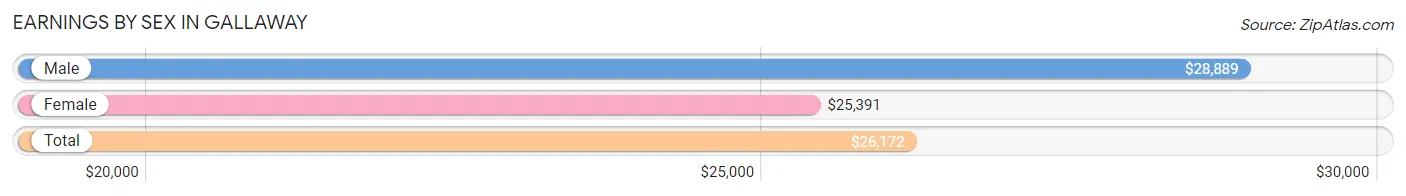
| Sex | Number | Average Earnings |
| Male | 68 (36.4%) | $28,889 |
| Female | 119 (63.6%) | $25,391 |
| Total | 187 (100.0%) | $26,172 |
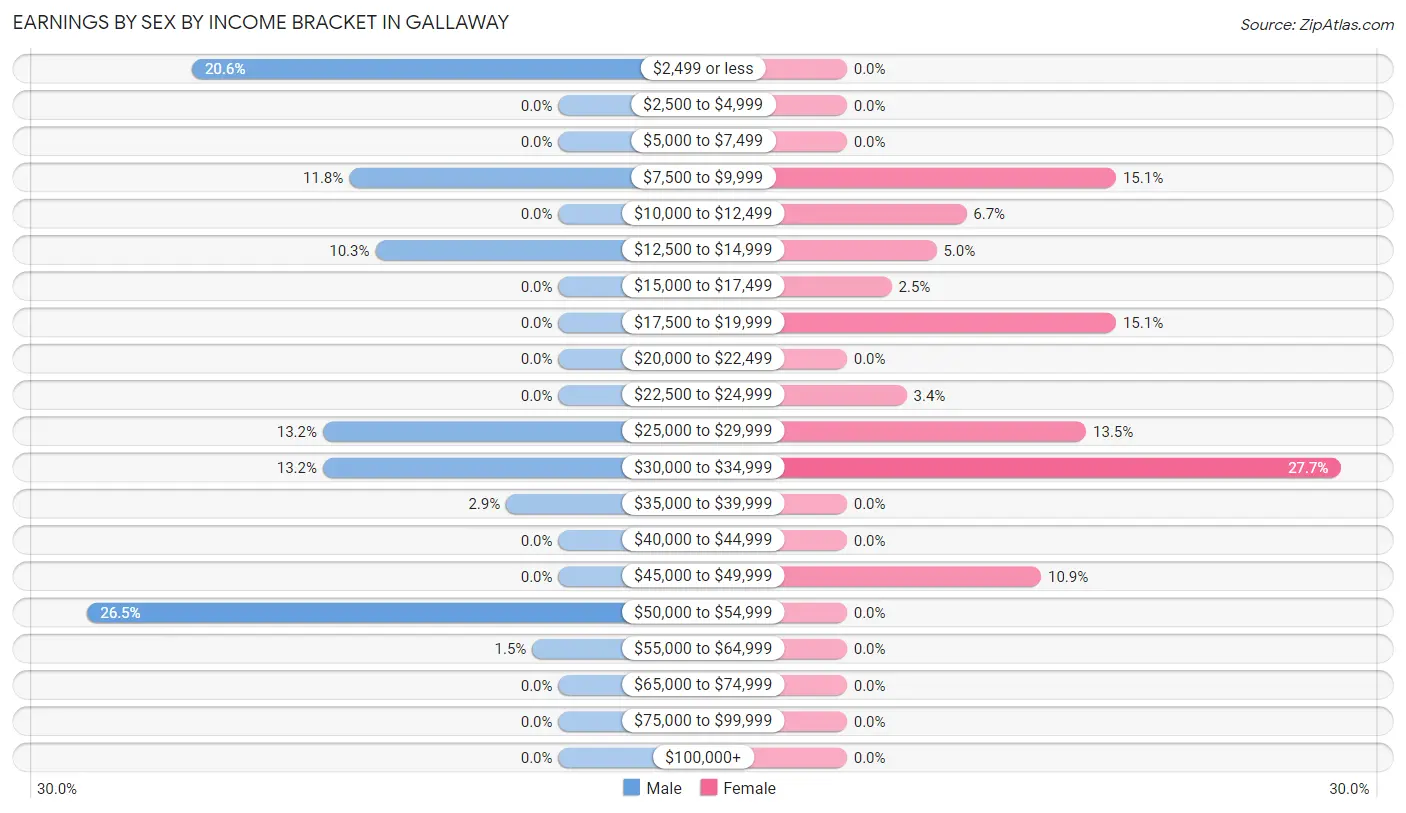
Earnings by Sex by Income Bracket in Gallaway
The most common earnings brackets in Gallaway are $50,000 to $54,999 for men (18 | 26.5%) and $30,000 to $34,999 for women (33 | 27.7%).
| Income | Male | Female |
| $2,499 or less | 14 (20.6%) | 0 (0.0%) |
| $2,500 to $4,999 | 0 (0.0%) | 0 (0.0%) |
| $5,000 to $7,499 | 0 (0.0%) | 0 (0.0%) |
| $7,500 to $9,999 | 8 (11.8%) | 18 (15.1%) |
| $10,000 to $12,499 | 0 (0.0%) | 8 (6.7%) |
| $12,500 to $14,999 | 7 (10.3%) | 6 (5.0%) |
| $15,000 to $17,499 | 0 (0.0%) | 3 (2.5%) |
| $17,500 to $19,999 | 0 (0.0%) | 18 (15.1%) |
| $20,000 to $22,499 | 0 (0.0%) | 0 (0.0%) |
| $22,500 to $24,999 | 0 (0.0%) | 4 (3.4%) |
| $25,000 to $29,999 | 9 (13.2%) | 16 (13.5%) |
| $30,000 to $34,999 | 9 (13.2%) | 33 (27.7%) |
| $35,000 to $39,999 | 2 (2.9%) | 0 (0.0%) |
| $40,000 to $44,999 | 0 (0.0%) | 0 (0.0%) |
| $45,000 to $49,999 | 0 (0.0%) | 13 (10.9%) |
| $50,000 to $54,999 | 18 (26.5%) | 0 (0.0%) |
| $55,000 to $64,999 | 1 (1.5%) | 0 (0.0%) |
| $65,000 to $74,999 | 0 (0.0%) | 0 (0.0%) |
| $75,000 to $99,999 | 0 (0.0%) | 0 (0.0%) |
| $100,000+ | 0 (0.0%) | 0 (0.0%) |
| Total | 68 (100.0%) | 119 (100.0%) |
Earnings by Sex by Educational Attainment in Gallaway
Average earnings in Gallaway are $50,750 for men and $23,750 for women, a difference of 53.2%. Men with an educational attainment of high school diploma enjoy the highest average annual earnings of $51,429, while those with high school diploma education earn the least with $51,429. Women with an educational attainment of high school diploma earn the most with the average annual earnings of $19,375, while those with high school diploma education have the smallest earnings of $19,375.
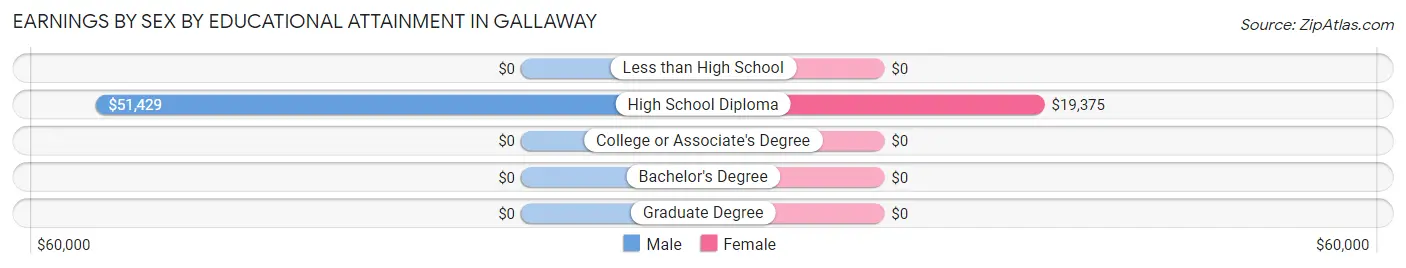
| Educational Attainment | Male Income | Female Income |
| Less than High School | - | - |
| High School Diploma | $51,429 | $19,375 |
| College or Associate's Degree | - | - |
| Bachelor's Degree | - | - |
| Graduate Degree | - | - |
| Total | $50,750 | $23,750 |
Family Income in Gallaway
Family Income Brackets in Gallaway
According to the Gallaway family income data, there are 46 families falling into the $25,000 to $34,999 income range, which is the most common income bracket and makes up 31.7% of all families.
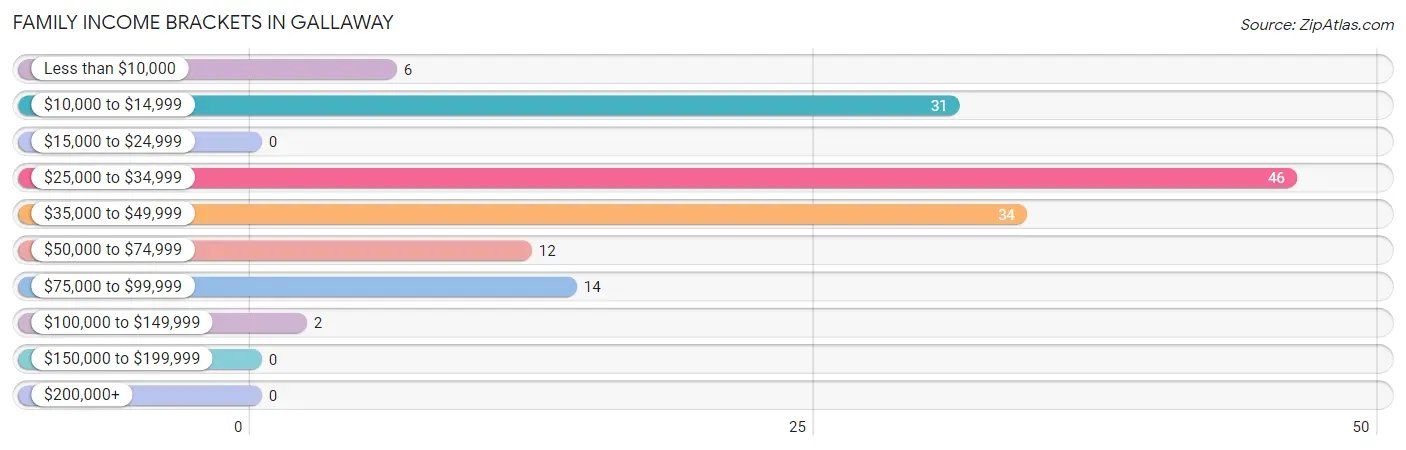
| Income Bracket | # Families | % Families |
| Less than $10,000 | 6 | 4.1% |
| $10,000 to $14,999 | 31 | 21.4% |
| $15,000 to $24,999 | 0 | 0.0% |
| $25,000 to $34,999 | 46 | 31.7% |
| $35,000 to $49,999 | 34 | 23.4% |
| $50,000 to $74,999 | 12 | 8.3% |
| $75,000 to $99,999 | 14 | 9.7% |
| $100,000 to $149,999 | 2 | 1.4% |
| $150,000 to $199,999 | 0 | 0.0% |
| $200,000+ | 0 | 0.0% |
Family Income by Famaliy Size in Gallaway
2-person families (76 | 52.4%) account for the highest median family income in Gallaway with $45,476 per family, while 2-person families (76 | 52.4%) have the highest median income of $22,738 per family member.
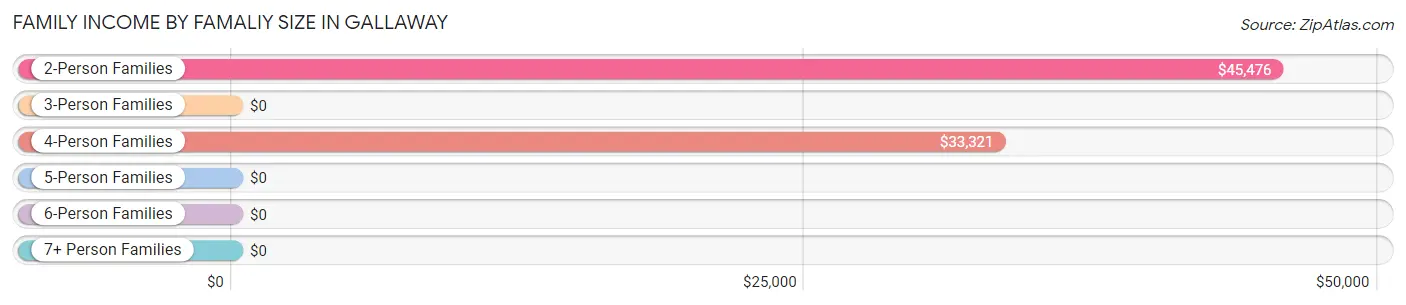
| Income Bracket | # Families | Median Income |
| 2-Person Families | 76 (52.4%) | $45,476 |
| 3-Person Families | 13 (9.0%) | $0 |
| 4-Person Families | 47 (32.4%) | $33,321 |
| 5-Person Families | 0 (0.0%) | $0 |
| 6-Person Families | 9 (6.2%) | $0 |
| 7+ Person Families | 0 (0.0%) | $0 |
| Total | 145 (100.0%) | $34,250 |
Family Income by Number of Earners in Gallaway
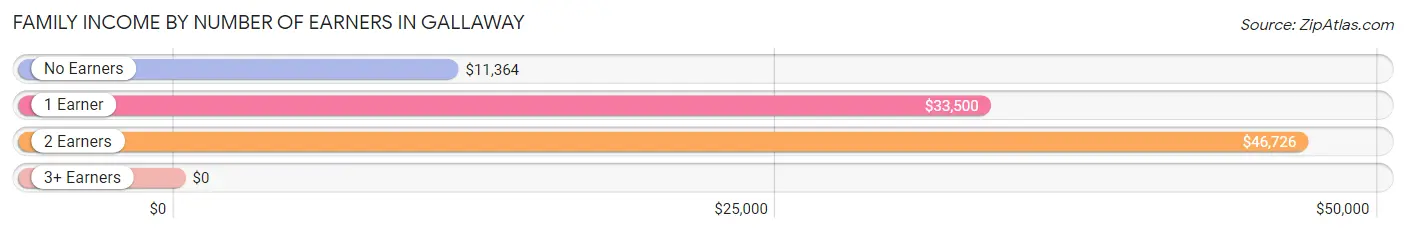
| Number of Earners | # Families | Median Income |
| No Earners | 24 (16.6%) | $11,364 |
| 1 Earner | 78 (53.8%) | $33,500 |
| 2 Earners | 43 (29.7%) | $46,726 |
| 3+ Earners | 0 (0.0%) | $0 |
| Total | 145 (100.0%) | $34,250 |
Household Income in Gallaway
Household Income Brackets in Gallaway
With 70 households falling in the category, the $35,000 to $49,999 income range is the most frequent in Gallaway, accounting for 24.5% of all households.
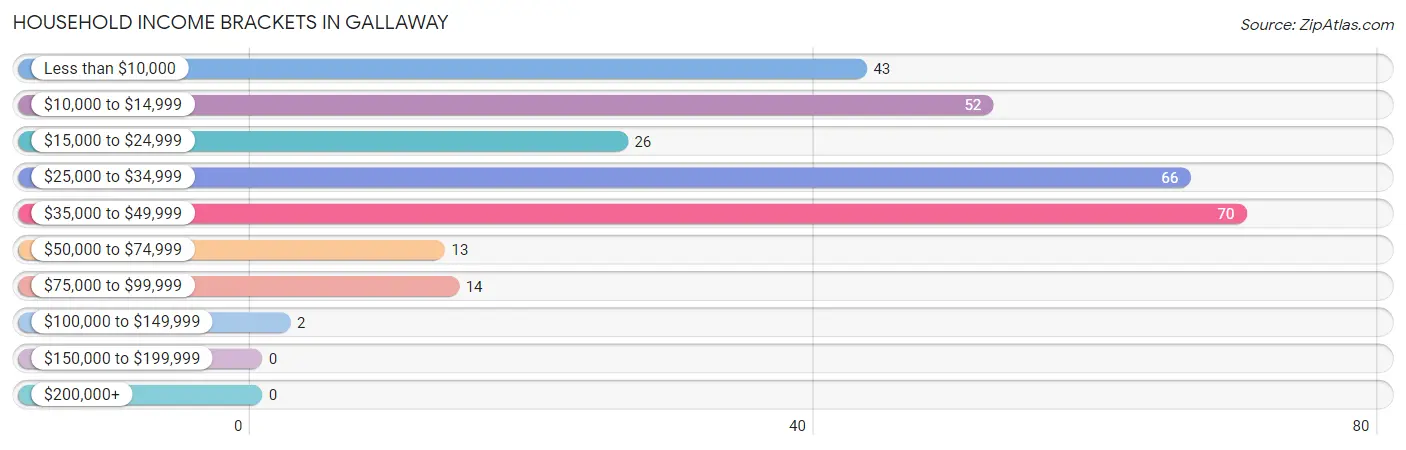
| Income Bracket | # Households | % Households |
| Less than $10,000 | 43 | 15.0% |
| $10,000 to $14,999 | 52 | 18.2% |
| $15,000 to $24,999 | 26 | 9.1% |
| $25,000 to $34,999 | 66 | 23.1% |
| $35,000 to $49,999 | 70 | 24.5% |
| $50,000 to $74,999 | 13 | 4.5% |
| $75,000 to $99,999 | 14 | 4.9% |
| $100,000 to $149,999 | 2 | 0.7% |
| $150,000 to $199,999 | 0 | 0.0% |
| $200,000+ | 0 | 0.0% |
Household Income by Householder Age in Gallaway
The median household income in Gallaway is $31,176, with the highest median household income of $43,056 found in the 45 to 64 years age bracket for the primary householder. A total of 116 households (40.6%) fall into this category. Meanwhile, the 15 to 24 years age bracket for the primary householder has the lowest median household income of $0, with 21 households (7.3%) in this group.
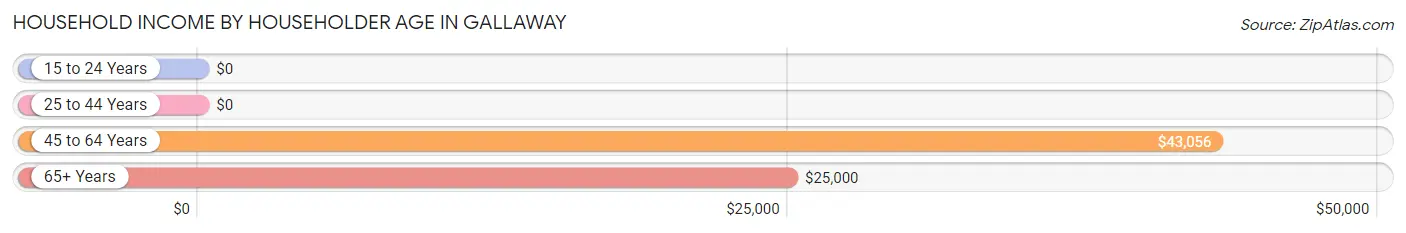
| Income Bracket | # Households | Median Income |
| 15 to 24 Years | 21 (7.3%) | $0 |
| 25 to 44 Years | 89 (31.1%) | $0 |
| 45 to 64 Years | 116 (40.6%) | $43,056 |
| 65+ Years | 60 (21.0%) | $25,000 |
| Total | 286 (100.0%) | $31,176 |
Poverty in Gallaway
Income Below Poverty by Sex and Age in Gallaway
With 52.8% poverty level for males and 30.1% for females among the residents of Gallaway, under 5 year old males and 15 year old females are the most vulnerable to poverty, with 10 males (100.0%) and 3 females (100.0%) in their respective age groups living below the poverty level.
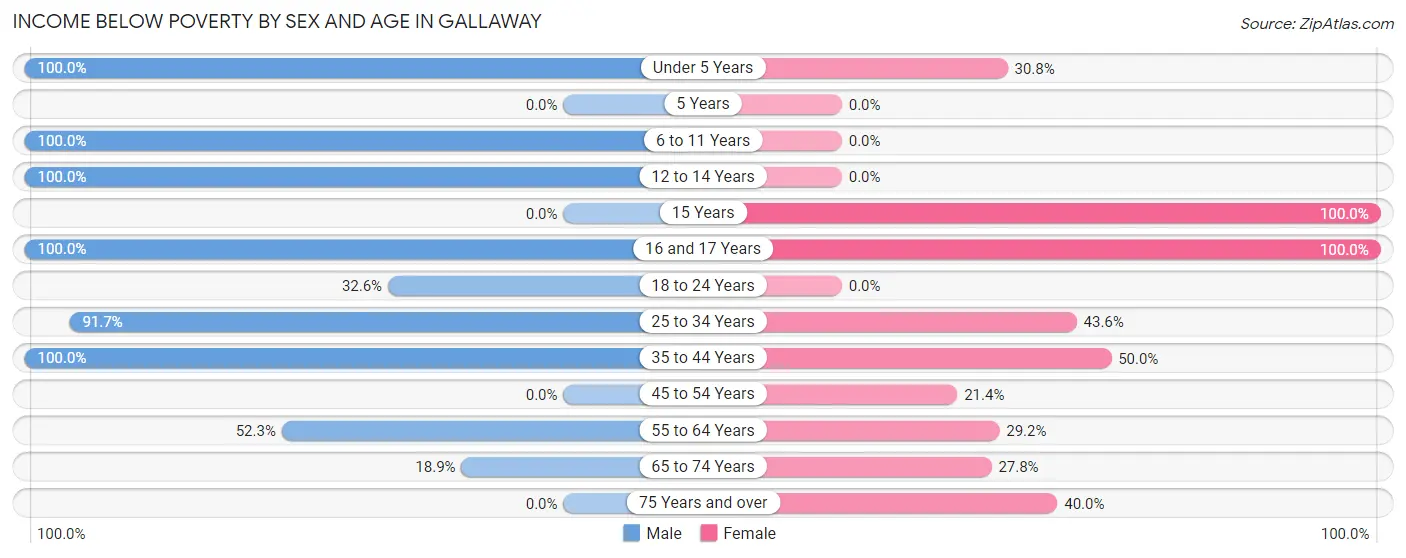
| Age Bracket | Male | Female |
| Under 5 Years | 10 (100.0%) | 4 (30.8%) |
| 5 Years | 0 (0.0%) | 0 (0.0%) |
| 6 to 11 Years | 11 (100.0%) | 0 (0.0%) |
| 12 to 14 Years | 3 (100.0%) | 0 (0.0%) |
| 15 Years | 0 (0.0%) | 3 (100.0%) |
| 16 and 17 Years | 13 (100.0%) | 10 (100.0%) |
| 18 to 24 Years | 14 (32.6%) | 0 (0.0%) |
| 25 to 34 Years | 11 (91.7%) | 34 (43.6%) |
| 35 to 44 Years | 12 (100.0%) | 15 (50.0%) |
| 45 to 54 Years | 0 (0.0%) | 6 (21.4%) |
| 55 to 64 Years | 23 (52.3%) | 19 (29.2%) |
| 65 to 74 Years | 7 (18.9%) | 10 (27.8%) |
| 75 Years and over | 0 (0.0%) | 4 (40.0%) |
| Total | 104 (52.8%) | 105 (30.1%) |
Income Above Poverty by Sex and Age in Gallaway
According to the poverty statistics in Gallaway, males aged 45 to 54 years and females aged 6 to 11 years are the age groups that are most secure financially, with 100.0% of males and 100.0% of females in these age groups living above the poverty line.
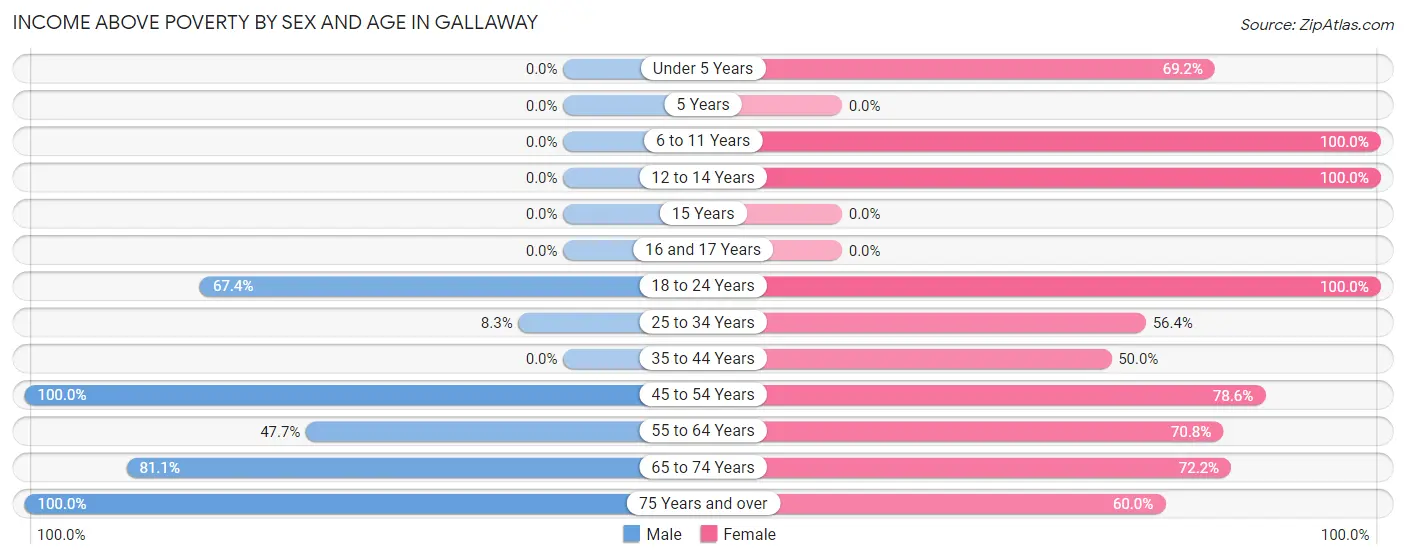
| Age Bracket | Male | Female |
| Under 5 Years | 0 (0.0%) | 9 (69.2%) |
| 5 Years | 0 (0.0%) | 0 (0.0%) |
| 6 to 11 Years | 0 (0.0%) | 22 (100.0%) |
| 12 to 14 Years | 0 (0.0%) | 7 (100.0%) |
| 15 Years | 0 (0.0%) | 0 (0.0%) |
| 16 and 17 Years | 0 (0.0%) | 0 (0.0%) |
| 18 to 24 Years | 29 (67.4%) | 47 (100.0%) |
| 25 to 34 Years | 1 (8.3%) | 44 (56.4%) |
| 35 to 44 Years | 0 (0.0%) | 15 (50.0%) |
| 45 to 54 Years | 8 (100.0%) | 22 (78.6%) |
| 55 to 64 Years | 21 (47.7%) | 46 (70.8%) |
| 65 to 74 Years | 30 (81.1%) | 26 (72.2%) |
| 75 Years and over | 4 (100.0%) | 6 (60.0%) |
| Total | 93 (47.2%) | 244 (69.9%) |
Income Below Poverty Among Married-Couple Families in Gallaway
The poverty statistics for married-couple families in Gallaway show that 39.5% or 17 of the total 43 families live below the poverty line. Families with 3 or 4 children have the highest poverty rate of 100.0%, comprising of 9 families. On the other hand, families with no children have the lowest poverty rate of 23.5%, which includes 8 families.
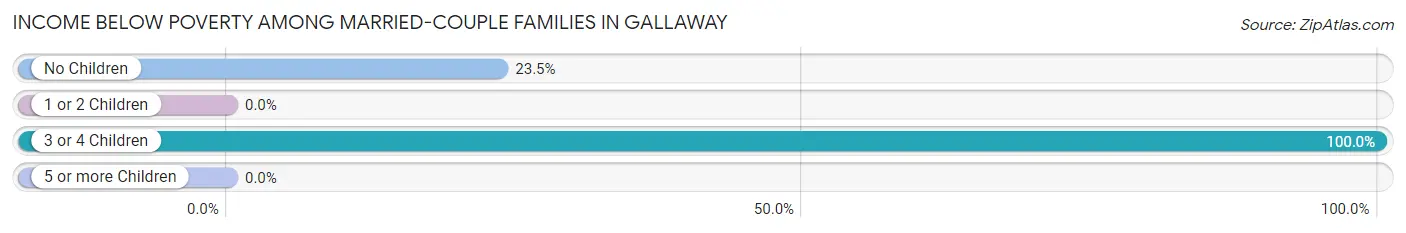
| Children | Above Poverty | Below Poverty |
| No Children | 26 (76.5%) | 8 (23.5%) |
| 1 or 2 Children | 0 (0.0%) | 0 (0.0%) |
| 3 or 4 Children | 0 (0.0%) | 9 (100.0%) |
| 5 or more Children | 0 (0.0%) | 0 (0.0%) |
| Total | 26 (60.5%) | 17 (39.5%) |
Income Below Poverty Among Single-Parent Households in Gallaway
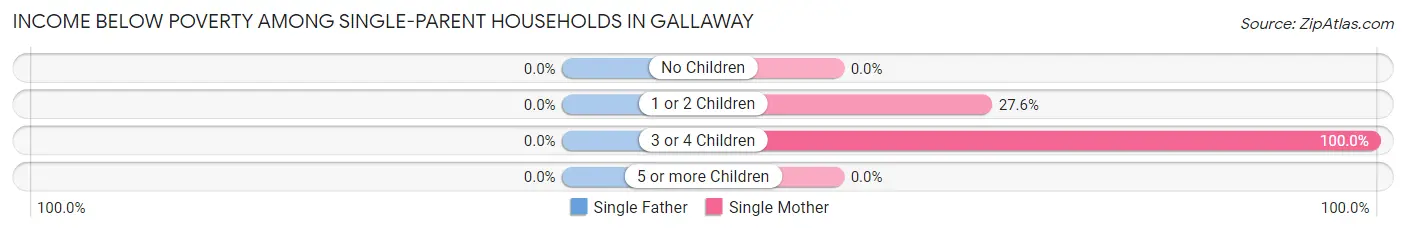
| Children | Single Father | Single Mother |
| No Children | 0 (0.0%) | 0 (0.0%) |
| 1 or 2 Children | 0 (0.0%) | 16 (27.6%) |
| 3 or 4 Children | 0 (0.0%) | 8 (100.0%) |
| 5 or more Children | 0 (0.0%) | 0 (0.0%) |
| Total | 0 (0.0%) | 24 (24.0%) |
Income Below Poverty Among Married-Couple vs Single-Parent Households in Gallaway
The poverty data for Gallaway shows that 17 of the married-couple family households (39.5%) and 24 of the single-parent households (23.5%) are living below the poverty level. Within the married-couple family households, those with 3 or 4 children have the highest poverty rate, with 9 households (100.0%) falling below the poverty line. Among the single-parent households, those with 3 or 4 children have the highest poverty rate, with 8 household (100.0%) living below poverty.
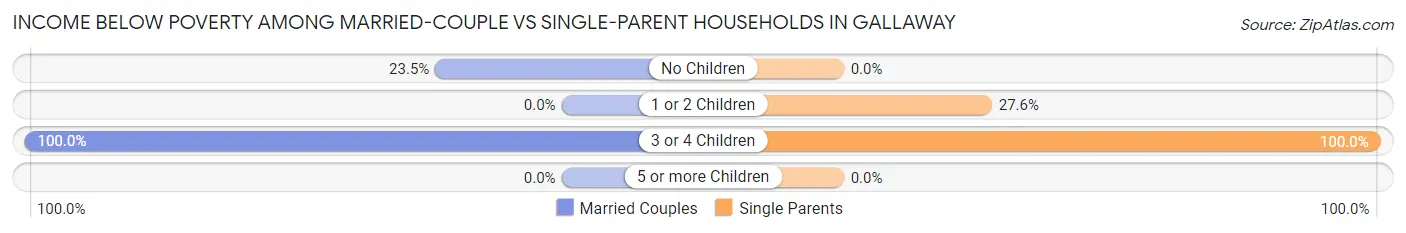
| Children | Married-Couple Families | Single-Parent Households |
| No Children | 8 (23.5%) | 0 (0.0%) |
| 1 or 2 Children | 0 (0.0%) | 16 (27.6%) |
| 3 or 4 Children | 9 (100.0%) | 8 (100.0%) |
| 5 or more Children | 0 (0.0%) | 0 (0.0%) |
| Total | 17 (39.5%) | 24 (23.5%) |
Race in Gallaway
The most populous races in Gallaway are Black / African American (444 | 66.9%), White / Caucasian (206 | 31.0%), and Two or more Races (9 | 1.4%).
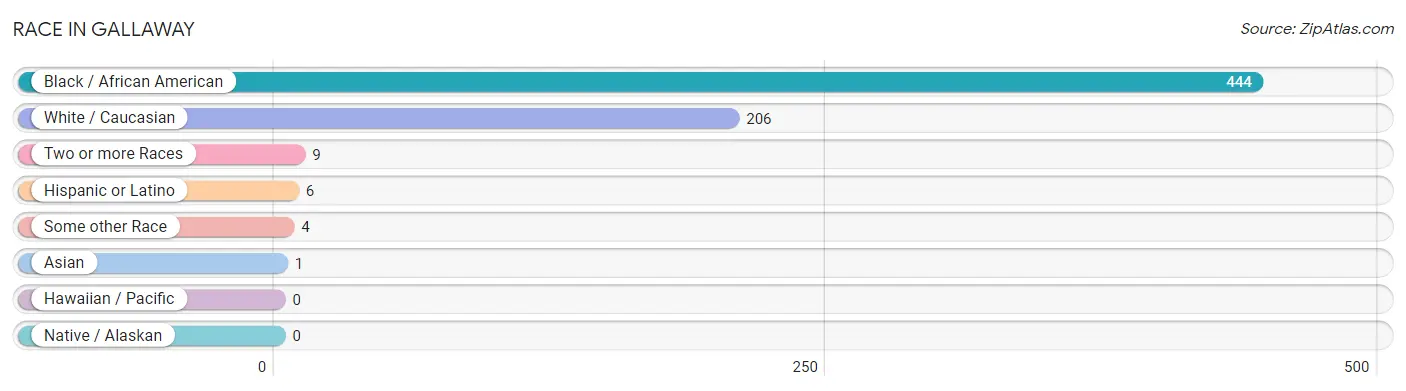
| Race | # Population | % Population |
| Asian | 1 | 0.2% |
| Black / African American | 444 | 66.9% |
| Hawaiian / Pacific | 0 | 0.0% |
| Hispanic or Latino | 6 | 0.9% |
| Native / Alaskan | 0 | 0.0% |
| White / Caucasian | 206 | 31.0% |
| Two or more Races | 9 | 1.4% |
| Some other Race | 4 | 0.6% |
| Total | 664 | 100.0% |
Ancestry in Gallaway
The most populous ancestries reported in Gallaway are English (40 | 6.0%), American (26 | 3.9%), German (16 | 2.4%), Irish (14 | 2.1%), and Danish (10 | 1.5%), together accounting for 16.0% of all Gallaway residents.
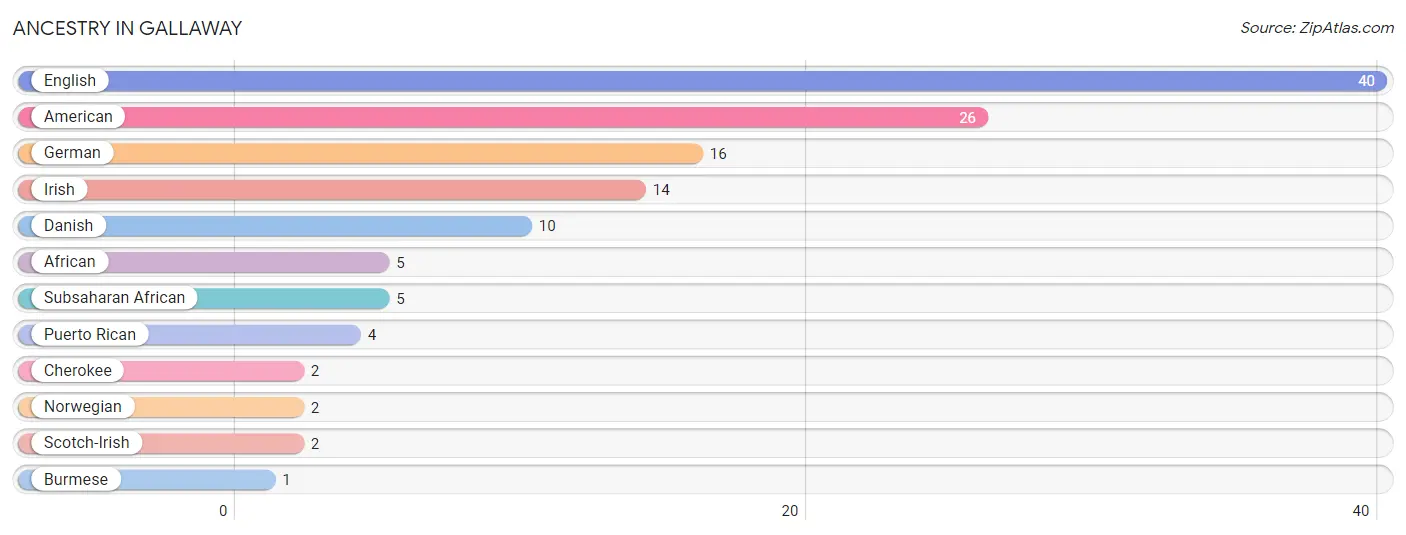
| Ancestry | # Population | % Population |
| African | 5 | 0.7% |
| American | 26 | 3.9% |
| Burmese | 1 | 0.2% |
| Cherokee | 2 | 0.3% |
| Danish | 10 | 1.5% |
| English | 40 | 6.0% |
| German | 16 | 2.4% |
| Irish | 14 | 2.1% |
| Norwegian | 2 | 0.3% |
| Puerto Rican | 4 | 0.6% |
| Scotch-Irish | 2 | 0.3% |
| Subsaharan African | 5 | 0.7% | View All 12 Rows |
Immigrants in Gallaway
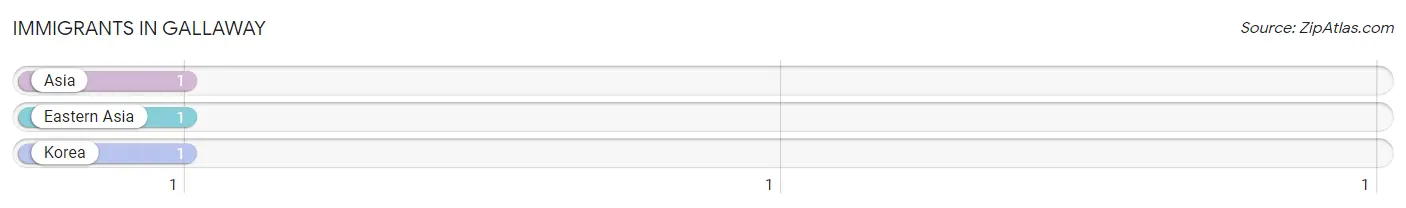
The most numerous immigrant groups reported in Gallaway came from Asia (1 | 0.2%), Eastern Asia (1 | 0.2%), and Korea (1 | 0.2%), together accounting for 0.5% of all Gallaway residents.
| Immigration Origin | # Population | % Population |
| Asia | 1 | 0.2% |
| Eastern Asia | 1 | 0.2% |
| Korea | 1 | 0.2% | View All 3 Rows |
Sex and Age in Gallaway
Sex and Age in Gallaway
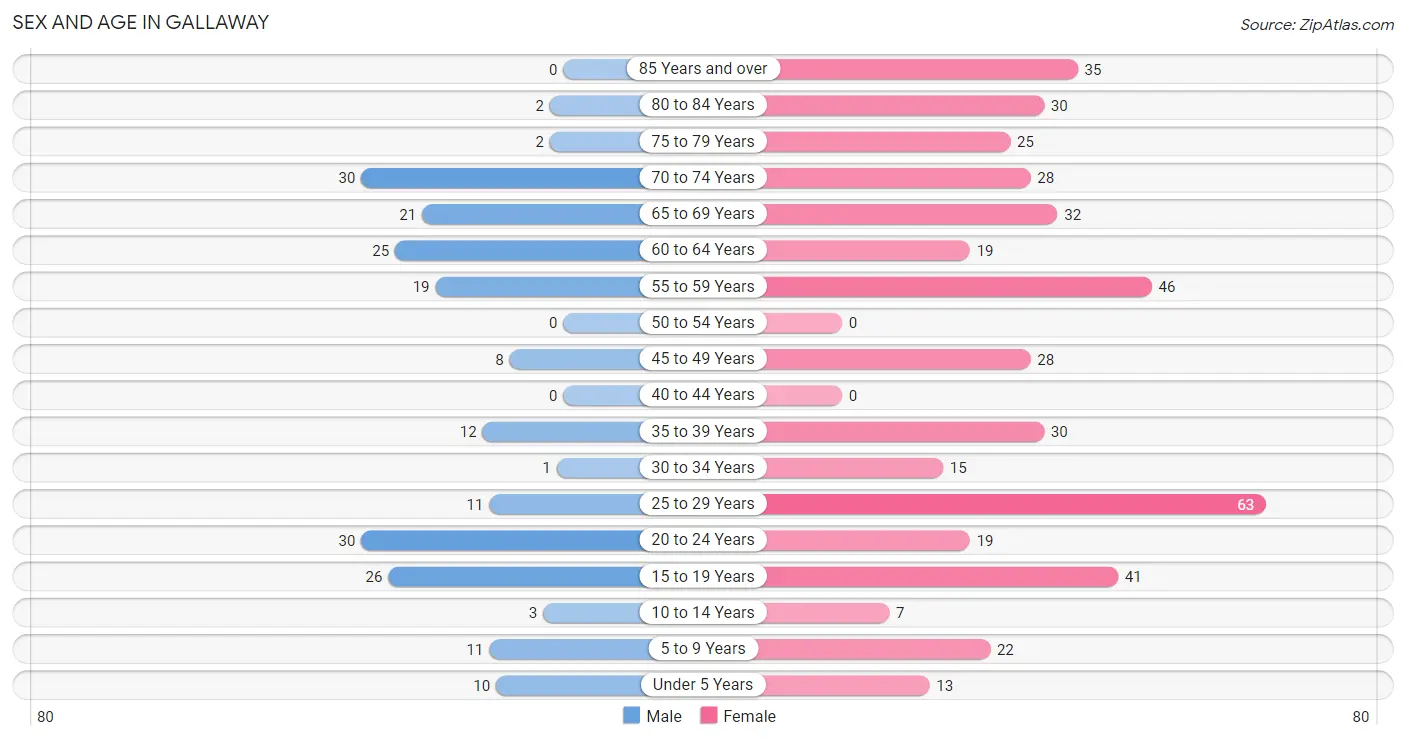
The most populous age groups in Gallaway are 20 to 24 Years (30 | 14.2%) for men and 25 to 29 Years (63 | 13.9%) for women.
| Age Bracket | Male | Female |
| Under 5 Years | 10 (4.7%) | 13 (2.9%) |
| 5 to 9 Years | 11 (5.2%) | 22 (4.9%) |
| 10 to 14 Years | 3 (1.4%) | 7 (1.5%) |
| 15 to 19 Years | 26 (12.3%) | 41 (9.0%) |
| 20 to 24 Years | 30 (14.2%) | 19 (4.2%) |
| 25 to 29 Years | 11 (5.2%) | 63 (13.9%) |
| 30 to 34 Years | 1 (0.5%) | 15 (3.3%) |
| 35 to 39 Years | 12 (5.7%) | 30 (6.6%) |
| 40 to 44 Years | 0 (0.0%) | 0 (0.0%) |
| 45 to 49 Years | 8 (3.8%) | 28 (6.2%) |
| 50 to 54 Years | 0 (0.0%) | 0 (0.0%) |
| 55 to 59 Years | 19 (9.0%) | 46 (10.2%) |
| 60 to 64 Years | 25 (11.8%) | 19 (4.2%) |
| 65 to 69 Years | 21 (10.0%) | 32 (7.1%) |
| 70 to 74 Years | 30 (14.2%) | 28 (6.2%) |
| 75 to 79 Years | 2 (0.9%) | 25 (5.5%) |
| 80 to 84 Years | 2 (0.9%) | 30 (6.6%) |
| 85 Years and over | 0 (0.0%) | 35 (7.7%) |
| Total | 211 (100.0%) | 453 (100.0%) |
Families and Households in Gallaway
Median Family Size in Gallaway
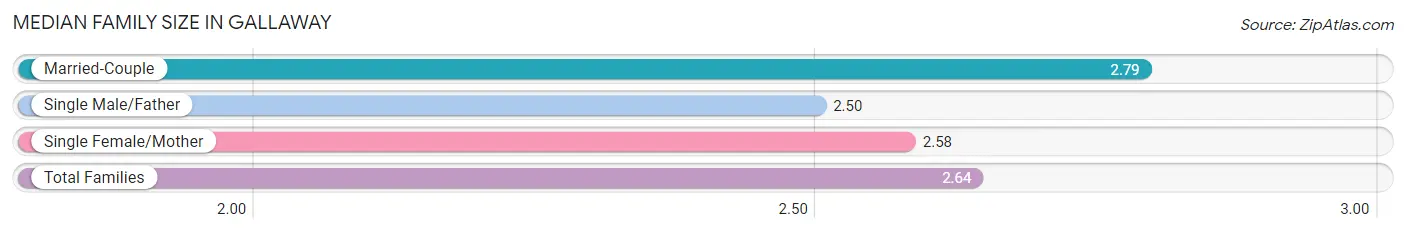
The median family size in Gallaway is 2.64 persons per family, with married-couple families (43 | 29.7%) accounting for the largest median family size of 2.79 persons per family. On the other hand, single male/father families (2 | 1.4%) represent the smallest median family size with 2.50 persons per family.
| Family Type | # Families | Family Size |
| Married-Couple | 43 (29.7%) | 2.79 |
| Single Male/Father | 2 (1.4%) | 2.50 |
| Single Female/Mother | 100 (69.0%) | 2.58 |
| Total Families | 145 (100.0%) | 2.64 |
Median Household Size in Gallaway
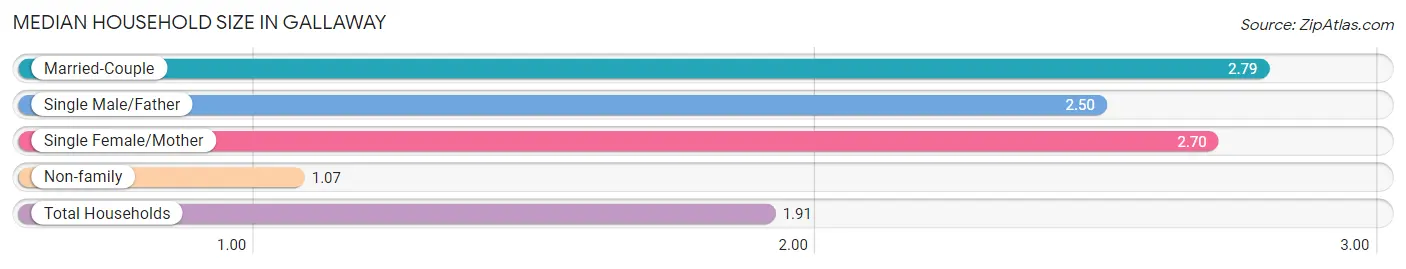
The median household size in Gallaway is 1.91 persons per household, with married-couple households (43 | 15.0%) accounting for the largest median household size of 2.79 persons per household. non-family households (141 | 49.3%) represent the smallest median household size with 1.07 persons per household.
| Household Type | # Households | Household Size |
| Married-Couple | 43 (15.0%) | 2.79 |
| Single Male/Father | 2 (0.7%) | 2.50 |
| Single Female/Mother | 100 (35.0%) | 2.70 |
| Non-family | 141 (49.3%) | 1.07 |
| Total Households | 286 (100.0%) | 1.91 |
Household Size by Marriage Status in Gallaway
Out of a total of 286 households in Gallaway, 145 (50.7%) are family households, while 141 (49.3%) are nonfamily households. The most numerous type of family households are 2-person households, comprising 70, and the most common type of nonfamily households are 1-person households, comprising 133.
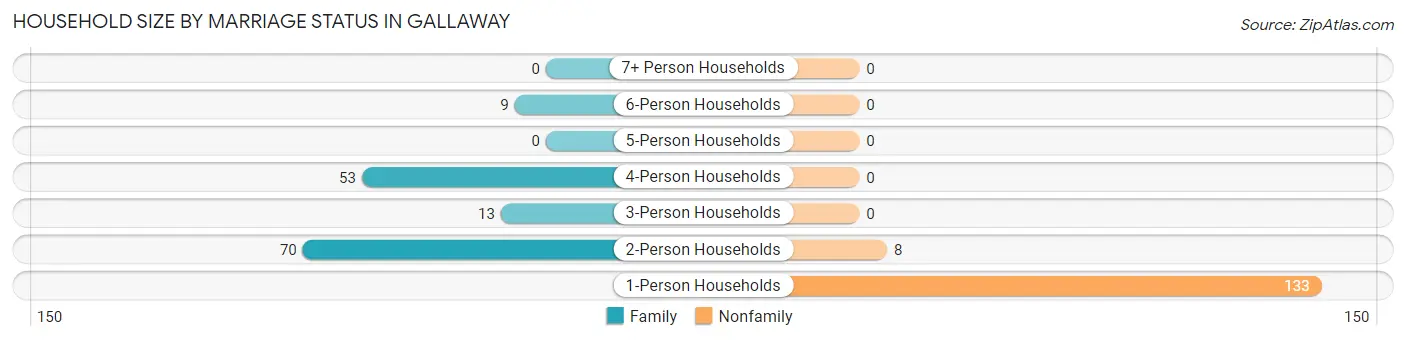
| Household Size | Family Households | Nonfamily Households |
| 1-Person Households | - | 133 (46.5%) |
| 2-Person Households | 70 (24.5%) | 8 (2.8%) |
| 3-Person Households | 13 (4.5%) | 0 (0.0%) |
| 4-Person Households | 53 (18.5%) | 0 (0.0%) |
| 5-Person Households | 0 (0.0%) | 0 (0.0%) |
| 6-Person Households | 9 (3.2%) | 0 (0.0%) |
| 7+ Person Households | 0 (0.0%) | 0 (0.0%) |
| Total | 145 (50.7%) | 141 (49.3%) |
Female Fertility in Gallaway
Fertility by Age in Gallaway
| Age Bracket | Women with Births | Births / 1,000 Women |
| 15 to 19 years | 0 (0.0%) | 0.0 |
| 20 to 34 years | 0 (0.0%) | 0.0 |
| 35 to 50 years | 0 (0.0%) | 0.0 |
| Total | 0 (0.0%) | 0.0 |
Fertility by Age by Marriage Status in Gallaway
| Age Bracket | Married | Unmarried |
| 15 to 19 years | 0 (0.0%) | 0 (0.0%) |
| 20 to 34 years | 0 (0.0%) | 0 (0.0%) |
| 35 to 50 years | 0 (0.0%) | 0 (0.0%) |
| Total | 0 (0.0%) | 0 (0.0%) |
Fertility by Education in Gallaway
| Educational Attainment | Women with Births | Births / 1,000 Women |
| Less than High School | 0 (0.0%) | 0.0 |
| High School Diploma | 0 (0.0%) | 0.0 |
| College or Associate's Degree | 0 (0.0%) | 0.0 |
| Bachelor's Degree | 0 (0.0%) | 0.0 |
| Graduate Degree | 0 (0.0%) | 0.0 |
| Total | 0 (0.0%) | 0.0 |
Fertility by Education by Marriage Status in Gallaway
| Educational Attainment | Married | Unmarried |
| Less than High School | 0 (0.0%) | 0 (0.0%) |
| High School Diploma | 0 (0.0%) | 0 (0.0%) |
| College or Associate's Degree | 0 (0.0%) | 0 (0.0%) |
| Bachelor's Degree | 0 (0.0%) | 0 (0.0%) |
| Graduate Degree | 0 (0.0%) | 0 (0.0%) |
| Total | 0 (0.0%) | 0 (0.0%) |
Employment Characteristics in Gallaway
Employment by Class of Employer in Gallaway
Among the 152 employed individuals in Gallaway, private company employees (125 | 82.2%), not-for-profit organizations (17 | 11.2%), and state government employees (8 | 5.3%) make up the most common classes of employment.
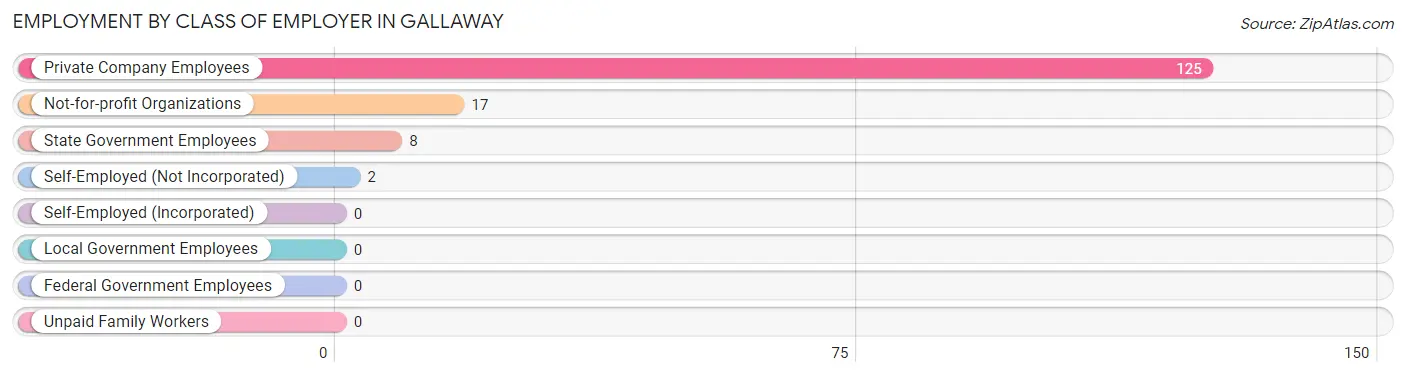
| Employer Class | # Employees | % Employees |
| Private Company Employees | 125 | 82.2% |
| Self-Employed (Incorporated) | 0 | 0.0% |
| Self-Employed (Not Incorporated) | 2 | 1.3% |
| Not-for-profit Organizations | 17 | 11.2% |
| Local Government Employees | 0 | 0.0% |
| State Government Employees | 8 | 5.3% |
| Federal Government Employees | 0 | 0.0% |
| Unpaid Family Workers | 0 | 0.0% |
| Total | 152 | 100.0% |
Employment Status by Age in Gallaway
According to the labor force statistics for Gallaway, out of the total population over 16 years of age (595), 36.3% or 216 individuals are in the labor force, with 24.1% or 52 of them unemployed. The age group with the highest labor force participation rate is 20 to 24 years, with 100.0% or 49 individuals in the labor force. Within the labor force, the 25 to 29 years age range has the highest percentage of unemployed individuals, with 64.8% or 35 of them being unemployed.
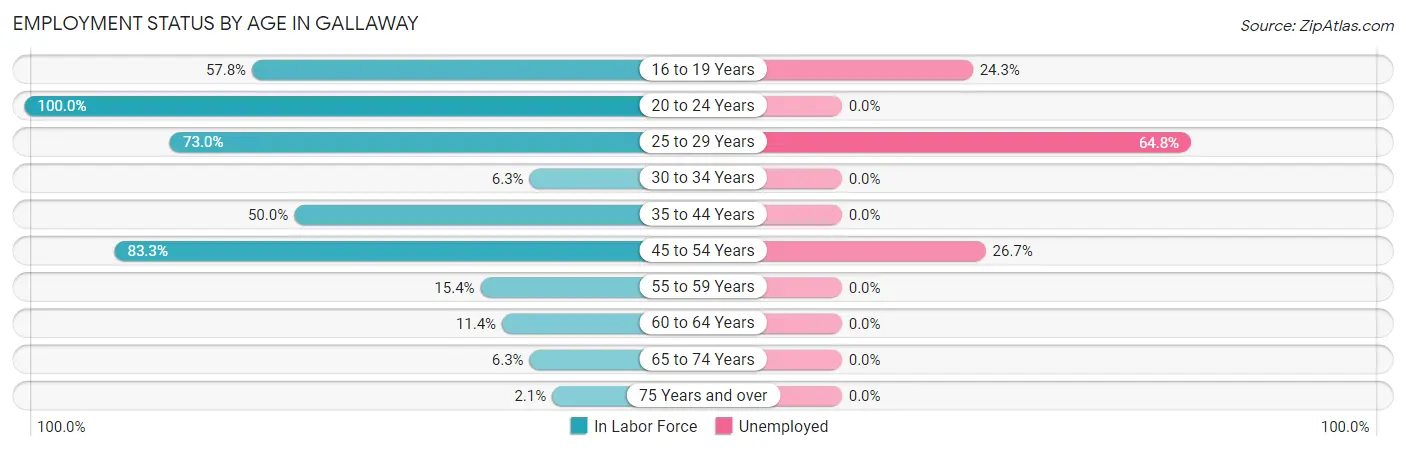
| Age Bracket | In Labor Force | Unemployed |
| 16 to 19 Years | 37 (57.8%) | 9 (24.3%) |
| 20 to 24 Years | 49 (100.0%) | 0 (0.0%) |
| 25 to 29 Years | 54 (73.0%) | 35 (64.8%) |
| 30 to 34 Years | 1 (6.3%) | 0 (0.0%) |
| 35 to 44 Years | 21 (50.0%) | 0 (0.0%) |
| 45 to 54 Years | 30 (83.3%) | 8 (26.7%) |
| 55 to 59 Years | 10 (15.4%) | 0 (0.0%) |
| 60 to 64 Years | 5 (11.4%) | 0 (0.0%) |
| 65 to 74 Years | 7 (6.3%) | 0 (0.0%) |
| 75 Years and over | 2 (2.1%) | 0 (0.0%) |
| Total | 216 (36.3%) | 52 (24.1%) |
Employment Status by Educational Attainment in Gallaway
According to labor force statistics for Gallaway, 43.7% of individuals (121) out of the total population between 25 and 64 years of age (277) are in the labor force, with 35.5% or 43 of them being unemployed. The group with the highest labor force participation rate are those with the educational attainment of high school diploma, with 61.0% or 50 individuals in the labor force. Within the labor force, individuals with college / associate degree education have the highest percentage of unemployment, with 71.4% or 35 of them being unemployed.
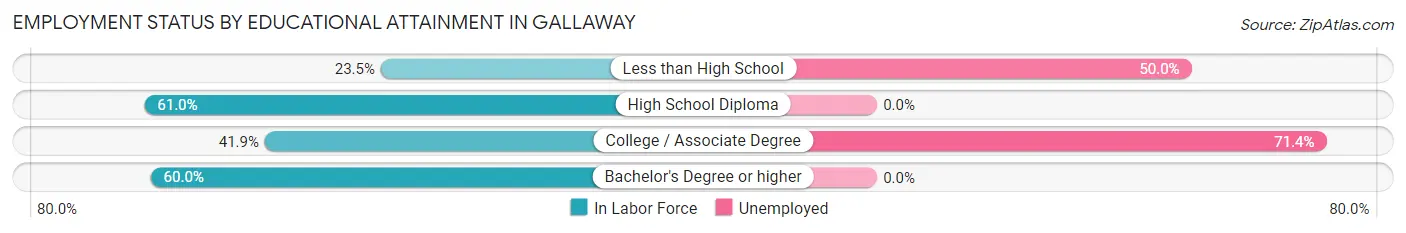
| Educational Attainment | In Labor Force | Unemployed |
| Less than High School | 16 (23.5%) | 34 (50.0%) |
| High School Diploma | 50 (61.0%) | 0 (0.0%) |
| College / Associate Degree | 49 (41.9%) | 84 (71.4%) |
| Bachelor's Degree or higher | 6 (60.0%) | 0 (0.0%) |
| Total | 121 (43.7%) | 98 (35.5%) |
Employment Occupations by Sex in Gallaway
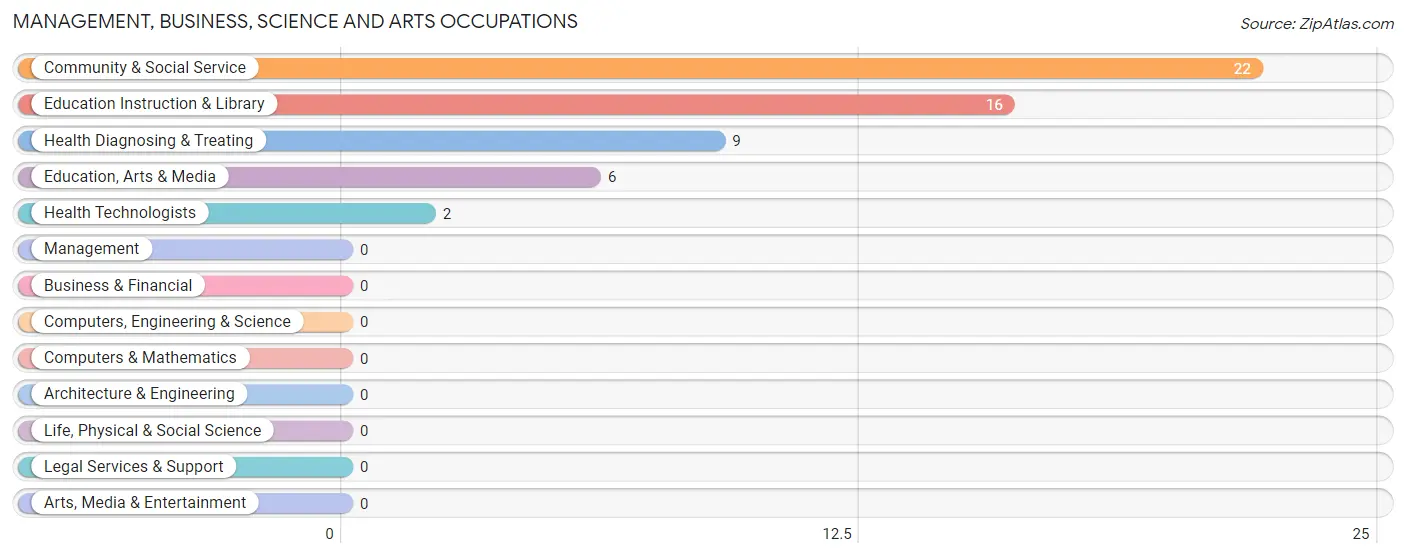
Management, Business, Science and Arts Occupations
The most common Management, Business, Science and Arts occupations in Gallaway are Community & Social Service (22 | 13.4%), Education Instruction & Library (16 | 9.8%), Health Diagnosing & Treating (9 | 5.5%), Education, Arts & Media (6 | 3.7%), and Health Technologists (2 | 1.2%).
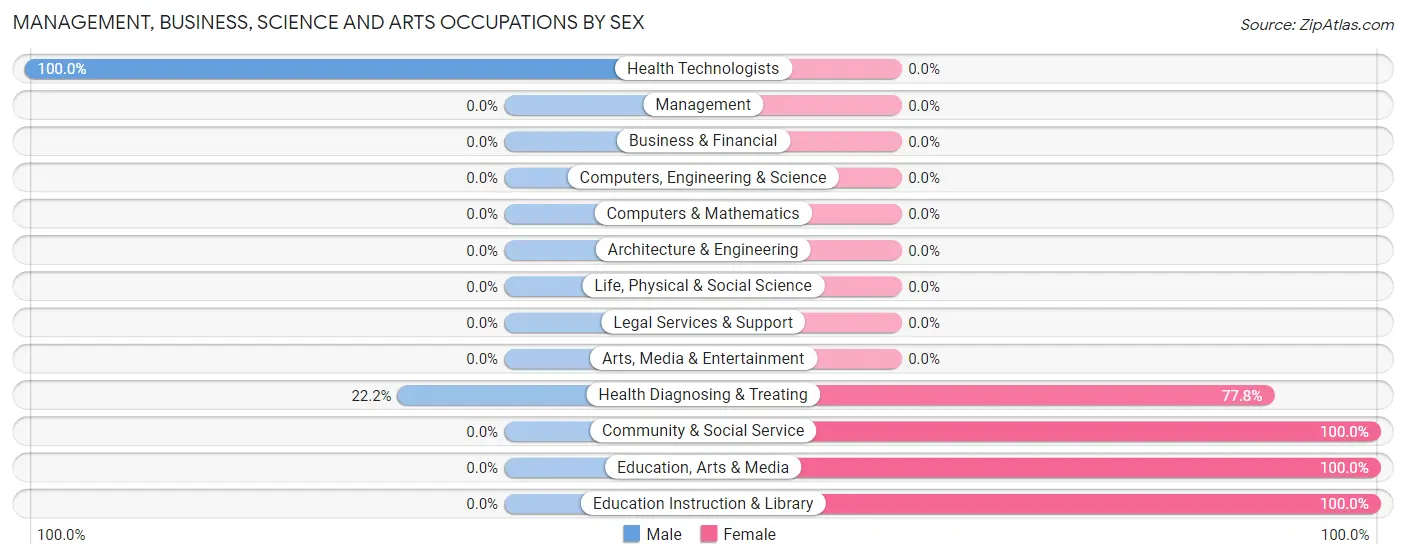
Management, Business, Science and Arts Occupations by Sex
Within the Management, Business, Science and Arts occupations in Gallaway, the most male-oriented occupations are Health Technologists (100.0%), and Health Diagnosing & Treating (22.2%), while the most female-oriented occupations are Community & Social Service (100.0%), Education, Arts & Media (100.0%), and Education Instruction & Library (100.0%).
| Occupation | Male | Female |
| Management | 0 (0.0%) | 0 (0.0%) |
| Business & Financial | 0 (0.0%) | 0 (0.0%) |
| Computers, Engineering & Science | 0 (0.0%) | 0 (0.0%) |
| Computers & Mathematics | 0 (0.0%) | 0 (0.0%) |
| Architecture & Engineering | 0 (0.0%) | 0 (0.0%) |
| Life, Physical & Social Science | 0 (0.0%) | 0 (0.0%) |
| Community & Social Service | 0 (0.0%) | 22 (100.0%) |
| Education, Arts & Media | 0 (0.0%) | 6 (100.0%) |
| Legal Services & Support | 0 (0.0%) | 0 (0.0%) |
| Education Instruction & Library | 0 (0.0%) | 16 (100.0%) |
| Arts, Media & Entertainment | 0 (0.0%) | 0 (0.0%) |
| Health Diagnosing & Treating | 2 (22.2%) | 7 (77.8%) |
| Health Technologists | 2 (100.0%) | 0 (0.0%) |
| Total (Category) | 2 (6.5%) | 29 (93.5%) |
| Total (Overall) | 51 (31.1%) | 113 (68.9%) |
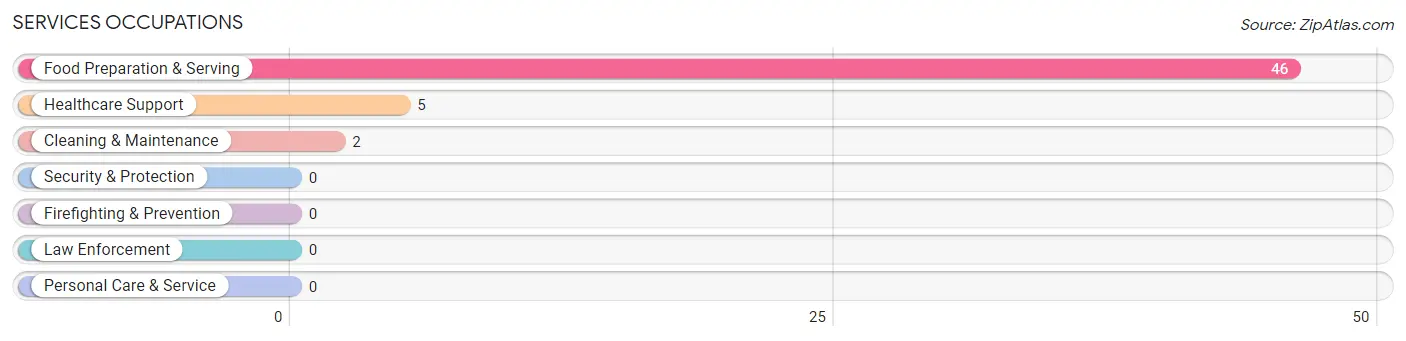
Services Occupations
The most common Services occupations in Gallaway are Food Preparation & Serving (46 | 28.1%), Healthcare Support (5 | 3.0%), and Cleaning & Maintenance (2 | 1.2%).
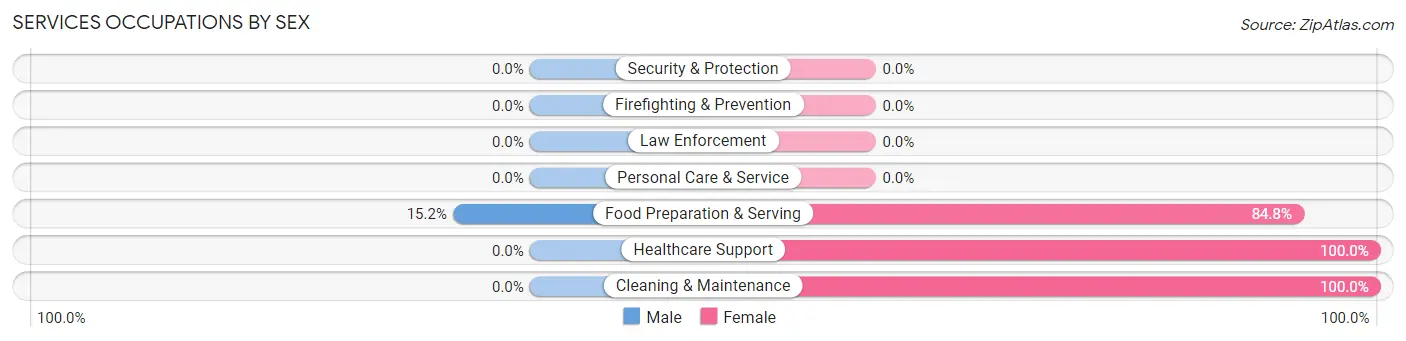
Services Occupations by Sex
| Occupation | Male | Female |
| Healthcare Support | 0 (0.0%) | 5 (100.0%) |
| Security & Protection | 0 (0.0%) | 0 (0.0%) |
| Firefighting & Prevention | 0 (0.0%) | 0 (0.0%) |
| Law Enforcement | 0 (0.0%) | 0 (0.0%) |
| Food Preparation & Serving | 7 (15.2%) | 39 (84.8%) |
| Cleaning & Maintenance | 0 (0.0%) | 2 (100.0%) |
| Personal Care & Service | 0 (0.0%) | 0 (0.0%) |
| Total (Category) | 7 (13.2%) | 46 (86.8%) |
| Total (Overall) | 51 (31.1%) | 113 (68.9%) |
Sales and Office Occupations
The most common Sales and Office occupations in Gallaway are Sales & Related (37 | 22.6%), and Office & Administration (19 | 11.6%).
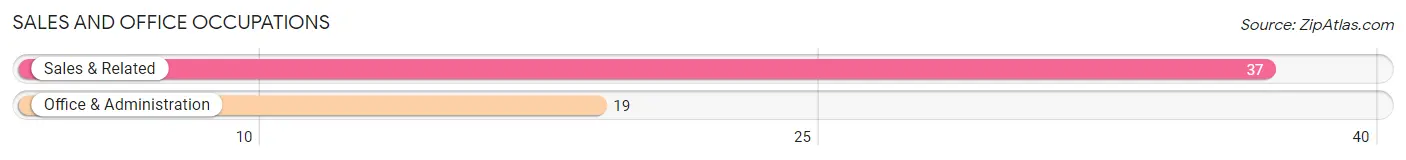
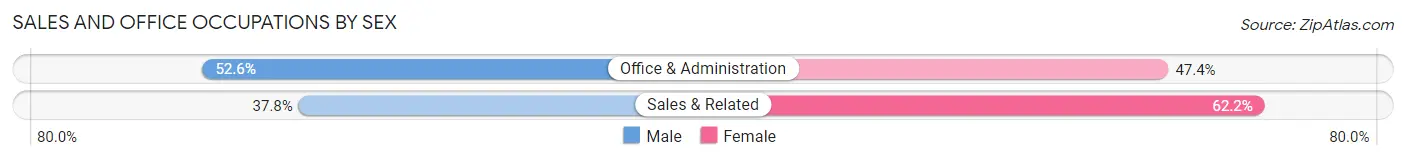
Sales and Office Occupations by Sex
| Occupation | Male | Female |
| Sales & Related | 14 (37.8%) | 23 (62.2%) |
| Office & Administration | 10 (52.6%) | 9 (47.4%) |
| Total (Category) | 24 (42.9%) | 32 (57.1%) |
| Total (Overall) | 51 (31.1%) | 113 (68.9%) |
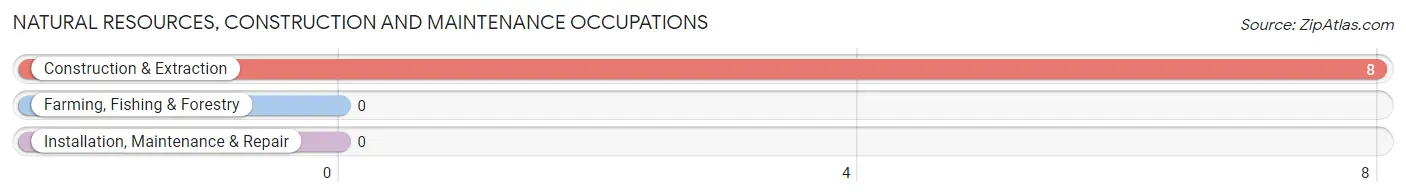
Natural Resources, Construction and Maintenance Occupations
The most common Natural Resources, Construction and Maintenance occupations in Gallaway are , and Construction & Extraction (8 | 4.9%).
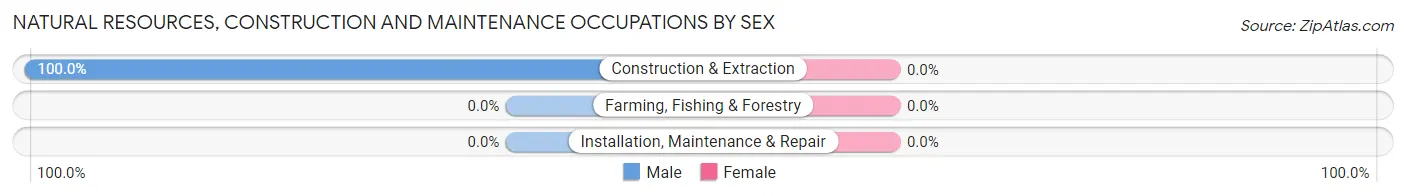
Natural Resources, Construction and Maintenance Occupations by Sex
| Occupation | Male | Female |
| Farming, Fishing & Forestry | 0 (0.0%) | 0 (0.0%) |
| Construction & Extraction | 8 (100.0%) | 0 (0.0%) |
| Installation, Maintenance & Repair | 0 (0.0%) | 0 (0.0%) |
| Total (Category) | 8 (100.0%) | 0 (0.0%) |
| Total (Overall) | 51 (31.1%) | 113 (68.9%) |
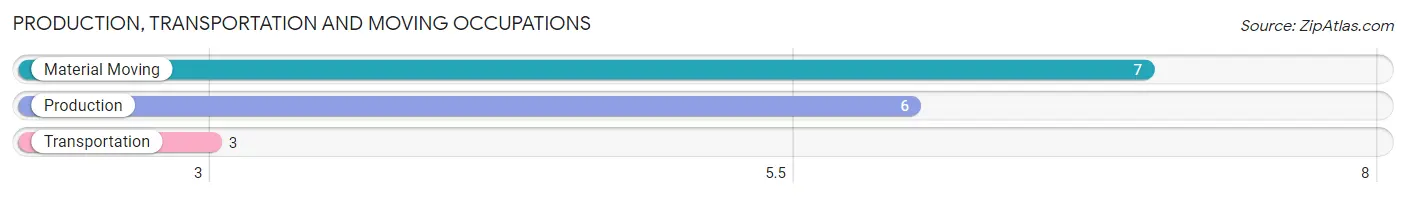
Production, Transportation and Moving Occupations
The most common Production, Transportation and Moving occupations in Gallaway are Material Moving (7 | 4.3%), Production (6 | 3.7%), and Transportation (3 | 1.8%).
Production, Transportation and Moving Occupations by Sex
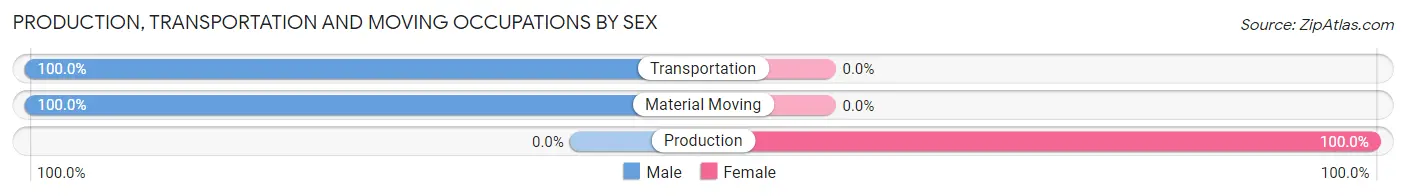
| Occupation | Male | Female |
| Production | 0 (0.0%) | 6 (100.0%) |
| Transportation | 3 (100.0%) | 0 (0.0%) |
| Material Moving | 7 (100.0%) | 0 (0.0%) |
| Total (Category) | 10 (62.5%) | 6 (37.5%) |
| Total (Overall) | 51 (31.1%) | 113 (68.9%) |
Employment Industries by Sex in Gallaway
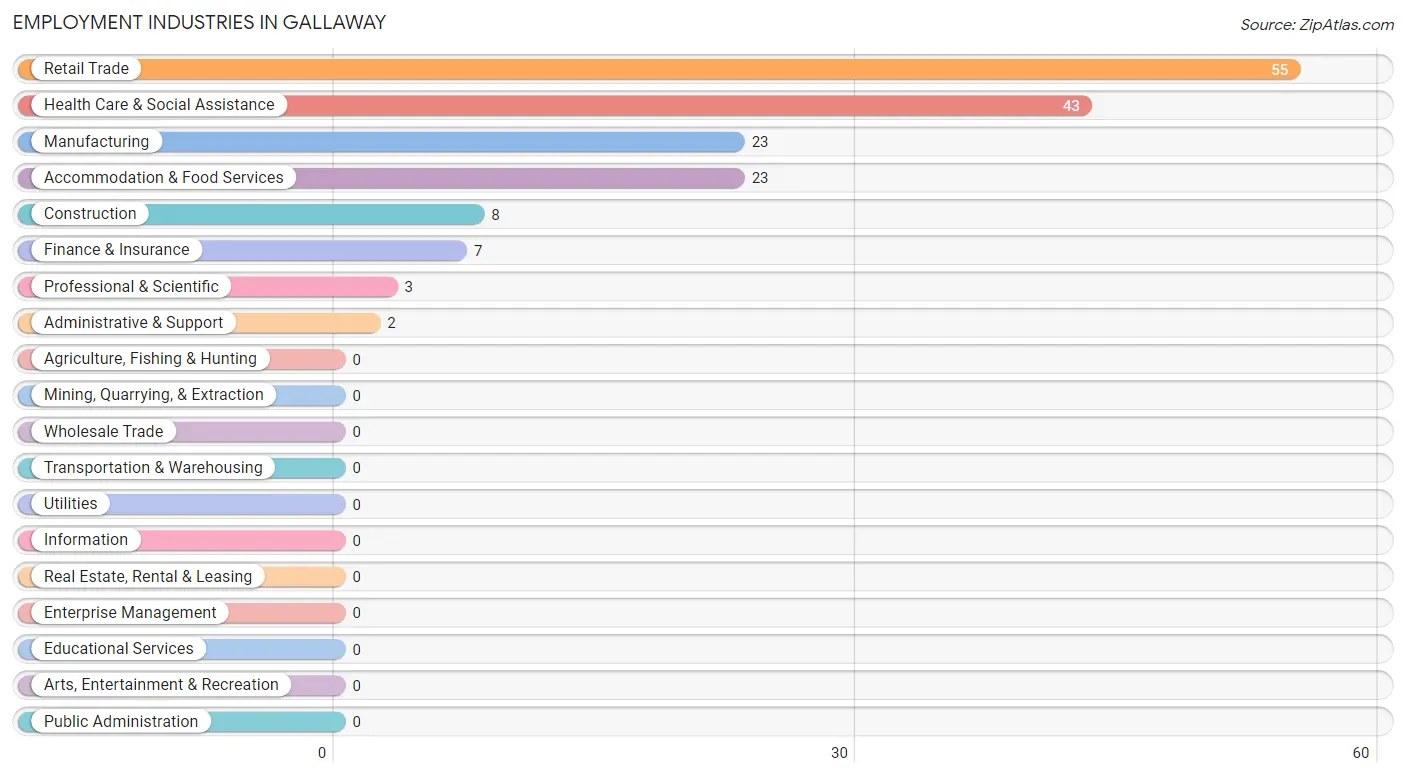
Employment Industries in Gallaway
The major employment industries in Gallaway include Retail Trade (55 | 33.5%), Health Care & Social Assistance (43 | 26.2%), Manufacturing (23 | 14.0%), Accommodation & Food Services (23 | 14.0%), and Construction (8 | 4.9%).
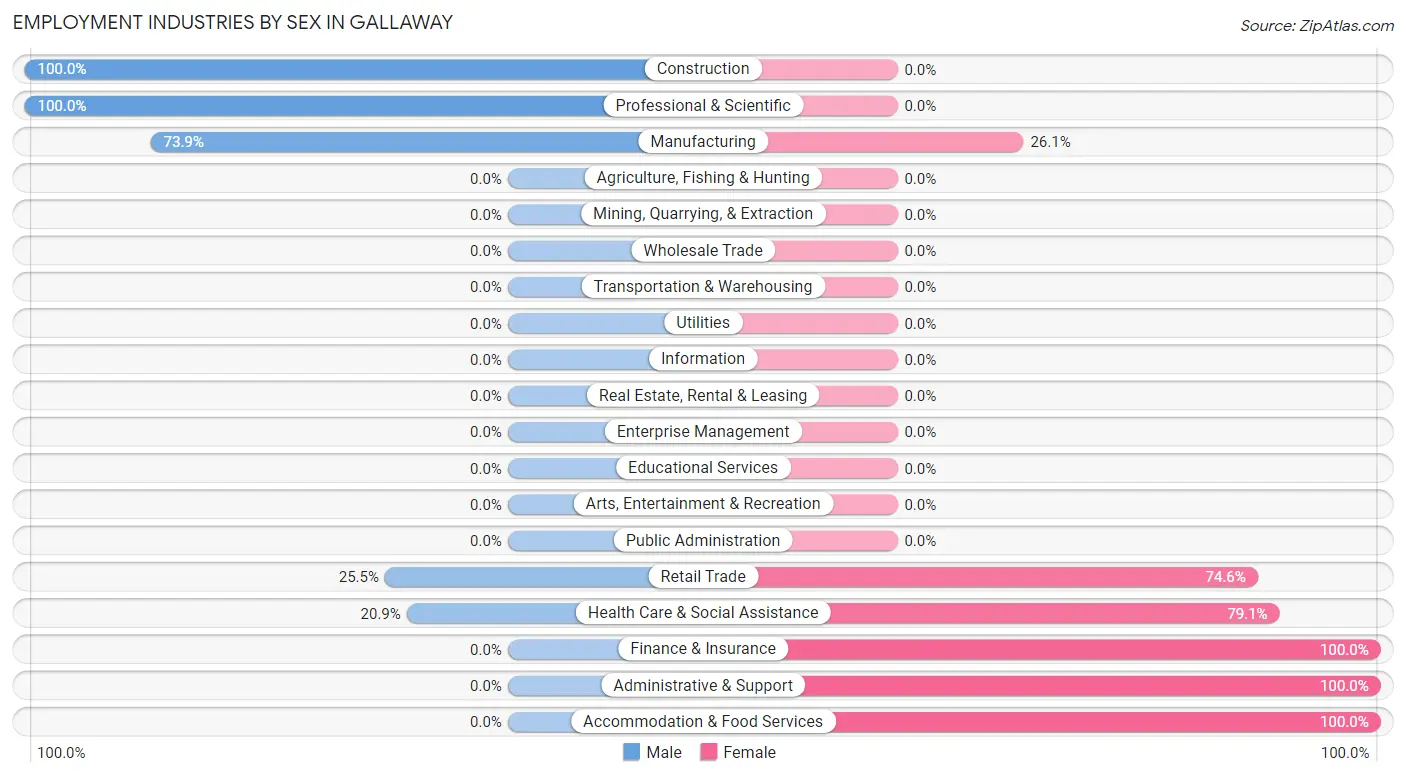
Employment Industries by Sex in Gallaway
The Gallaway industries that see more men than women are Construction (100.0%), Professional & Scientific (100.0%), and Manufacturing (73.9%), whereas the industries that tend to have a higher number of women are Finance & Insurance (100.0%), Administrative & Support (100.0%), and Accommodation & Food Services (100.0%).
| Industry | Male | Female |
| Agriculture, Fishing & Hunting | 0 (0.0%) | 0 (0.0%) |
| Mining, Quarrying, & Extraction | 0 (0.0%) | 0 (0.0%) |
| Construction | 8 (100.0%) | 0 (0.0%) |
| Manufacturing | 17 (73.9%) | 6 (26.1%) |
| Wholesale Trade | 0 (0.0%) | 0 (0.0%) |
| Retail Trade | 14 (25.5%) | 41 (74.6%) |
| Transportation & Warehousing | 0 (0.0%) | 0 (0.0%) |
| Utilities | 0 (0.0%) | 0 (0.0%) |
| Information | 0 (0.0%) | 0 (0.0%) |
| Finance & Insurance | 0 (0.0%) | 7 (100.0%) |
| Real Estate, Rental & Leasing | 0 (0.0%) | 0 (0.0%) |
| Professional & Scientific | 3 (100.0%) | 0 (0.0%) |
| Enterprise Management | 0 (0.0%) | 0 (0.0%) |
| Administrative & Support | 0 (0.0%) | 2 (100.0%) |
| Educational Services | 0 (0.0%) | 0 (0.0%) |
| Health Care & Social Assistance | 9 (20.9%) | 34 (79.1%) |
| Arts, Entertainment & Recreation | 0 (0.0%) | 0 (0.0%) |
| Accommodation & Food Services | 0 (0.0%) | 23 (100.0%) |
| Public Administration | 0 (0.0%) | 0 (0.0%) |
| Total | 51 (31.1%) | 113 (68.9%) |
Education in Gallaway
School Enrollment in Gallaway
The most common levels of schooling among the 109 students in Gallaway are elementary school (33 | 30.3%), high school (30 | 27.5%), and college / undergraduate (14 | 12.8%).
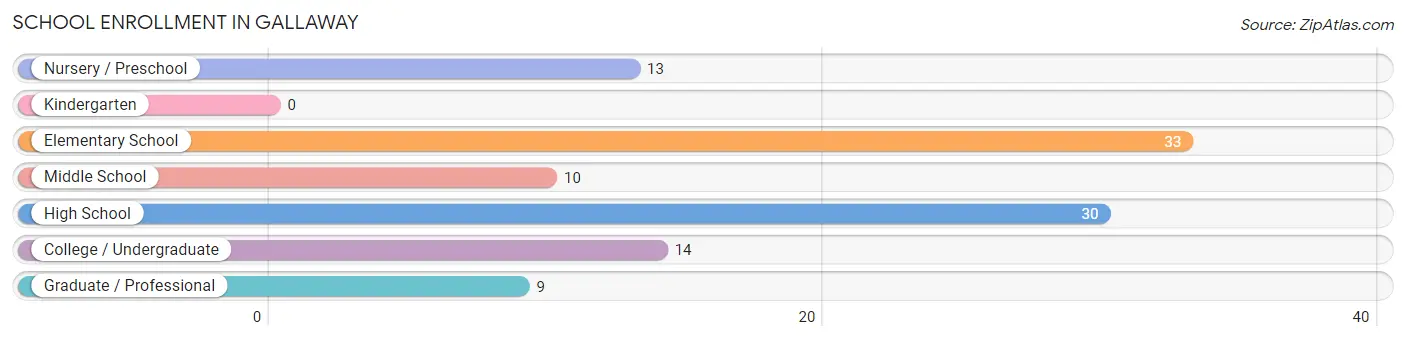
| School Level | # Students | % Students |
| Nursery / Preschool | 13 | 11.9% |
| Kindergarten | 0 | 0.0% |
| Elementary School | 33 | 30.3% |
| Middle School | 10 | 9.2% |
| High School | 30 | 27.5% |
| College / Undergraduate | 14 | 12.8% |
| Graduate / Professional | 9 | 8.3% |
| Total | 109 | 100.0% |
School Enrollment by Age by Funding Source in Gallaway
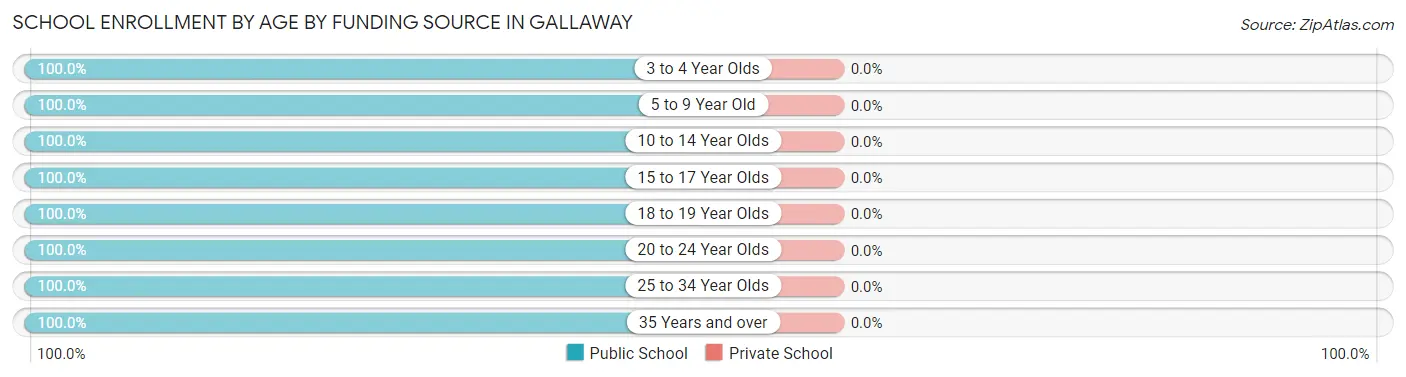
| Age Bracket | Public School | Private School |
| 3 to 4 Year Olds | 13 (100.0%) | 0 (0.0%) |
| 5 to 9 Year Old | 33 (100.0%) | 0 (0.0%) |
| 10 to 14 Year Olds | 10 (100.0%) | 0 (0.0%) |
| 15 to 17 Year Olds | 26 (100.0%) | 0 (0.0%) |
| 18 to 19 Year Olds | 4 (100.0%) | 0 (0.0%) |
| 20 to 24 Year Olds | 7 (100.0%) | 0 (0.0%) |
| 25 to 34 Year Olds | 9 (100.0%) | 0 (0.0%) |
| 35 Years and over | 7 (100.0%) | 0 (0.0%) |
| Total | 109 (100.0%) | 0 (0.0%) |
Educational Attainment by Field of Study in Gallaway
Physical & health sciences (14 | 30.4%), education (11 | 23.9%), visual & performing arts (9 | 19.6%), social sciences (6 | 13.0%), and psychology (4 | 8.7%) are the most common fields of study among 46 individuals in Gallaway who have obtained a bachelor's degree or higher.
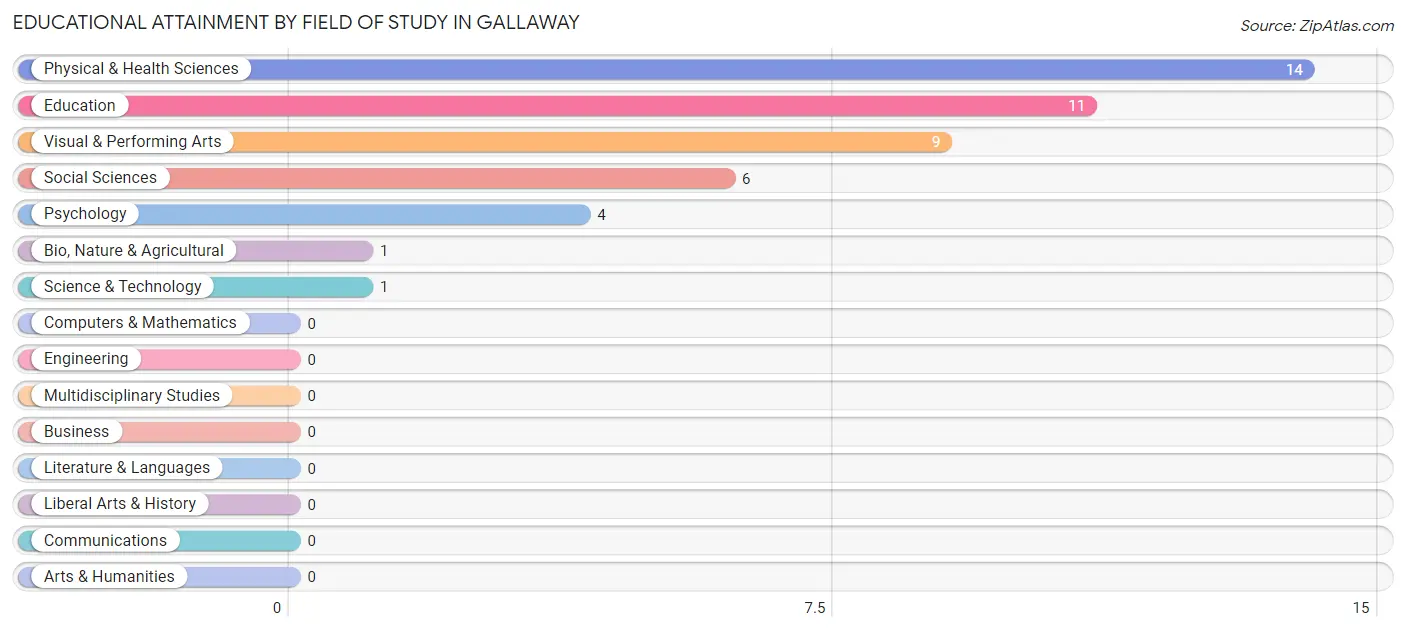
| Field of Study | # Graduates | % Graduates |
| Computers & Mathematics | 0 | 0.0% |
| Bio, Nature & Agricultural | 1 | 2.2% |
| Physical & Health Sciences | 14 | 30.4% |
| Psychology | 4 | 8.7% |
| Social Sciences | 6 | 13.0% |
| Engineering | 0 | 0.0% |
| Multidisciplinary Studies | 0 | 0.0% |
| Science & Technology | 1 | 2.2% |
| Business | 0 | 0.0% |
| Education | 11 | 23.9% |
| Literature & Languages | 0 | 0.0% |
| Liberal Arts & History | 0 | 0.0% |
| Visual & Performing Arts | 9 | 19.6% |
| Communications | 0 | 0.0% |
| Arts & Humanities | 0 | 0.0% |
| Total | 46 | 100.0% |
Transportation & Commute in Gallaway
Vehicle Availability by Sex in Gallaway
The most prevalent vehicle ownership categories in Gallaway are males with 2 vehicles (31, accounting for 60.8%) and females with 2 vehicles (24, making up 30.7%).
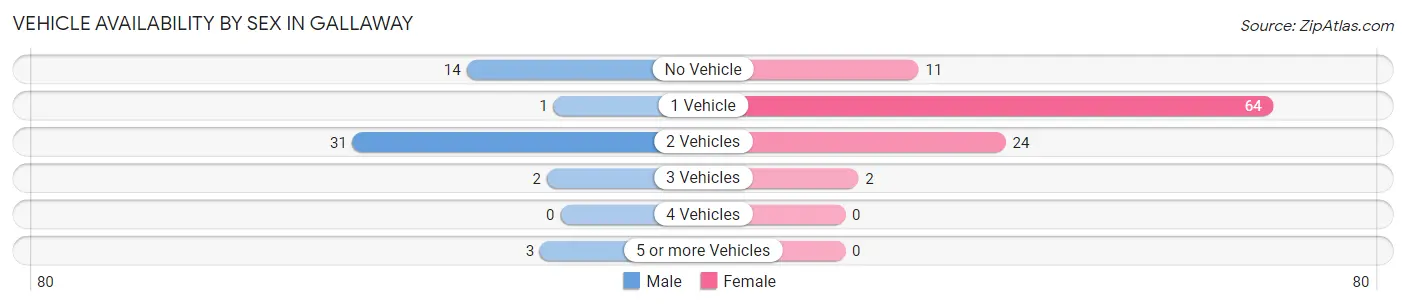
| Vehicles Available | Male | Female |
| No Vehicle | 14 (27.5%) | 11 (10.9%) |
| 1 Vehicle | 1 (2.0%) | 64 (63.4%) |
| 2 Vehicles | 31 (60.8%) | 24 (23.8%) |
| 3 Vehicles | 2 (3.9%) | 2 (2.0%) |
| 4 Vehicles | 0 (0.0%) | 0 (0.0%) |
| 5 or more Vehicles | 3 (5.9%) | 0 (0.0%) |
| Total | 51 (100.0%) | 101 (100.0%) |
Commute Time in Gallaway
The most frequently occuring commute durations in Gallaway are 10 to 14 minutes (28 commuters, 20.3%), 15 to 19 minutes (23 commuters, 16.7%), and 25 to 29 minutes (23 commuters, 16.7%).
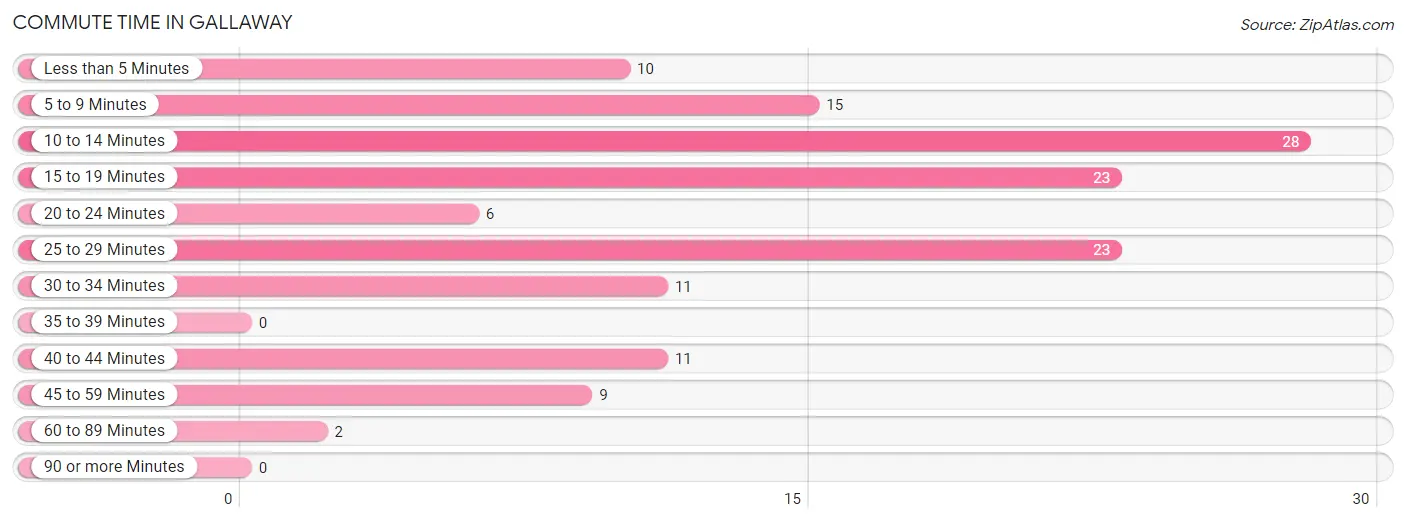
| Commute Time | # Commuters | % Commuters |
| Less than 5 Minutes | 10 | 7.2% |
| 5 to 9 Minutes | 15 | 10.9% |
| 10 to 14 Minutes | 28 | 20.3% |
| 15 to 19 Minutes | 23 | 16.7% |
| 20 to 24 Minutes | 6 | 4.3% |
| 25 to 29 Minutes | 23 | 16.7% |
| 30 to 34 Minutes | 11 | 8.0% |
| 35 to 39 Minutes | 0 | 0.0% |
| 40 to 44 Minutes | 11 | 8.0% |
| 45 to 59 Minutes | 9 | 6.5% |
| 60 to 89 Minutes | 2 | 1.5% |
| 90 or more Minutes | 0 | 0.0% |
Commute Time by Sex in Gallaway
The most common commute times in Gallaway are 25 to 29 minutes (16 commuters, 43.2%) for males and 10 to 14 minutes (28 commuters, 27.7%) for females.
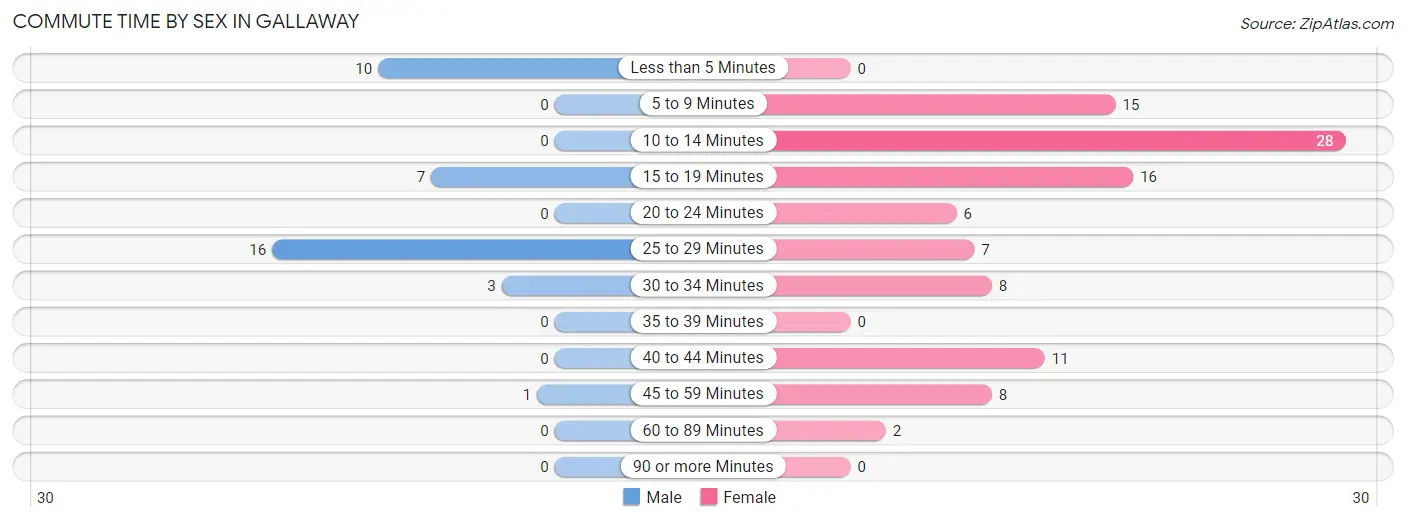
| Commute Time | Male | Female |
| Less than 5 Minutes | 10 (27.0%) | 0 (0.0%) |
| 5 to 9 Minutes | 0 (0.0%) | 15 (14.8%) |
| 10 to 14 Minutes | 0 (0.0%) | 28 (27.7%) |
| 15 to 19 Minutes | 7 (18.9%) | 16 (15.8%) |
| 20 to 24 Minutes | 0 (0.0%) | 6 (5.9%) |
| 25 to 29 Minutes | 16 (43.2%) | 7 (6.9%) |
| 30 to 34 Minutes | 3 (8.1%) | 8 (7.9%) |
| 35 to 39 Minutes | 0 (0.0%) | 0 (0.0%) |
| 40 to 44 Minutes | 0 (0.0%) | 11 (10.9%) |
| 45 to 59 Minutes | 1 (2.7%) | 8 (7.9%) |
| 60 to 89 Minutes | 0 (0.0%) | 2 (2.0%) |
| 90 or more Minutes | 0 (0.0%) | 0 (0.0%) |
Time of Departure to Work by Sex in Gallaway
The most frequent times of departure to work in Gallaway are 7:00 AM to 7:29 AM (9, 24.3%) for males and 7:00 AM to 7:29 AM (40, 39.6%) for females.
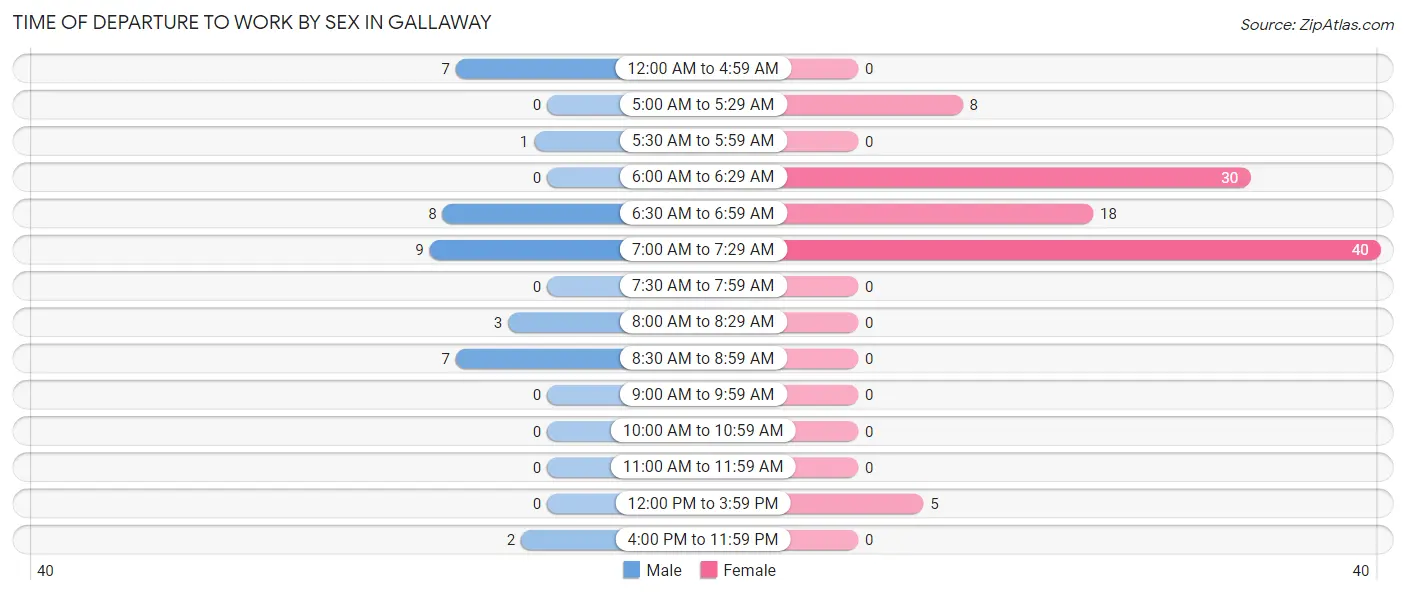
| Time of Departure | Male | Female |
| 12:00 AM to 4:59 AM | 7 (18.9%) | 0 (0.0%) |
| 5:00 AM to 5:29 AM | 0 (0.0%) | 8 (7.9%) |
| 5:30 AM to 5:59 AM | 1 (2.7%) | 0 (0.0%) |
| 6:00 AM to 6:29 AM | 0 (0.0%) | 30 (29.7%) |
| 6:30 AM to 6:59 AM | 8 (21.6%) | 18 (17.8%) |
| 7:00 AM to 7:29 AM | 9 (24.3%) | 40 (39.6%) |
| 7:30 AM to 7:59 AM | 0 (0.0%) | 0 (0.0%) |
| 8:00 AM to 8:29 AM | 3 (8.1%) | 0 (0.0%) |
| 8:30 AM to 8:59 AM | 7 (18.9%) | 0 (0.0%) |
| 9:00 AM to 9:59 AM | 0 (0.0%) | 0 (0.0%) |
| 10:00 AM to 10:59 AM | 0 (0.0%) | 0 (0.0%) |
| 11:00 AM to 11:59 AM | 0 (0.0%) | 0 (0.0%) |
| 12:00 PM to 3:59 PM | 0 (0.0%) | 5 (5.0%) |
| 4:00 PM to 11:59 PM | 2 (5.4%) | 0 (0.0%) |
| Total | 37 (100.0%) | 101 (100.0%) |
Housing Occupancy in Gallaway
Occupancy by Ownership in Gallaway
Of the total 286 dwellings in Gallaway, owner-occupied units account for 87 (30.4%), while renter-occupied units make up 199 (69.6%).
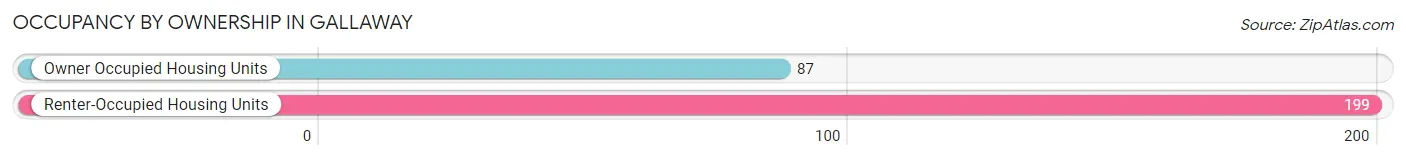
| Occupancy | # Housing Units | % Housing Units |
| Owner Occupied Housing Units | 87 | 30.4% |
| Renter-Occupied Housing Units | 199 | 69.6% |
| Total Occupied Housing Units | 286 | 100.0% |
Occupancy by Household Size in Gallaway
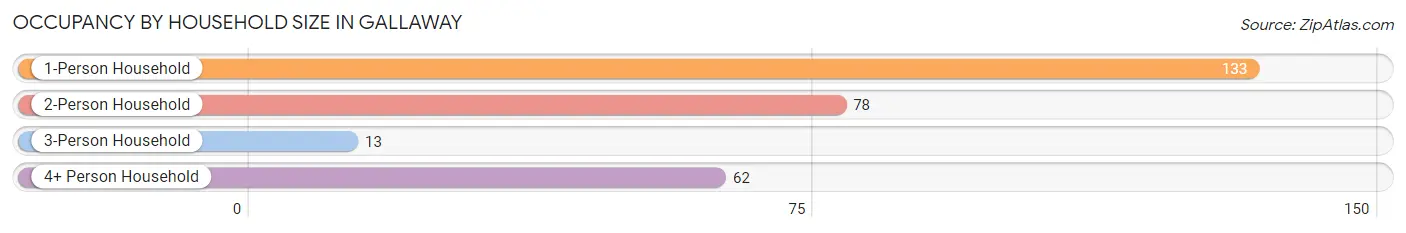
| Household Size | # Housing Units | % Housing Units |
| 1-Person Household | 133 | 46.5% |
| 2-Person Household | 78 | 27.3% |
| 3-Person Household | 13 | 4.5% |
| 4+ Person Household | 62 | 21.7% |
| Total Housing Units | 286 | 100.0% |
Occupancy by Ownership by Household Size in Gallaway
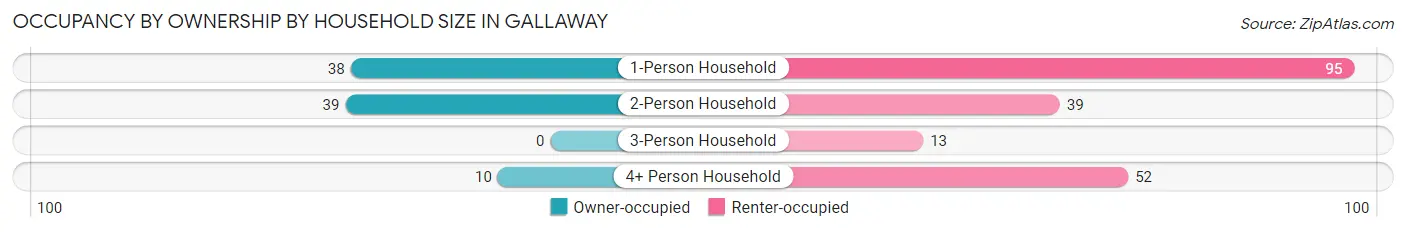
| Household Size | Owner-occupied | Renter-occupied |
| 1-Person Household | 38 (28.6%) | 95 (71.4%) |
| 2-Person Household | 39 (50.0%) | 39 (50.0%) |
| 3-Person Household | 0 (0.0%) | 13 (100.0%) |
| 4+ Person Household | 10 (16.1%) | 52 (83.9%) |
| Total Housing Units | 87 (30.4%) | 199 (69.6%) |
Occupancy by Educational Attainment in Gallaway
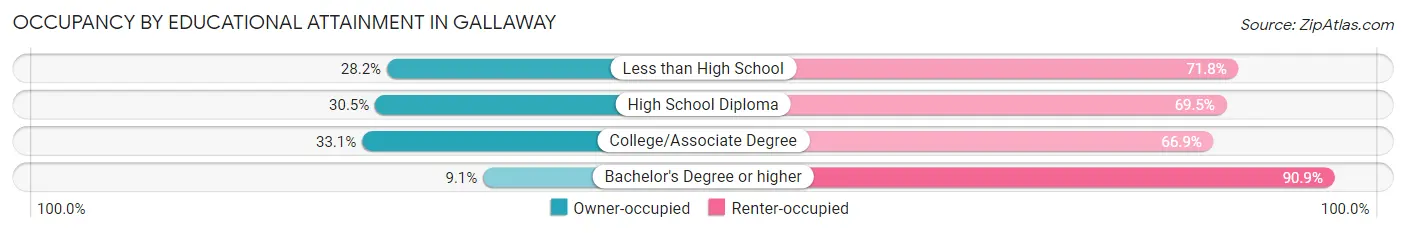
| Household Size | Owner-occupied | Renter-occupied |
| Less than High School | 20 (28.2%) | 51 (71.8%) |
| High School Diploma | 18 (30.5%) | 41 (69.5%) |
| College/Associate Degree | 48 (33.1%) | 97 (66.9%) |
| Bachelor's Degree or higher | 1 (9.1%) | 10 (90.9%) |
Occupancy by Age of Householder in Gallaway
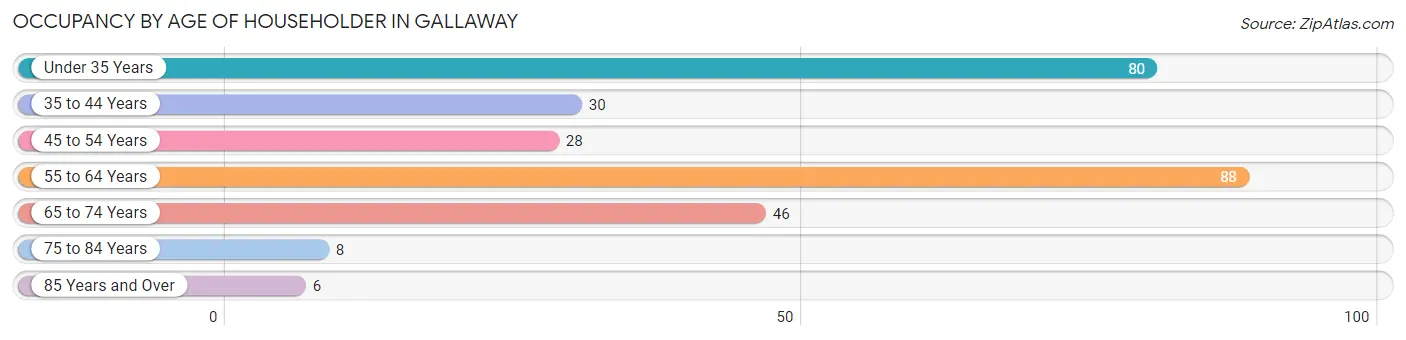
| Age Bracket | # Households | % Households |
| Under 35 Years | 80 | 28.0% |
| 35 to 44 Years | 30 | 10.5% |
| 45 to 54 Years | 28 | 9.8% |
| 55 to 64 Years | 88 | 30.8% |
| 65 to 74 Years | 46 | 16.1% |
| 75 to 84 Years | 8 | 2.8% |
| 85 Years and Over | 6 | 2.1% |
| Total | 286 | 100.0% |
Housing Finances in Gallaway
Median Income by Occupancy in Gallaway
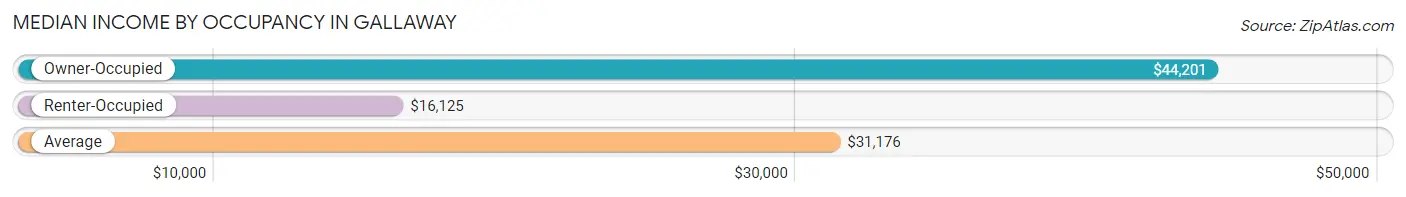
| Occupancy Type | # Households | Median Income |
| Owner-Occupied | 87 (30.4%) | $44,201 |
| Renter-Occupied | 199 (69.6%) | $16,125 |
| Average | 286 (100.0%) | $31,176 |
Occupancy by Householder Income Bracket in Gallaway
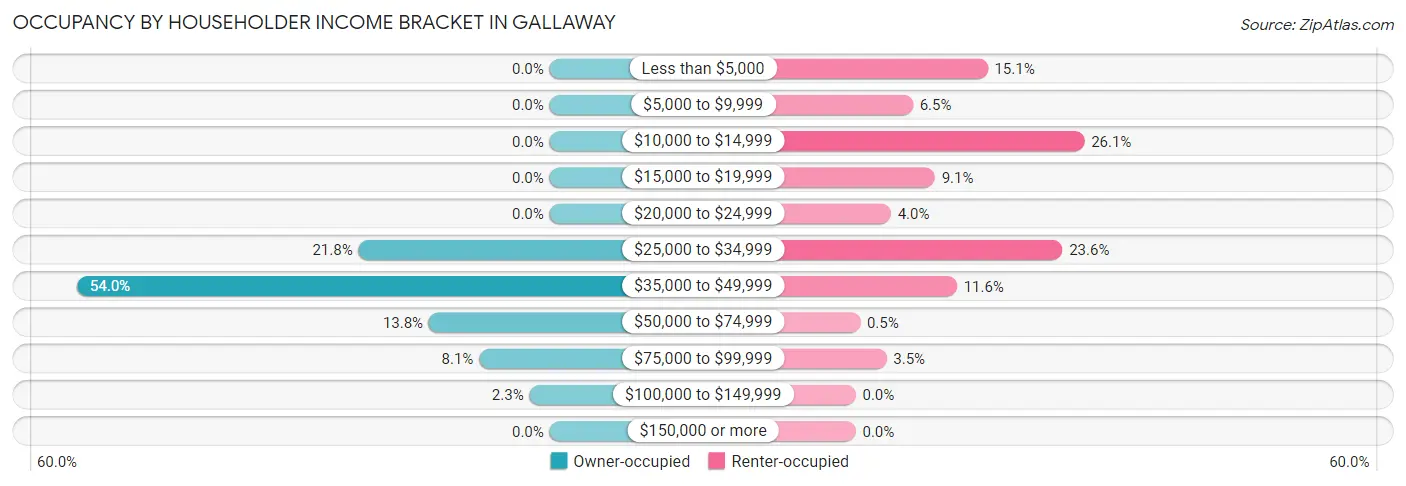
| Income Bracket | Owner-occupied | Renter-occupied |
| Less than $5,000 | 0 (0.0%) | 30 (15.1%) |
| $5,000 to $9,999 | 0 (0.0%) | 13 (6.5%) |
| $10,000 to $14,999 | 0 (0.0%) | 52 (26.1%) |
| $15,000 to $19,999 | 0 (0.0%) | 18 (9.0%) |
| $20,000 to $24,999 | 0 (0.0%) | 8 (4.0%) |
| $25,000 to $34,999 | 19 (21.8%) | 47 (23.6%) |
| $35,000 to $49,999 | 47 (54.0%) | 23 (11.6%) |
| $50,000 to $74,999 | 12 (13.8%) | 1 (0.5%) |
| $75,000 to $99,999 | 7 (8.1%) | 7 (3.5%) |
| $100,000 to $149,999 | 2 (2.3%) | 0 (0.0%) |
| $150,000 or more | 0 (0.0%) | 0 (0.0%) |
| Total | 87 (100.0%) | 199 (100.0%) |
Monthly Housing Cost Tiers in Gallaway
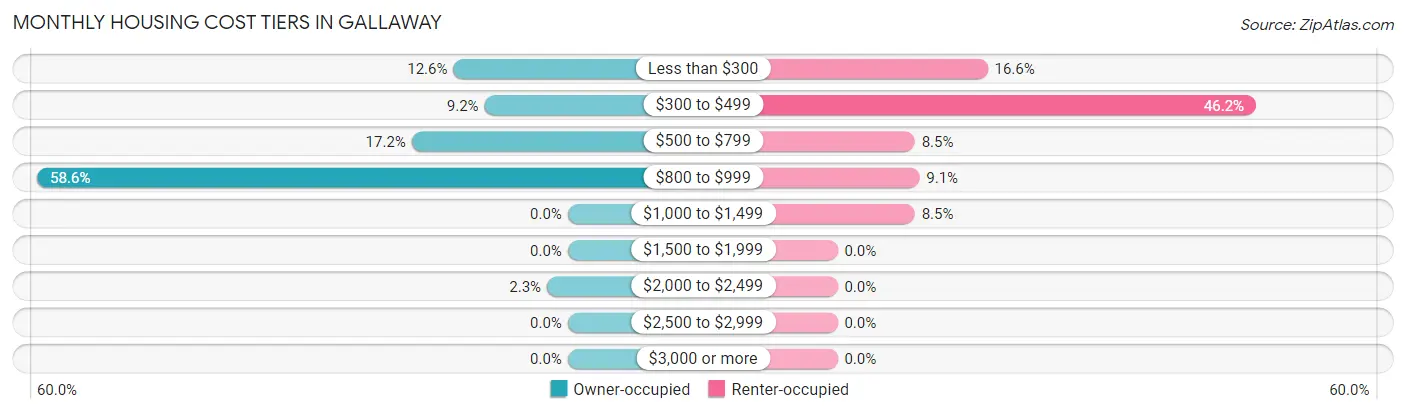
| Monthly Cost | Owner-occupied | Renter-occupied |
| Less than $300 | 11 (12.6%) | 33 (16.6%) |
| $300 to $499 | 8 (9.2%) | 92 (46.2%) |
| $500 to $799 | 15 (17.2%) | 17 (8.5%) |
| $800 to $999 | 51 (58.6%) | 18 (9.0%) |
| $1,000 to $1,499 | 0 (0.0%) | 17 (8.5%) |
| $1,500 to $1,999 | 0 (0.0%) | 0 (0.0%) |
| $2,000 to $2,499 | 2 (2.3%) | 0 (0.0%) |
| $2,500 to $2,999 | 0 (0.0%) | 0 (0.0%) |
| $3,000 or more | 0 (0.0%) | 0 (0.0%) |
| Total | 87 (100.0%) | 199 (100.0%) |
Physical Housing Characteristics in Gallaway
Housing Structures in Gallaway
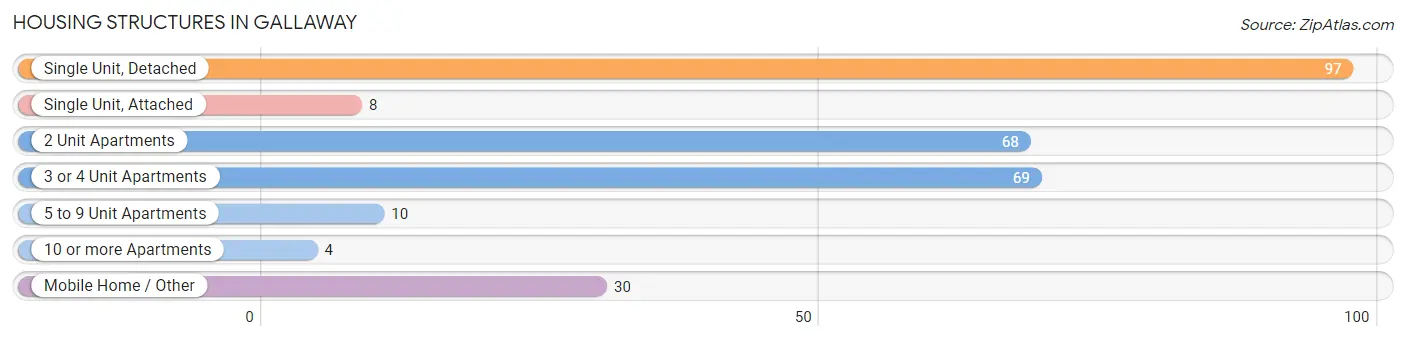
| Structure Type | # Housing Units | % Housing Units |
| Single Unit, Detached | 97 | 33.9% |
| Single Unit, Attached | 8 | 2.8% |
| 2 Unit Apartments | 68 | 23.8% |
| 3 or 4 Unit Apartments | 69 | 24.1% |
| 5 to 9 Unit Apartments | 10 | 3.5% |
| 10 or more Apartments | 4 | 1.4% |
| Mobile Home / Other | 30 | 10.5% |
| Total | 286 | 100.0% |
Housing Structures by Occupancy in Gallaway
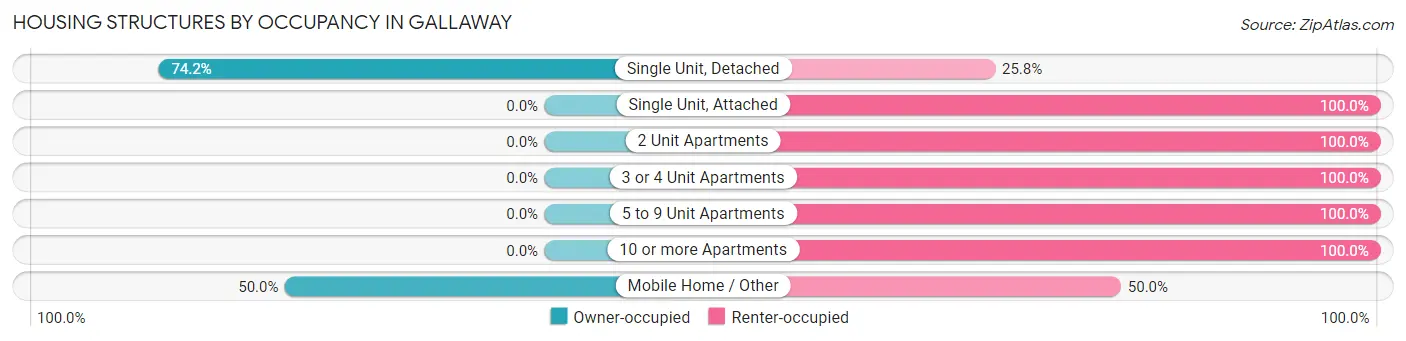
| Structure Type | Owner-occupied | Renter-occupied |
| Single Unit, Detached | 72 (74.2%) | 25 (25.8%) |
| Single Unit, Attached | 0 (0.0%) | 8 (100.0%) |
| 2 Unit Apartments | 0 (0.0%) | 68 (100.0%) |
| 3 or 4 Unit Apartments | 0 (0.0%) | 69 (100.0%) |
| 5 to 9 Unit Apartments | 0 (0.0%) | 10 (100.0%) |
| 10 or more Apartments | 0 (0.0%) | 4 (100.0%) |
| Mobile Home / Other | 15 (50.0%) | 15 (50.0%) |
| Total | 87 (30.4%) | 199 (69.6%) |
Housing Structures by Number of Rooms in Gallaway
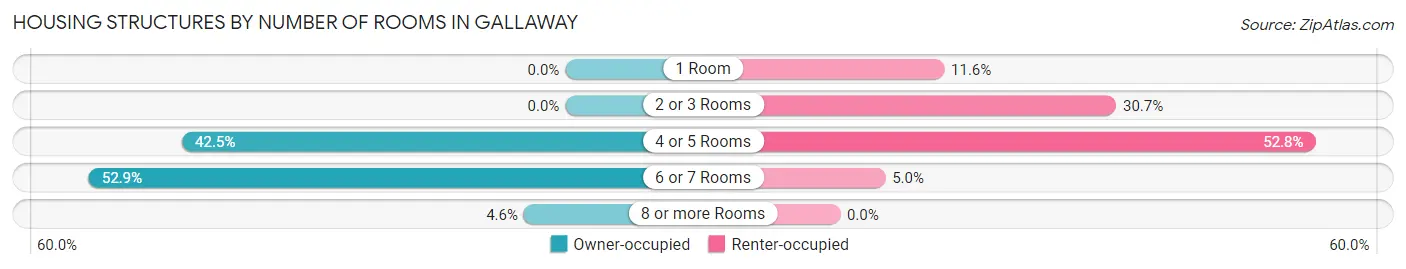
| Number of Rooms | Owner-occupied | Renter-occupied |
| 1 Room | 0 (0.0%) | 23 (11.6%) |
| 2 or 3 Rooms | 0 (0.0%) | 61 (30.6%) |
| 4 or 5 Rooms | 37 (42.5%) | 105 (52.8%) |
| 6 or 7 Rooms | 46 (52.9%) | 10 (5.0%) |
| 8 or more Rooms | 4 (4.6%) | 0 (0.0%) |
| Total | 87 (100.0%) | 199 (100.0%) |
Housing Structure by Heating Type in Gallaway
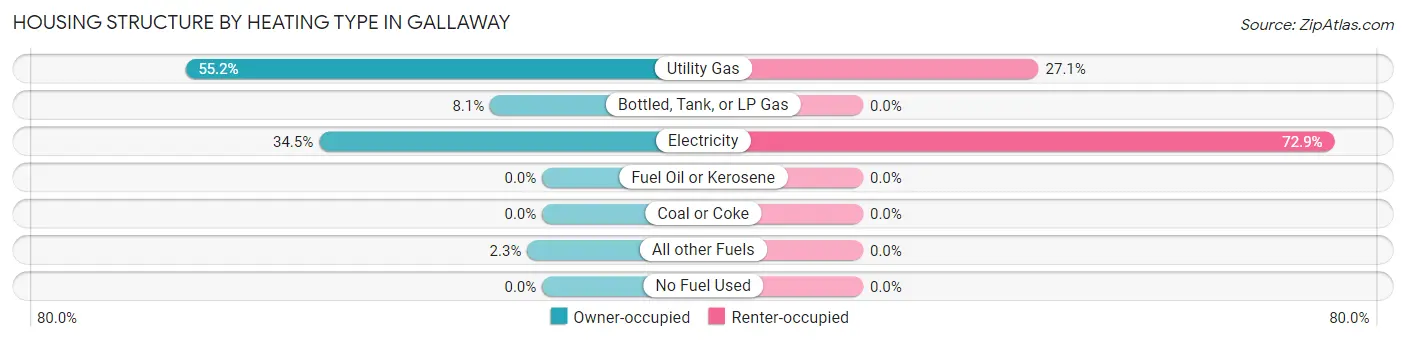
| Heating Type | Owner-occupied | Renter-occupied |
| Utility Gas | 48 (55.2%) | 54 (27.1%) |
| Bottled, Tank, or LP Gas | 7 (8.1%) | 0 (0.0%) |
| Electricity | 30 (34.5%) | 145 (72.9%) |
| Fuel Oil or Kerosene | 0 (0.0%) | 0 (0.0%) |
| Coal or Coke | 0 (0.0%) | 0 (0.0%) |
| All other Fuels | 2 (2.3%) | 0 (0.0%) |
| No Fuel Used | 0 (0.0%) | 0 (0.0%) |
| Total | 87 (100.0%) | 199 (100.0%) |
Household Vehicle Usage in Gallaway
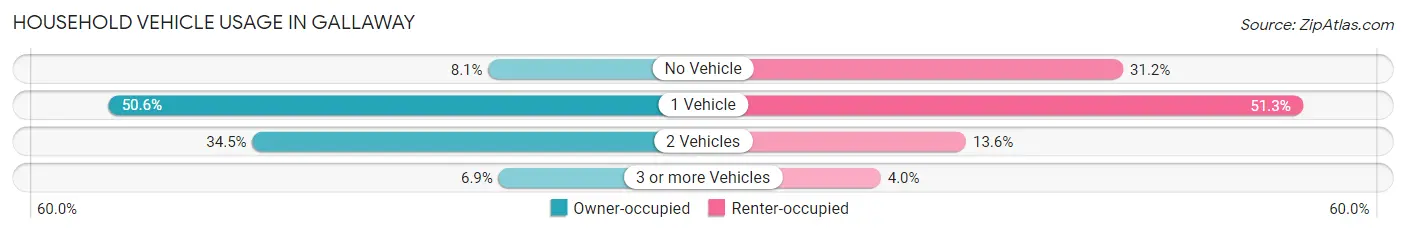
| Vehicles per Household | Owner-occupied | Renter-occupied |
| No Vehicle | 7 (8.1%) | 62 (31.2%) |
| 1 Vehicle | 44 (50.6%) | 102 (51.3%) |
| 2 Vehicles | 30 (34.5%) | 27 (13.6%) |
| 3 or more Vehicles | 6 (6.9%) | 8 (4.0%) |
| Total | 87 (100.0%) | 199 (100.0%) |
Real Estate & Mortgages in Gallaway
Real Estate and Mortgage Overview in Gallaway
| Characteristic | Without Mortgage | With Mortgage |
| Housing Units | 32 | 55 |
| Median Property Value | $110,400 | $214,600 |
| Median Household Income | $32,059 | $0 |
| Monthly Housing Costs | $379 | $0 |
| Real Estate Taxes | $517 | $0 |
Property Value by Mortgage Status in Gallaway
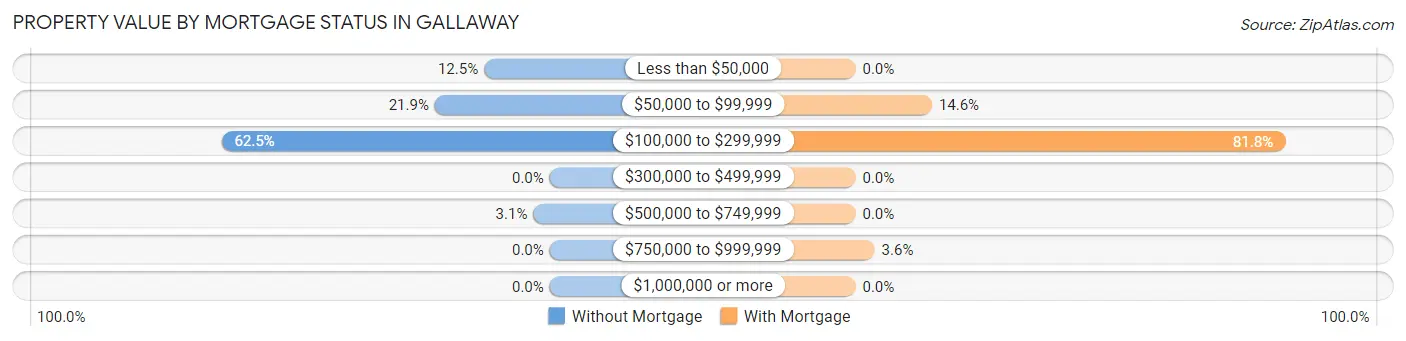
| Property Value | Without Mortgage | With Mortgage |
| Less than $50,000 | 4 (12.5%) | 0 (0.0%) |
| $50,000 to $99,999 | 7 (21.9%) | 8 (14.5%) |
| $100,000 to $299,999 | 20 (62.5%) | 45 (81.8%) |
| $300,000 to $499,999 | 0 (0.0%) | 0 (0.0%) |
| $500,000 to $749,999 | 1 (3.1%) | 0 (0.0%) |
| $750,000 to $999,999 | 0 (0.0%) | 2 (3.6%) |
| $1,000,000 or more | 0 (0.0%) | 0 (0.0%) |
| Total | 32 (100.0%) | 55 (100.0%) |
Household Income by Mortgage Status in Gallaway
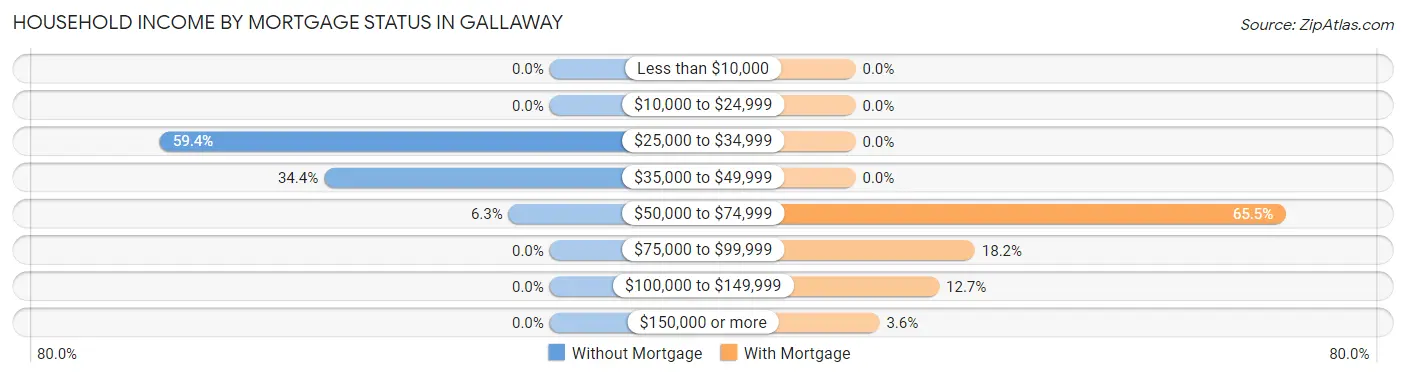
| Household Income | Without Mortgage | With Mortgage |
| Less than $10,000 | 0 (0.0%) | 0 (0.0%) |
| $10,000 to $24,999 | 0 (0.0%) | 0 (0.0%) |
| $25,000 to $34,999 | 19 (59.4%) | 0 (0.0%) |
| $35,000 to $49,999 | 11 (34.4%) | 0 (0.0%) |
| $50,000 to $74,999 | 2 (6.2%) | 36 (65.4%) |
| $75,000 to $99,999 | 0 (0.0%) | 10 (18.2%) |
| $100,000 to $149,999 | 0 (0.0%) | 7 (12.7%) |
| $150,000 or more | 0 (0.0%) | 2 (3.6%) |
| Total | 32 (100.0%) | 55 (100.0%) |
Property Value to Household Income Ratio in Gallaway
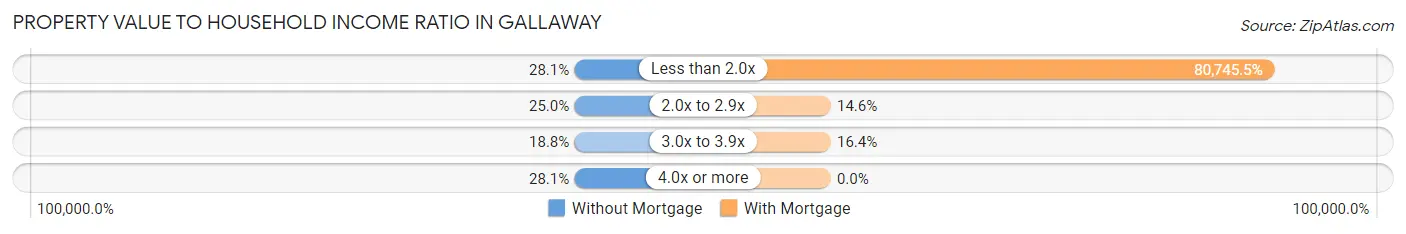
| Value-to-Income Ratio | Without Mortgage | With Mortgage |
| Less than 2.0x | 9 (28.1%) | 44,410 (80,745.5%) |
| 2.0x to 2.9x | 8 (25.0%) | 8 (14.5%) |
| 3.0x to 3.9x | 6 (18.8%) | 9 (16.4%) |
| 4.0x or more | 9 (28.1%) | 0 (0.0%) |
| Total | 32 (100.0%) | 55 (100.0%) |
Real Estate Taxes by Mortgage Status in Gallaway
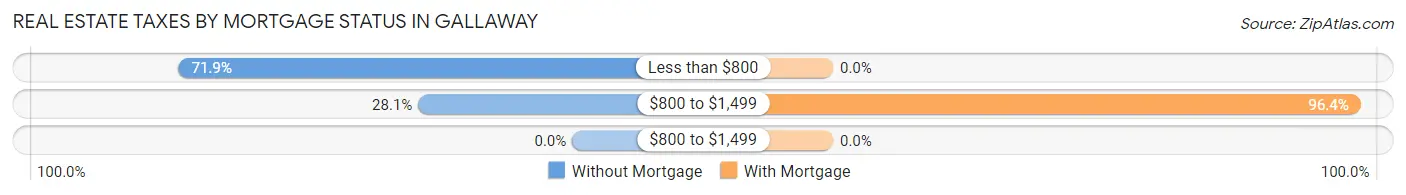
| Property Taxes | Without Mortgage | With Mortgage |
| Less than $800 | 23 (71.9%) | 0 (0.0%) |
| $800 to $1,499 | 9 (28.1%) | 53 (96.4%) |
| $800 to $1,499 | 0 (0.0%) | 0 (0.0%) |
| Total | 32 (100.0%) | 55 (100.0%) |
Health & Disability in Gallaway
Health Insurance Coverage by Age in Gallaway
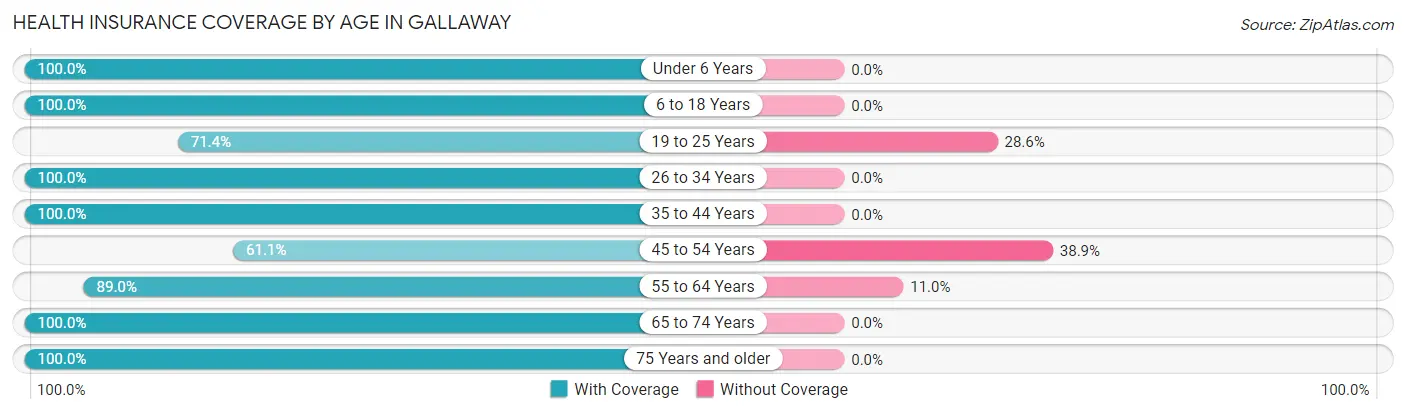
| Age Bracket | With Coverage | Without Coverage |
| Under 6 Years | 23 (100.0%) | 0 (0.0%) |
| 6 to 18 Years | 110 (100.0%) | 0 (0.0%) |
| 19 to 25 Years | 35 (71.4%) | 14 (28.6%) |
| 26 to 34 Years | 90 (100.0%) | 0 (0.0%) |
| 35 to 44 Years | 42 (100.0%) | 0 (0.0%) |
| 45 to 54 Years | 22 (61.1%) | 14 (38.9%) |
| 55 to 64 Years | 97 (89.0%) | 12 (11.0%) |
| 65 to 74 Years | 73 (100.0%) | 0 (0.0%) |
| 75 Years and older | 14 (100.0%) | 0 (0.0%) |
| Total | 506 (92.7%) | 40 (7.3%) |
Health Insurance Coverage by Citizenship Status in Gallaway
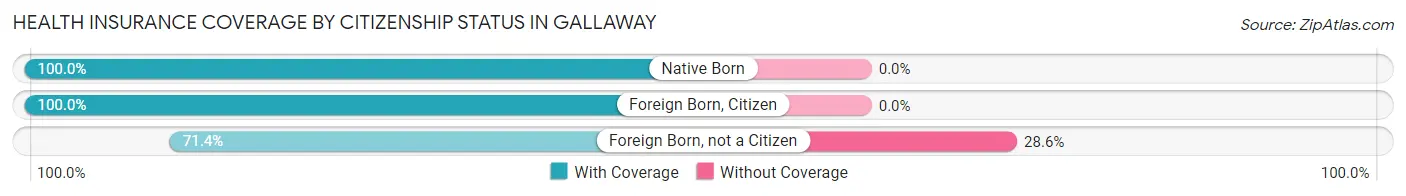
| Citizenship Status | With Coverage | Without Coverage |
| Native Born | 23 (100.0%) | 0 (0.0%) |
| Foreign Born, Citizen | 110 (100.0%) | 0 (0.0%) |
| Foreign Born, not a Citizen | 35 (71.4%) | 14 (28.6%) |
Health Insurance Coverage by Household Income in Gallaway
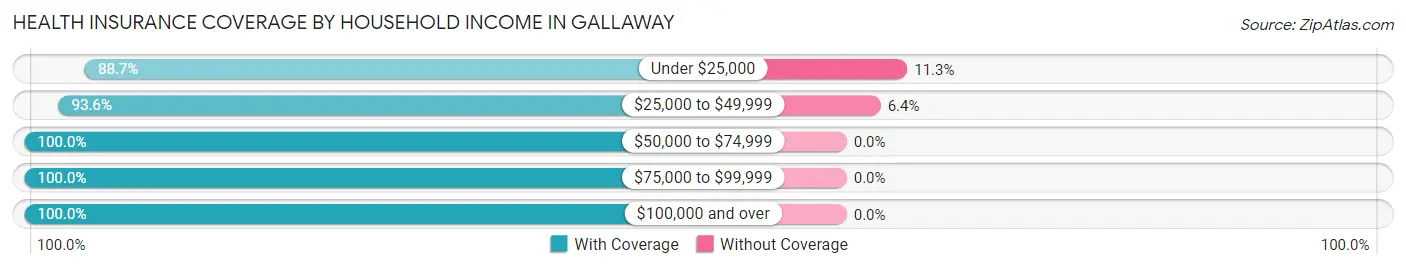
| Household Income | With Coverage | Without Coverage |
| Under $25,000 | 172 (88.7%) | 22 (11.3%) |
| $25,000 to $49,999 | 265 (93.6%) | 18 (6.4%) |
| $50,000 to $74,999 | 25 (100.0%) | 0 (0.0%) |
| $75,000 to $99,999 | 40 (100.0%) | 0 (0.0%) |
| $100,000 and over | 4 (100.0%) | 0 (0.0%) |
Public vs Private Health Insurance Coverage by Age in Gallaway
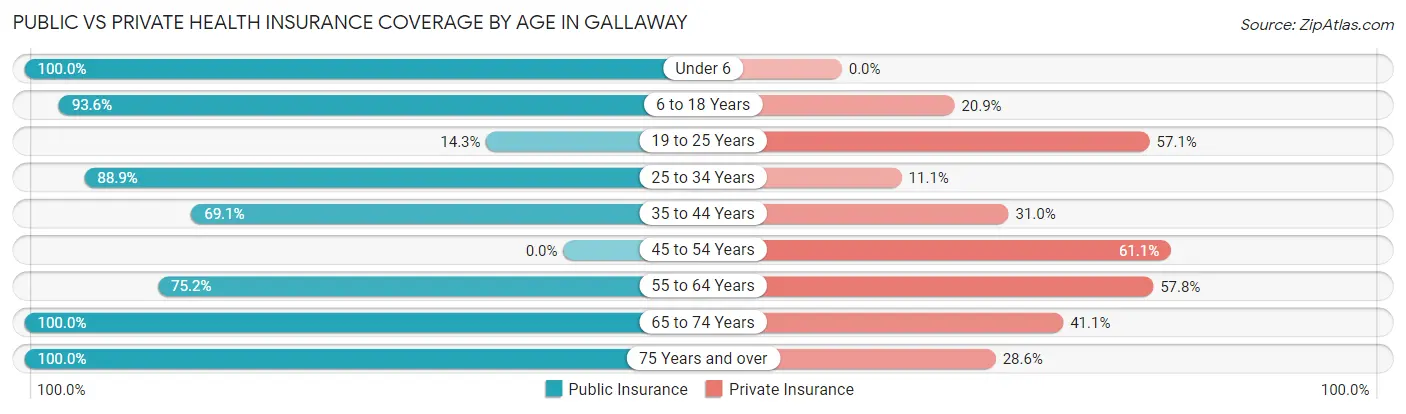
| Age Bracket | Public Insurance | Private Insurance |
| Under 6 | 23 (100.0%) | 0 (0.0%) |
| 6 to 18 Years | 103 (93.6%) | 23 (20.9%) |
| 19 to 25 Years | 7 (14.3%) | 28 (57.1%) |
| 25 to 34 Years | 80 (88.9%) | 10 (11.1%) |
| 35 to 44 Years | 29 (69.1%) | 13 (30.9%) |
| 45 to 54 Years | 0 (0.0%) | 22 (61.1%) |
| 55 to 64 Years | 82 (75.2%) | 63 (57.8%) |
| 65 to 74 Years | 73 (100.0%) | 30 (41.1%) |
| 75 Years and over | 14 (100.0%) | 4 (28.6%) |
| Total | 411 (75.3%) | 193 (35.3%) |
Disability Status by Sex by Age in Gallaway
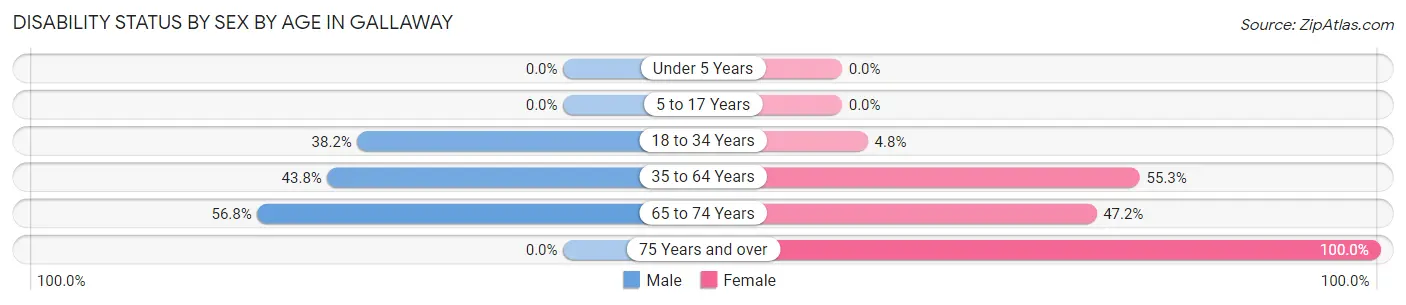
| Age Bracket | Male | Female |
| Under 5 Years | 0 (0.0%) | 0 (0.0%) |
| 5 to 17 Years | 0 (0.0%) | 0 (0.0%) |
| 18 to 34 Years | 21 (38.2%) | 6 (4.8%) |
| 35 to 64 Years | 28 (43.8%) | 68 (55.3%) |
| 65 to 74 Years | 21 (56.8%) | 17 (47.2%) |
| 75 Years and over | 0 (0.0%) | 10 (100.0%) |
Disability Class by Sex by Age in Gallaway
Disability Class: Hearing Difficulty
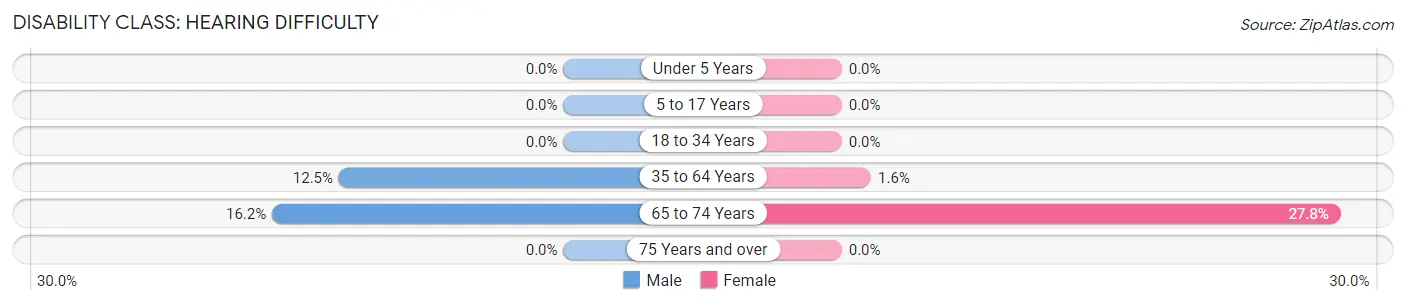
| Age Bracket | Male | Female |
| Under 5 Years | 0 (0.0%) | 0 (0.0%) |
| 5 to 17 Years | 0 (0.0%) | 0 (0.0%) |
| 18 to 34 Years | 0 (0.0%) | 0 (0.0%) |
| 35 to 64 Years | 8 (12.5%) | 2 (1.6%) |
| 65 to 74 Years | 6 (16.2%) | 10 (27.8%) |
| 75 Years and over | 0 (0.0%) | 0 (0.0%) |
Disability Class: Vision Difficulty
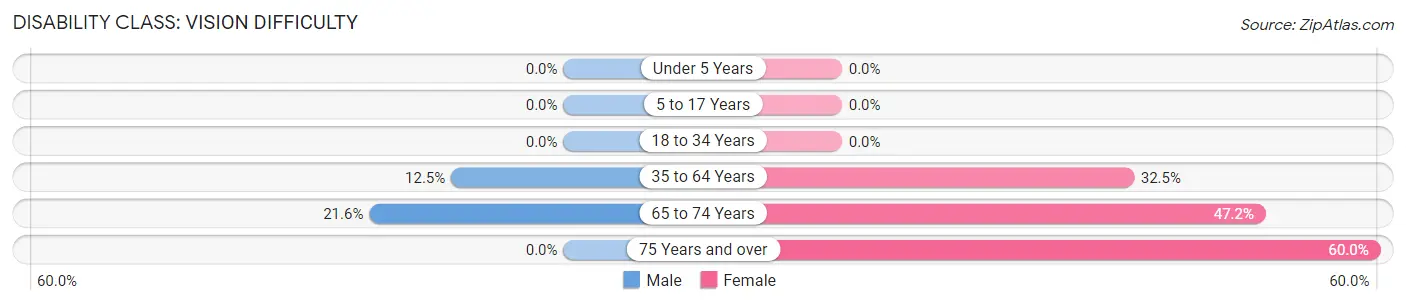
| Age Bracket | Male | Female |
| Under 5 Years | 0 (0.0%) | 0 (0.0%) |
| 5 to 17 Years | 0 (0.0%) | 0 (0.0%) |
| 18 to 34 Years | 0 (0.0%) | 0 (0.0%) |
| 35 to 64 Years | 8 (12.5%) | 40 (32.5%) |
| 65 to 74 Years | 8 (21.6%) | 17 (47.2%) |
| 75 Years and over | 0 (0.0%) | 6 (60.0%) |
Disability Class: Cognitive Difficulty
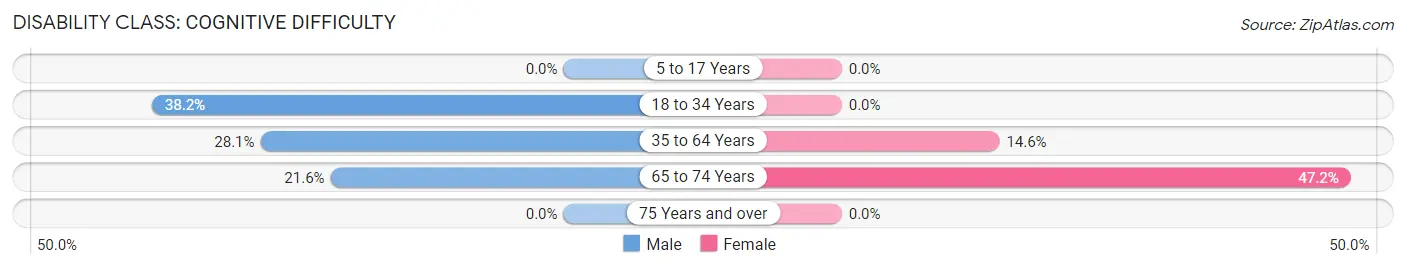
| Age Bracket | Male | Female |
| 5 to 17 Years | 0 (0.0%) | 0 (0.0%) |
| 18 to 34 Years | 21 (38.2%) | 0 (0.0%) |
| 35 to 64 Years | 18 (28.1%) | 18 (14.6%) |
| 65 to 74 Years | 8 (21.6%) | 17 (47.2%) |
| 75 Years and over | 0 (0.0%) | 0 (0.0%) |
Disability Class: Ambulatory Difficulty
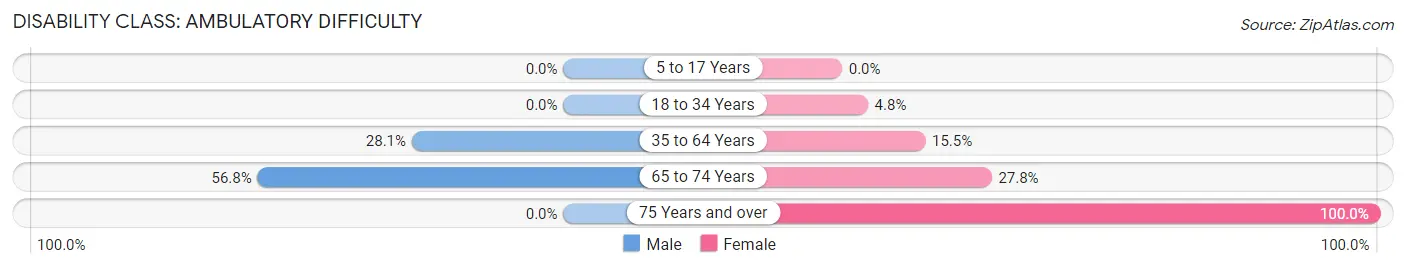
| Age Bracket | Male | Female |
| 5 to 17 Years | 0 (0.0%) | 0 (0.0%) |
| 18 to 34 Years | 0 (0.0%) | 6 (4.8%) |
| 35 to 64 Years | 18 (28.1%) | 19 (15.4%) |
| 65 to 74 Years | 21 (56.8%) | 10 (27.8%) |
| 75 Years and over | 0 (0.0%) | 10 (100.0%) |
Disability Class: Self-Care Difficulty
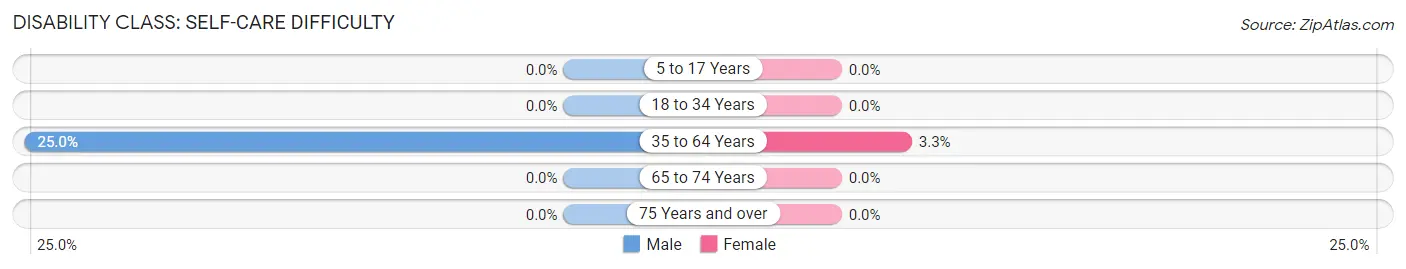
| Age Bracket | Male | Female |
| 5 to 17 Years | 0 (0.0%) | 0 (0.0%) |
| 18 to 34 Years | 0 (0.0%) | 0 (0.0%) |
| 35 to 64 Years | 16 (25.0%) | 4 (3.3%) |
| 65 to 74 Years | 0 (0.0%) | 0 (0.0%) |
| 75 Years and over | 0 (0.0%) | 0 (0.0%) |
Technology Access in Gallaway
Computing Device Access in Gallaway
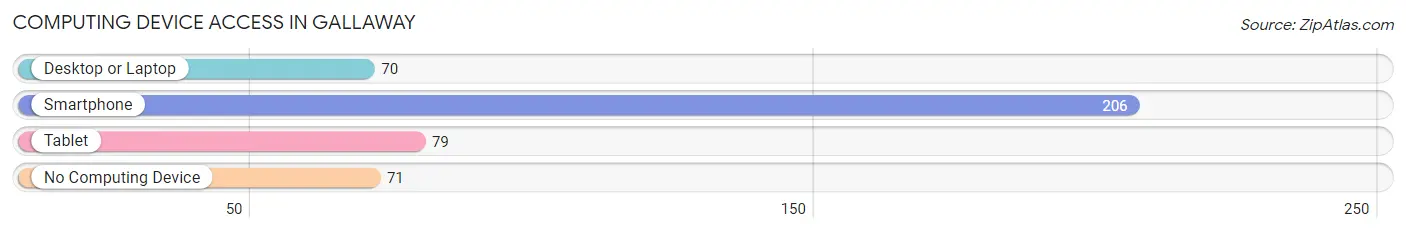
| Device Type | # Households | % Households |
| Desktop or Laptop | 70 | 24.5% |
| Smartphone | 206 | 72.0% |
| Tablet | 79 | 27.6% |
| No Computing Device | 71 | 24.8% |
| Total | 286 | 100.0% |
Internet Access in Gallaway
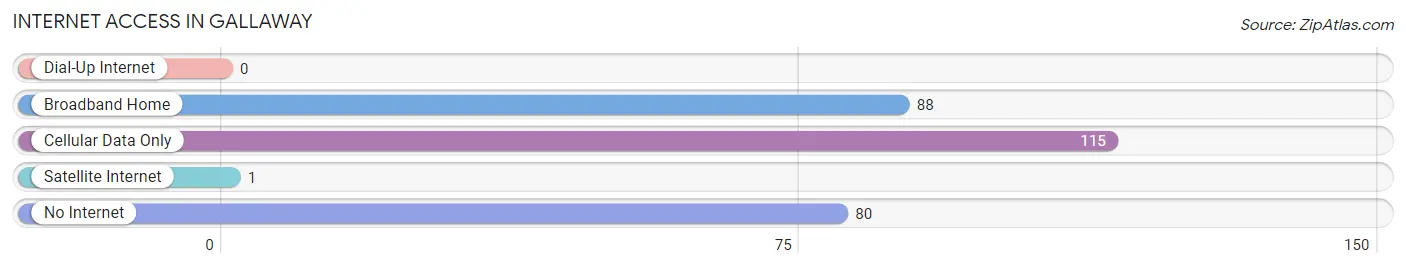
| Internet Type | # Households | % Households |
| Dial-Up Internet | 0 | 0.0% |
| Broadband Home | 88 | 30.8% |
| Cellular Data Only | 115 | 40.2% |
| Satellite Internet | 1 | 0.4% |
| No Internet | 80 | 28.0% |
| Total | 286 | 100.0% |
Gallaway Summary
Gallaway, Tennessee is a small town located in the southwestern corner of Fayette County, Tennessee. It is situated on the banks of the Wolf River, approximately 25 miles east of Memphis. The town was founded in 1837 and has a population of approximately 1,000 people.
History
Gallaway was founded in 1837 by a group of settlers from North Carolina. The town was named after a local creek, which was named after a local Native American chief. The town was originally a farming community, but it soon became a trading center for the surrounding area. The town was also home to a number of businesses, including a sawmill, a gristmill, a blacksmith shop, and a general store.
In the late 19th century, the town began to grow and prosper. The railroad came to Gallaway in 1887, and the town soon became a hub for the surrounding area. The town also became a popular destination for tourists, who came to enjoy the natural beauty of the area.
Geography
Gallaway is located in the southwestern corner of Fayette County, Tennessee. It is situated on the banks of the Wolf River, approximately 25 miles east of Memphis. The town is surrounded by rolling hills and farmland, and is located in a rural area. The town is also located near the Wolf River Wildlife Management Area, which is a popular destination for hunters and fishermen.
Economy
The economy of Gallaway is largely based on agriculture. The town is home to a number of farms, which produce a variety of crops, including corn, soybeans, and cotton. The town is also home to a number of small businesses, including a grocery store, a hardware store, and a few restaurants.
Demographics
As of the 2010 census, the population of Gallaway was 1,000 people. The town is predominantly white, with a small African American population. The median household income in Gallaway is $37,000, and the median home value is $90,000. The town has a low unemployment rate, and the majority of the population is employed in the agricultural sector.
Conclusion
Gallaway, Tennessee is a small town located in the southwestern corner of Fayette County, Tennessee. It was founded in 1837 and has a population of approximately 1,000 people. The town is largely based on agriculture, and is home to a number of small businesses. The town is predominantly white, with a small African American population. The median household income in Gallaway is $37,000, and the median home value is $90,000. The town has a low unemployment rate, and the majority of the population is employed in the agricultural sector.
Common Questions
What is Per Capita Income in Gallaway?
Per Capita income in Gallaway is $16,702.
What is the Median Family Income in Gallaway?
Median Family Income in Gallaway is $34,250.
What is the Median Household income in Gallaway?
Median Household Income in Gallaway is $31,176.
What is Income or Wage Gap in Gallaway?
Income or Wage Gap in Gallaway is 12.1%.
Women in Gallaway earn 87.9 cents for every dollar earned by a man.
What is Family Income Deficit in Gallaway?
Family Income Deficit in Gallaway is $13,756.
Families that are below poverty line in Gallaway earn $13,756 less on average than the poverty threshold level.
What is Inequality or Gini Index in Gallaway?
Inequality or Gini Index in Gallaway is 0.40.
What is the Total Population of Gallaway?
Total Population of Gallaway is 664.
What is the Total Male Population of Gallaway?
Total Male Population of Gallaway is 211.
What is the Total Female Population of Gallaway?
Total Female Population of Gallaway is 453.
What is the Ratio of Males per 100 Females in Gallaway?
There are 46.58 Males per 100 Females in Gallaway.
What is the Ratio of Females per 100 Males in Gallaway?
There are 214.69 Females per 100 Males in Gallaway.
What is the Median Population Age in Gallaway?
Median Population Age in Gallaway is 48.3 Years.
What is the Average Family Size in Gallaway
Average Family Size in Gallaway is 2.6 People.
What is the Average Household Size in Gallaway
Average Household Size in Gallaway is 1.9 People.
How Large is the Labor Force in Gallaway?
There are 216 People in the Labor Forcein in Gallaway.
What is the Percentage of People in the Labor Force in Gallaway?
36.3% of People are in the Labor Force in Gallaway.
What is the Unemployment Rate in Gallaway?
Unemployment Rate in Gallaway is 24.1%.