Henning, TN Map & Demographics
Henning Map
Henning Overview
$18,446
PER CAPITA INCOME
$38,650
AVG FAMILY INCOME
$41,514
AVG HOUSEHOLD INCOME
12.5%
WAGE / INCOME GAP [ % ]
87.5¢/ $1
WAGE / INCOME GAP [ $ ]
$13,669
FAMILY INCOME DEFICIT
0.41
INEQUALITY / GINI INDEX
1,320
TOTAL POPULATION
596
MALE POPULATION
724
FEMALE POPULATION
82.32
MALES / 100 FEMALES
121.48
FEMALES / 100 MALES
36.6
MEDIAN AGE
3.4
AVG FAMILY SIZE
2.5
AVG HOUSEHOLD SIZE
556
LABOR FORCE [ PEOPLE ]
56.4%
PERCENT IN LABOR FORCE
22.3%
UNEMPLOYMENT RATE
Henning Zip Codes
Henning Area Codes
Income in Henning
Income Overview in Henning
Per Capita Income in Henning is $18,446, while median incomes of families and households are $38,650 and $41,514 respectively.
| Characteristic | Number | Measure |
| Per Capita Income | 1,320 | $18,446 |
| Median Family Income | 261 | $38,650 |
| Mean Family Income | 261 | $40,223 |
| Median Household Income | 533 | $41,514 |
| Mean Household Income | 533 | $42,647 |
| Income Deficit | 261 | $13,669 |
| Wage / Income Gap (%) | 1,320 | 12.54% |
| Wage / Income Gap ($) | 1,320 | 87.46¢ per $1 |
| Gini / Inequality Index | 1,320 | 0.41 |
Earnings by Sex in Henning
Average Earnings in Henning are $34,500, $35,526 for men and $31,071 for women, a difference of 12.5%.
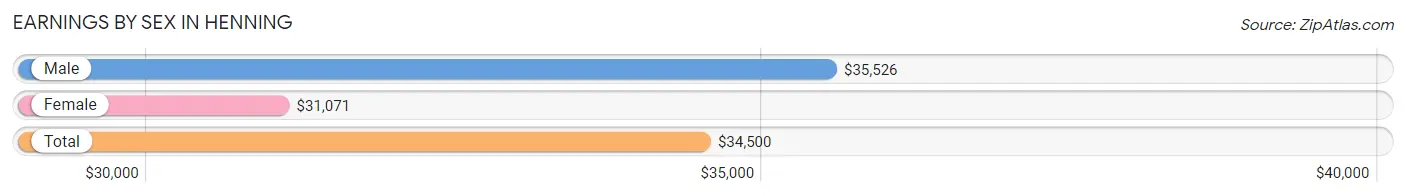
| Sex | Number | Average Earnings |
| Male | 304 (53.5%) | $35,526 |
| Female | 264 (46.5%) | $31,071 |
| Total | 568 (100.0%) | $34,500 |
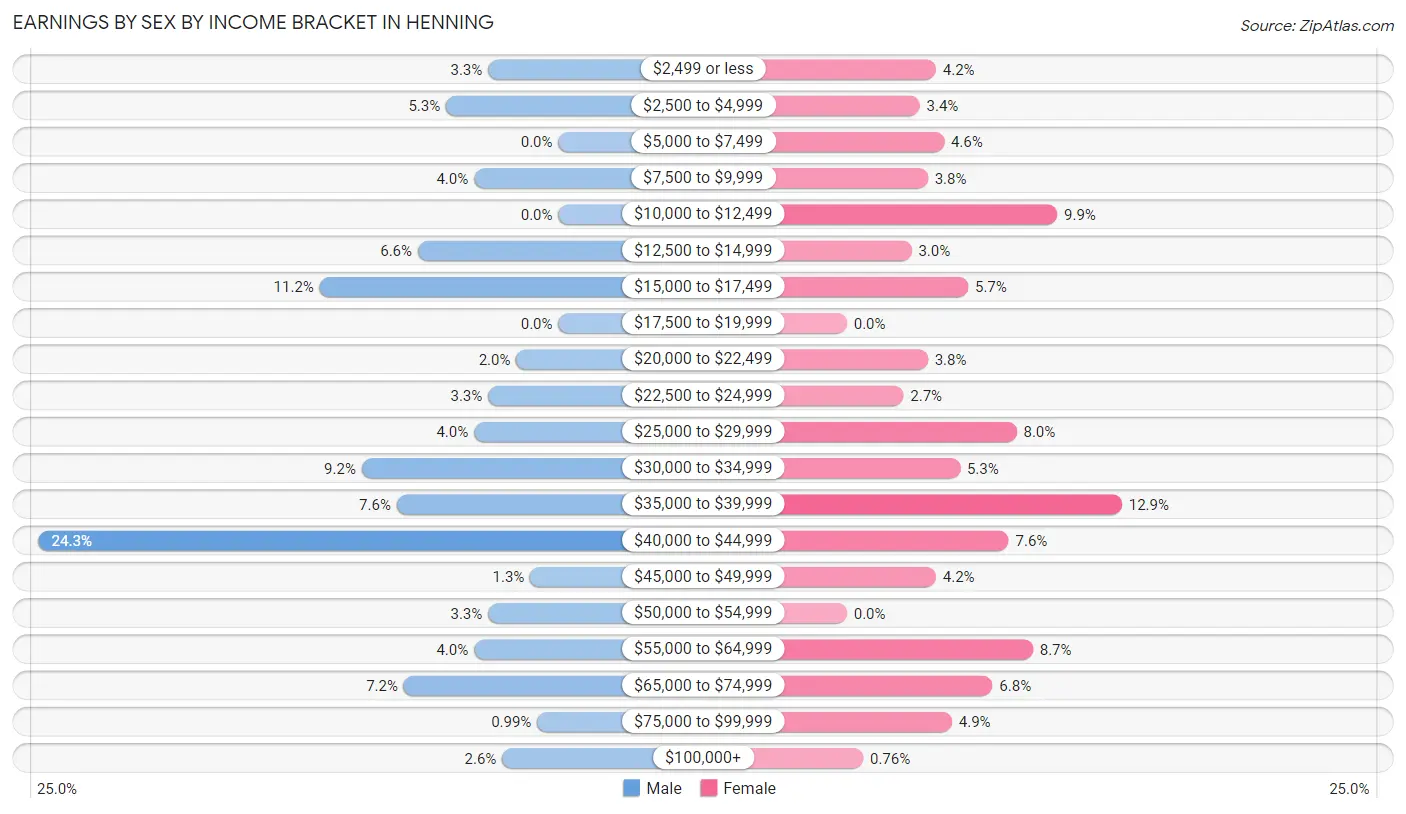
Earnings by Sex by Income Bracket in Henning
The most common earnings brackets in Henning are $40,000 to $44,999 for men (74 | 24.3%) and $35,000 to $39,999 for women (34 | 12.9%).
| Income | Male | Female |
| $2,499 or less | 10 (3.3%) | 11 (4.2%) |
| $2,500 to $4,999 | 16 (5.3%) | 9 (3.4%) |
| $5,000 to $7,499 | 0 (0.0%) | 12 (4.5%) |
| $7,500 to $9,999 | 12 (4.0%) | 10 (3.8%) |
| $10,000 to $12,499 | 0 (0.0%) | 26 (9.9%) |
| $12,500 to $14,999 | 20 (6.6%) | 8 (3.0%) |
| $15,000 to $17,499 | 34 (11.2%) | 15 (5.7%) |
| $17,500 to $19,999 | 0 (0.0%) | 0 (0.0%) |
| $20,000 to $22,499 | 6 (2.0%) | 10 (3.8%) |
| $22,500 to $24,999 | 10 (3.3%) | 7 (2.6%) |
| $25,000 to $29,999 | 12 (4.0%) | 21 (8.0%) |
| $30,000 to $34,999 | 28 (9.2%) | 14 (5.3%) |
| $35,000 to $39,999 | 23 (7.6%) | 34 (12.9%) |
| $40,000 to $44,999 | 74 (24.3%) | 20 (7.6%) |
| $45,000 to $49,999 | 4 (1.3%) | 11 (4.2%) |
| $50,000 to $54,999 | 10 (3.3%) | 0 (0.0%) |
| $55,000 to $64,999 | 12 (4.0%) | 23 (8.7%) |
| $65,000 to $74,999 | 22 (7.2%) | 18 (6.8%) |
| $75,000 to $99,999 | 3 (1.0%) | 13 (4.9%) |
| $100,000+ | 8 (2.6%) | 2 (0.8%) |
| Total | 304 (100.0%) | 264 (100.0%) |
Earnings by Sex by Educational Attainment in Henning
Average earnings in Henning are $37,368 for men and $35,000 for women, a difference of 6.3%. Men with an educational attainment of college or associate's degree enjoy the highest average annual earnings of $40,395, while those with high school diploma education earn the least with $37,431. Women with an educational attainment of college or associate's degree earn the most with the average annual earnings of $36,667, while those with college or associate's degree education have the smallest earnings of $36,667.
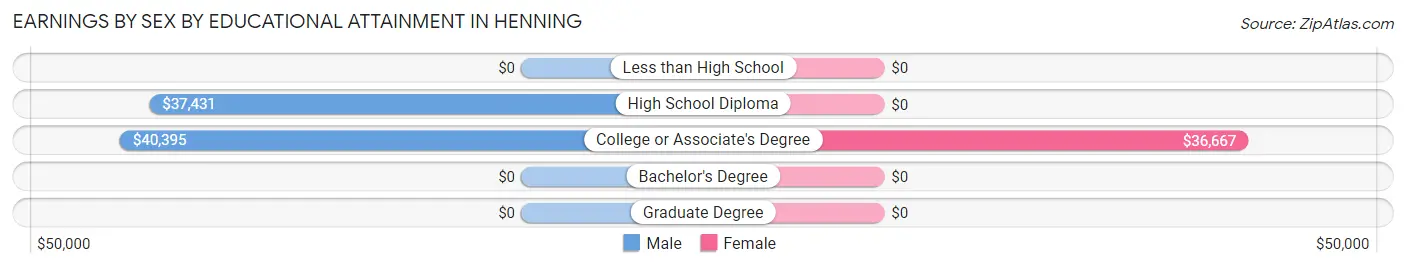
| Educational Attainment | Male Income | Female Income |
| Less than High School | - | - |
| High School Diploma | $37,431 | $0 |
| College or Associate's Degree | $40,395 | $36,667 |
| Bachelor's Degree | - | - |
| Graduate Degree | - | - |
| Total | $37,368 | $35,000 |
Family Income in Henning
Family Income Brackets in Henning
According to the Henning family income data, there are 75 families falling into the $35,000 to $49,999 income range, which is the most common income bracket and makes up 28.7% of all families.
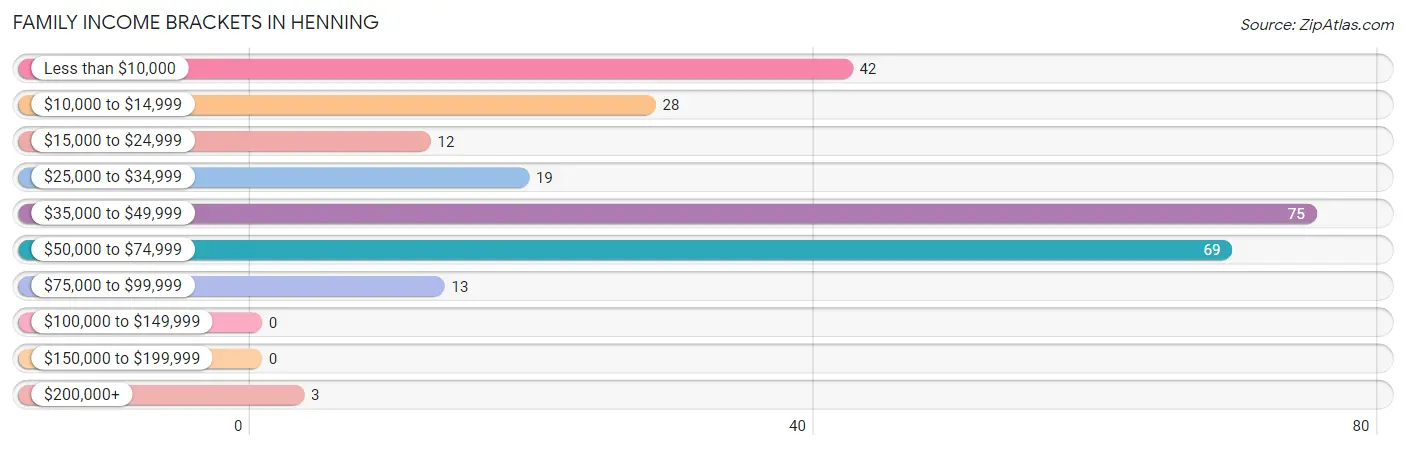
| Income Bracket | # Families | % Families |
| Less than $10,000 | 42 | 16.1% |
| $10,000 to $14,999 | 28 | 10.7% |
| $15,000 to $24,999 | 12 | 4.6% |
| $25,000 to $34,999 | 19 | 7.3% |
| $35,000 to $49,999 | 75 | 28.7% |
| $50,000 to $74,999 | 69 | 26.4% |
| $75,000 to $99,999 | 13 | 5.0% |
| $100,000 to $149,999 | 0 | 0.0% |
| $150,000 to $199,999 | 0 | 0.0% |
| $200,000+ | 3 | 1.1% |
Family Income by Famaliy Size in Henning
4-person families (69 | 26.4%) account for the highest median family income in Henning with $41,607 per family, while 2-person families (121 | 46.4%) have the highest median income of $19,925 per family member.
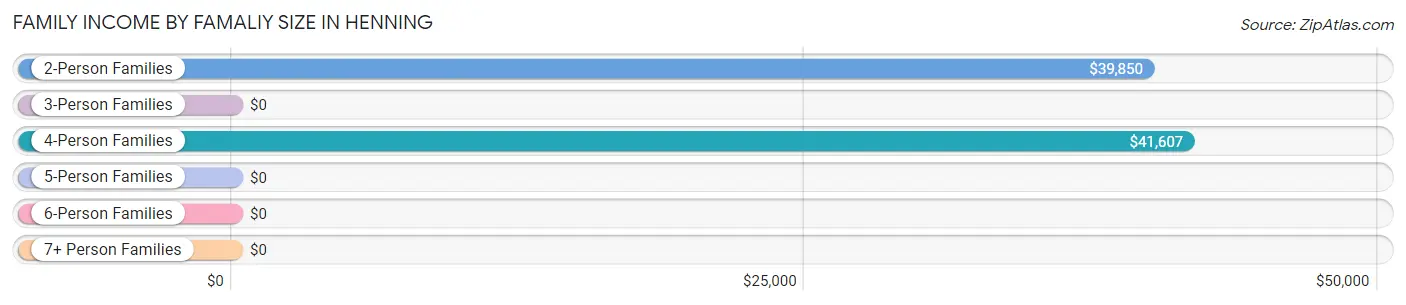
| Income Bracket | # Families | Median Income |
| 2-Person Families | 121 (46.4%) | $39,850 |
| 3-Person Families | 47 (18.0%) | $0 |
| 4-Person Families | 69 (26.4%) | $41,607 |
| 5-Person Families | 14 (5.4%) | $0 |
| 6-Person Families | 10 (3.8%) | $0 |
| 7+ Person Families | 0 (0.0%) | $0 |
| Total | 261 (100.0%) | $38,650 |
Family Income by Number of Earners in Henning
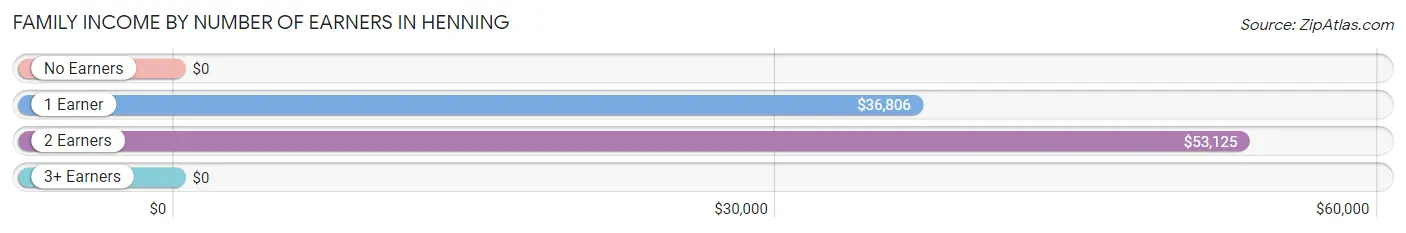
| Number of Earners | # Families | Median Income |
| No Earners | 76 (29.1%) | $0 |
| 1 Earner | 82 (31.4%) | $36,806 |
| 2 Earners | 97 (37.2%) | $53,125 |
| 3+ Earners | 6 (2.3%) | $0 |
| Total | 261 (100.0%) | $38,650 |
Household Income in Henning
Household Income Brackets in Henning
With 171 households falling in the category, the $50,000 to $74,999 income range is the most frequent in Henning, accounting for 32.1% of all households.
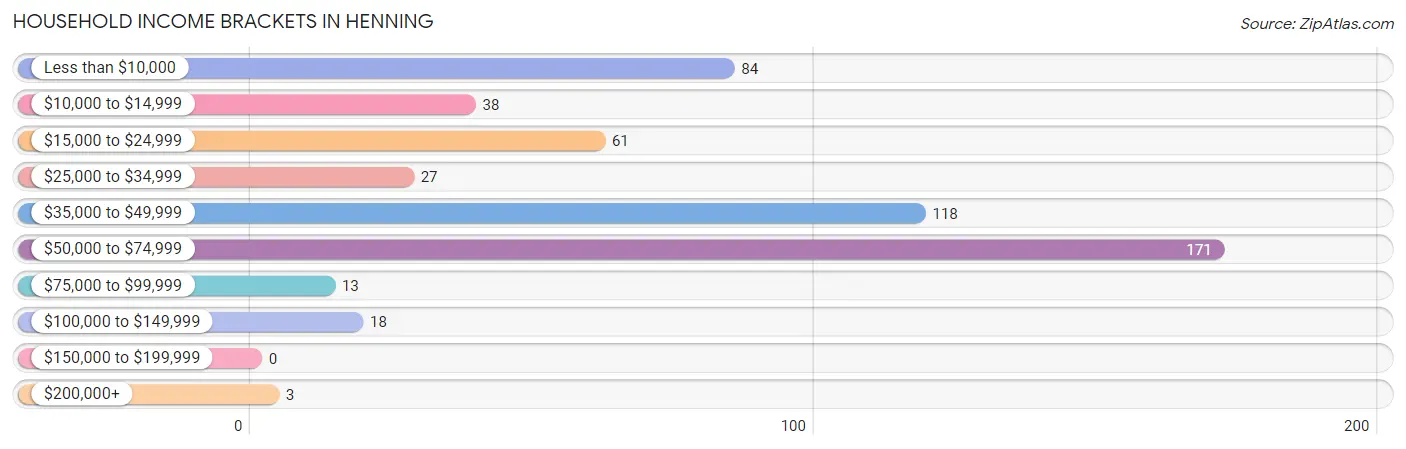
| Income Bracket | # Households | % Households |
| Less than $10,000 | 84 | 15.8% |
| $10,000 to $14,999 | 38 | 7.1% |
| $15,000 to $24,999 | 61 | 11.4% |
| $25,000 to $34,999 | 27 | 5.1% |
| $35,000 to $49,999 | 118 | 22.1% |
| $50,000 to $74,999 | 171 | 32.1% |
| $75,000 to $99,999 | 13 | 2.4% |
| $100,000 to $149,999 | 18 | 3.4% |
| $150,000 to $199,999 | 0 | 0.0% |
| $200,000+ | 3 | 0.6% |
Household Income by Householder Age in Henning
The median household income in Henning is $41,514, with the highest median household income of $44,231 found in the 45 to 64 years age bracket for the primary householder. A total of 204 households (38.3%) fall into this category. Meanwhile, the 15 to 24 years age bracket for the primary householder has the lowest median household income of $2,499, with 25 households (4.7%) in this group.
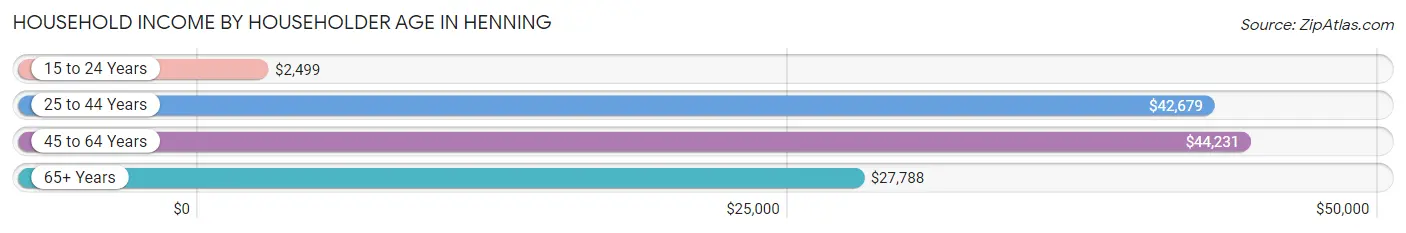
| Income Bracket | # Households | Median Income |
| 15 to 24 Years | 25 (4.7%) | $2,499 |
| 25 to 44 Years | 199 (37.3%) | $42,679 |
| 45 to 64 Years | 204 (38.3%) | $44,231 |
| 65+ Years | 105 (19.7%) | $27,788 |
| Total | 533 (100.0%) | $41,514 |
Poverty in Henning
Income Below Poverty by Sex and Age in Henning
With 22.9% poverty level for males and 40.7% for females among the residents of Henning, 16 and 17 year old males and 6 to 11 year old females are the most vulnerable to poverty, with 11 males (84.6%) and 85 females (83.3%) in their respective age groups living below the poverty level.
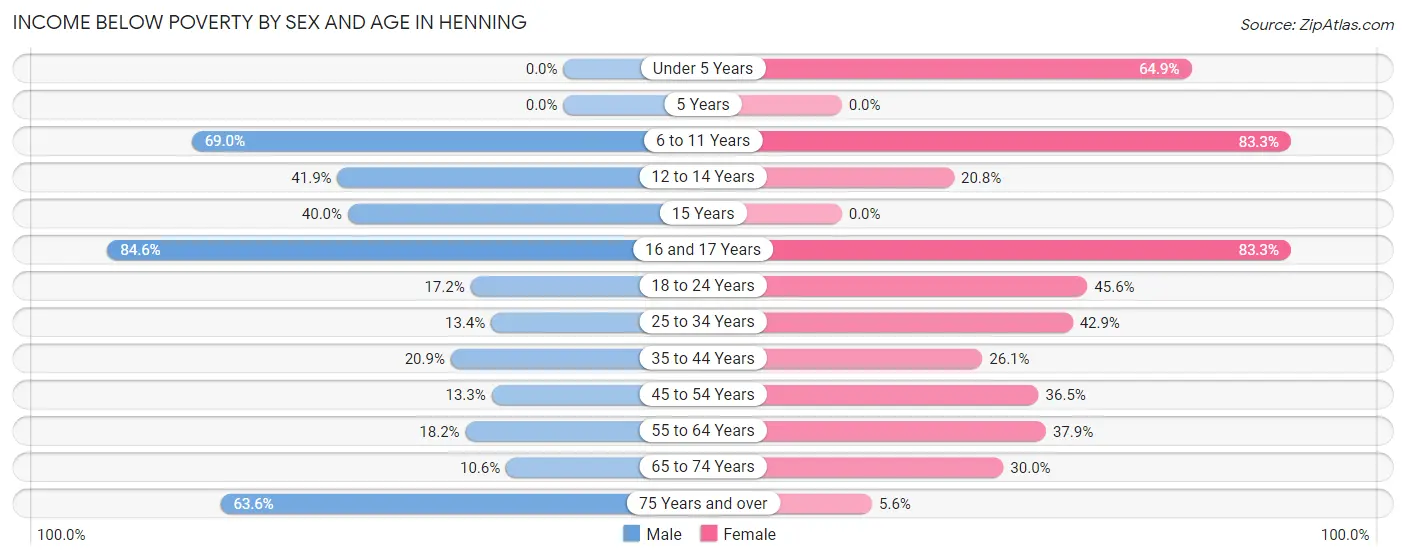
| Age Bracket | Male | Female |
| Under 5 Years | 0 (0.0%) | 24 (64.9%) |
| 5 Years | 0 (0.0%) | 0 (0.0%) |
| 6 to 11 Years | 20 (69.0%) | 85 (83.3%) |
| 12 to 14 Years | 13 (41.9%) | 5 (20.8%) |
| 15 Years | 8 (40.0%) | 0 (0.0%) |
| 16 and 17 Years | 11 (84.6%) | 5 (83.3%) |
| 18 to 24 Years | 5 (17.2%) | 31 (45.6%) |
| 25 to 34 Years | 11 (13.4%) | 33 (42.9%) |
| 35 to 44 Years | 28 (20.9%) | 24 (26.1%) |
| 45 to 54 Years | 10 (13.3%) | 19 (36.5%) |
| 55 to 64 Years | 8 (18.2%) | 47 (37.9%) |
| 65 to 74 Years | 5 (10.6%) | 15 (30.0%) |
| 75 Years and over | 14 (63.6%) | 4 (5.6%) |
| Total | 133 (22.9%) | 292 (40.7%) |
Income Above Poverty by Sex and Age in Henning
According to the poverty statistics in Henning, males aged under 5 years and females aged 15 years are the age groups that are most secure financially, with 100.0% of males and 100.0% of females in these age groups living above the poverty line.
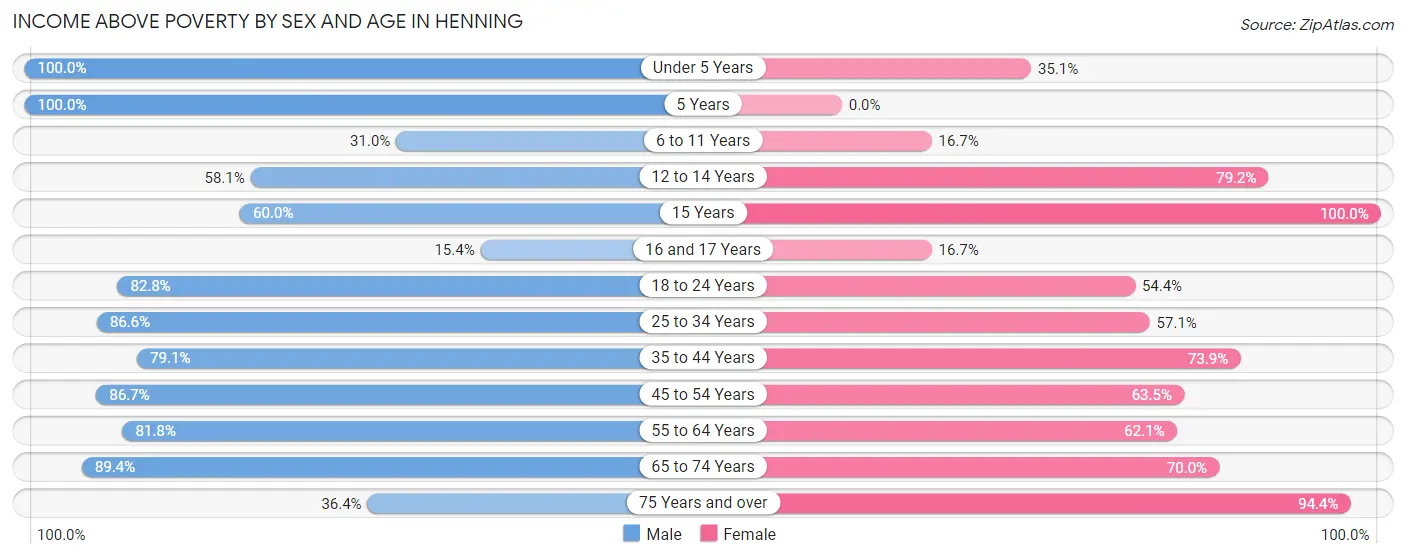
| Age Bracket | Male | Female |
| Under 5 Years | 28 (100.0%) | 13 (35.1%) |
| 5 Years | 28 (100.0%) | 0 (0.0%) |
| 6 to 11 Years | 9 (31.0%) | 17 (16.7%) |
| 12 to 14 Years | 18 (58.1%) | 19 (79.2%) |
| 15 Years | 12 (60.0%) | 14 (100.0%) |
| 16 and 17 Years | 2 (15.4%) | 1 (16.7%) |
| 18 to 24 Years | 24 (82.8%) | 37 (54.4%) |
| 25 to 34 Years | 71 (86.6%) | 44 (57.1%) |
| 35 to 44 Years | 106 (79.1%) | 68 (73.9%) |
| 45 to 54 Years | 65 (86.7%) | 33 (63.5%) |
| 55 to 64 Years | 36 (81.8%) | 77 (62.1%) |
| 65 to 74 Years | 42 (89.4%) | 35 (70.0%) |
| 75 Years and over | 8 (36.4%) | 67 (94.4%) |
| Total | 449 (77.1%) | 425 (59.3%) |
Income Below Poverty Among Married-Couple Families in Henning
The poverty statistics for married-couple families in Henning show that 20.7% or 17 of the total 82 families live below the poverty line. Families with 1 or 2 children have the highest poverty rate of 20.8%, comprising of 5 families. On the other hand, families with no children have the lowest poverty rate of 20.7%, which includes 12 families.
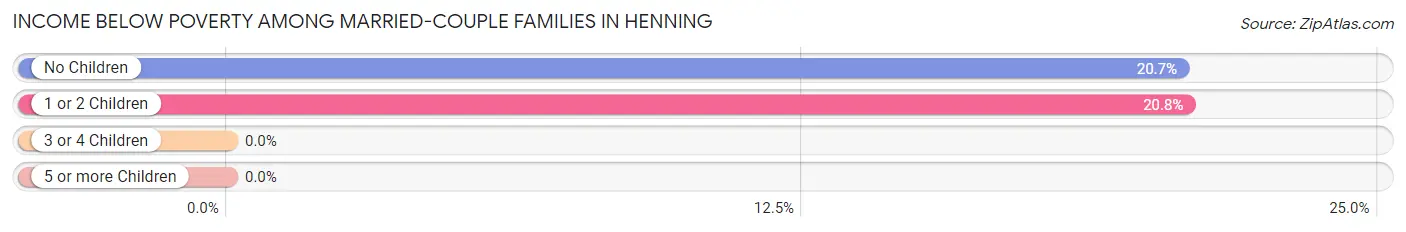
| Children | Above Poverty | Below Poverty |
| No Children | 46 (79.3%) | 12 (20.7%) |
| 1 or 2 Children | 19 (79.2%) | 5 (20.8%) |
| 3 or 4 Children | 0 (0.0%) | 0 (0.0%) |
| 5 or more Children | 0 (0.0%) | 0 (0.0%) |
| Total | 65 (79.3%) | 17 (20.7%) |
Income Below Poverty Among Single-Parent Households in Henning
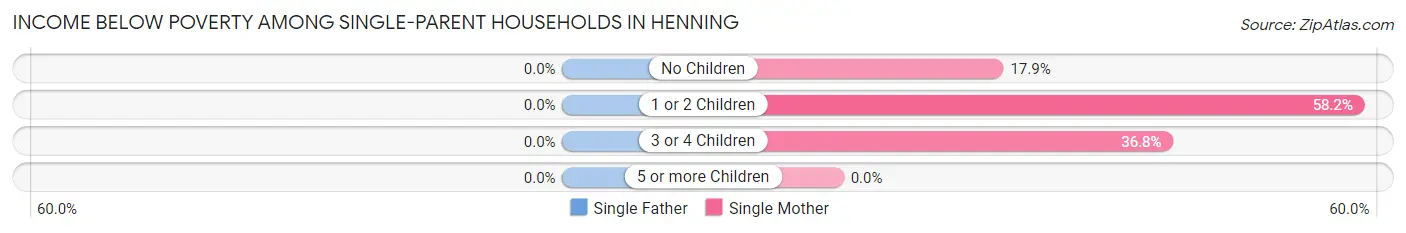
| Children | Single Father | Single Mother |
| No Children | 0 (0.0%) | 10 (17.9%) |
| 1 or 2 Children | 0 (0.0%) | 46 (58.2%) |
| 3 or 4 Children | 0 (0.0%) | 14 (36.8%) |
| 5 or more Children | 0 (0.0%) | 0 (0.0%) |
| Total | 0 (0.0%) | 70 (40.5%) |
Income Below Poverty Among Married-Couple vs Single-Parent Households in Henning
The poverty data for Henning shows that 17 of the married-couple family households (20.7%) and 70 of the single-parent households (39.1%) are living below the poverty level. Within the married-couple family households, those with 1 or 2 children have the highest poverty rate, with 5 households (20.8%) falling below the poverty line. Among the single-parent households, those with 1 or 2 children have the highest poverty rate, with 46 household (58.2%) living below poverty.
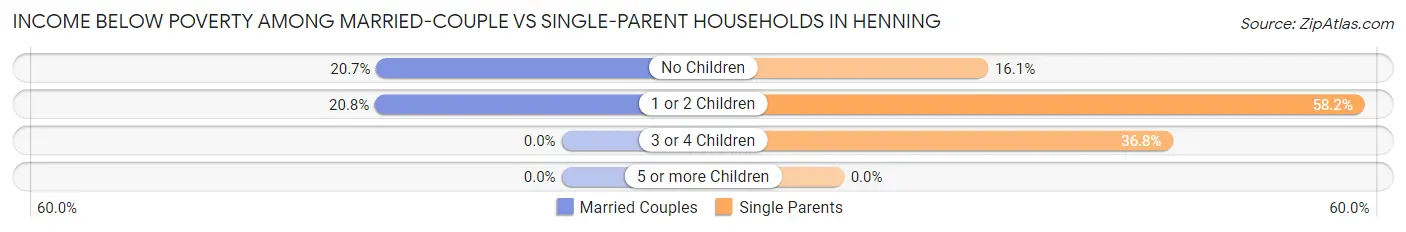
| Children | Married-Couple Families | Single-Parent Households |
| No Children | 12 (20.7%) | 10 (16.1%) |
| 1 or 2 Children | 5 (20.8%) | 46 (58.2%) |
| 3 or 4 Children | 0 (0.0%) | 14 (36.8%) |
| 5 or more Children | 0 (0.0%) | 0 (0.0%) |
| Total | 17 (20.7%) | 70 (39.1%) |
Race in Henning
The most populous races in Henning are Black / African American (1,087 | 82.4%), White / Caucasian (151 | 11.4%), and Two or more Races (54 | 4.1%).
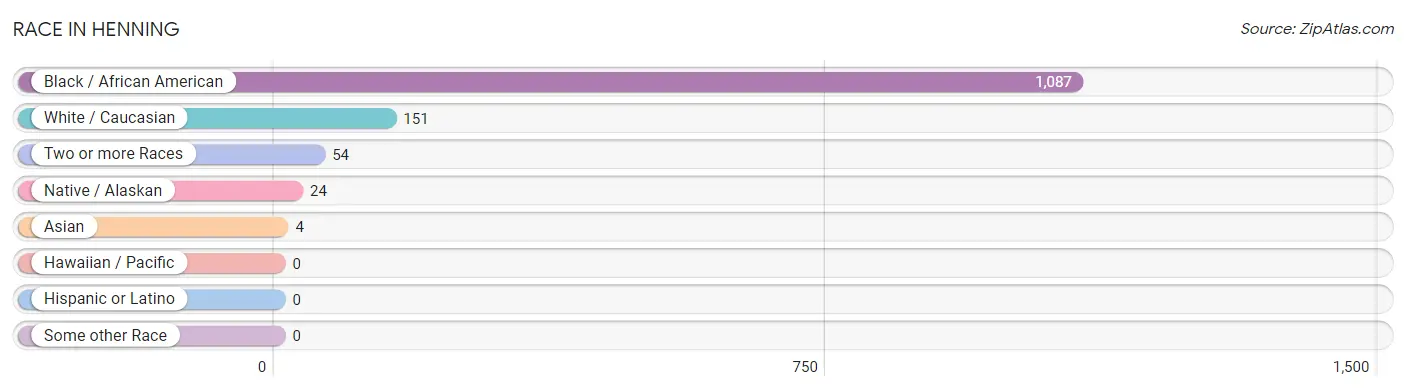
| Race | # Population | % Population |
| Asian | 4 | 0.3% |
| Black / African American | 1,087 | 82.4% |
| Hawaiian / Pacific | 0 | 0.0% |
| Hispanic or Latino | 0 | 0.0% |
| Native / Alaskan | 24 | 1.8% |
| White / Caucasian | 151 | 11.4% |
| Two or more Races | 54 | 4.1% |
| Some other Race | 0 | 0.0% |
| Total | 1,320 | 100.0% |
Ancestry in Henning
The most populous ancestries reported in Henning are German (47 | 3.6%), American (42 | 3.2%), Choctaw (25 | 1.9%), Bhutanese (15 | 1.1%), and Italian (13 | 1.0%), together accounting for 10.8% of all Henning residents.
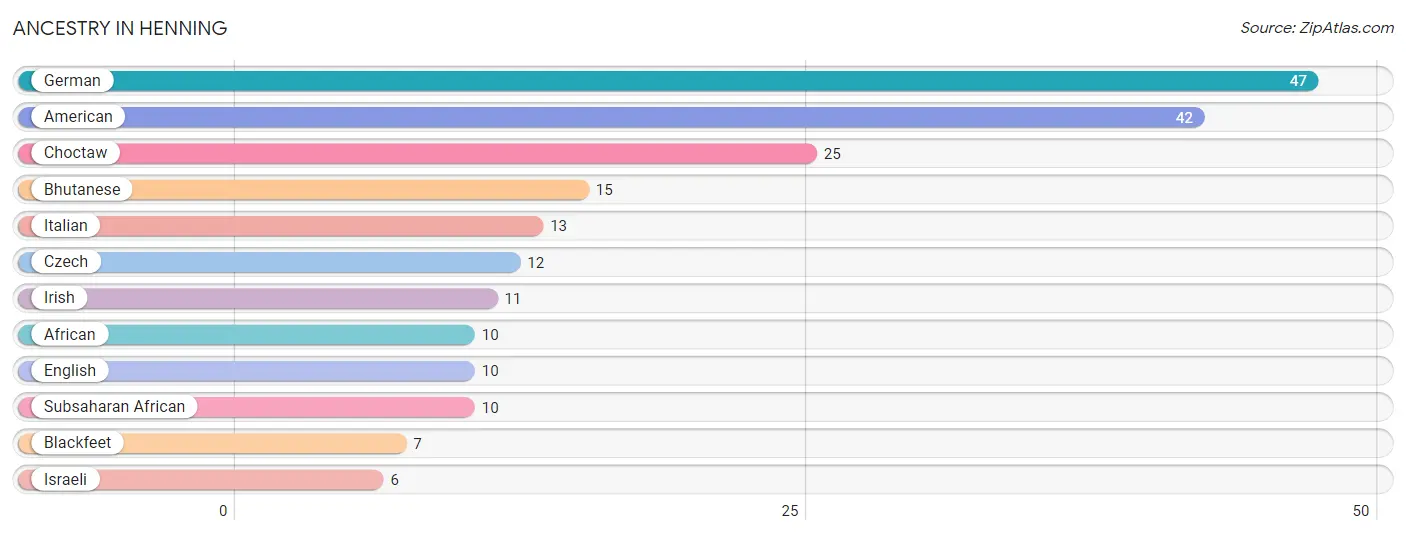
| Ancestry | # Population | % Population |
| African | 10 | 0.8% |
| American | 42 | 3.2% |
| Bhutanese | 15 | 1.1% |
| Blackfeet | 7 | 0.5% |
| Choctaw | 25 | 1.9% |
| Czech | 12 | 0.9% |
| English | 10 | 0.8% |
| German | 47 | 3.6% |
| Irish | 11 | 0.8% |
| Israeli | 6 | 0.4% |
| Italian | 13 | 1.0% |
| Subsaharan African | 10 | 0.8% | View All 12 Rows |
Immigrants in Henning

| Immigration Origin | # Population | % Population | View All 0 Rows |
Sex and Age in Henning
Sex and Age in Henning
The most populous age groups in Henning are 40 to 44 Years (80 | 13.4%) for men and 10 to 14 Years (74 | 10.2%) for women.
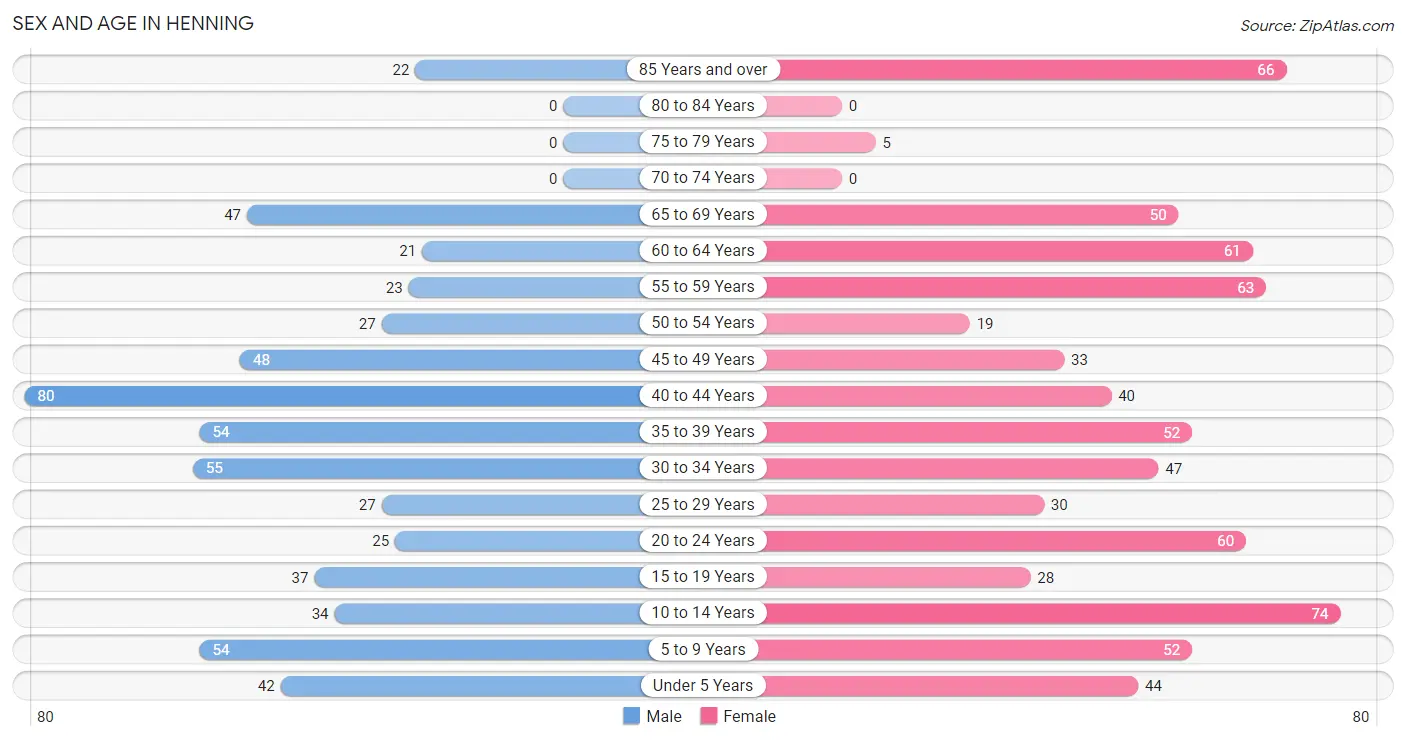
| Age Bracket | Male | Female |
| Under 5 Years | 42 (7.0%) | 44 (6.1%) |
| 5 to 9 Years | 54 (9.1%) | 52 (7.2%) |
| 10 to 14 Years | 34 (5.7%) | 74 (10.2%) |
| 15 to 19 Years | 37 (6.2%) | 28 (3.9%) |
| 20 to 24 Years | 25 (4.2%) | 60 (8.3%) |
| 25 to 29 Years | 27 (4.5%) | 30 (4.1%) |
| 30 to 34 Years | 55 (9.2%) | 47 (6.5%) |
| 35 to 39 Years | 54 (9.1%) | 52 (7.2%) |
| 40 to 44 Years | 80 (13.4%) | 40 (5.5%) |
| 45 to 49 Years | 48 (8.1%) | 33 (4.6%) |
| 50 to 54 Years | 27 (4.5%) | 19 (2.6%) |
| 55 to 59 Years | 23 (3.9%) | 63 (8.7%) |
| 60 to 64 Years | 21 (3.5%) | 61 (8.4%) |
| 65 to 69 Years | 47 (7.9%) | 50 (6.9%) |
| 70 to 74 Years | 0 (0.0%) | 0 (0.0%) |
| 75 to 79 Years | 0 (0.0%) | 5 (0.7%) |
| 80 to 84 Years | 0 (0.0%) | 0 (0.0%) |
| 85 Years and over | 22 (3.7%) | 66 (9.1%) |
| Total | 596 (100.0%) | 724 (100.0%) |
Families and Households in Henning
Median Family Size in Henning
The median family size in Henning is 3.44 persons per family, with single female/mother families (173 | 66.3%) accounting for the largest median family size of 3.55 persons per family. On the other hand, single male/father families (6 | 2.3%) represent the smallest median family size with 3.00 persons per family.
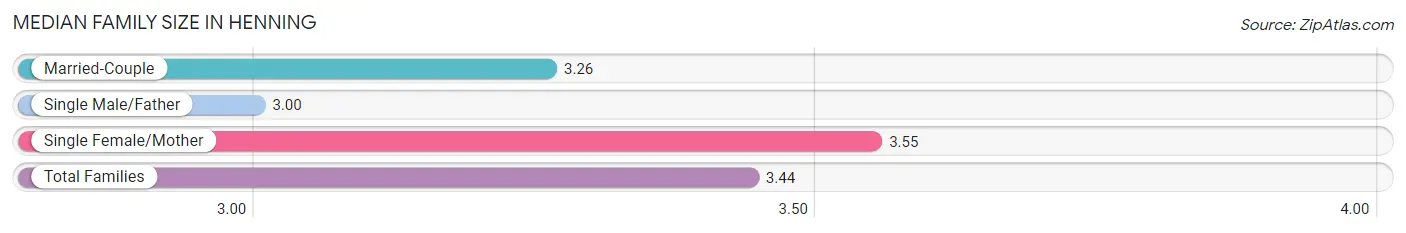
| Family Type | # Families | Family Size |
| Married-Couple | 82 (31.4%) | 3.26 |
| Single Male/Father | 6 (2.3%) | 3.00 |
| Single Female/Mother | 173 (66.3%) | 3.55 |
| Total Families | 261 (100.0%) | 3.44 |
Median Household Size in Henning
The median household size in Henning is 2.48 persons per household, with single female/mother households (173 | 32.5%) accounting for the largest median household size of 3.83 persons per household. non-family households (272 | 51.0%) represent the smallest median household size with 1.28 persons per household.
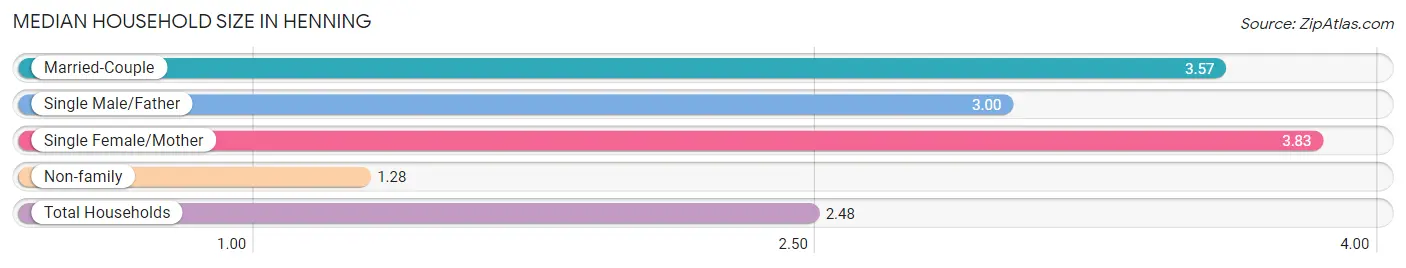
| Household Type | # Households | Household Size |
| Married-Couple | 82 (15.4%) | 3.57 |
| Single Male/Father | 6 (1.1%) | 3.00 |
| Single Female/Mother | 173 (32.5%) | 3.83 |
| Non-family | 272 (51.0%) | 1.28 |
| Total Households | 533 (100.0%) | 2.48 |
Household Size by Marriage Status in Henning
Out of a total of 533 households in Henning, 261 (49.0%) are family households, while 272 (51.0%) are nonfamily households. The most numerous type of family households are 2-person households, comprising 121, and the most common type of nonfamily households are 1-person households, comprising 230.
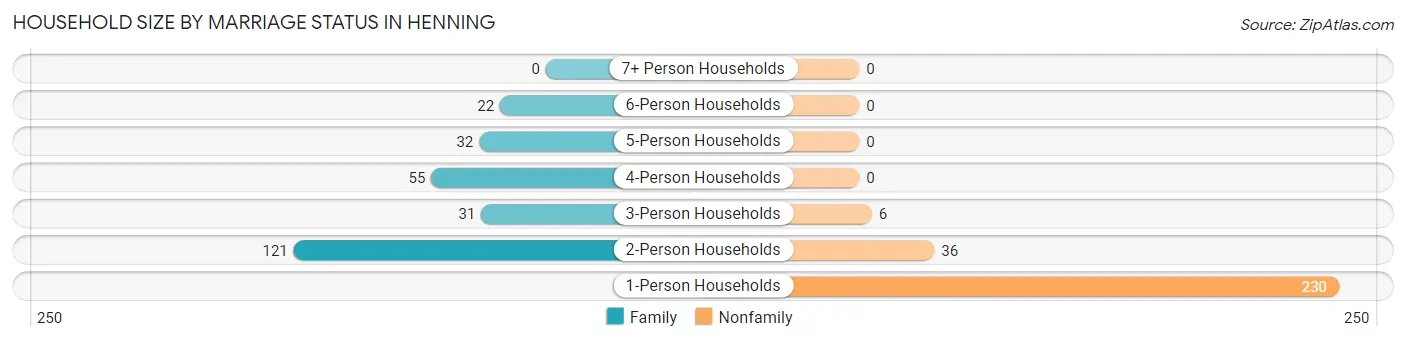
| Household Size | Family Households | Nonfamily Households |
| 1-Person Households | - | 230 (43.1%) |
| 2-Person Households | 121 (22.7%) | 36 (6.8%) |
| 3-Person Households | 31 (5.8%) | 6 (1.1%) |
| 4-Person Households | 55 (10.3%) | 0 (0.0%) |
| 5-Person Households | 32 (6.0%) | 0 (0.0%) |
| 6-Person Households | 22 (4.1%) | 0 (0.0%) |
| 7+ Person Households | 0 (0.0%) | 0 (0.0%) |
| Total | 261 (49.0%) | 272 (51.0%) |
Female Fertility in Henning
Fertility by Age in Henning
Average fertility rate in Henning is 134.0 births per 1,000 women. Women in the age bracket of 20 to 34 years have the highest fertility rate with 197.0 births per 1,000 women. Women in the age bracket of 20 to 34 years acount for 69.2% of all women with births.
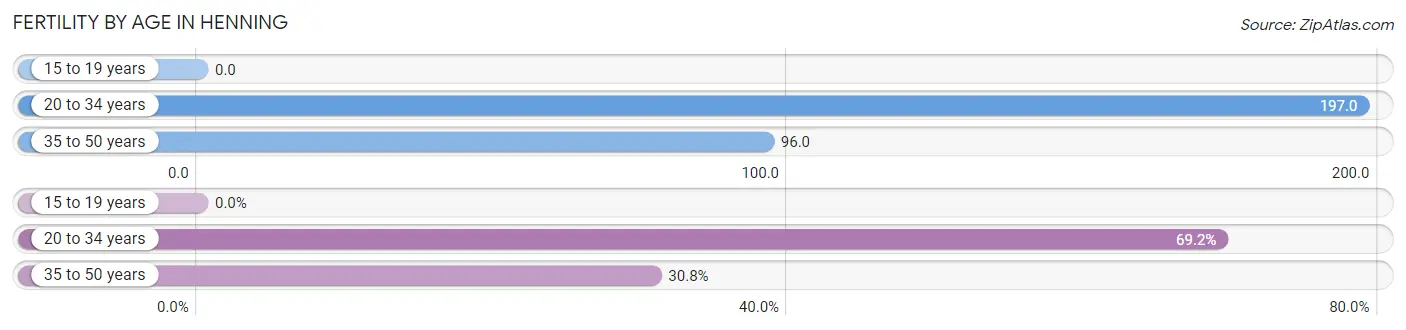
| Age Bracket | Women with Births | Births / 1,000 Women |
| 15 to 19 years | 0 (0.0%) | 0.0 |
| 20 to 34 years | 27 (69.2%) | 197.0 |
| 35 to 50 years | 12 (30.8%) | 96.0 |
| Total | 39 (100.0%) | 134.0 |
Fertility by Age by Marriage Status in Henning
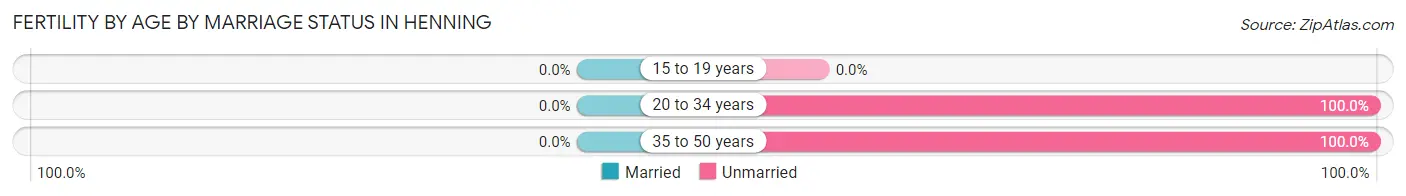
| Age Bracket | Married | Unmarried |
| 15 to 19 years | 0 (0.0%) | 0 (0.0%) |
| 20 to 34 years | 0 (0.0%) | 27 (100.0%) |
| 35 to 50 years | 0 (0.0%) | 12 (100.0%) |
| Total | 0 (0.0%) | 39 (100.0%) |
Fertility by Education in Henning
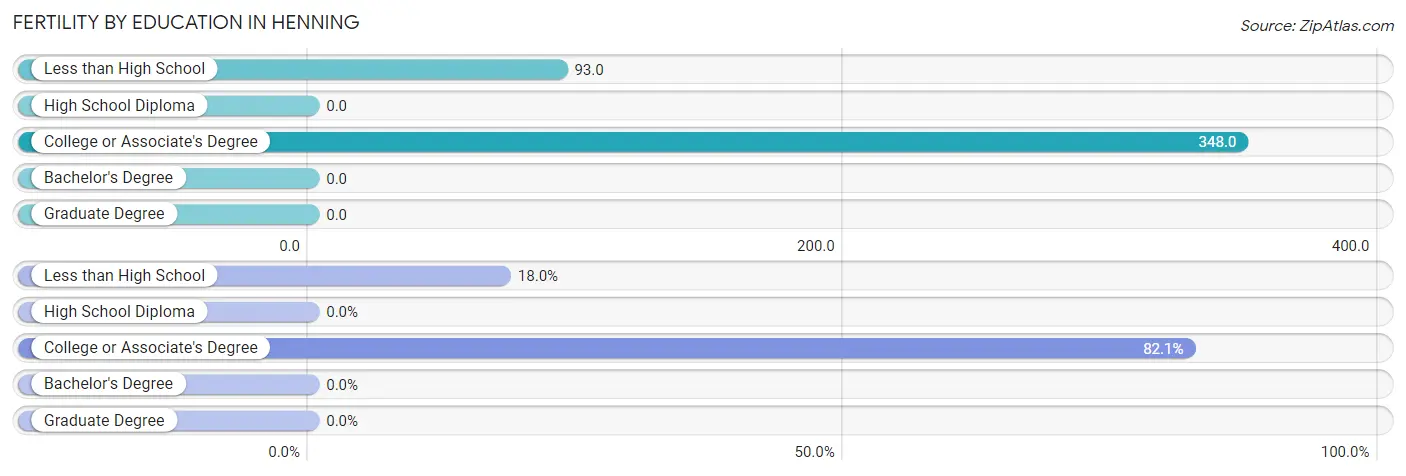
| Educational Attainment | Women with Births | Births / 1,000 Women |
| Less than High School | 7 (17.9%) | 93.0 |
| High School Diploma | 0 (0.0%) | 0.0 |
| College or Associate's Degree | 32 (82.1%) | 348.0 |
| Bachelor's Degree | 0 (0.0%) | 0.0 |
| Graduate Degree | 0 (0.0%) | 0.0 |
| Total | 39 (100.0%) | 134.0 |
Fertility by Education by Marriage Status in Henning
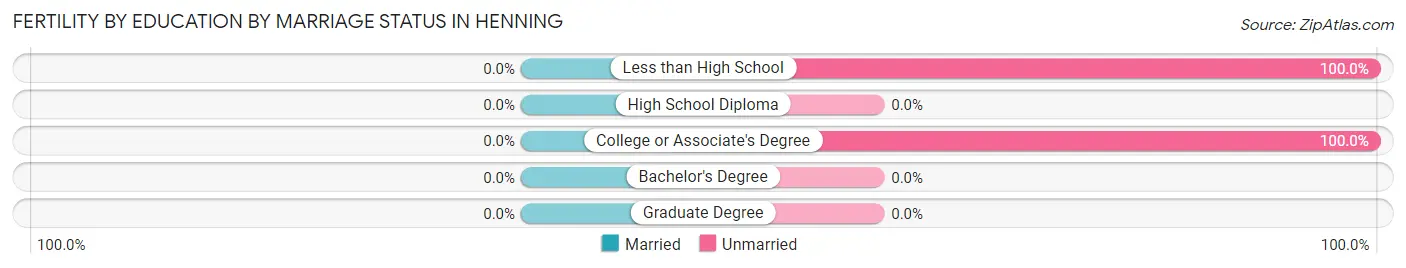
| Educational Attainment | Married | Unmarried |
| Less than High School | 0 (0.0%) | 7 (100.0%) |
| High School Diploma | 0 (0.0%) | 0 (0.0%) |
| College or Associate's Degree | 0 (0.0%) | 32 (100.0%) |
| Bachelor's Degree | 0 (0.0%) | 0 (0.0%) |
| Graduate Degree | 0 (0.0%) | 0 (0.0%) |
| Total | 0 (0.0%) | 39 (100.0%) |
Employment Characteristics in Henning
Employment by Class of Employer in Henning
Among the 420 employed individuals in Henning, private company employees (316 | 75.2%), self-employed (incorporated) (28 | 6.7%), and not-for-profit organizations (27 | 6.4%) make up the most common classes of employment.
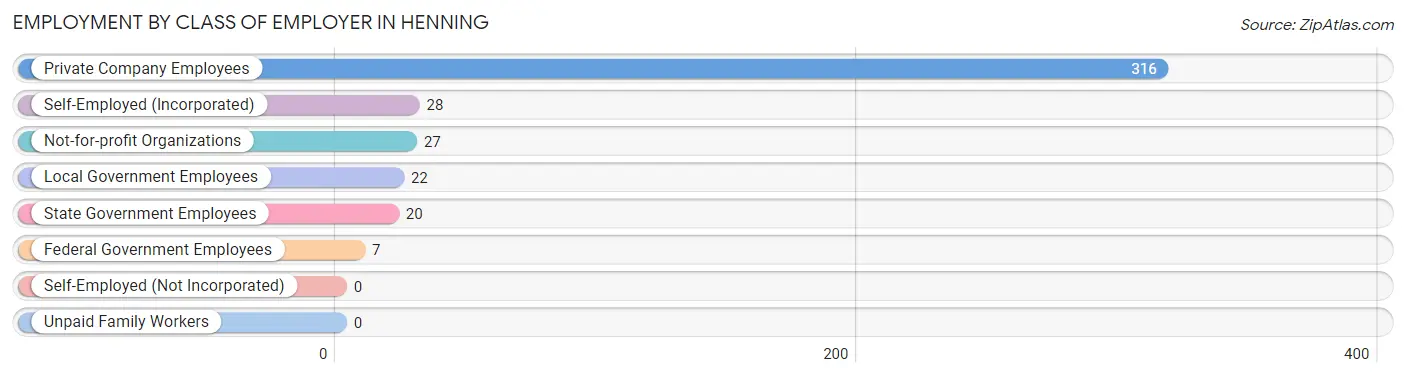
| Employer Class | # Employees | % Employees |
| Private Company Employees | 316 | 75.2% |
| Self-Employed (Incorporated) | 28 | 6.7% |
| Self-Employed (Not Incorporated) | 0 | 0.0% |
| Not-for-profit Organizations | 27 | 6.4% |
| Local Government Employees | 22 | 5.2% |
| State Government Employees | 20 | 4.8% |
| Federal Government Employees | 7 | 1.7% |
| Unpaid Family Workers | 0 | 0.0% |
| Total | 420 | 100.0% |
Employment Status by Age in Henning
According to the labor force statistics for Henning, out of the total population over 16 years of age (986), 56.4% or 556 individuals are in the labor force, with 22.3% or 124 of them unemployed. The age group with the highest labor force participation rate is 45 to 54 years, with 81.1% or 103 individuals in the labor force. Within the labor force, the 16 to 19 years age range has the highest percentage of unemployed individuals, with 100.0% or 10 of them being unemployed.
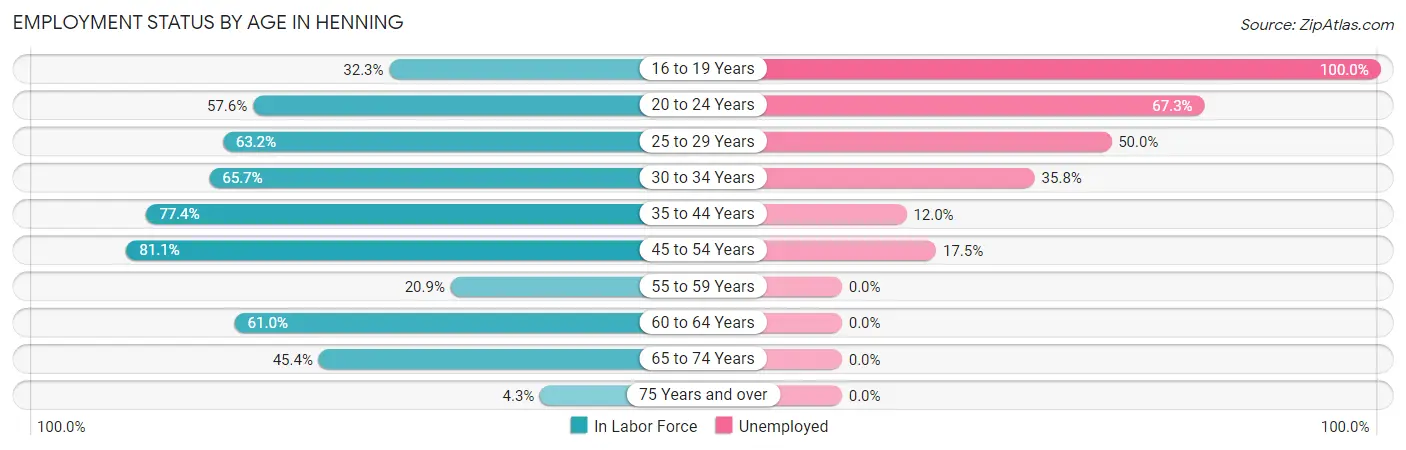
| Age Bracket | In Labor Force | Unemployed |
| 16 to 19 Years | 10 (32.3%) | 10 (100.0%) |
| 20 to 24 Years | 49 (57.6%) | 33 (67.3%) |
| 25 to 29 Years | 36 (63.2%) | 18 (50.0%) |
| 30 to 34 Years | 67 (65.7%) | 24 (35.8%) |
| 35 to 44 Years | 175 (77.4%) | 21 (12.0%) |
| 45 to 54 Years | 103 (81.1%) | 18 (17.5%) |
| 55 to 59 Years | 18 (20.9%) | 0 (0.0%) |
| 60 to 64 Years | 50 (61.0%) | 0 (0.0%) |
| 65 to 74 Years | 44 (45.4%) | 0 (0.0%) |
| 75 Years and over | 4 (4.3%) | 0 (0.0%) |
| Total | 556 (56.4%) | 124 (22.3%) |
Employment Status by Educational Attainment in Henning
According to labor force statistics for Henning, 66.0% of individuals (449) out of the total population between 25 and 64 years of age (680) are in the labor force, with 18.0% or 81 of them being unemployed. The group with the highest labor force participation rate are those with the educational attainment of bachelor's degree or higher, with 84.2% or 48 individuals in the labor force. Within the labor force, individuals with less than high school education have the highest percentage of unemployment, with 30.0% or 15 of them being unemployed.
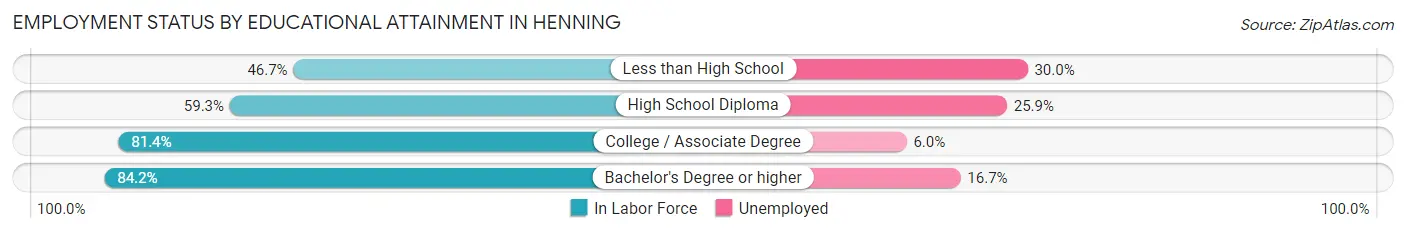
| Educational Attainment | In Labor Force | Unemployed |
| Less than High School | 50 (46.7%) | 32 (30.0%) |
| High School Diploma | 185 (59.3%) | 81 (25.9%) |
| College / Associate Degree | 166 (81.4%) | 12 (6.0%) |
| Bachelor's Degree or higher | 48 (84.2%) | 10 (16.7%) |
| Total | 449 (66.0%) | 122 (18.0%) |
Employment Occupations by Sex in Henning
Management, Business, Science and Arts Occupations
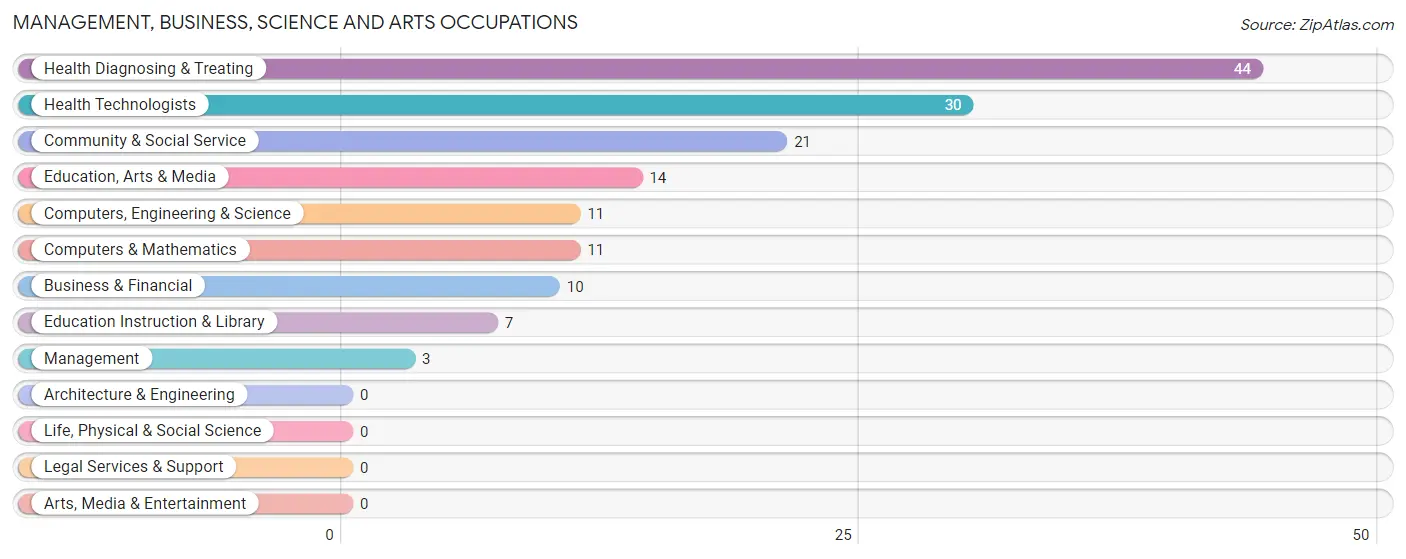
The most common Management, Business, Science and Arts occupations in Henning are Health Diagnosing & Treating (44 | 10.2%), Health Technologists (30 | 6.9%), Community & Social Service (21 | 4.9%), Education, Arts & Media (14 | 3.2%), and Computers, Engineering & Science (11 | 2.5%).
Management, Business, Science and Arts Occupations by Sex
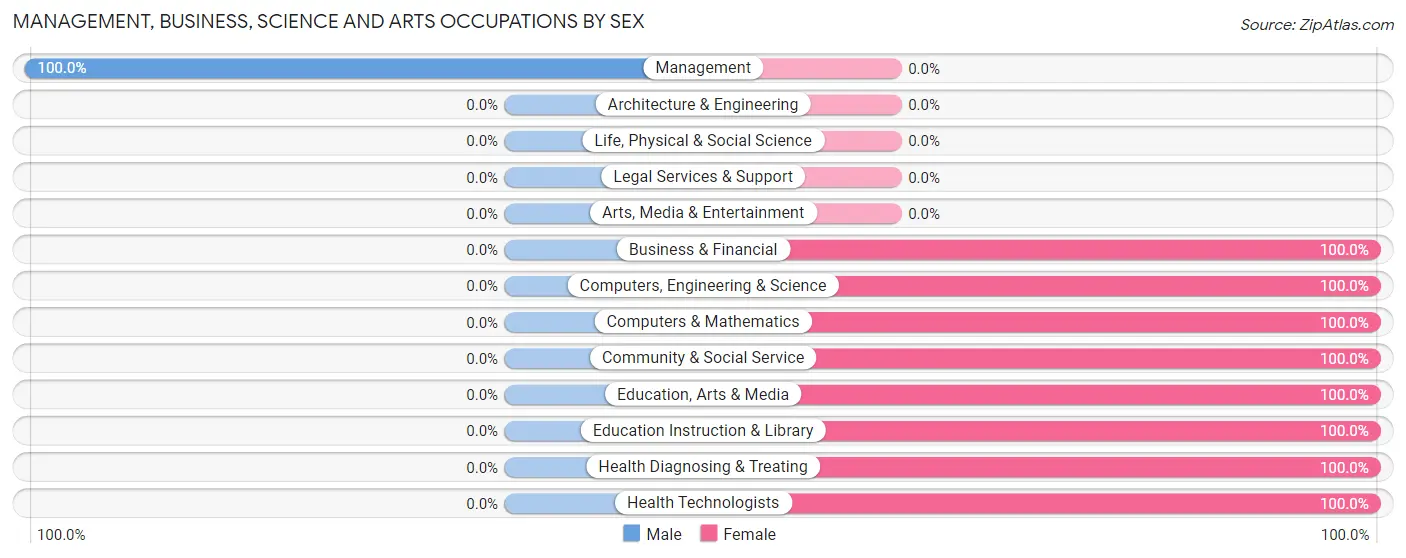
| Occupation | Male | Female |
| Management | 3 (100.0%) | 0 (0.0%) |
| Business & Financial | 0 (0.0%) | 10 (100.0%) |
| Computers, Engineering & Science | 0 (0.0%) | 11 (100.0%) |
| Computers & Mathematics | 0 (0.0%) | 11 (100.0%) |
| Architecture & Engineering | 0 (0.0%) | 0 (0.0%) |
| Life, Physical & Social Science | 0 (0.0%) | 0 (0.0%) |
| Community & Social Service | 0 (0.0%) | 21 (100.0%) |
| Education, Arts & Media | 0 (0.0%) | 14 (100.0%) |
| Legal Services & Support | 0 (0.0%) | 0 (0.0%) |
| Education Instruction & Library | 0 (0.0%) | 7 (100.0%) |
| Arts, Media & Entertainment | 0 (0.0%) | 0 (0.0%) |
| Health Diagnosing & Treating | 0 (0.0%) | 44 (100.0%) |
| Health Technologists | 0 (0.0%) | 30 (100.0%) |
| Total (Category) | 3 (3.4%) | 86 (96.6%) |
| Total (Overall) | 241 (55.8%) | 191 (44.2%) |
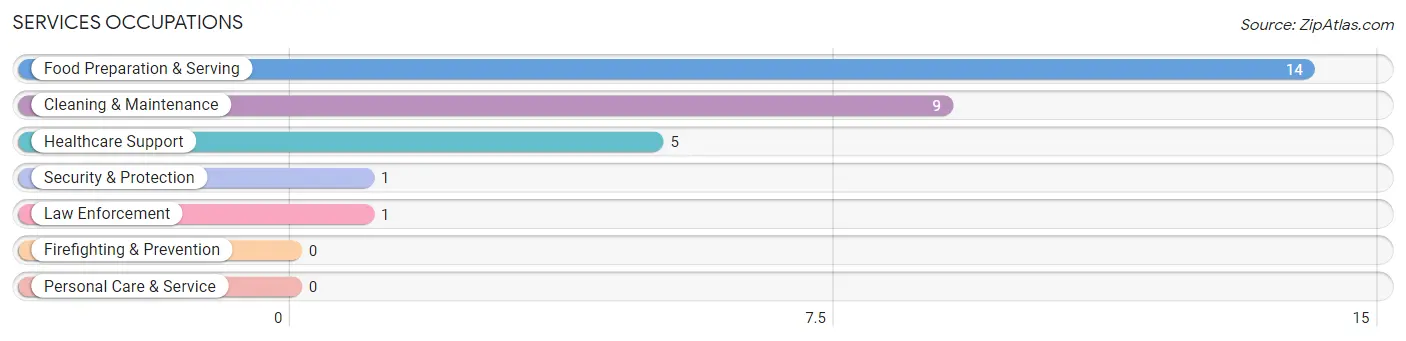
Services Occupations
The most common Services occupations in Henning are Food Preparation & Serving (14 | 3.2%), Cleaning & Maintenance (9 | 2.1%), Healthcare Support (5 | 1.2%), Security & Protection (1 | 0.2%), and Law Enforcement (1 | 0.2%).
Services Occupations by Sex
Within the Services occupations in Henning, the most male-oriented occupations are Security & Protection (100.0%), Law Enforcement (100.0%), and Cleaning & Maintenance (66.7%), while the most female-oriented occupations are Healthcare Support (100.0%), Food Preparation & Serving (100.0%), and Cleaning & Maintenance (33.3%).
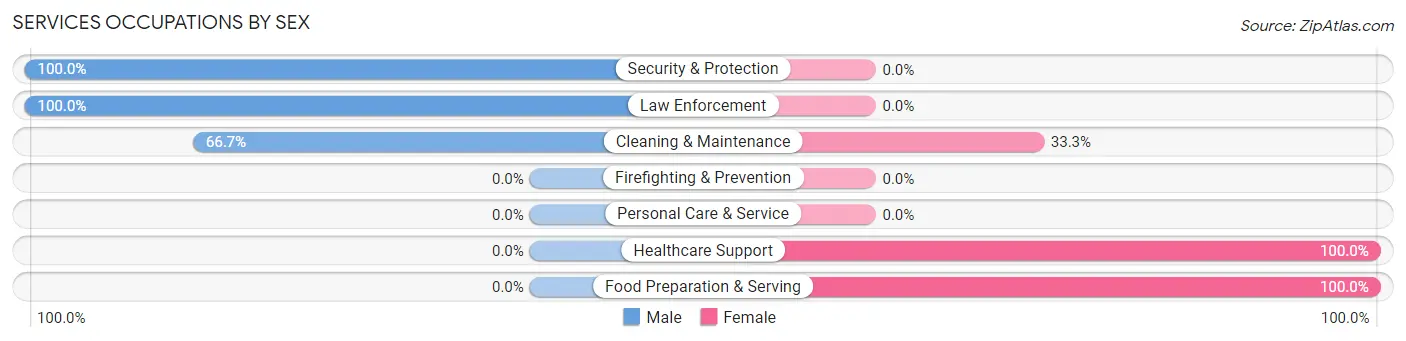
| Occupation | Male | Female |
| Healthcare Support | 0 (0.0%) | 5 (100.0%) |
| Security & Protection | 1 (100.0%) | 0 (0.0%) |
| Firefighting & Prevention | 0 (0.0%) | 0 (0.0%) |
| Law Enforcement | 1 (100.0%) | 0 (0.0%) |
| Food Preparation & Serving | 0 (0.0%) | 14 (100.0%) |
| Cleaning & Maintenance | 6 (66.7%) | 3 (33.3%) |
| Personal Care & Service | 0 (0.0%) | 0 (0.0%) |
| Total (Category) | 7 (24.1%) | 22 (75.9%) |
| Total (Overall) | 241 (55.8%) | 191 (44.2%) |
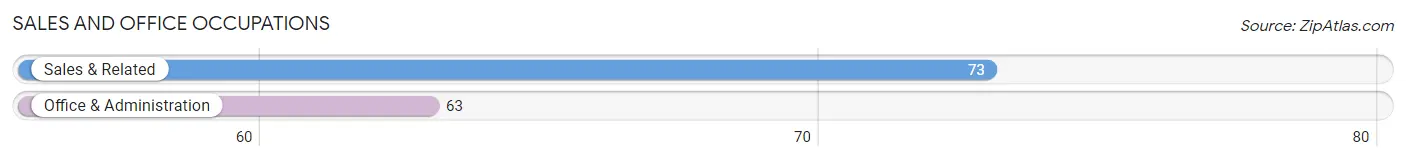
Sales and Office Occupations
The most common Sales and Office occupations in Henning are Sales & Related (73 | 16.9%), and Office & Administration (63 | 14.6%).
Sales and Office Occupations by Sex
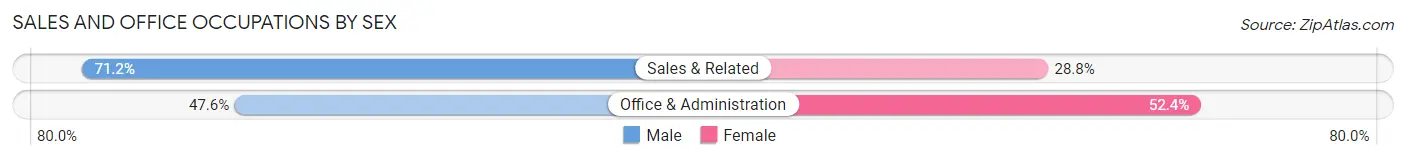
| Occupation | Male | Female |
| Sales & Related | 52 (71.2%) | 21 (28.8%) |
| Office & Administration | 30 (47.6%) | 33 (52.4%) |
| Total (Category) | 82 (60.3%) | 54 (39.7%) |
| Total (Overall) | 241 (55.8%) | 191 (44.2%) |
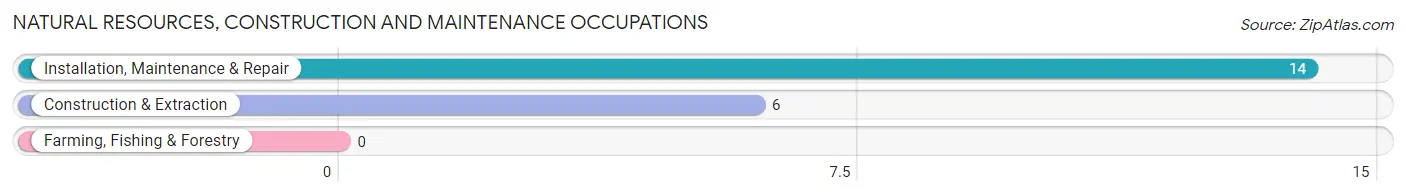
Natural Resources, Construction and Maintenance Occupations
The most common Natural Resources, Construction and Maintenance occupations in Henning are Installation, Maintenance & Repair (14 | 3.2%), and Construction & Extraction (6 | 1.4%).
Natural Resources, Construction and Maintenance Occupations by Sex
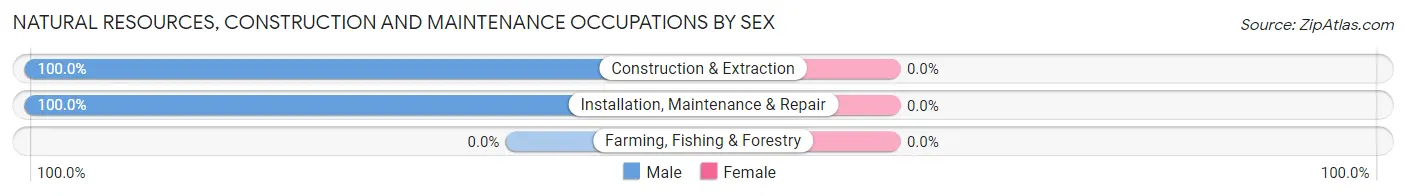
| Occupation | Male | Female |
| Farming, Fishing & Forestry | 0 (0.0%) | 0 (0.0%) |
| Construction & Extraction | 6 (100.0%) | 0 (0.0%) |
| Installation, Maintenance & Repair | 14 (100.0%) | 0 (0.0%) |
| Total (Category) | 20 (100.0%) | 0 (0.0%) |
| Total (Overall) | 241 (55.8%) | 191 (44.2%) |
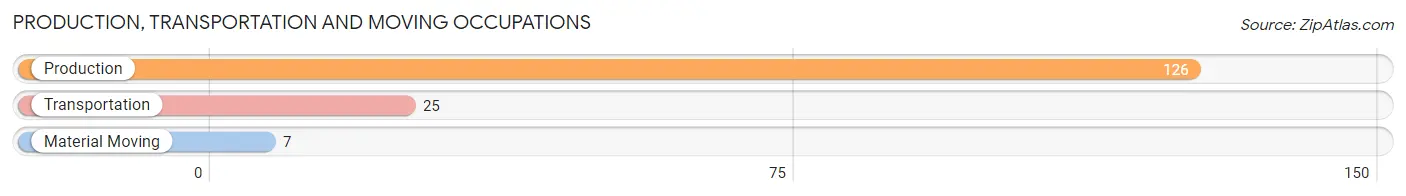
Production, Transportation and Moving Occupations
The most common Production, Transportation and Moving occupations in Henning are Production (126 | 29.2%), Transportation (25 | 5.8%), and Material Moving (7 | 1.6%).
Production, Transportation and Moving Occupations by Sex
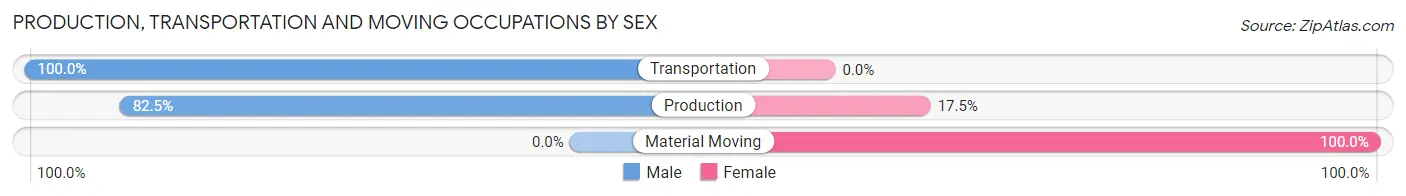
| Occupation | Male | Female |
| Production | 104 (82.5%) | 22 (17.5%) |
| Transportation | 25 (100.0%) | 0 (0.0%) |
| Material Moving | 0 (0.0%) | 7 (100.0%) |
| Total (Category) | 129 (81.7%) | 29 (18.3%) |
| Total (Overall) | 241 (55.8%) | 191 (44.2%) |
Employment Industries by Sex in Henning
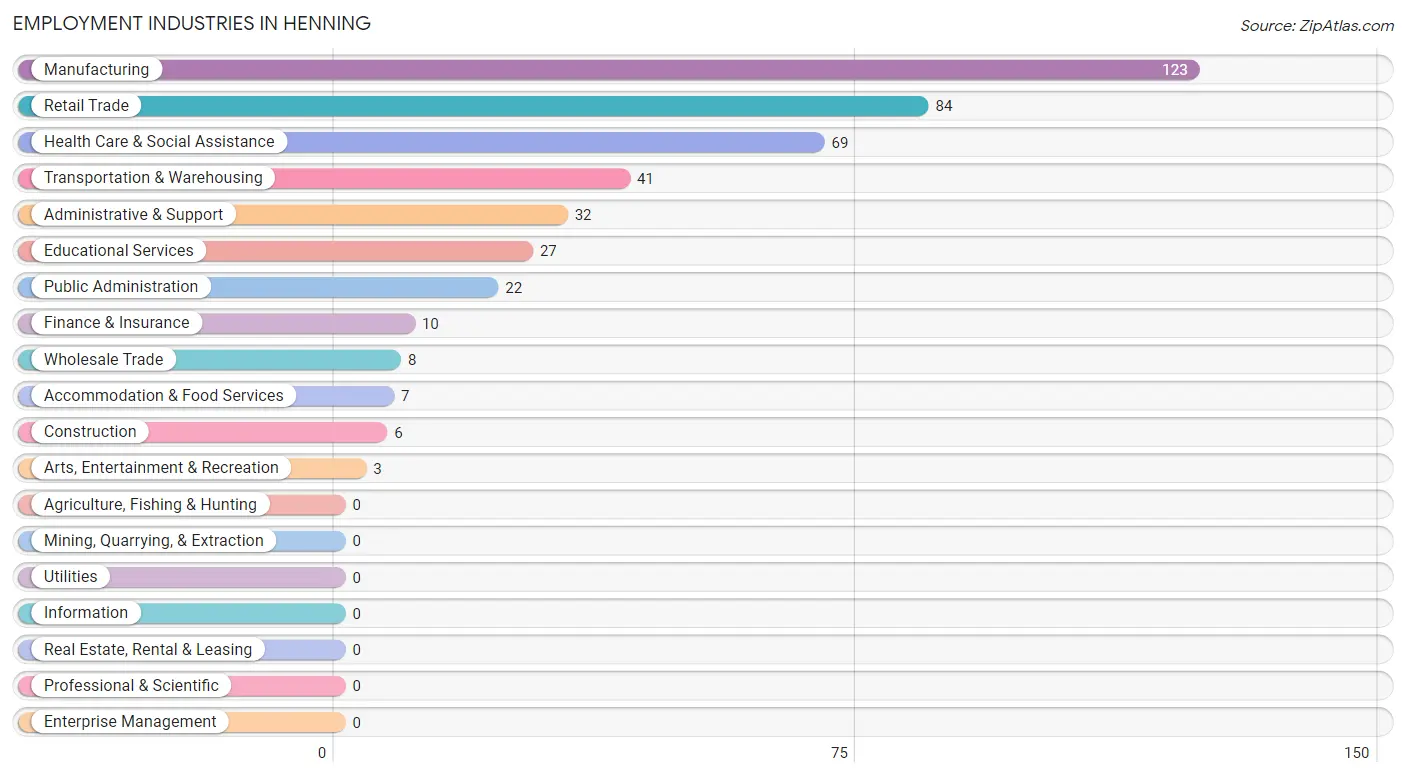
Employment Industries in Henning
The major employment industries in Henning include Manufacturing (123 | 28.5%), Retail Trade (84 | 19.4%), Health Care & Social Assistance (69 | 16.0%), Transportation & Warehousing (41 | 9.5%), and Administrative & Support (32 | 7.4%).
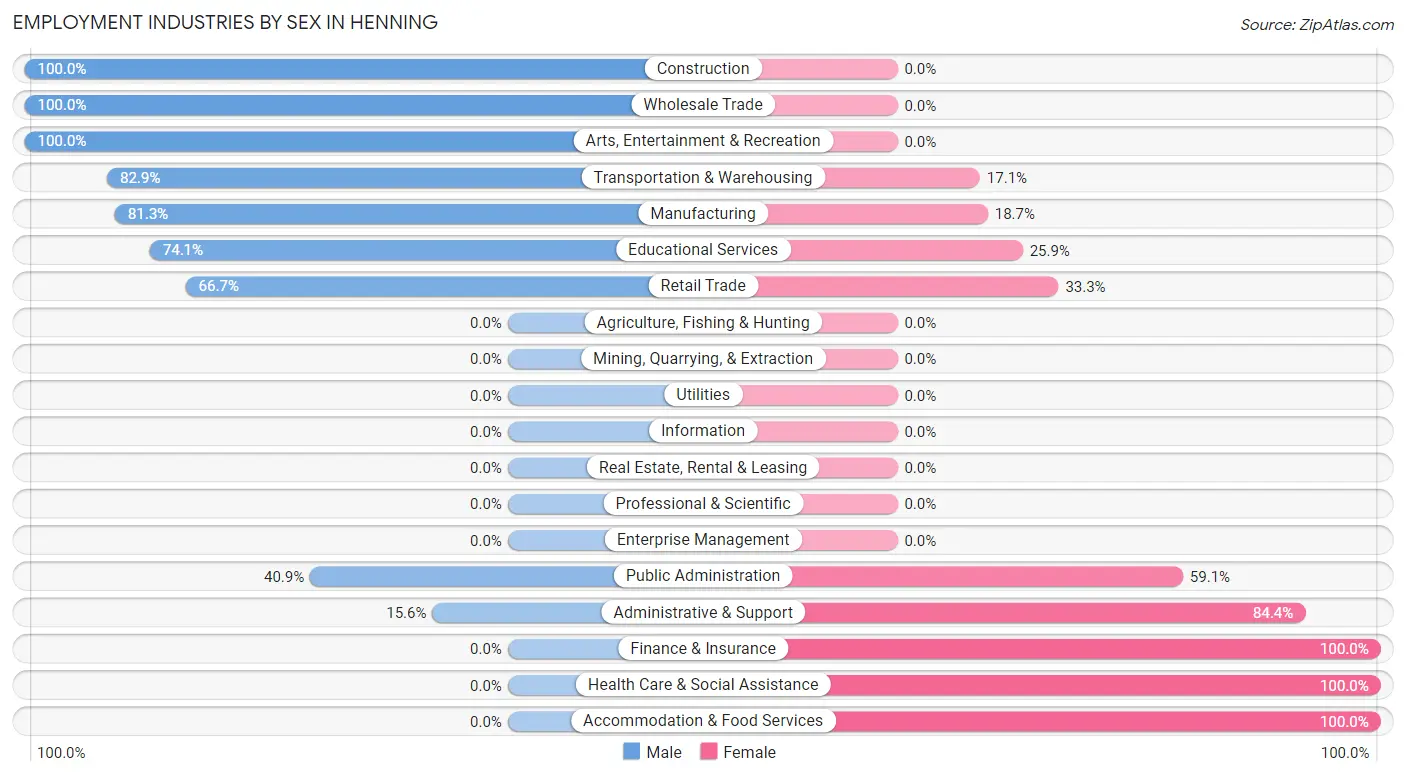
Employment Industries by Sex in Henning
The Henning industries that see more men than women are Construction (100.0%), Wholesale Trade (100.0%), and Arts, Entertainment & Recreation (100.0%), whereas the industries that tend to have a higher number of women are Finance & Insurance (100.0%), Health Care & Social Assistance (100.0%), and Accommodation & Food Services (100.0%).
| Industry | Male | Female |
| Agriculture, Fishing & Hunting | 0 (0.0%) | 0 (0.0%) |
| Mining, Quarrying, & Extraction | 0 (0.0%) | 0 (0.0%) |
| Construction | 6 (100.0%) | 0 (0.0%) |
| Manufacturing | 100 (81.3%) | 23 (18.7%) |
| Wholesale Trade | 8 (100.0%) | 0 (0.0%) |
| Retail Trade | 56 (66.7%) | 28 (33.3%) |
| Transportation & Warehousing | 34 (82.9%) | 7 (17.1%) |
| Utilities | 0 (0.0%) | 0 (0.0%) |
| Information | 0 (0.0%) | 0 (0.0%) |
| Finance & Insurance | 0 (0.0%) | 10 (100.0%) |
| Real Estate, Rental & Leasing | 0 (0.0%) | 0 (0.0%) |
| Professional & Scientific | 0 (0.0%) | 0 (0.0%) |
| Enterprise Management | 0 (0.0%) | 0 (0.0%) |
| Administrative & Support | 5 (15.6%) | 27 (84.4%) |
| Educational Services | 20 (74.1%) | 7 (25.9%) |
| Health Care & Social Assistance | 0 (0.0%) | 69 (100.0%) |
| Arts, Entertainment & Recreation | 3 (100.0%) | 0 (0.0%) |
| Accommodation & Food Services | 0 (0.0%) | 7 (100.0%) |
| Public Administration | 9 (40.9%) | 13 (59.1%) |
| Total | 241 (55.8%) | 191 (44.2%) |
Education in Henning
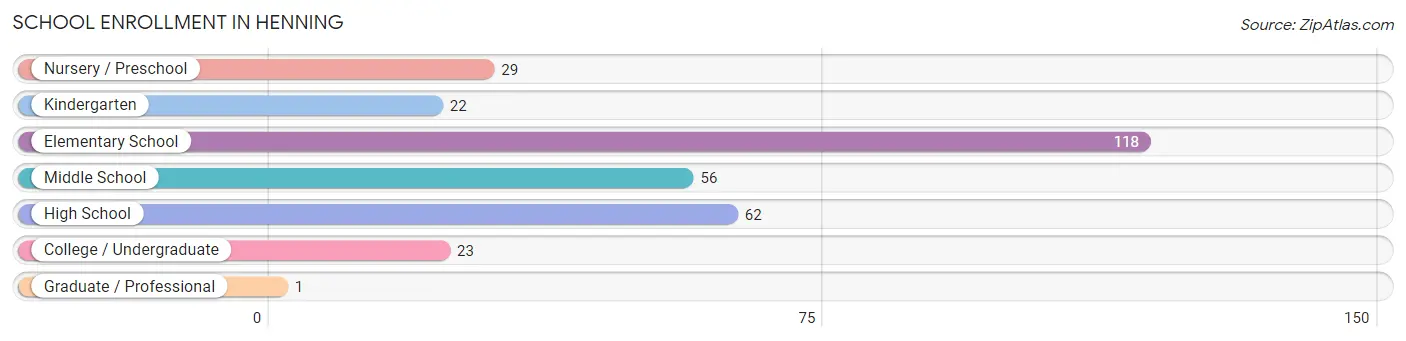
School Enrollment in Henning
The most common levels of schooling among the 311 students in Henning are elementary school (118 | 37.9%), high school (62 | 19.9%), and middle school (56 | 18.0%).
| School Level | # Students | % Students |
| Nursery / Preschool | 29 | 9.3% |
| Kindergarten | 22 | 7.1% |
| Elementary School | 118 | 37.9% |
| Middle School | 56 | 18.0% |
| High School | 62 | 19.9% |
| College / Undergraduate | 23 | 7.4% |
| Graduate / Professional | 1 | 0.3% |
| Total | 311 | 100.0% |
School Enrollment by Age by Funding Source in Henning
Out of a total of 311 students who are enrolled in schools in Henning, 32 (10.3%) attend a private institution, while the remaining 279 (89.7%) are enrolled in public schools. The age group of 20 to 24 year olds has the highest likelihood of being enrolled in private schools, with 14 (93.3% in the age bracket) enrolled. Conversely, the age group of 3 to 4 year olds has the lowest likelihood of being enrolled in a private school, with 21 (100.0% in the age bracket) attending a public institution.
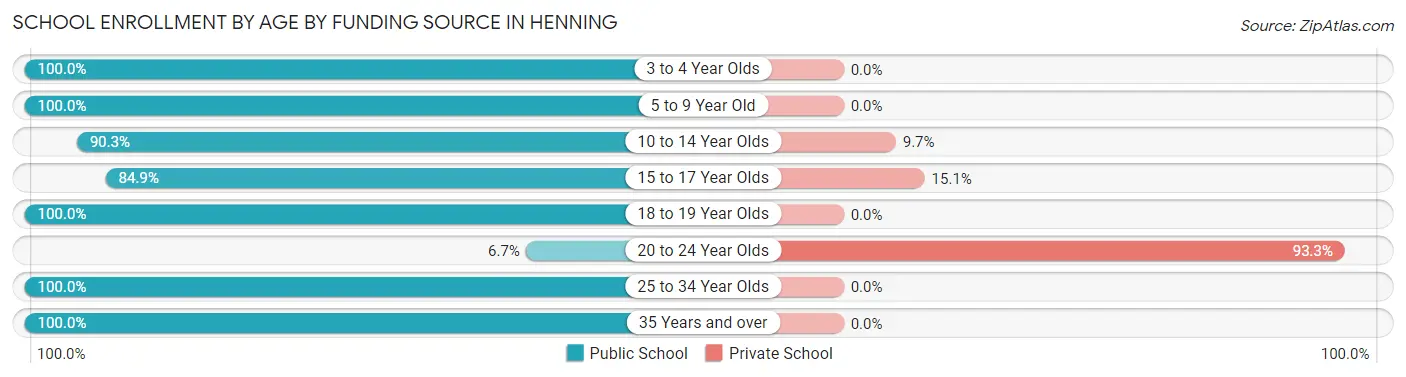
| Age Bracket | Public School | Private School |
| 3 to 4 Year Olds | 21 (100.0%) | 0 (0.0%) |
| 5 to 9 Year Old | 106 (100.0%) | 0 (0.0%) |
| 10 to 14 Year Olds | 93 (90.3%) | 10 (9.7%) |
| 15 to 17 Year Olds | 45 (84.9%) | 8 (15.1%) |
| 18 to 19 Year Olds | 5 (100.0%) | 0 (0.0%) |
| 20 to 24 Year Olds | 1 (6.7%) | 14 (93.3%) |
| 25 to 34 Year Olds | 1 (100.0%) | 0 (0.0%) |
| 35 Years and over | 7 (100.0%) | 0 (0.0%) |
| Total | 279 (89.7%) | 32 (10.3%) |
Educational Attainment by Field of Study in Henning
Business (40 | 49.4%), education (12 | 14.8%), physical & health sciences (9 | 11.1%), social sciences (7 | 8.6%), and arts & humanities (7 | 8.6%) are the most common fields of study among 81 individuals in Henning who have obtained a bachelor's degree or higher.
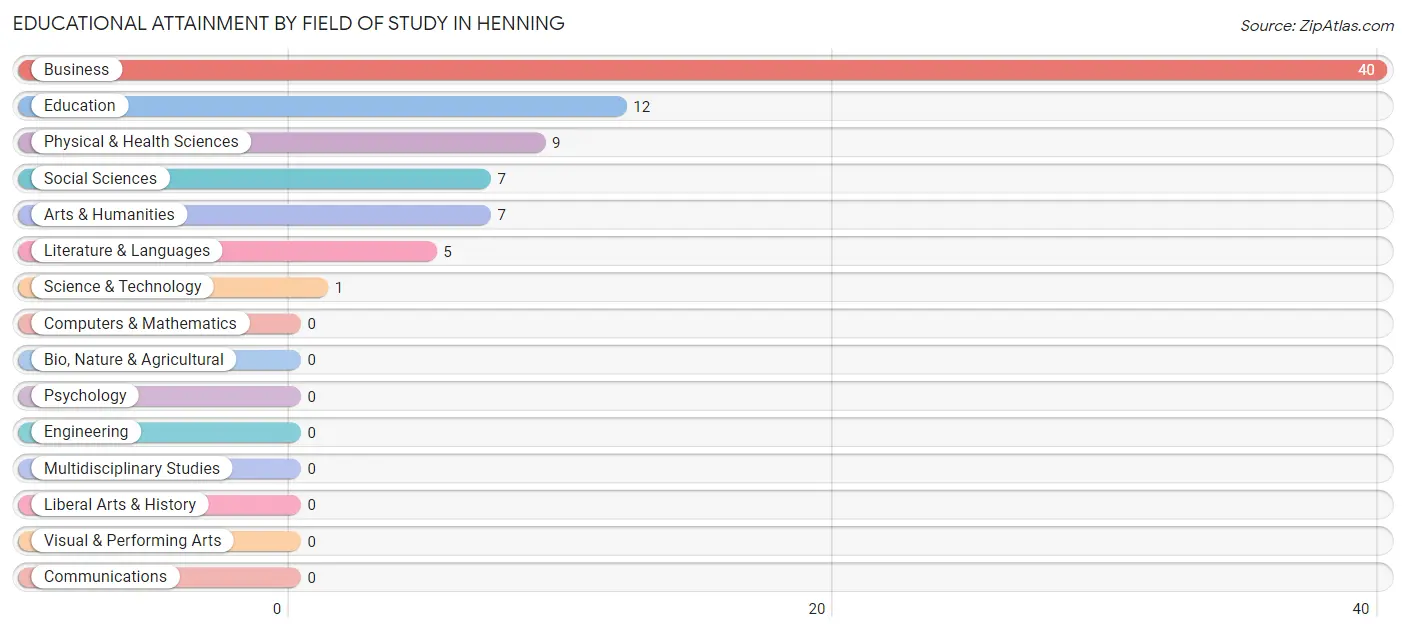
| Field of Study | # Graduates | % Graduates |
| Computers & Mathematics | 0 | 0.0% |
| Bio, Nature & Agricultural | 0 | 0.0% |
| Physical & Health Sciences | 9 | 11.1% |
| Psychology | 0 | 0.0% |
| Social Sciences | 7 | 8.6% |
| Engineering | 0 | 0.0% |
| Multidisciplinary Studies | 0 | 0.0% |
| Science & Technology | 1 | 1.2% |
| Business | 40 | 49.4% |
| Education | 12 | 14.8% |
| Literature & Languages | 5 | 6.2% |
| Liberal Arts & History | 0 | 0.0% |
| Visual & Performing Arts | 0 | 0.0% |
| Communications | 0 | 0.0% |
| Arts & Humanities | 7 | 8.6% |
| Total | 81 | 100.0% |
Transportation & Commute in Henning
Vehicle Availability by Sex in Henning
The most prevalent vehicle ownership categories in Henning are males with 1 vehicle (149, accounting for 61.8%) and females with 1 vehicle (81, making up 83.2%).
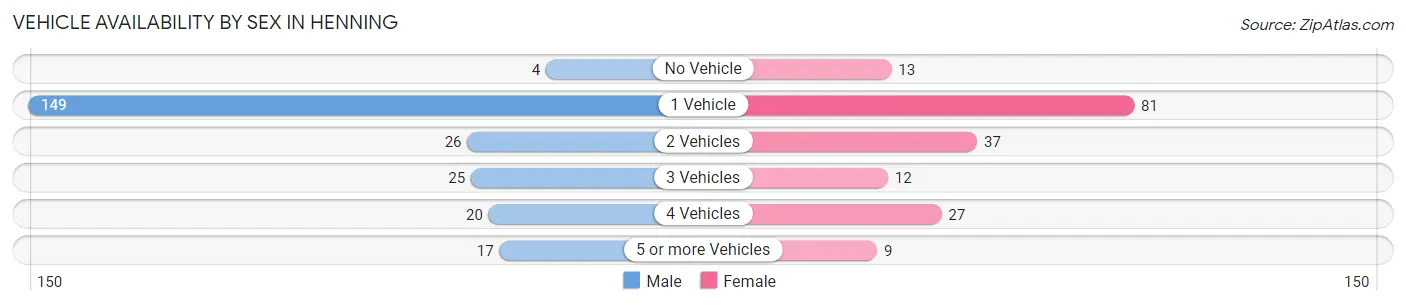
| Vehicles Available | Male | Female |
| No Vehicle | 4 (1.7%) | 13 (7.3%) |
| 1 Vehicle | 149 (61.8%) | 81 (45.3%) |
| 2 Vehicles | 26 (10.8%) | 37 (20.7%) |
| 3 Vehicles | 25 (10.4%) | 12 (6.7%) |
| 4 Vehicles | 20 (8.3%) | 27 (15.1%) |
| 5 or more Vehicles | 17 (7.0%) | 9 (5.0%) |
| Total | 241 (100.0%) | 179 (100.0%) |
Commute Time in Henning
The most frequently occuring commute durations in Henning are 20 to 24 minutes (104 commuters, 25.6%), 10 to 14 minutes (62 commuters, 15.3%), and 15 to 19 minutes (46 commuters, 11.3%).
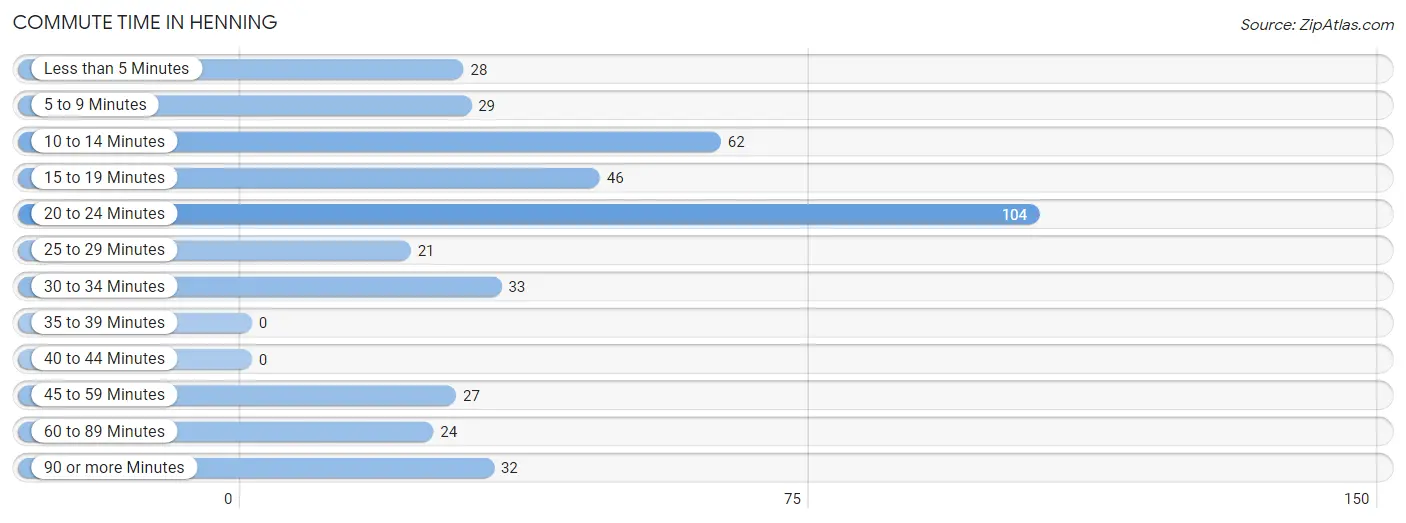
| Commute Time | # Commuters | % Commuters |
| Less than 5 Minutes | 28 | 6.9% |
| 5 to 9 Minutes | 29 | 7.1% |
| 10 to 14 Minutes | 62 | 15.3% |
| 15 to 19 Minutes | 46 | 11.3% |
| 20 to 24 Minutes | 104 | 25.6% |
| 25 to 29 Minutes | 21 | 5.2% |
| 30 to 34 Minutes | 33 | 8.1% |
| 35 to 39 Minutes | 0 | 0.0% |
| 40 to 44 Minutes | 0 | 0.0% |
| 45 to 59 Minutes | 27 | 6.7% |
| 60 to 89 Minutes | 24 | 5.9% |
| 90 or more Minutes | 32 | 7.9% |
Commute Time by Sex in Henning
The most common commute times in Henning are 20 to 24 minutes (73 commuters, 30.3%) for males and 10 to 14 minutes (44 commuters, 26.7%) for females.
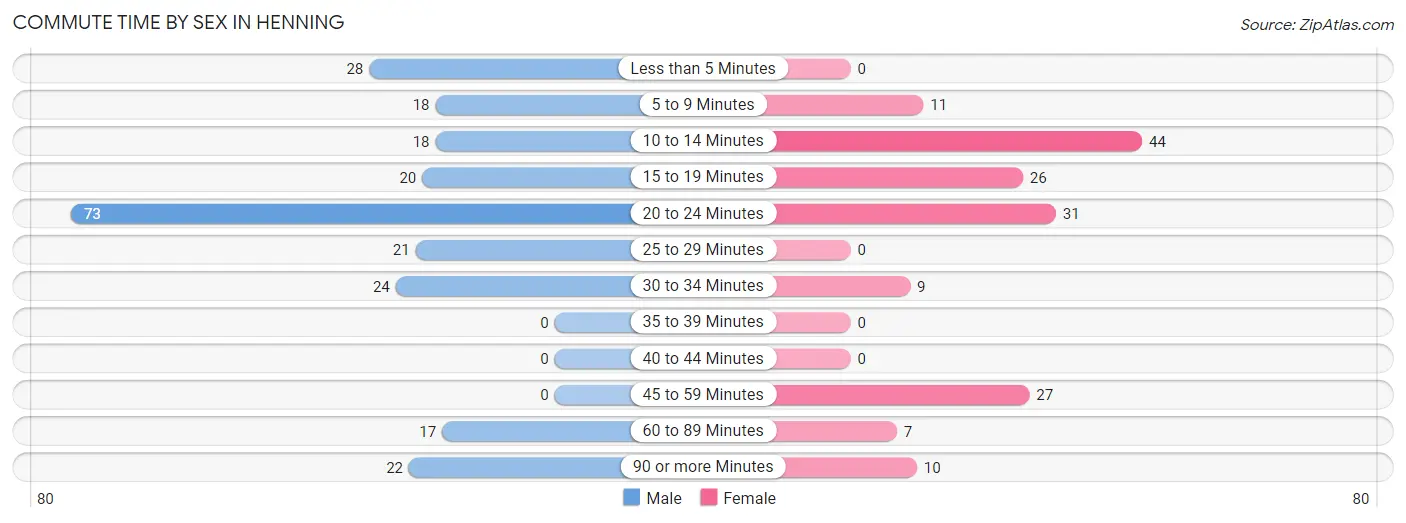
| Commute Time | Male | Female |
| Less than 5 Minutes | 28 (11.6%) | 0 (0.0%) |
| 5 to 9 Minutes | 18 (7.5%) | 11 (6.7%) |
| 10 to 14 Minutes | 18 (7.5%) | 44 (26.7%) |
| 15 to 19 Minutes | 20 (8.3%) | 26 (15.8%) |
| 20 to 24 Minutes | 73 (30.3%) | 31 (18.8%) |
| 25 to 29 Minutes | 21 (8.7%) | 0 (0.0%) |
| 30 to 34 Minutes | 24 (10.0%) | 9 (5.4%) |
| 35 to 39 Minutes | 0 (0.0%) | 0 (0.0%) |
| 40 to 44 Minutes | 0 (0.0%) | 0 (0.0%) |
| 45 to 59 Minutes | 0 (0.0%) | 27 (16.4%) |
| 60 to 89 Minutes | 17 (7.0%) | 7 (4.2%) |
| 90 or more Minutes | 22 (9.1%) | 10 (6.1%) |
Time of Departure to Work by Sex in Henning
The most frequent times of departure to work in Henning are 6:00 AM to 6:29 AM (104, 43.1%) for males and 6:30 AM to 6:59 AM (29, 17.6%) for females.
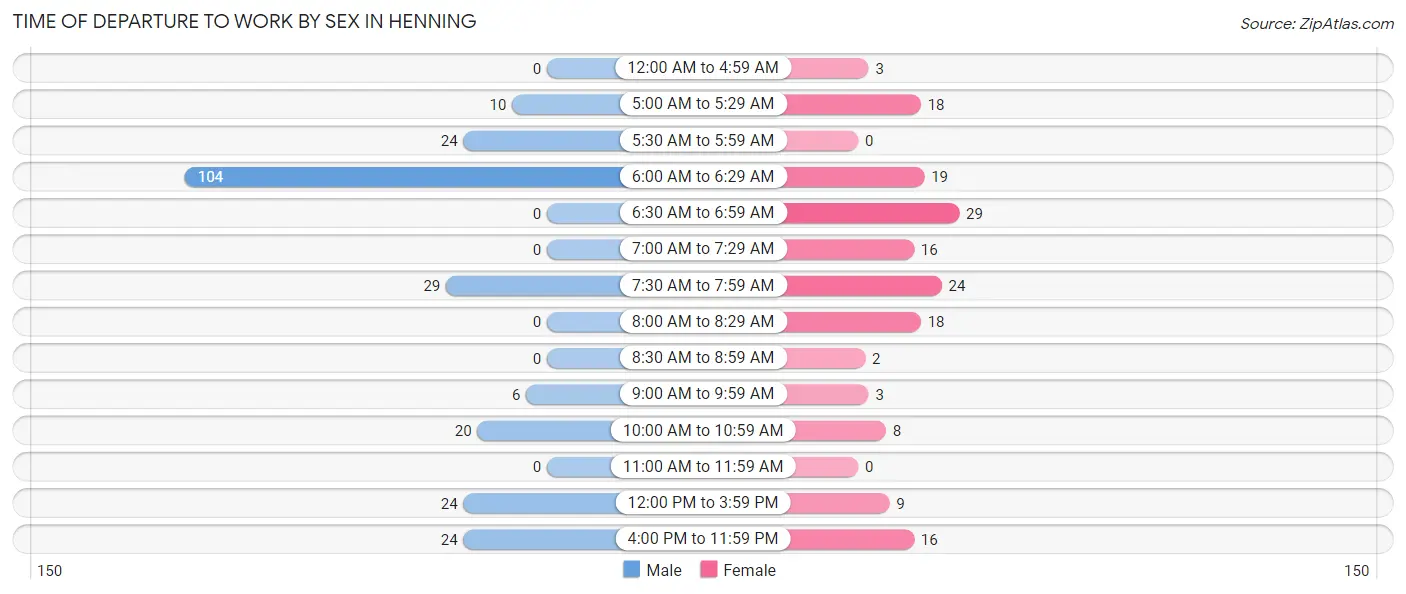
| Time of Departure | Male | Female |
| 12:00 AM to 4:59 AM | 0 (0.0%) | 3 (1.8%) |
| 5:00 AM to 5:29 AM | 10 (4.2%) | 18 (10.9%) |
| 5:30 AM to 5:59 AM | 24 (10.0%) | 0 (0.0%) |
| 6:00 AM to 6:29 AM | 104 (43.1%) | 19 (11.5%) |
| 6:30 AM to 6:59 AM | 0 (0.0%) | 29 (17.6%) |
| 7:00 AM to 7:29 AM | 0 (0.0%) | 16 (9.7%) |
| 7:30 AM to 7:59 AM | 29 (12.0%) | 24 (14.5%) |
| 8:00 AM to 8:29 AM | 0 (0.0%) | 18 (10.9%) |
| 8:30 AM to 8:59 AM | 0 (0.0%) | 2 (1.2%) |
| 9:00 AM to 9:59 AM | 6 (2.5%) | 3 (1.8%) |
| 10:00 AM to 10:59 AM | 20 (8.3%) | 8 (4.9%) |
| 11:00 AM to 11:59 AM | 0 (0.0%) | 0 (0.0%) |
| 12:00 PM to 3:59 PM | 24 (10.0%) | 9 (5.4%) |
| 4:00 PM to 11:59 PM | 24 (10.0%) | 16 (9.7%) |
| Total | 241 (100.0%) | 165 (100.0%) |
Housing Occupancy in Henning
Occupancy by Ownership in Henning
Of the total 533 dwellings in Henning, owner-occupied units account for 328 (61.5%), while renter-occupied units make up 205 (38.5%).
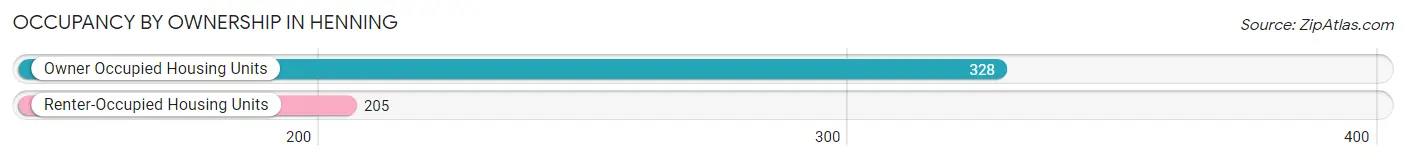
| Occupancy | # Housing Units | % Housing Units |
| Owner Occupied Housing Units | 328 | 61.5% |
| Renter-Occupied Housing Units | 205 | 38.5% |
| Total Occupied Housing Units | 533 | 100.0% |
Occupancy by Household Size in Henning
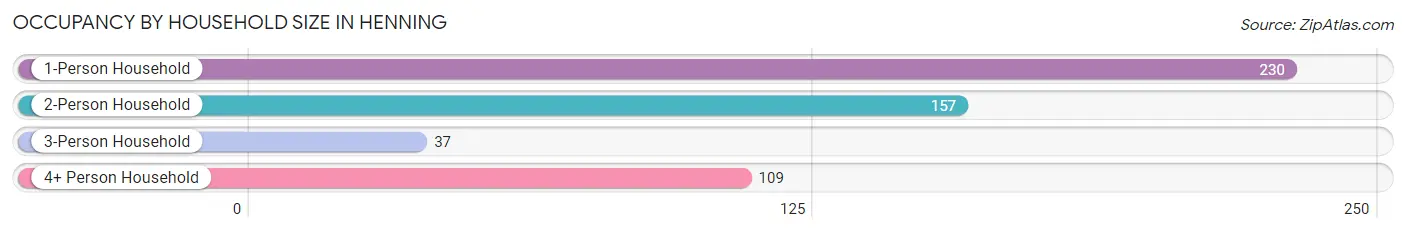
| Household Size | # Housing Units | % Housing Units |
| 1-Person Household | 230 | 43.1% |
| 2-Person Household | 157 | 29.5% |
| 3-Person Household | 37 | 6.9% |
| 4+ Person Household | 109 | 20.4% |
| Total Housing Units | 533 | 100.0% |
Occupancy by Ownership by Household Size in Henning
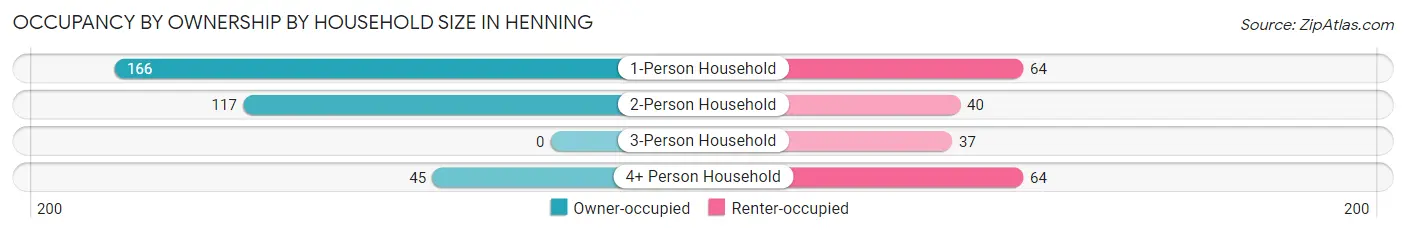
| Household Size | Owner-occupied | Renter-occupied |
| 1-Person Household | 166 (72.2%) | 64 (27.8%) |
| 2-Person Household | 117 (74.5%) | 40 (25.5%) |
| 3-Person Household | 0 (0.0%) | 37 (100.0%) |
| 4+ Person Household | 45 (41.3%) | 64 (58.7%) |
| Total Housing Units | 328 (61.5%) | 205 (38.5%) |
Occupancy by Educational Attainment in Henning
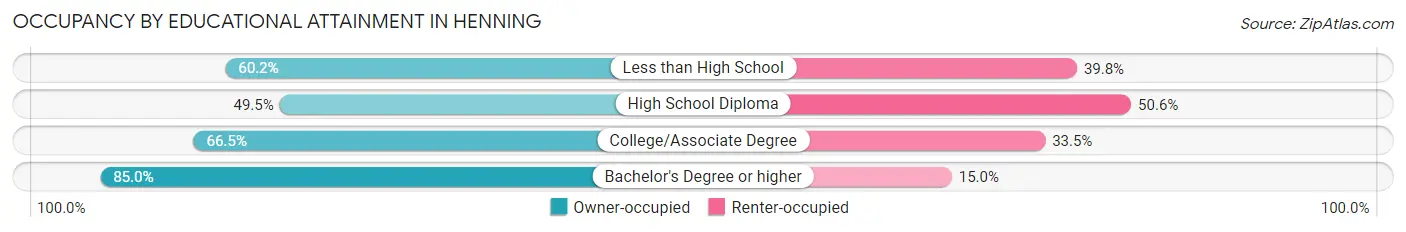
| Household Size | Owner-occupied | Renter-occupied |
| Less than High School | 62 (60.2%) | 41 (39.8%) |
| High School Diploma | 90 (49.4%) | 92 (50.5%) |
| College/Associate Degree | 125 (66.5%) | 63 (33.5%) |
| Bachelor's Degree or higher | 51 (85.0%) | 9 (15.0%) |
Occupancy by Age of Householder in Henning
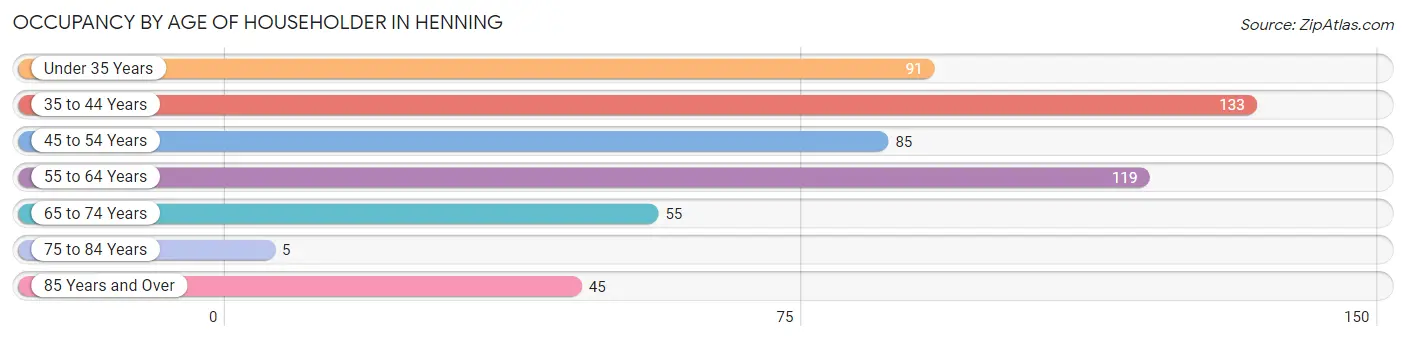
| Age Bracket | # Households | % Households |
| Under 35 Years | 91 | 17.1% |
| 35 to 44 Years | 133 | 24.9% |
| 45 to 54 Years | 85 | 16.0% |
| 55 to 64 Years | 119 | 22.3% |
| 65 to 74 Years | 55 | 10.3% |
| 75 to 84 Years | 5 | 0.9% |
| 85 Years and Over | 45 | 8.4% |
| Total | 533 | 100.0% |
Housing Finances in Henning
Median Income by Occupancy in Henning
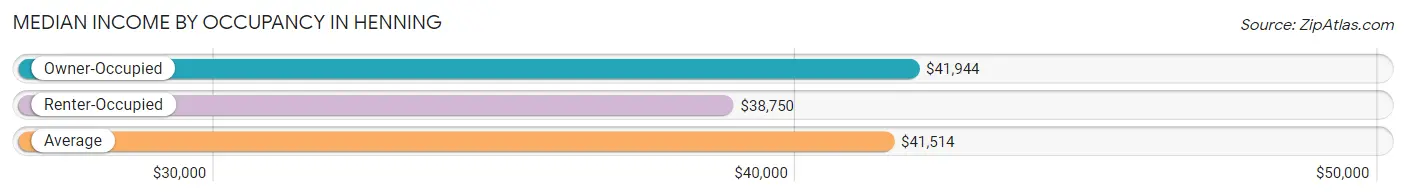
| Occupancy Type | # Households | Median Income |
| Owner-Occupied | 328 (61.5%) | $41,944 |
| Renter-Occupied | 205 (38.5%) | $38,750 |
| Average | 533 (100.0%) | $41,514 |
Occupancy by Householder Income Bracket in Henning
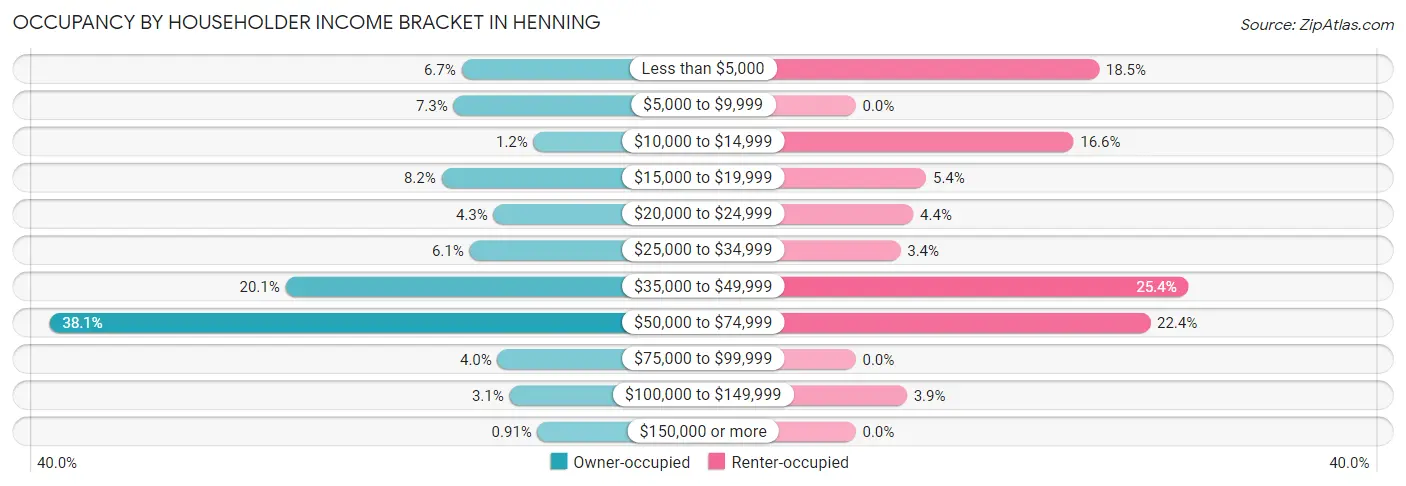
| Income Bracket | Owner-occupied | Renter-occupied |
| Less than $5,000 | 22 (6.7%) | 38 (18.5%) |
| $5,000 to $9,999 | 24 (7.3%) | 0 (0.0%) |
| $10,000 to $14,999 | 4 (1.2%) | 34 (16.6%) |
| $15,000 to $19,999 | 27 (8.2%) | 11 (5.4%) |
| $20,000 to $24,999 | 14 (4.3%) | 9 (4.4%) |
| $25,000 to $34,999 | 20 (6.1%) | 7 (3.4%) |
| $35,000 to $49,999 | 66 (20.1%) | 52 (25.4%) |
| $50,000 to $74,999 | 125 (38.1%) | 46 (22.4%) |
| $75,000 to $99,999 | 13 (4.0%) | 0 (0.0%) |
| $100,000 to $149,999 | 10 (3.0%) | 8 (3.9%) |
| $150,000 or more | 3 (0.9%) | 0 (0.0%) |
| Total | 328 (100.0%) | 205 (100.0%) |
Monthly Housing Cost Tiers in Henning
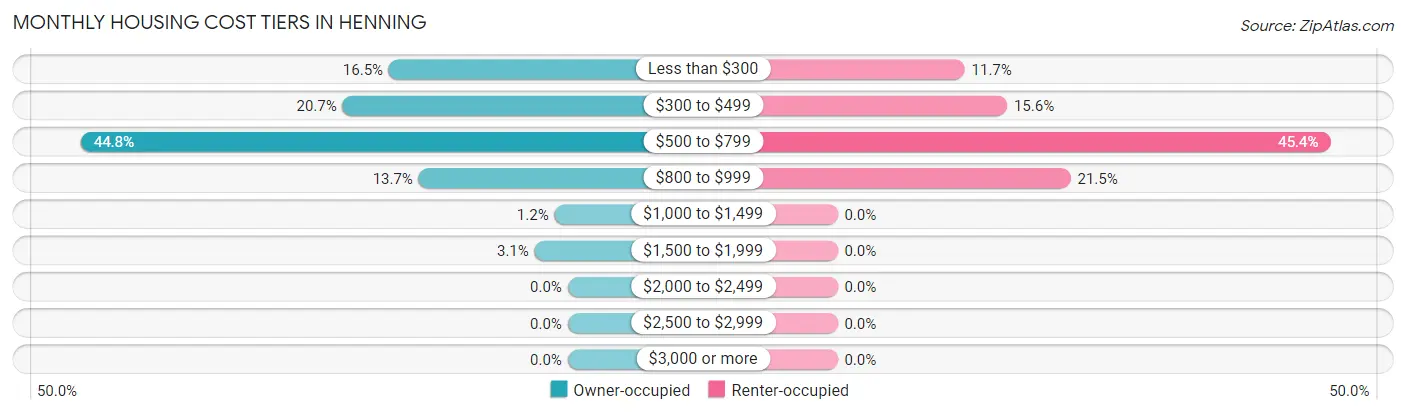
| Monthly Cost | Owner-occupied | Renter-occupied |
| Less than $300 | 54 (16.5%) | 24 (11.7%) |
| $300 to $499 | 68 (20.7%) | 32 (15.6%) |
| $500 to $799 | 147 (44.8%) | 93 (45.4%) |
| $800 to $999 | 45 (13.7%) | 44 (21.5%) |
| $1,000 to $1,499 | 4 (1.2%) | 0 (0.0%) |
| $1,500 to $1,999 | 10 (3.0%) | 0 (0.0%) |
| $2,000 to $2,499 | 0 (0.0%) | 0 (0.0%) |
| $2,500 to $2,999 | 0 (0.0%) | 0 (0.0%) |
| $3,000 or more | 0 (0.0%) | 0 (0.0%) |
| Total | 328 (100.0%) | 205 (100.0%) |
Physical Housing Characteristics in Henning
Housing Structures in Henning
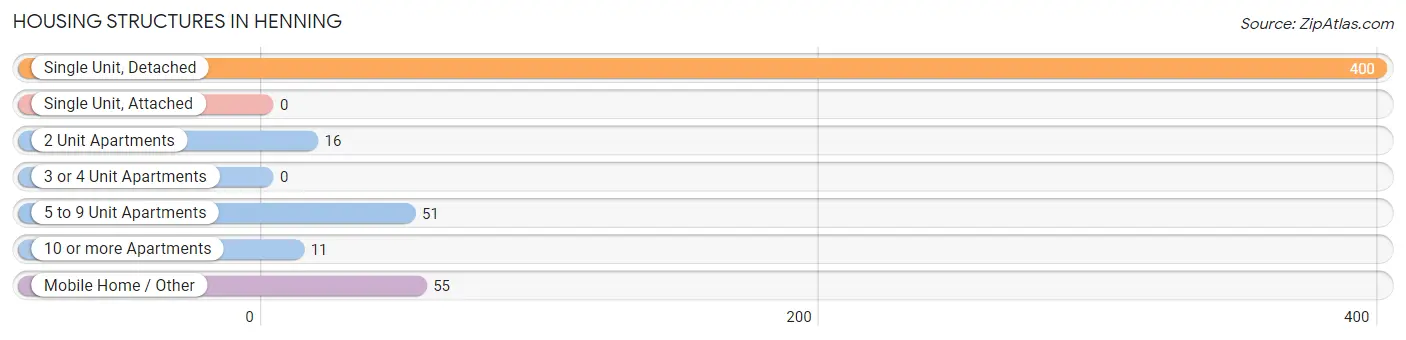
| Structure Type | # Housing Units | % Housing Units |
| Single Unit, Detached | 400 | 75.0% |
| Single Unit, Attached | 0 | 0.0% |
| 2 Unit Apartments | 16 | 3.0% |
| 3 or 4 Unit Apartments | 0 | 0.0% |
| 5 to 9 Unit Apartments | 51 | 9.6% |
| 10 or more Apartments | 11 | 2.1% |
| Mobile Home / Other | 55 | 10.3% |
| Total | 533 | 100.0% |
Housing Structures by Occupancy in Henning
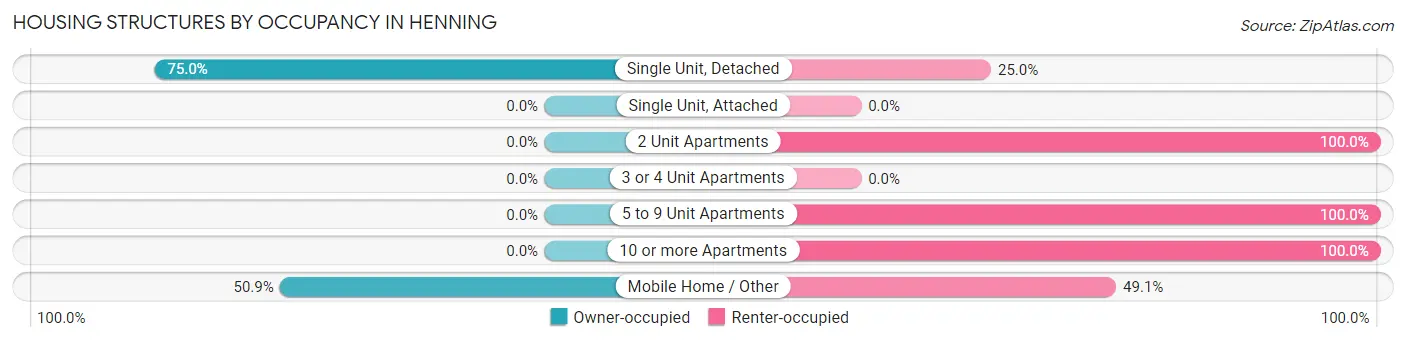
| Structure Type | Owner-occupied | Renter-occupied |
| Single Unit, Detached | 300 (75.0%) | 100 (25.0%) |
| Single Unit, Attached | 0 (0.0%) | 0 (0.0%) |
| 2 Unit Apartments | 0 (0.0%) | 16 (100.0%) |
| 3 or 4 Unit Apartments | 0 (0.0%) | 0 (0.0%) |
| 5 to 9 Unit Apartments | 0 (0.0%) | 51 (100.0%) |
| 10 or more Apartments | 0 (0.0%) | 11 (100.0%) |
| Mobile Home / Other | 28 (50.9%) | 27 (49.1%) |
| Total | 328 (61.5%) | 205 (38.5%) |
Housing Structures by Number of Rooms in Henning
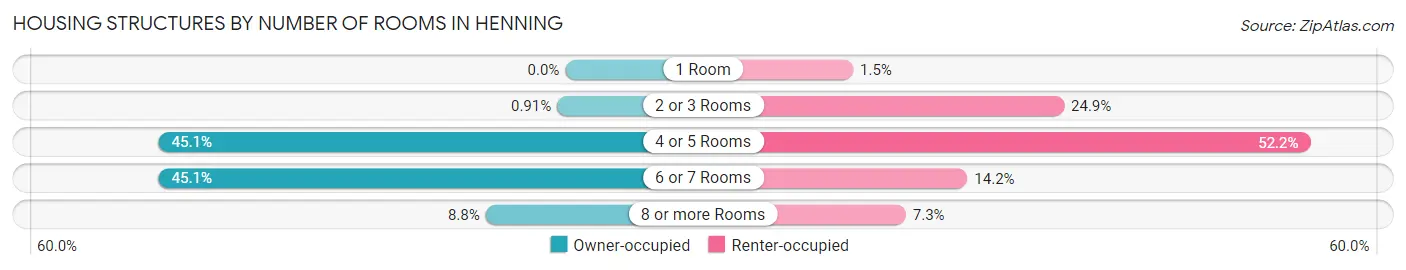
| Number of Rooms | Owner-occupied | Renter-occupied |
| 1 Room | 0 (0.0%) | 3 (1.5%) |
| 2 or 3 Rooms | 3 (0.9%) | 51 (24.9%) |
| 4 or 5 Rooms | 148 (45.1%) | 107 (52.2%) |
| 6 or 7 Rooms | 148 (45.1%) | 29 (14.1%) |
| 8 or more Rooms | 29 (8.8%) | 15 (7.3%) |
| Total | 328 (100.0%) | 205 (100.0%) |
Housing Structure by Heating Type in Henning
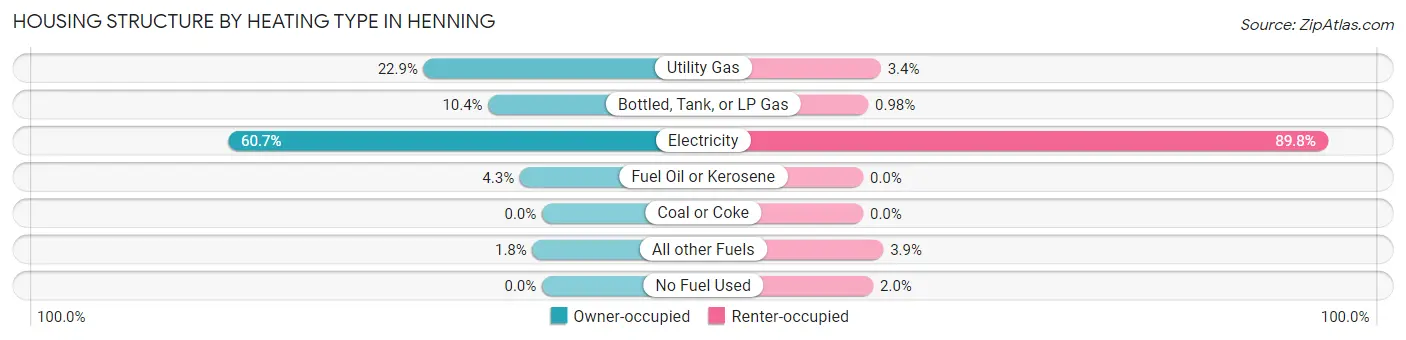
| Heating Type | Owner-occupied | Renter-occupied |
| Utility Gas | 75 (22.9%) | 7 (3.4%) |
| Bottled, Tank, or LP Gas | 34 (10.4%) | 2 (1.0%) |
| Electricity | 199 (60.7%) | 184 (89.8%) |
| Fuel Oil or Kerosene | 14 (4.3%) | 0 (0.0%) |
| Coal or Coke | 0 (0.0%) | 0 (0.0%) |
| All other Fuels | 6 (1.8%) | 8 (3.9%) |
| No Fuel Used | 0 (0.0%) | 4 (1.9%) |
| Total | 328 (100.0%) | 205 (100.0%) |
Household Vehicle Usage in Henning
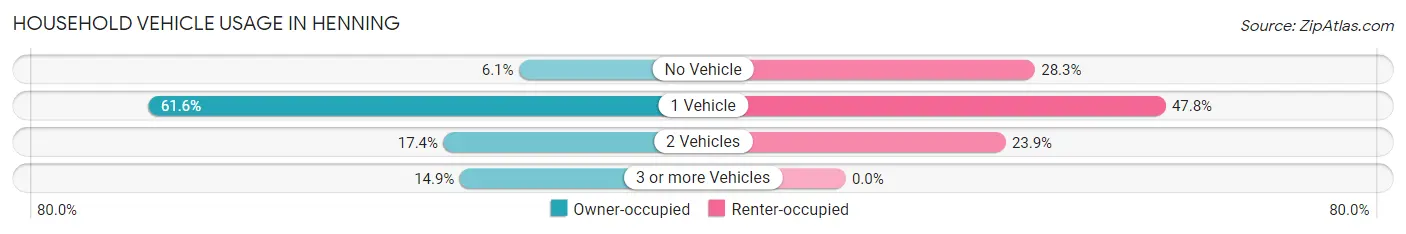
| Vehicles per Household | Owner-occupied | Renter-occupied |
| No Vehicle | 20 (6.1%) | 58 (28.3%) |
| 1 Vehicle | 202 (61.6%) | 98 (47.8%) |
| 2 Vehicles | 57 (17.4%) | 49 (23.9%) |
| 3 or more Vehicles | 49 (14.9%) | 0 (0.0%) |
| Total | 328 (100.0%) | 205 (100.0%) |
Real Estate & Mortgages in Henning
Real Estate and Mortgage Overview in Henning
| Characteristic | Without Mortgage | With Mortgage |
| Housing Units | 234 | 94 |
| Median Property Value | $67,700 | $75,000 |
| Median Household Income | $41,908 | $3 |
| Monthly Housing Costs | $503 | $0 |
| Real Estate Taxes | $857 | $0 |
Property Value by Mortgage Status in Henning
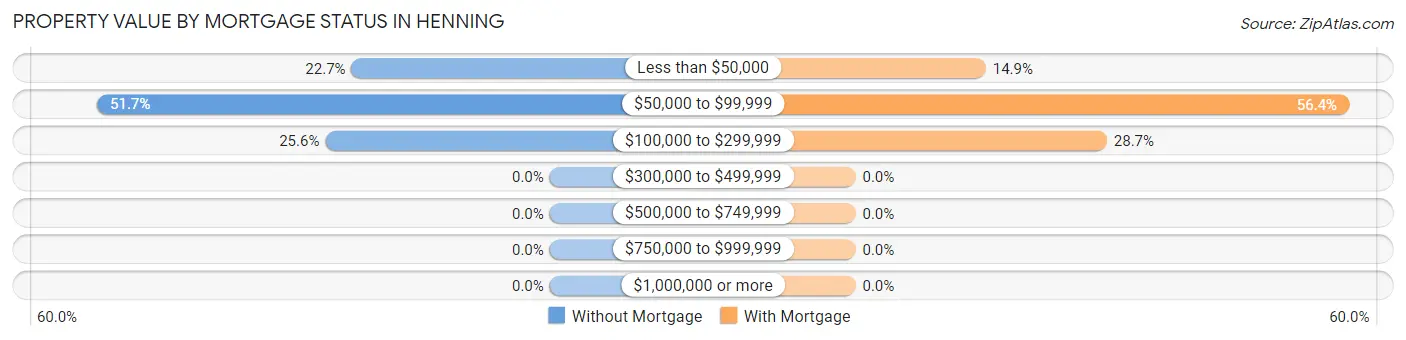
| Property Value | Without Mortgage | With Mortgage |
| Less than $50,000 | 53 (22.7%) | 14 (14.9%) |
| $50,000 to $99,999 | 121 (51.7%) | 53 (56.4%) |
| $100,000 to $299,999 | 60 (25.6%) | 27 (28.7%) |
| $300,000 to $499,999 | 0 (0.0%) | 0 (0.0%) |
| $500,000 to $749,999 | 0 (0.0%) | 0 (0.0%) |
| $750,000 to $999,999 | 0 (0.0%) | 0 (0.0%) |
| $1,000,000 or more | 0 (0.0%) | 0 (0.0%) |
| Total | 234 (100.0%) | 94 (100.0%) |
Household Income by Mortgage Status in Henning
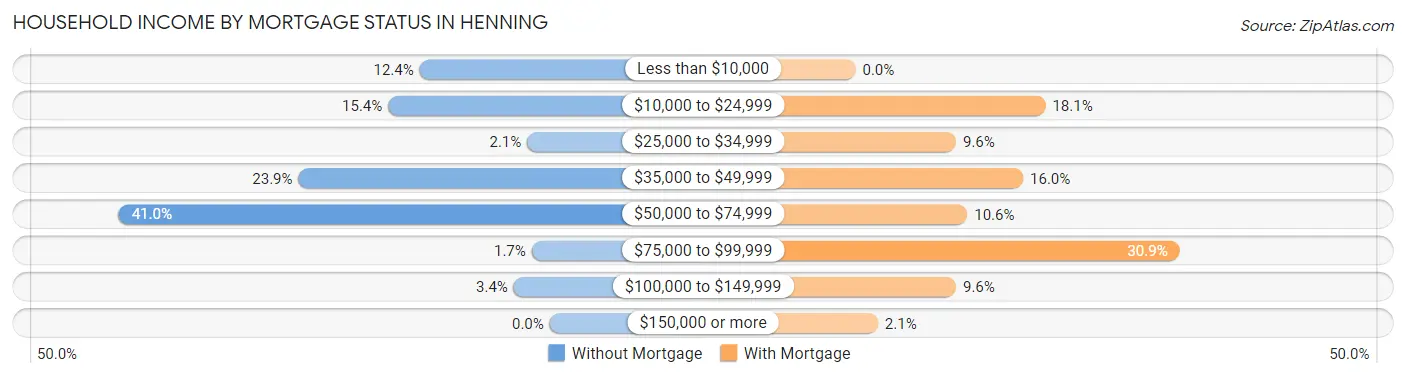
| Household Income | Without Mortgage | With Mortgage |
| Less than $10,000 | 29 (12.4%) | 0 (0.0%) |
| $10,000 to $24,999 | 36 (15.4%) | 17 (18.1%) |
| $25,000 to $34,999 | 5 (2.1%) | 9 (9.6%) |
| $35,000 to $49,999 | 56 (23.9%) | 15 (16.0%) |
| $50,000 to $74,999 | 96 (41.0%) | 10 (10.6%) |
| $75,000 to $99,999 | 4 (1.7%) | 29 (30.8%) |
| $100,000 to $149,999 | 8 (3.4%) | 9 (9.6%) |
| $150,000 or more | 0 (0.0%) | 2 (2.1%) |
| Total | 234 (100.0%) | 94 (100.0%) |
Property Value to Household Income Ratio in Henning
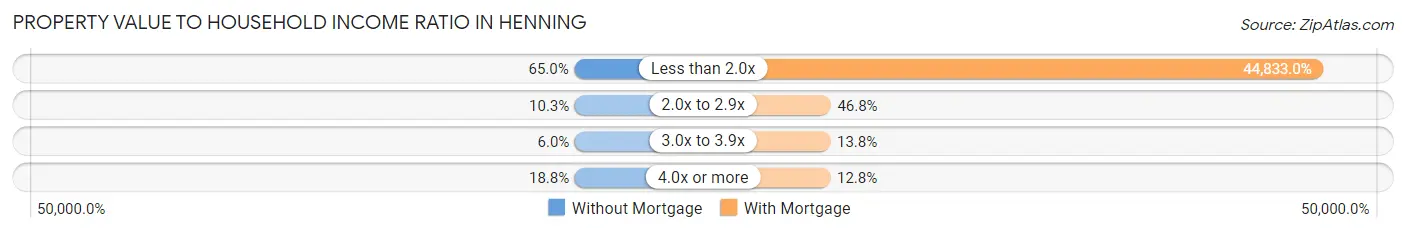
| Value-to-Income Ratio | Without Mortgage | With Mortgage |
| Less than 2.0x | 152 (65.0%) | 42,143 (44,833.0%) |
| 2.0x to 2.9x | 24 (10.3%) | 44 (46.8%) |
| 3.0x to 3.9x | 14 (6.0%) | 13 (13.8%) |
| 4.0x or more | 44 (18.8%) | 12 (12.8%) |
| Total | 234 (100.0%) | 94 (100.0%) |
Real Estate Taxes by Mortgage Status in Henning
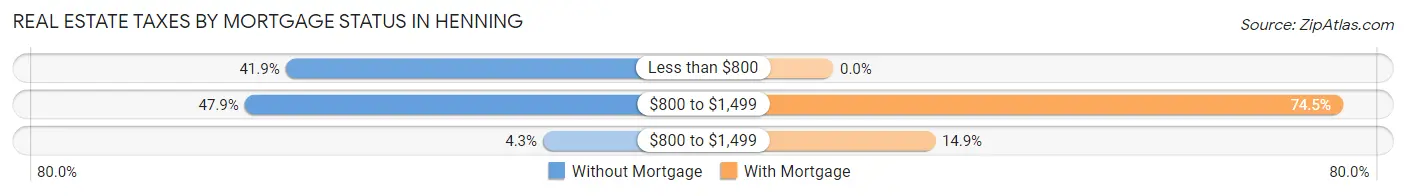
| Property Taxes | Without Mortgage | With Mortgage |
| Less than $800 | 98 (41.9%) | 0 (0.0%) |
| $800 to $1,499 | 112 (47.9%) | 70 (74.5%) |
| $800 to $1,499 | 10 (4.3%) | 14 (14.9%) |
| Total | 234 (100.0%) | 94 (100.0%) |
Health & Disability in Henning
Health Insurance Coverage by Age in Henning
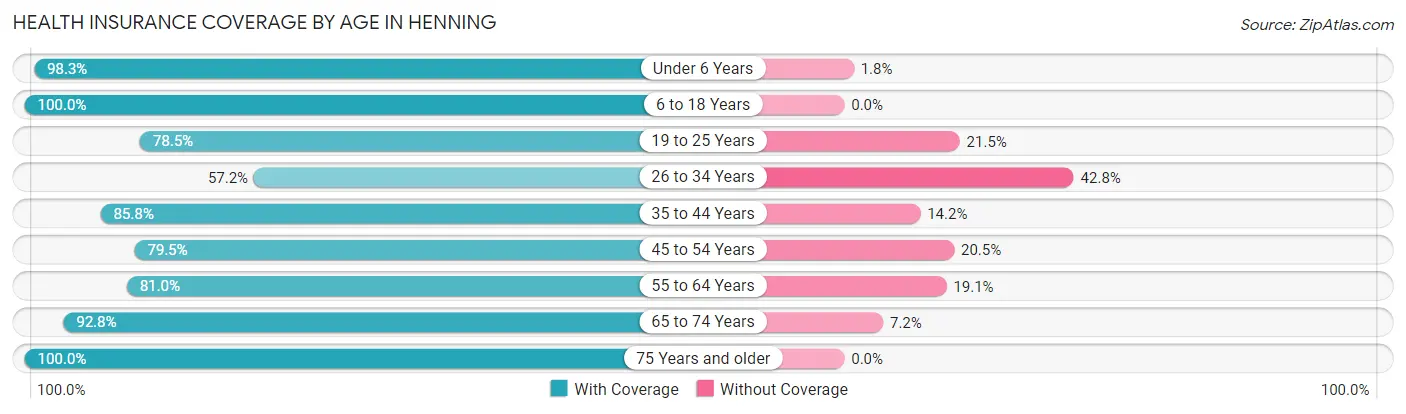
| Age Bracket | With Coverage | Without Coverage |
| Under 6 Years | 112 (98.3%) | 2 (1.8%) |
| 6 to 18 Years | 243 (100.0%) | 0 (0.0%) |
| 19 to 25 Years | 73 (78.5%) | 20 (21.5%) |
| 26 to 34 Years | 91 (57.2%) | 68 (42.8%) |
| 35 to 44 Years | 194 (85.8%) | 32 (14.2%) |
| 45 to 54 Years | 101 (79.5%) | 26 (20.5%) |
| 55 to 64 Years | 136 (80.9%) | 32 (19.1%) |
| 65 to 74 Years | 90 (92.8%) | 7 (7.2%) |
| 75 Years and older | 93 (100.0%) | 0 (0.0%) |
| Total | 1,133 (85.8%) | 187 (14.2%) |
Health Insurance Coverage by Citizenship Status in Henning
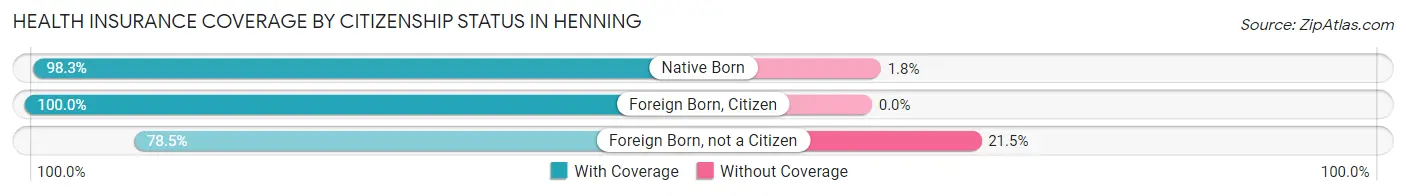
| Citizenship Status | With Coverage | Without Coverage |
| Native Born | 112 (98.3%) | 2 (1.8%) |
| Foreign Born, Citizen | 243 (100.0%) | 0 (0.0%) |
| Foreign Born, not a Citizen | 73 (78.5%) | 20 (21.5%) |
Health Insurance Coverage by Household Income in Henning
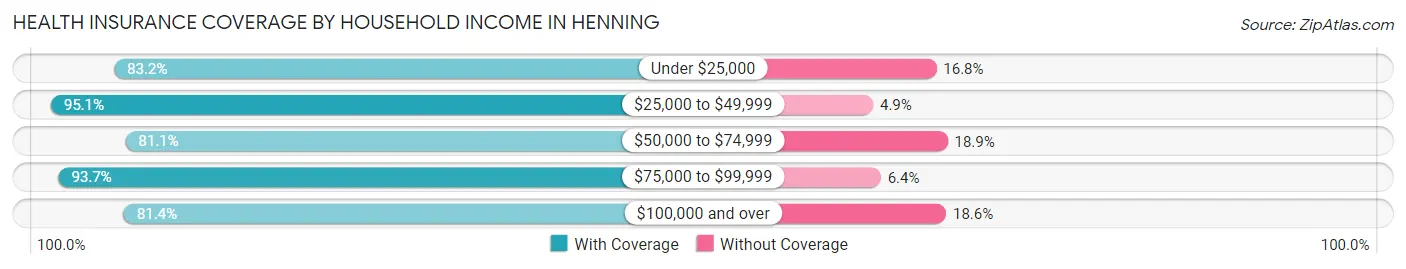
| Household Income | With Coverage | Without Coverage |
| Under $25,000 | 352 (83.2%) | 71 (16.8%) |
| $25,000 to $49,999 | 309 (95.1%) | 16 (4.9%) |
| $50,000 to $74,999 | 378 (81.1%) | 88 (18.9%) |
| $75,000 to $99,999 | 59 (93.6%) | 4 (6.4%) |
| $100,000 and over | 35 (81.4%) | 8 (18.6%) |
Public vs Private Health Insurance Coverage by Age in Henning
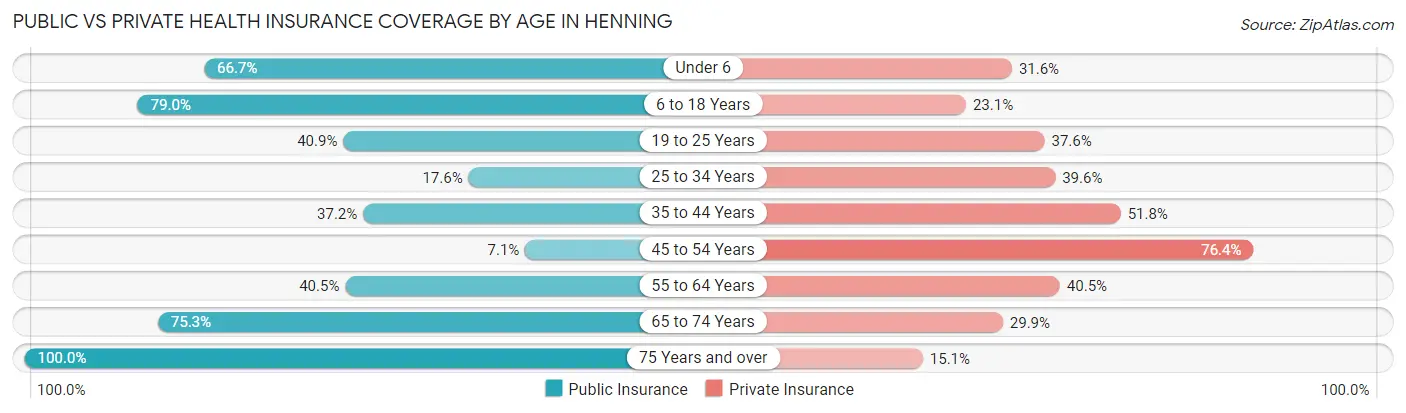
| Age Bracket | Public Insurance | Private Insurance |
| Under 6 | 76 (66.7%) | 36 (31.6%) |
| 6 to 18 Years | 192 (79.0%) | 56 (23.1%) |
| 19 to 25 Years | 38 (40.9%) | 35 (37.6%) |
| 25 to 34 Years | 28 (17.6%) | 63 (39.6%) |
| 35 to 44 Years | 84 (37.2%) | 117 (51.8%) |
| 45 to 54 Years | 9 (7.1%) | 97 (76.4%) |
| 55 to 64 Years | 68 (40.5%) | 68 (40.5%) |
| 65 to 74 Years | 73 (75.3%) | 29 (29.9%) |
| 75 Years and over | 93 (100.0%) | 14 (15.0%) |
| Total | 661 (50.1%) | 515 (39.0%) |
Disability Status by Sex by Age in Henning
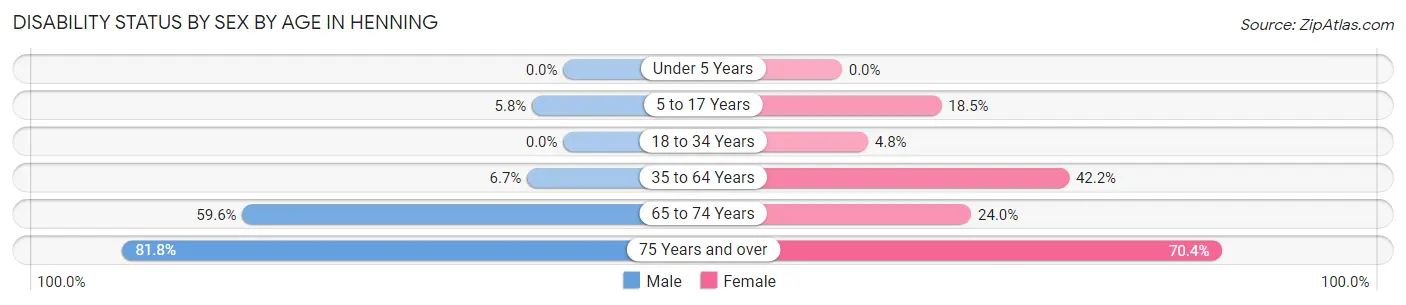
| Age Bracket | Male | Female |
| Under 5 Years | 0 (0.0%) | 0 (0.0%) |
| 5 to 17 Years | 7 (5.8%) | 27 (18.5%) |
| 18 to 34 Years | 0 (0.0%) | 7 (4.8%) |
| 35 to 64 Years | 17 (6.7%) | 113 (42.2%) |
| 65 to 74 Years | 28 (59.6%) | 12 (24.0%) |
| 75 Years and over | 18 (81.8%) | 50 (70.4%) |
Disability Class by Sex by Age in Henning
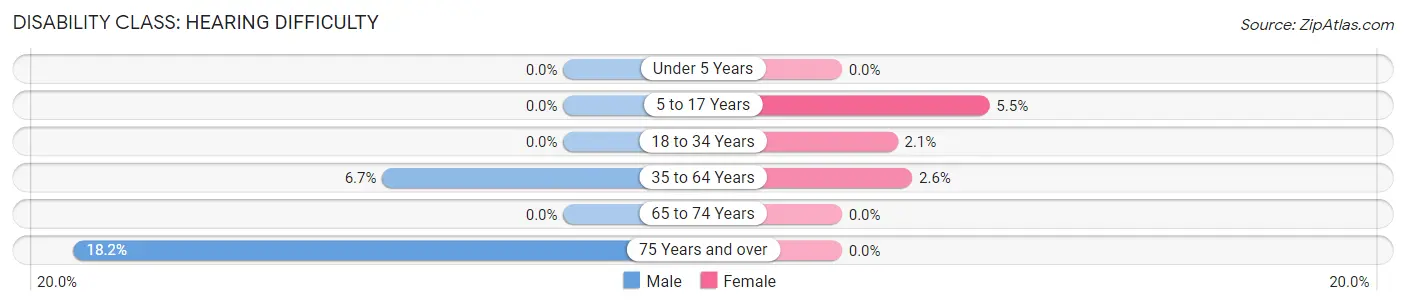
Disability Class: Hearing Difficulty
| Age Bracket | Male | Female |
| Under 5 Years | 0 (0.0%) | 0 (0.0%) |
| 5 to 17 Years | 0 (0.0%) | 8 (5.5%) |
| 18 to 34 Years | 0 (0.0%) | 3 (2.1%) |
| 35 to 64 Years | 17 (6.7%) | 7 (2.6%) |
| 65 to 74 Years | 0 (0.0%) | 0 (0.0%) |
| 75 Years and over | 4 (18.2%) | 0 (0.0%) |
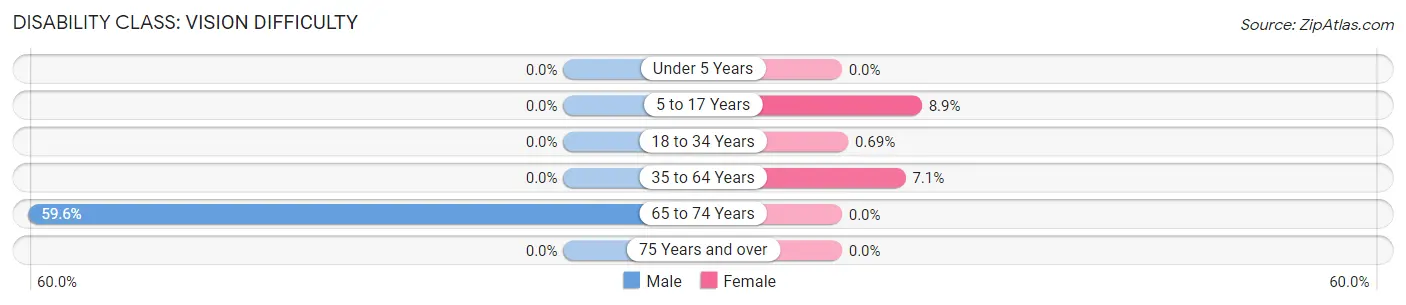
Disability Class: Vision Difficulty
| Age Bracket | Male | Female |
| Under 5 Years | 0 (0.0%) | 0 (0.0%) |
| 5 to 17 Years | 0 (0.0%) | 13 (8.9%) |
| 18 to 34 Years | 0 (0.0%) | 1 (0.7%) |
| 35 to 64 Years | 0 (0.0%) | 19 (7.1%) |
| 65 to 74 Years | 28 (59.6%) | 0 (0.0%) |
| 75 Years and over | 0 (0.0%) | 0 (0.0%) |
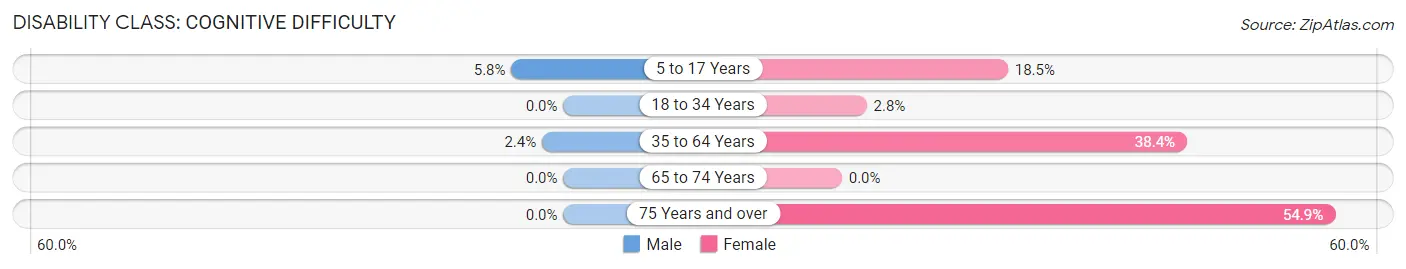
Disability Class: Cognitive Difficulty
| Age Bracket | Male | Female |
| 5 to 17 Years | 7 (5.8%) | 27 (18.5%) |
| 18 to 34 Years | 0 (0.0%) | 4 (2.8%) |
| 35 to 64 Years | 6 (2.4%) | 103 (38.4%) |
| 65 to 74 Years | 0 (0.0%) | 0 (0.0%) |
| 75 Years and over | 0 (0.0%) | 39 (54.9%) |
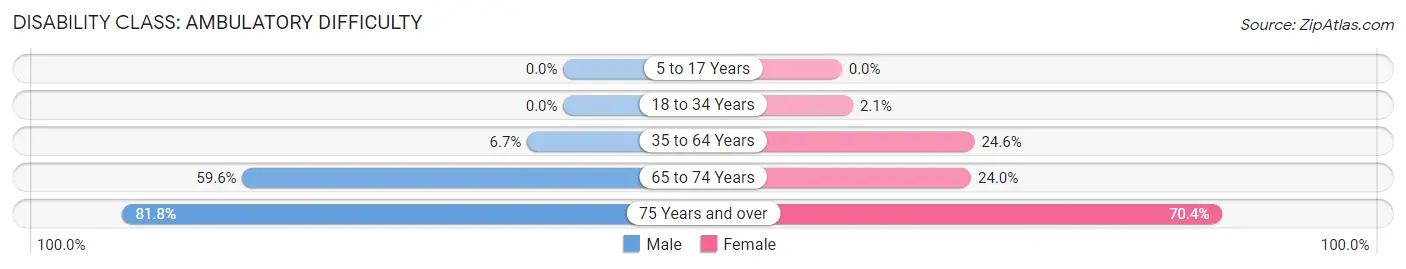
Disability Class: Ambulatory Difficulty
| Age Bracket | Male | Female |
| 5 to 17 Years | 0 (0.0%) | 0 (0.0%) |
| 18 to 34 Years | 0 (0.0%) | 3 (2.1%) |
| 35 to 64 Years | 17 (6.7%) | 66 (24.6%) |
| 65 to 74 Years | 28 (59.6%) | 12 (24.0%) |
| 75 Years and over | 18 (81.8%) | 50 (70.4%) |
Disability Class: Self-Care Difficulty
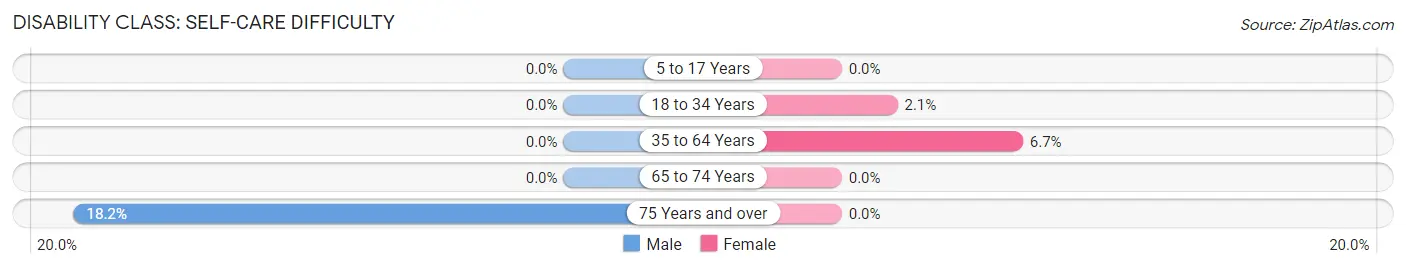
| Age Bracket | Male | Female |
| 5 to 17 Years | 0 (0.0%) | 0 (0.0%) |
| 18 to 34 Years | 0 (0.0%) | 3 (2.1%) |
| 35 to 64 Years | 0 (0.0%) | 18 (6.7%) |
| 65 to 74 Years | 0 (0.0%) | 0 (0.0%) |
| 75 Years and over | 4 (18.2%) | 0 (0.0%) |
Technology Access in Henning
Computing Device Access in Henning
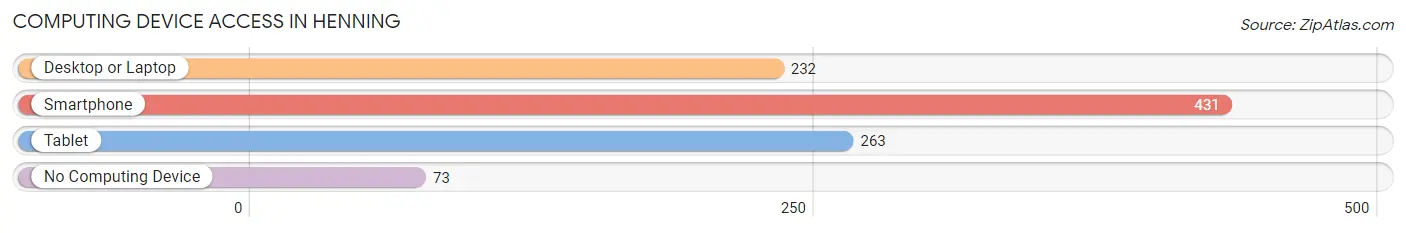
| Device Type | # Households | % Households |
| Desktop or Laptop | 232 | 43.5% |
| Smartphone | 431 | 80.9% |
| Tablet | 263 | 49.3% |
| No Computing Device | 73 | 13.7% |
| Total | 533 | 100.0% |
Internet Access in Henning
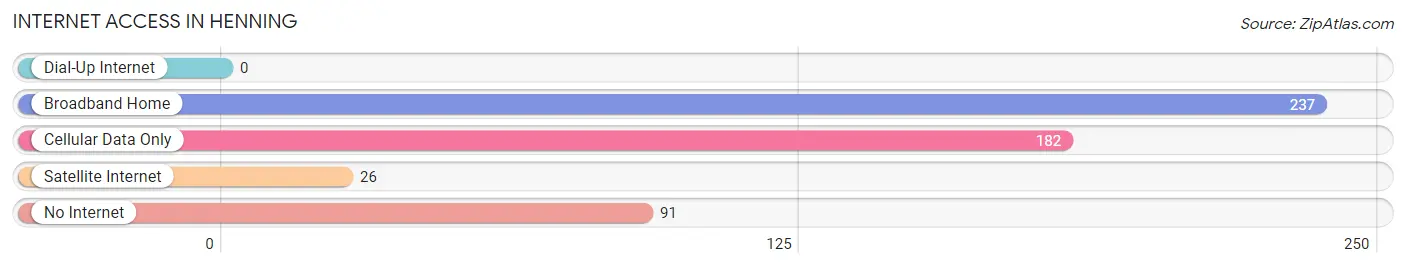
| Internet Type | # Households | % Households |
| Dial-Up Internet | 0 | 0.0% |
| Broadband Home | 237 | 44.5% |
| Cellular Data Only | 182 | 34.2% |
| Satellite Internet | 26 | 4.9% |
| No Internet | 91 | 17.1% |
| Total | 533 | 100.0% |
Henning Summary
Henning is a small town located in Lauderdale County, Tennessee. It is situated on the banks of the Hatchie River, approximately 25 miles northeast of Memphis. The town was founded in 1882 and named after a local landowner, William Henning. The population of Henning was 1,845 at the 2010 census.
History
The area around Henning was first settled in the early 1800s by settlers from North Carolina and Virginia. The town was founded in 1882 and named after William Henning, a local landowner. The town was incorporated in 1887 and the first post office was established in 1888.
The town grew slowly but steadily over the years, and by the early 1900s, it had become a thriving agricultural center. The town was home to several cotton gins, a sawmill, a gristmill, and a number of other businesses.
In the early 1900s, the town was also home to a number of African-American businesses, including a barbershop, a restaurant, and a hotel. The town was also home to a number of churches, including the First Baptist Church, which was founded in 1887.
In the late 1940s, the town was home to a number of manufacturing plants, including a cotton mill, a furniture factory, and a canning factory. The town also had a number of stores, including a grocery store, a hardware store, and a drug store.
Geography
Henning is located in Lauderdale County, Tennessee, approximately 25 miles northeast of Memphis. The town is situated on the banks of the Hatchie River. The town is located in the western part of the county, and is bordered by the towns of Halls, Ripley, and Gates.
The town has a total area of 1.7 square miles, all of which is land. The town is located in a flat, low-lying area, and is surrounded by farmland. The town is located in the Memphis metropolitan area.
Economy
Henning is a small, rural town, and the economy is largely based on agriculture. The town is home to a number of farms, and the surrounding area is home to a number of large farms. The town is also home to a number of small businesses, including a grocery store, a hardware store, and a drug store.
The town is also home to a number of manufacturing plants, including a cotton mill, a furniture factory, and a canning factory. The town is also home to a number of churches, including the First Baptist Church, which was founded in 1887.
Demographics
As of the 2010 census, the population of Henning was 1,845. The racial makeup of the town was 79.3% White, 18.2% African American, 0.3% Native American, 0.2% Asian, 0.1% Pacific Islander, 0.7% from other races, and 1.4% from two or more races. Hispanic or Latino of any race were 1.7% of the population.
The median income for a household in the town was $30,938, and the median income for a family was $37,500. The per capita income for the town was $15,945. About 17.2% of families and 20.2% of the population were below the poverty line, including 28.3% of those under age 18 and 15.2% of those age 65 or over.
Common Questions
What is Per Capita Income in Henning?
Per Capita income in Henning is $18,446.
What is the Median Family Income in Henning?
Median Family Income in Henning is $38,650.
What is the Median Household income in Henning?
Median Household Income in Henning is $41,514.
What is Income or Wage Gap in Henning?
Income or Wage Gap in Henning is 12.5%.
Women in Henning earn 87.5 cents for every dollar earned by a man.
What is Family Income Deficit in Henning?
Family Income Deficit in Henning is $13,669.
Families that are below poverty line in Henning earn $13,669 less on average than the poverty threshold level.
What is Inequality or Gini Index in Henning?
Inequality or Gini Index in Henning is 0.41.
What is the Total Population of Henning?
Total Population of Henning is 1,320.
What is the Total Male Population of Henning?
Total Male Population of Henning is 596.
What is the Total Female Population of Henning?
Total Female Population of Henning is 724.
What is the Ratio of Males per 100 Females in Henning?
There are 82.32 Males per 100 Females in Henning.
What is the Ratio of Females per 100 Males in Henning?
There are 121.48 Females per 100 Males in Henning.
What is the Median Population Age in Henning?
Median Population Age in Henning is 36.6 Years.
What is the Average Family Size in Henning
Average Family Size in Henning is 3.4 People.
What is the Average Household Size in Henning
Average Household Size in Henning is 2.5 People.
How Large is the Labor Force in Henning?
There are 556 People in the Labor Forcein in Henning.
What is the Percentage of People in the Labor Force in Henning?
56.4% of People are in the Labor Force in Henning.
What is the Unemployment Rate in Henning?
Unemployment Rate in Henning is 22.3%.