Halls, TN Map & Demographics
Halls Map
Halls Overview
$25,850
PER CAPITA INCOME
$44,954
AVG FAMILY INCOME
$40,375
AVG HOUSEHOLD INCOME
21.6%
WAGE / INCOME GAP [ % ]
78.4¢/ $1
WAGE / INCOME GAP [ $ ]
0.42
INEQUALITY / GINI INDEX
1,919
TOTAL POPULATION
847
MALE POPULATION
1,072
FEMALE POPULATION
79.01
MALES / 100 FEMALES
126.56
FEMALES / 100 MALES
36.8
MEDIAN AGE
2.6
AVG FAMILY SIZE
2.1
AVG HOUSEHOLD SIZE
796
LABOR FORCE [ PEOPLE ]
53.4%
PERCENT IN LABOR FORCE
2.3%
UNEMPLOYMENT RATE
Halls Zip Codes
Halls Area Codes
Income in Halls
Income Overview in Halls
Per Capita Income in Halls is $25,850, while median incomes of families and households are $44,954 and $40,375 respectively.
| Characteristic | Number | Measure |
| Per Capita Income | 1,919 | $25,850 |
| Median Family Income | 557 | $44,954 |
| Mean Family Income | 557 | $59,513 |
| Median Household Income | 891 | $40,375 |
| Mean Household Income | 891 | $52,720 |
| Income Deficit | 557 | $0 |
| Wage / Income Gap (%) | 1,919 | 21.57% |
| Wage / Income Gap ($) | 1,919 | 78.43¢ per $1 |
| Gini / Inequality Index | 1,919 | 0.42 |
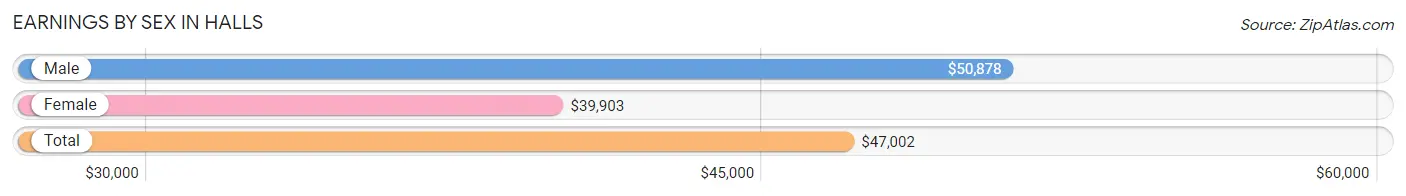
Earnings by Sex in Halls
Average Earnings in Halls are $47,002, $50,878 for men and $39,903 for women, a difference of 21.6%.
| Sex | Number | Average Earnings |
| Male | 451 (53.6%) | $50,878 |
| Female | 391 (46.4%) | $39,903 |
| Total | 842 (100.0%) | $47,002 |
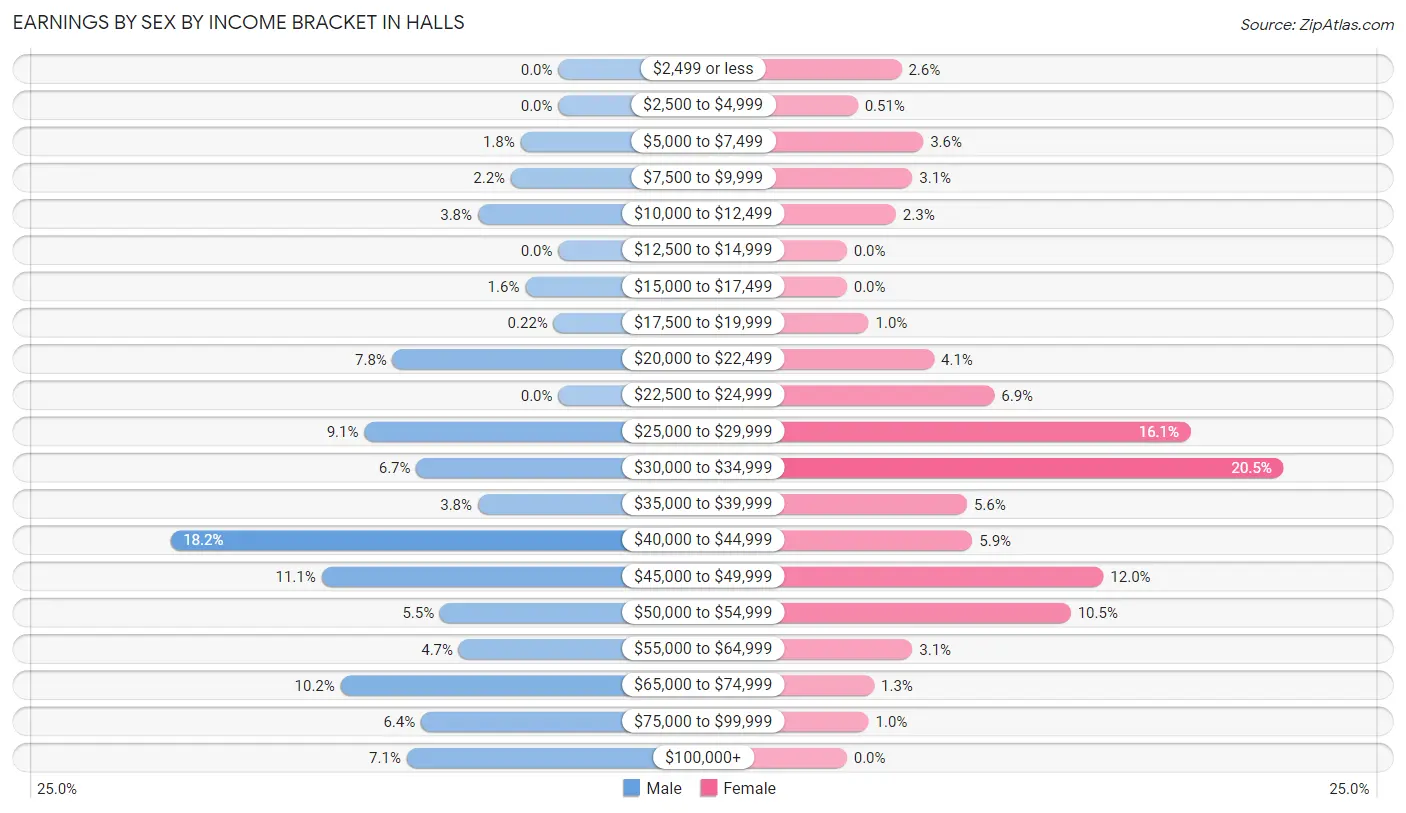
Earnings by Sex by Income Bracket in Halls
The most common earnings brackets in Halls are $40,000 to $44,999 for men (82 | 18.2%) and $30,000 to $34,999 for women (80 | 20.5%).
| Income | Male | Female |
| $2,499 or less | 0 (0.0%) | 10 (2.6%) |
| $2,500 to $4,999 | 0 (0.0%) | 2 (0.5%) |
| $5,000 to $7,499 | 8 (1.8%) | 14 (3.6%) |
| $7,500 to $9,999 | 10 (2.2%) | 12 (3.1%) |
| $10,000 to $12,499 | 17 (3.8%) | 9 (2.3%) |
| $12,500 to $14,999 | 0 (0.0%) | 0 (0.0%) |
| $15,000 to $17,499 | 7 (1.5%) | 0 (0.0%) |
| $17,500 to $19,999 | 1 (0.2%) | 4 (1.0%) |
| $20,000 to $22,499 | 35 (7.8%) | 16 (4.1%) |
| $22,500 to $24,999 | 0 (0.0%) | 27 (6.9%) |
| $25,000 to $29,999 | 41 (9.1%) | 63 (16.1%) |
| $30,000 to $34,999 | 30 (6.7%) | 80 (20.5%) |
| $35,000 to $39,999 | 17 (3.8%) | 22 (5.6%) |
| $40,000 to $44,999 | 82 (18.2%) | 23 (5.9%) |
| $45,000 to $49,999 | 50 (11.1%) | 47 (12.0%) |
| $50,000 to $54,999 | 25 (5.5%) | 41 (10.5%) |
| $55,000 to $64,999 | 21 (4.7%) | 12 (3.1%) |
| $65,000 to $74,999 | 46 (10.2%) | 5 (1.3%) |
| $75,000 to $99,999 | 29 (6.4%) | 4 (1.0%) |
| $100,000+ | 32 (7.1%) | 0 (0.0%) |
| Total | 451 (100.0%) | 391 (100.0%) |
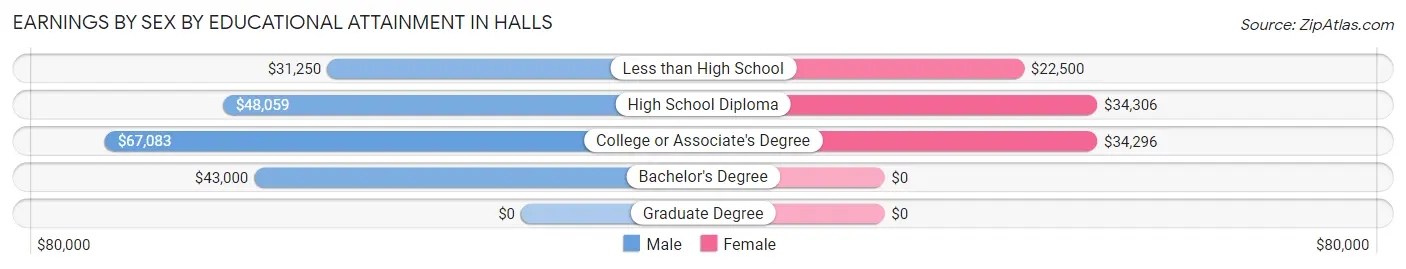
Earnings by Sex by Educational Attainment in Halls
Average earnings in Halls are $46,354 for men and $33,922 for women, a difference of 26.8%. Men with an educational attainment of college or associate's degree enjoy the highest average annual earnings of $67,083, while those with less than high school education earn the least with $31,250. Women with an educational attainment of high school diploma earn the most with the average annual earnings of $34,306, while those with less than high school education have the smallest earnings of $22,500.
| Educational Attainment | Male Income | Female Income |
| Less than High School | $31,250 | $22,500 |
| High School Diploma | $48,059 | $34,306 |
| College or Associate's Degree | $67,083 | $34,296 |
| Bachelor's Degree | $43,000 | $0 |
| Graduate Degree | - | - |
| Total | $46,354 | $33,922 |
Family Income in Halls
Family Income Brackets in Halls
According to the Halls family income data, there are 105 families falling into the $50,000 to $74,999 income range, which is the most common income bracket and makes up 18.9% of all families.
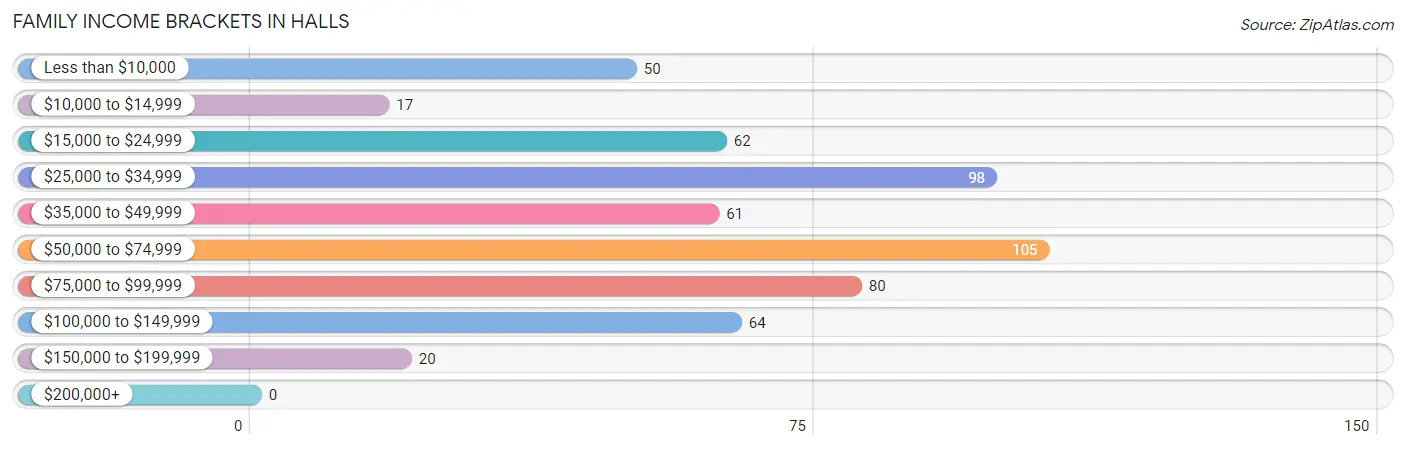
| Income Bracket | # Families | % Families |
| Less than $10,000 | 50 | 9.0% |
| $10,000 to $14,999 | 17 | 3.1% |
| $15,000 to $24,999 | 62 | 11.1% |
| $25,000 to $34,999 | 98 | 17.6% |
| $35,000 to $49,999 | 61 | 11.0% |
| $50,000 to $74,999 | 105 | 18.9% |
| $75,000 to $99,999 | 80 | 14.4% |
| $100,000 to $149,999 | 64 | 11.5% |
| $150,000 to $199,999 | 20 | 3.6% |
| $200,000+ | 0 | 0.0% |
Family Income by Famaliy Size in Halls
4-person families (50 | 9.0%) account for the highest median family income in Halls with $63,958 per family, while 2-person families (359 | 64.4%) have the highest median income of $27,312 per family member.
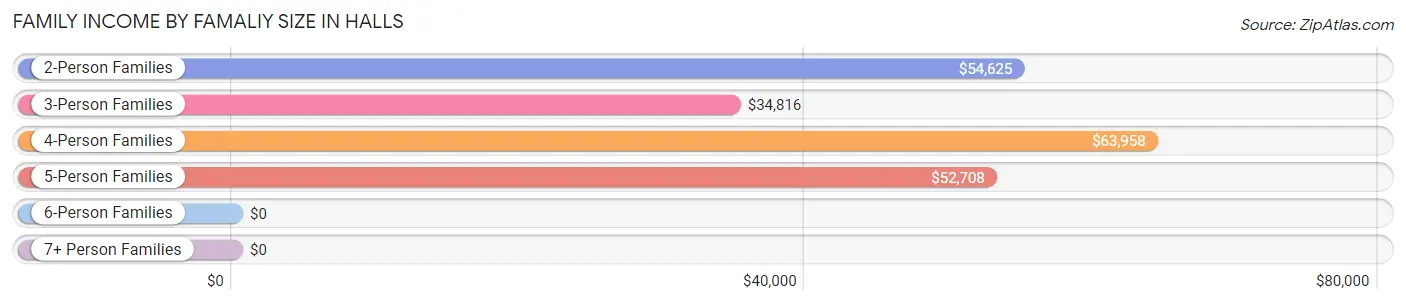
| Income Bracket | # Families | Median Income |
| 2-Person Families | 359 (64.4%) | $54,625 |
| 3-Person Families | 115 (20.6%) | $34,816 |
| 4-Person Families | 50 (9.0%) | $63,958 |
| 5-Person Families | 30 (5.4%) | $52,708 |
| 6-Person Families | 3 (0.5%) | $0 |
| 7+ Person Families | 0 (0.0%) | $0 |
| Total | 557 (100.0%) | $44,954 |
Family Income by Number of Earners in Halls
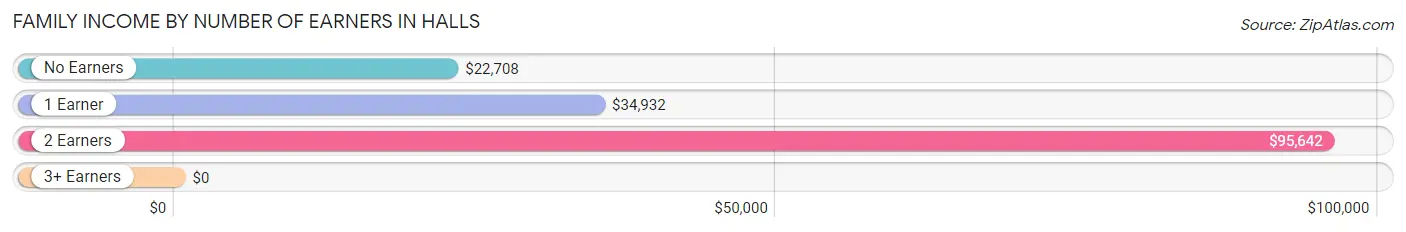
| Number of Earners | # Families | Median Income |
| No Earners | 143 (25.7%) | $22,708 |
| 1 Earner | 273 (49.0%) | $34,932 |
| 2 Earners | 137 (24.6%) | $95,642 |
| 3+ Earners | 4 (0.7%) | $0 |
| Total | 557 (100.0%) | $44,954 |
Household Income in Halls
Household Income Brackets in Halls
With 195 households falling in the category, the $25,000 to $34,999 income range is the most frequent in Halls, accounting for 21.9% of all households.
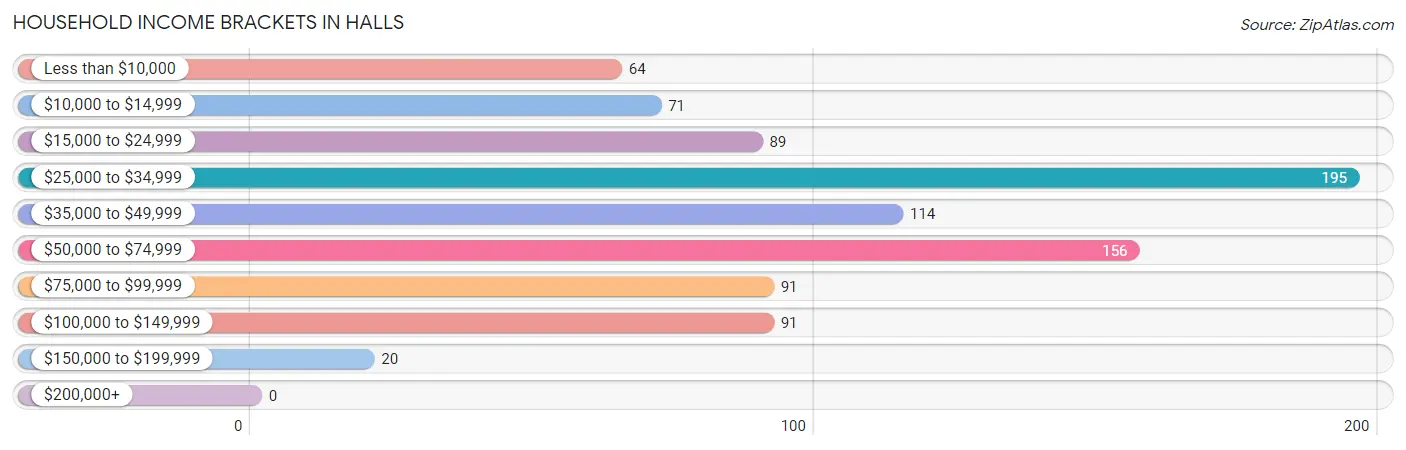
| Income Bracket | # Households | % Households |
| Less than $10,000 | 64 | 7.2% |
| $10,000 to $14,999 | 71 | 8.0% |
| $15,000 to $24,999 | 89 | 10.0% |
| $25,000 to $34,999 | 195 | 21.9% |
| $35,000 to $49,999 | 114 | 12.8% |
| $50,000 to $74,999 | 156 | 17.5% |
| $75,000 to $99,999 | 91 | 10.2% |
| $100,000 to $149,999 | 91 | 10.2% |
| $150,000 to $199,999 | 20 | 2.2% |
| $200,000+ | 0 | 0.0% |
Household Income by Householder Age in Halls
The median household income in Halls is $40,375, with the highest median household income of $46,328 found in the 45 to 64 years age bracket for the primary householder. A total of 240 households (26.9%) fall into this category. Meanwhile, the 15 to 24 years age bracket for the primary householder has the lowest median household income of $0, with 59 households (6.6%) in this group.
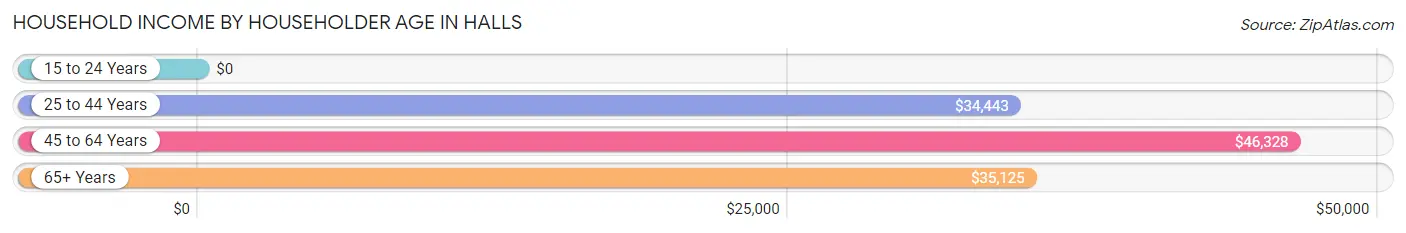
| Income Bracket | # Households | Median Income |
| 15 to 24 Years | 59 (6.6%) | $0 |
| 25 to 44 Years | 377 (42.3%) | $34,443 |
| 45 to 64 Years | 240 (26.9%) | $46,328 |
| 65+ Years | 215 (24.1%) | $35,125 |
| Total | 891 (100.0%) | $40,375 |
Poverty in Halls
Income Below Poverty by Sex and Age in Halls
With 14.1% poverty level for males and 16.0% for females among the residents of Halls, under 5 year old males and 45 to 54 year old females are the most vulnerable to poverty, with 25 males (59.5%) and 39 females (35.4%) in their respective age groups living below the poverty level.
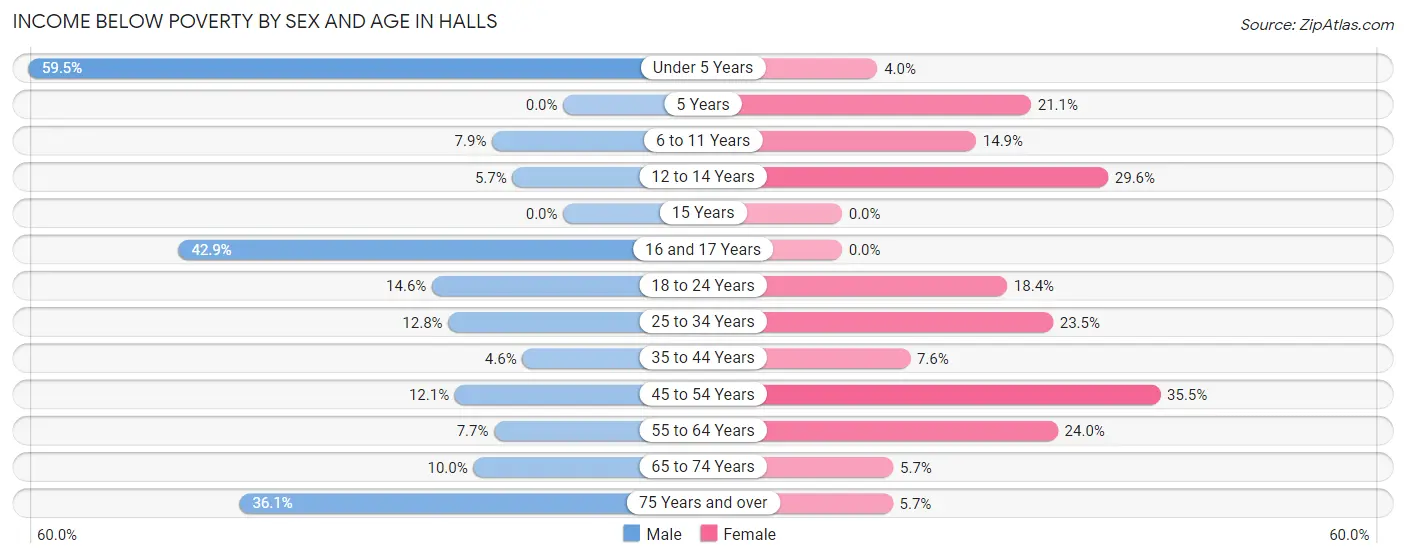
| Age Bracket | Male | Female |
| Under 5 Years | 25 (59.5%) | 3 (4.0%) |
| 5 Years | 0 (0.0%) | 4 (21.0%) |
| 6 to 11 Years | 8 (7.9%) | 10 (14.9%) |
| 12 to 14 Years | 3 (5.7%) | 8 (29.6%) |
| 15 Years | 0 (0.0%) | 0 (0.0%) |
| 16 and 17 Years | 3 (42.9%) | 0 (0.0%) |
| 18 to 24 Years | 13 (14.6%) | 16 (18.4%) |
| 25 to 34 Years | 16 (12.8%) | 43 (23.5%) |
| 35 to 44 Years | 6 (4.5%) | 12 (7.6%) |
| 45 to 54 Years | 14 (12.1%) | 39 (35.4%) |
| 55 to 64 Years | 4 (7.7%) | 25 (24.0%) |
| 65 to 74 Years | 5 (10.0%) | 6 (5.7%) |
| 75 Years and over | 22 (36.1%) | 6 (5.7%) |
| Total | 119 (14.1%) | 172 (16.0%) |
Income Above Poverty by Sex and Age in Halls
According to the poverty statistics in Halls, males aged 5 years and females aged 15 years are the age groups that are most secure financially, with 100.0% of males and 100.0% of females in these age groups living above the poverty line.
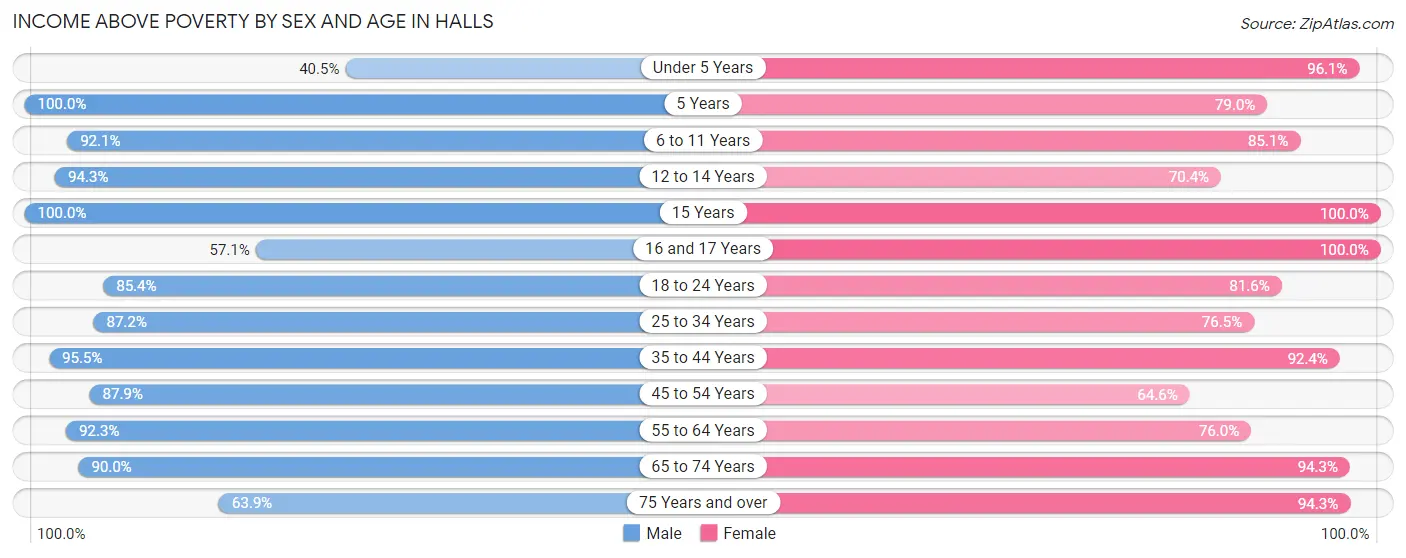
| Age Bracket | Male | Female |
| Under 5 Years | 17 (40.5%) | 73 (96.1%) |
| 5 Years | 3 (100.0%) | 15 (78.9%) |
| 6 to 11 Years | 93 (92.1%) | 57 (85.1%) |
| 12 to 14 Years | 50 (94.3%) | 19 (70.4%) |
| 15 Years | 11 (100.0%) | 25 (100.0%) |
| 16 and 17 Years | 4 (57.1%) | 5 (100.0%) |
| 18 to 24 Years | 76 (85.4%) | 71 (81.6%) |
| 25 to 34 Years | 109 (87.2%) | 140 (76.5%) |
| 35 to 44 Years | 126 (95.5%) | 146 (92.4%) |
| 45 to 54 Years | 102 (87.9%) | 71 (64.5%) |
| 55 to 64 Years | 48 (92.3%) | 79 (76.0%) |
| 65 to 74 Years | 45 (90.0%) | 99 (94.3%) |
| 75 Years and over | 39 (63.9%) | 100 (94.3%) |
| Total | 723 (85.9%) | 900 (84.0%) |
Income Below Poverty Among Married-Couple Families in Halls
The poverty statistics for married-couple families in Halls show that 3.4% or 9 of the total 263 families live below the poverty line. Families with no children have the highest poverty rate of 4.6%, comprising of 9 families. On the other hand, families with 1 or 2 children have the lowest poverty rate of 0.0%, which includes 0 families.
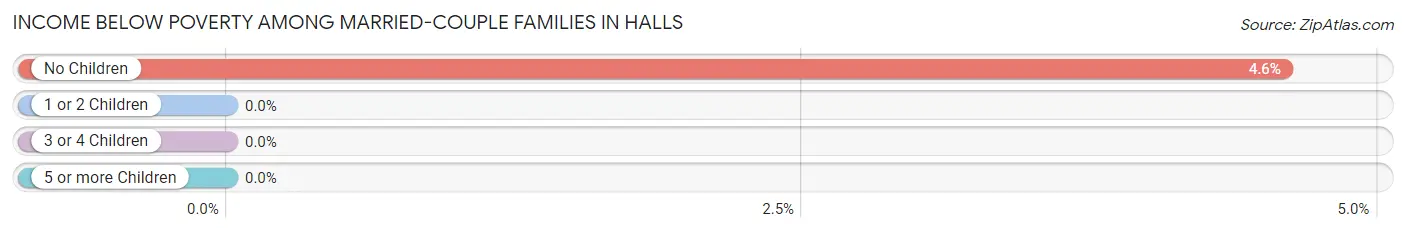
| Children | Above Poverty | Below Poverty |
| No Children | 187 (95.4%) | 9 (4.6%) |
| 1 or 2 Children | 47 (100.0%) | 0 (0.0%) |
| 3 or 4 Children | 20 (100.0%) | 0 (0.0%) |
| 5 or more Children | 0 (0.0%) | 0 (0.0%) |
| Total | 254 (96.6%) | 9 (3.4%) |
Income Below Poverty Among Single-Parent Households in Halls
According to the poverty data in Halls, 8.0% or 2 single-father households and 21.9% or 59 single-mother households are living below the poverty line. Among single-father households, those with no children have the highest poverty rate, with 2 households (25.0%) experiencing poverty. Likewise, among single-mother households, those with 3 or 4 children have the highest poverty rate, with 9 households (25.0%) falling below the poverty line.
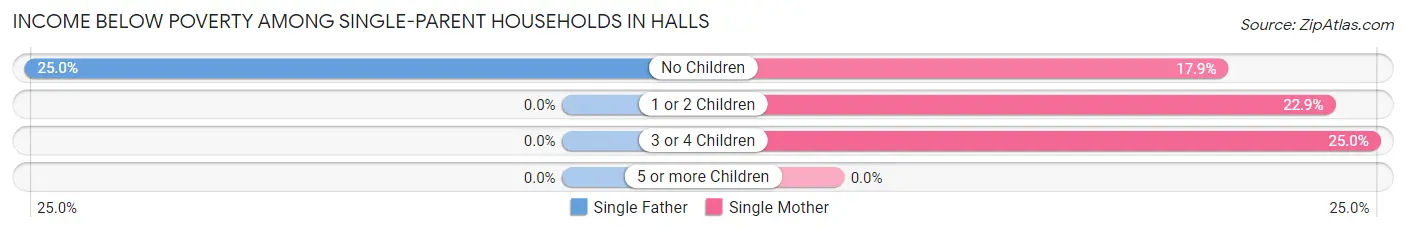
| Children | Single Father | Single Mother |
| No Children | 2 (25.0%) | 12 (17.9%) |
| 1 or 2 Children | 0 (0.0%) | 38 (22.9%) |
| 3 or 4 Children | 0 (0.0%) | 9 (25.0%) |
| 5 or more Children | 0 (0.0%) | 0 (0.0%) |
| Total | 2 (8.0%) | 59 (21.9%) |
Income Below Poverty Among Married-Couple vs Single-Parent Households in Halls
The poverty data for Halls shows that 9 of the married-couple family households (3.4%) and 61 of the single-parent households (20.7%) are living below the poverty level. Within the married-couple family households, those with no children have the highest poverty rate, with 9 households (4.6%) falling below the poverty line. Among the single-parent households, those with 1 or 2 children have the highest poverty rate, with 38 household (21.6%) living below poverty.
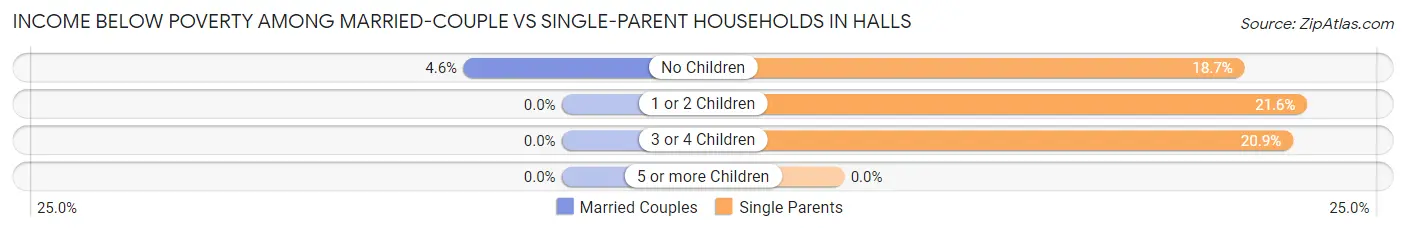
| Children | Married-Couple Families | Single-Parent Households |
| No Children | 9 (4.6%) | 14 (18.7%) |
| 1 or 2 Children | 0 (0.0%) | 38 (21.6%) |
| 3 or 4 Children | 0 (0.0%) | 9 (20.9%) |
| 5 or more Children | 0 (0.0%) | 0 (0.0%) |
| Total | 9 (3.4%) | 61 (20.7%) |
Race in Halls
The most populous races in Halls are White / Caucasian (1,271 | 66.2%), Black / African American (475 | 24.7%), and Two or more Races (171 | 8.9%).
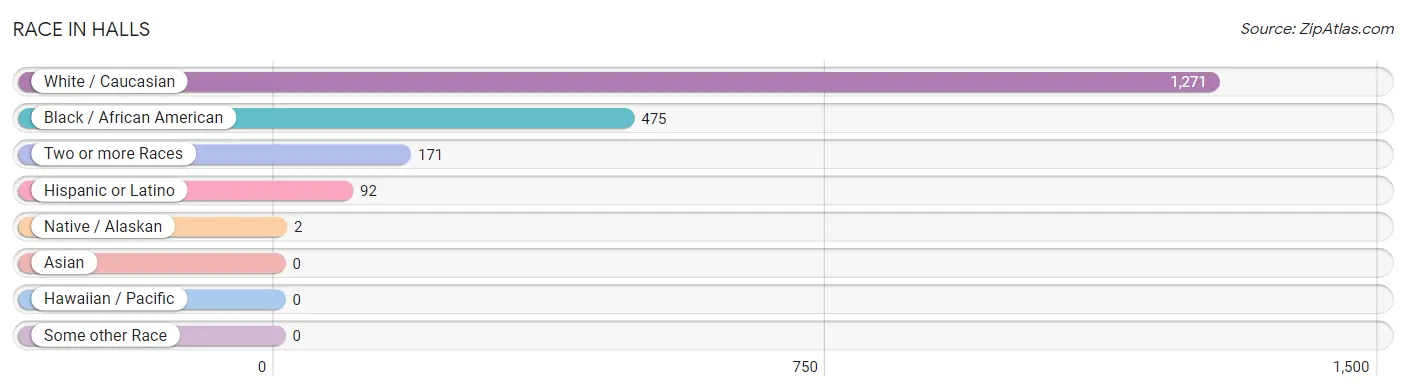
| Race | # Population | % Population |
| Asian | 0 | 0.0% |
| Black / African American | 475 | 24.7% |
| Hawaiian / Pacific | 0 | 0.0% |
| Hispanic or Latino | 92 | 4.8% |
| Native / Alaskan | 2 | 0.1% |
| White / Caucasian | 1,271 | 66.2% |
| Two or more Races | 171 | 8.9% |
| Some other Race | 0 | 0.0% |
| Total | 1,919 | 100.0% |
Ancestry in Halls
The most populous ancestries reported in Halls are American (262 | 13.7%), Irish (260 | 13.6%), German (92 | 4.8%), English (72 | 3.7%), and Puerto Rican (48 | 2.5%), together accounting for 38.2% of all Halls residents.
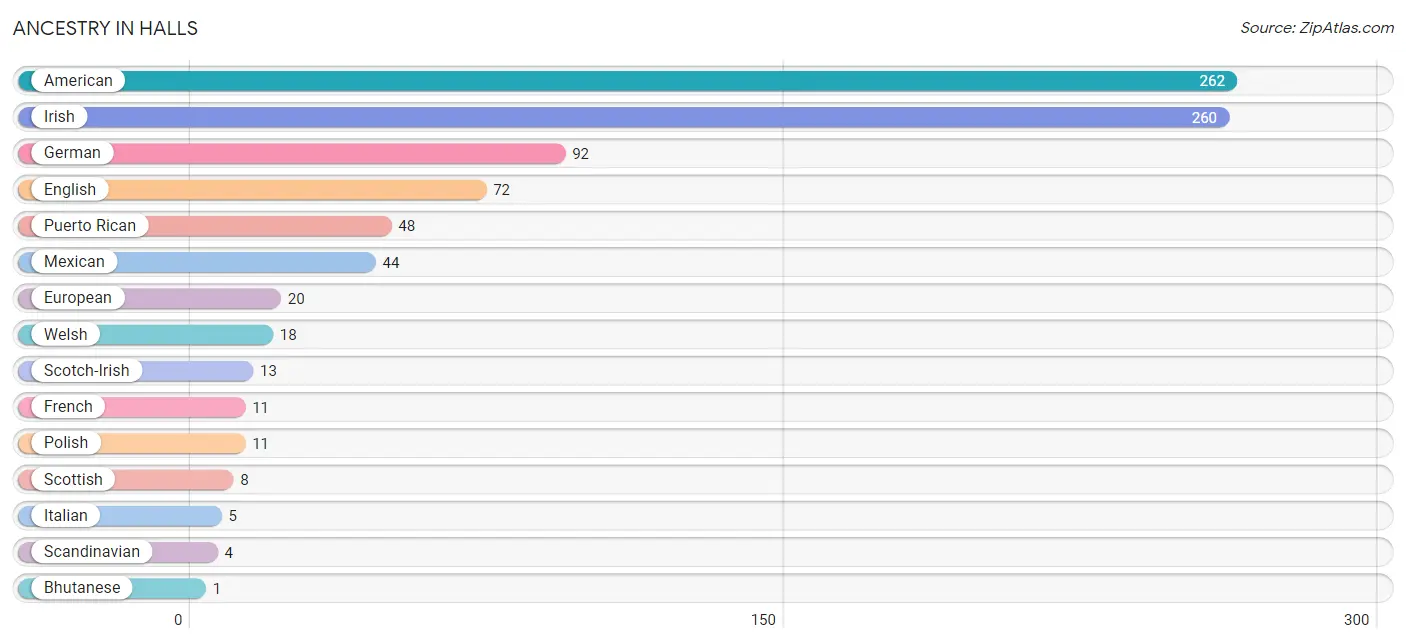
| Ancestry | # Population | % Population |
| American | 262 | 13.7% |
| Bhutanese | 1 | 0.1% |
| Blackfeet | 1 | 0.1% |
| Cherokee | 1 | 0.1% |
| English | 72 | 3.7% |
| European | 20 | 1.0% |
| French | 11 | 0.6% |
| German | 92 | 4.8% |
| Irish | 260 | 13.6% |
| Italian | 5 | 0.3% |
| Mexican | 44 | 2.3% |
| Polish | 11 | 0.6% |
| Puerto Rican | 48 | 2.5% |
| Scandinavian | 4 | 0.2% |
| Scotch-Irish | 13 | 0.7% |
| Scottish | 8 | 0.4% |
| Welsh | 18 | 0.9% | View All 17 Rows |
Immigrants in Halls

| Immigration Origin | # Population | % Population | View All 0 Rows |
Sex and Age in Halls
Sex and Age in Halls
The most populous age groups in Halls are 10 to 14 Years (119 | 14.1%) for men and 30 to 34 Years (97 | 9.0%) for women.
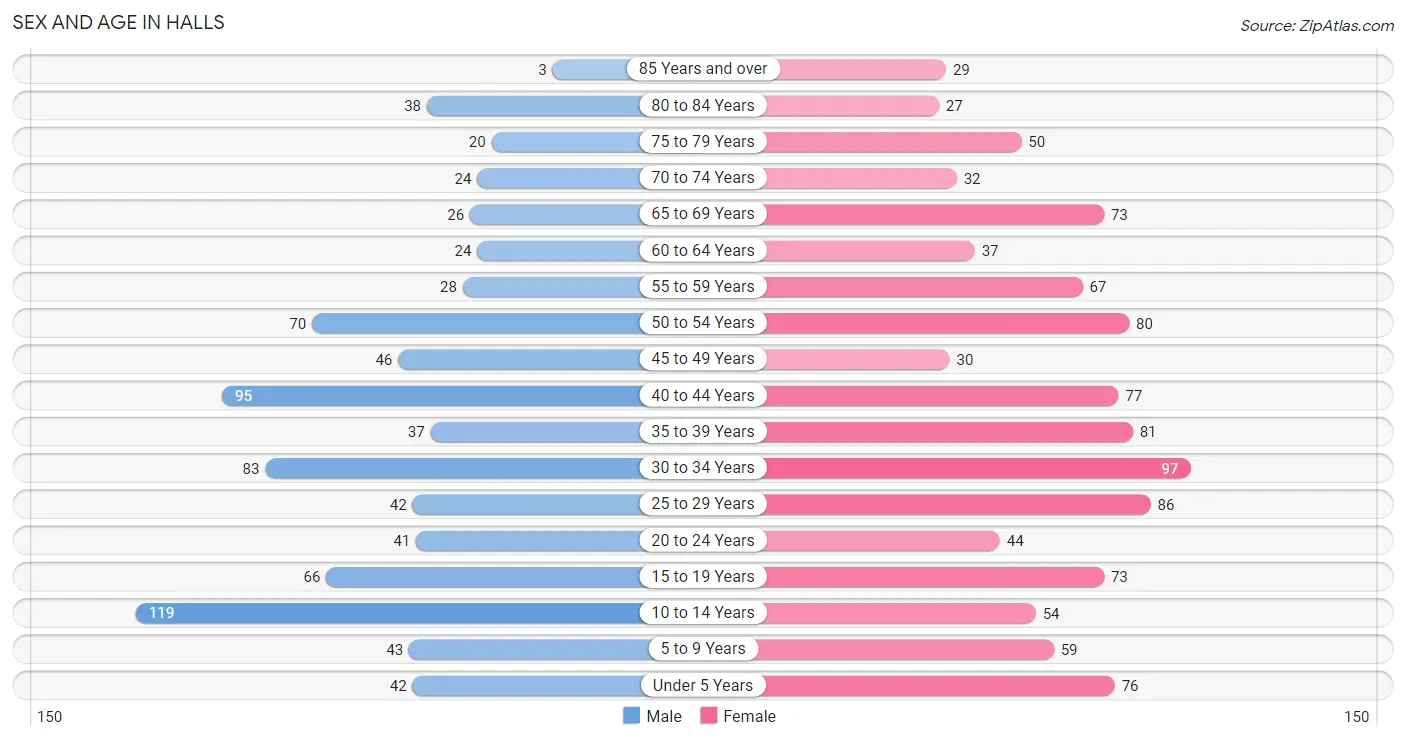
| Age Bracket | Male | Female |
| Under 5 Years | 42 (5.0%) | 76 (7.1%) |
| 5 to 9 Years | 43 (5.1%) | 59 (5.5%) |
| 10 to 14 Years | 119 (14.1%) | 54 (5.0%) |
| 15 to 19 Years | 66 (7.8%) | 73 (6.8%) |
| 20 to 24 Years | 41 (4.8%) | 44 (4.1%) |
| 25 to 29 Years | 42 (5.0%) | 86 (8.0%) |
| 30 to 34 Years | 83 (9.8%) | 97 (9.0%) |
| 35 to 39 Years | 37 (4.4%) | 81 (7.6%) |
| 40 to 44 Years | 95 (11.2%) | 77 (7.2%) |
| 45 to 49 Years | 46 (5.4%) | 30 (2.8%) |
| 50 to 54 Years | 70 (8.3%) | 80 (7.5%) |
| 55 to 59 Years | 28 (3.3%) | 67 (6.2%) |
| 60 to 64 Years | 24 (2.8%) | 37 (3.5%) |
| 65 to 69 Years | 26 (3.1%) | 73 (6.8%) |
| 70 to 74 Years | 24 (2.8%) | 32 (3.0%) |
| 75 to 79 Years | 20 (2.4%) | 50 (4.7%) |
| 80 to 84 Years | 38 (4.5%) | 27 (2.5%) |
| 85 Years and over | 3 (0.4%) | 29 (2.7%) |
| Total | 847 (100.0%) | 1,072 (100.0%) |
Families and Households in Halls
Median Family Size in Halls
The median family size in Halls is 2.64 persons per family, with single male/father families (25 | 4.5%) accounting for the largest median family size of 3.92 persons per family. On the other hand, single female/mother families (269 | 48.3%) represent the smallest median family size with 2.55 persons per family.
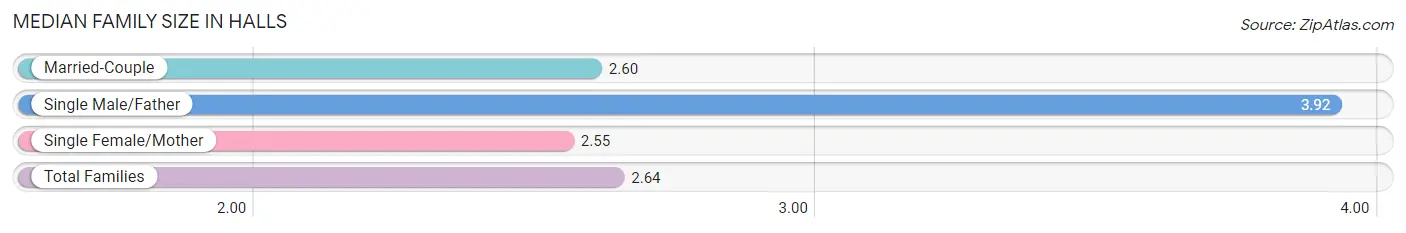
| Family Type | # Families | Family Size |
| Married-Couple | 263 (47.2%) | 2.60 |
| Single Male/Father | 25 (4.5%) | 3.92 |
| Single Female/Mother | 269 (48.3%) | 2.55 |
| Total Families | 557 (100.0%) | 2.64 |
Median Household Size in Halls
The median household size in Halls is 2.15 persons per household, with single male/father households (25 | 2.8%) accounting for the largest median household size of 4.64 persons per household. non-family households (334 | 37.5%) represent the smallest median household size with 1.17 persons per household.
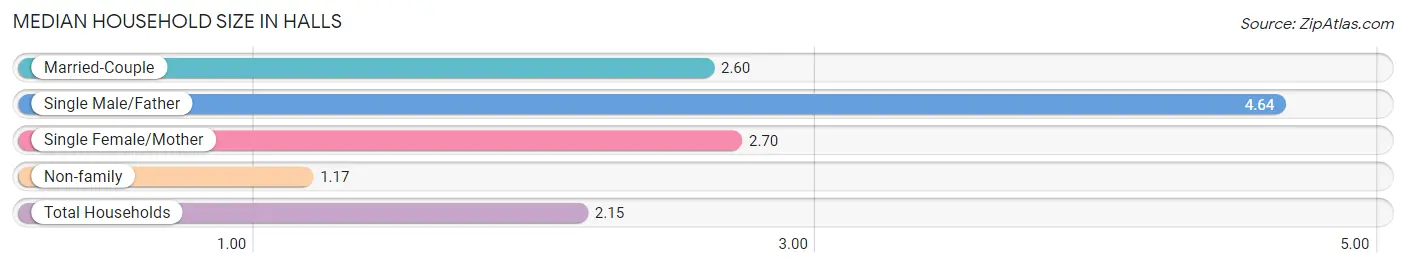
| Household Type | # Households | Household Size |
| Married-Couple | 263 (29.5%) | 2.60 |
| Single Male/Father | 25 (2.8%) | 4.64 |
| Single Female/Mother | 269 (30.2%) | 2.70 |
| Non-family | 334 (37.5%) | 1.17 |
| Total Households | 891 (100.0%) | 2.15 |
Household Size by Marriage Status in Halls
Out of a total of 891 households in Halls, 557 (62.5%) are family households, while 334 (37.5%) are nonfamily households. The most numerous type of family households are 2-person households, comprising 344, and the most common type of nonfamily households are 1-person households, comprising 282.
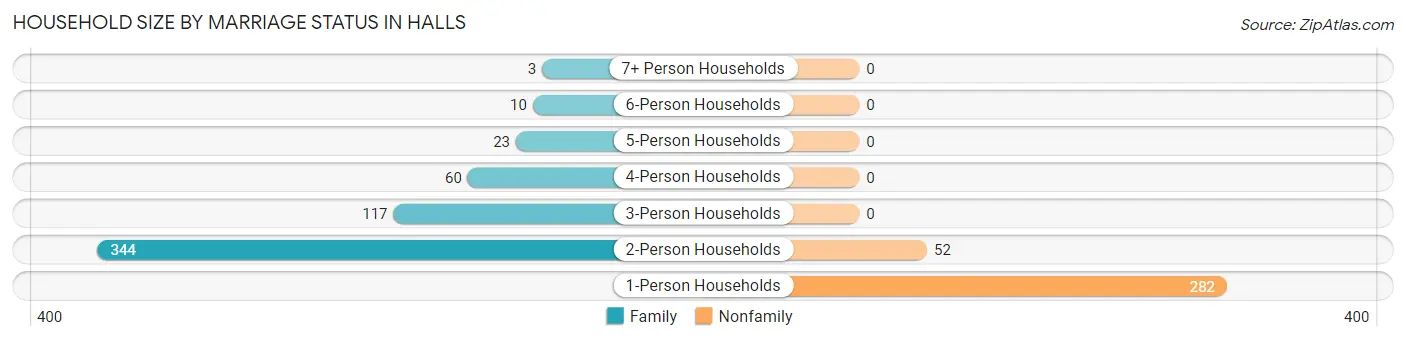
| Household Size | Family Households | Nonfamily Households |
| 1-Person Households | - | 282 (31.7%) |
| 2-Person Households | 344 (38.6%) | 52 (5.8%) |
| 3-Person Households | 117 (13.1%) | 0 (0.0%) |
| 4-Person Households | 60 (6.7%) | 0 (0.0%) |
| 5-Person Households | 23 (2.6%) | 0 (0.0%) |
| 6-Person Households | 10 (1.1%) | 0 (0.0%) |
| 7+ Person Households | 3 (0.3%) | 0 (0.0%) |
| Total | 557 (62.5%) | 334 (37.5%) |
Female Fertility in Halls
Fertility by Age in Halls
Average fertility rate in Halls is 145.0 births per 1,000 women. Women in the age bracket of 20 to 34 years have the highest fertility rate with 326.0 births per 1,000 women. Women in the age bracket of 20 to 34 years acount for 100.0% of all women with births.
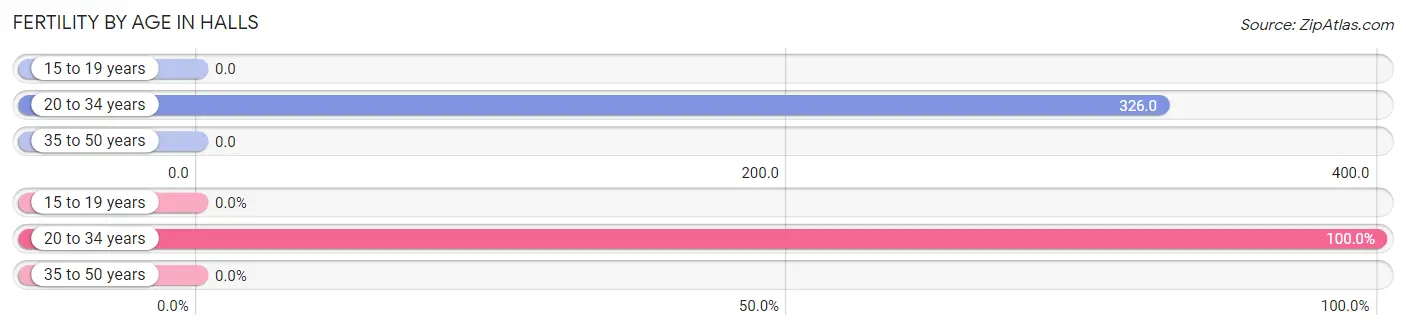
| Age Bracket | Women with Births | Births / 1,000 Women |
| 15 to 19 years | 0 (0.0%) | 0.0 |
| 20 to 34 years | 74 (100.0%) | 326.0 |
| 35 to 50 years | 0 (0.0%) | 0.0 |
| Total | 74 (100.0%) | 145.0 |
Fertility by Age by Marriage Status in Halls
17.6% of women with births (74) in Halls are married. The highest percentage of unmarried women with births falls into 20 to 34 years age bracket with 82.4% of them unmarried at the time of birth, while the lowest percentage of unmarried women with births belong to 20 to 34 years age bracket with 82.4% of them unmarried.
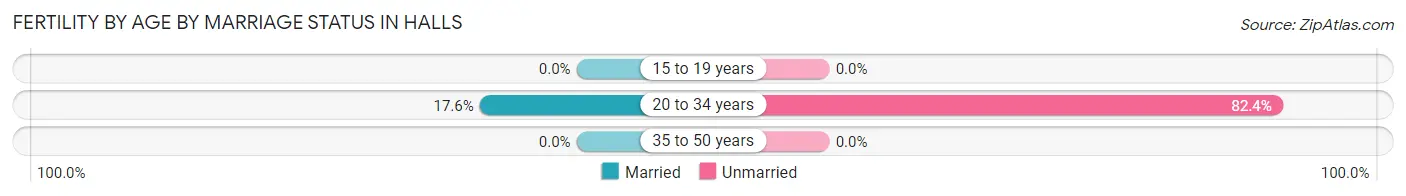
| Age Bracket | Married | Unmarried |
| 15 to 19 years | 0 (0.0%) | 0 (0.0%) |
| 20 to 34 years | 13 (17.6%) | 61 (82.4%) |
| 35 to 50 years | 0 (0.0%) | 0 (0.0%) |
| Total | 13 (17.6%) | 61 (82.4%) |
Fertility by Education in Halls
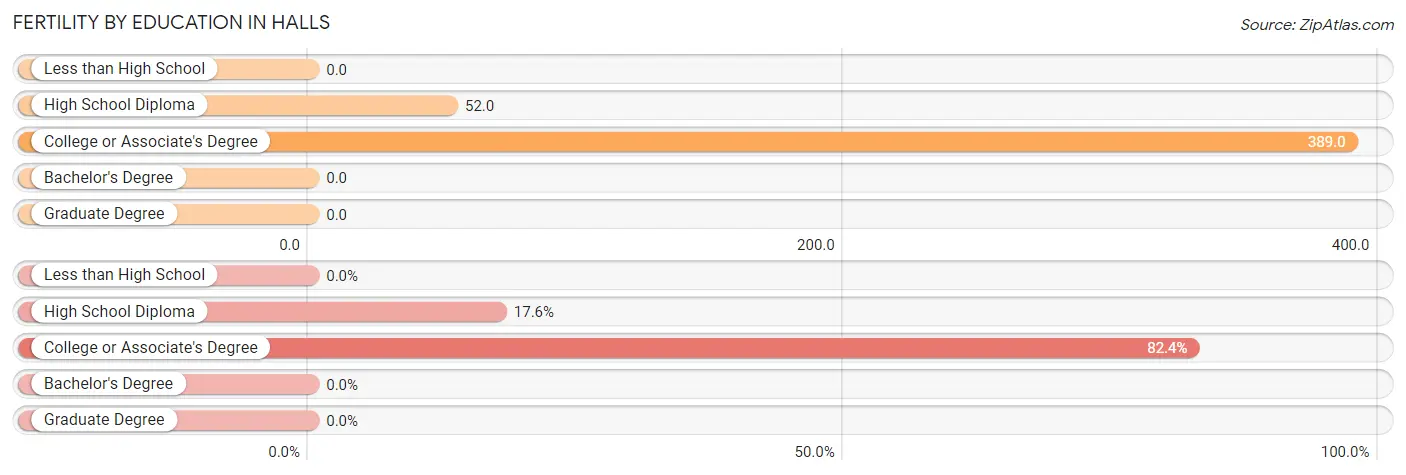
| Educational Attainment | Women with Births | Births / 1,000 Women |
| Less than High School | 0 (0.0%) | 0.0 |
| High School Diploma | 13 (17.6%) | 52.0 |
| College or Associate's Degree | 61 (82.4%) | 389.0 |
| Bachelor's Degree | 0 (0.0%) | 0.0 |
| Graduate Degree | 0 (0.0%) | 0.0 |
| Total | 74 (100.0%) | 145.0 |
Fertility by Education by Marriage Status in Halls
82.4% of women with births in Halls are unmarried. Women with the educational attainment of high school diploma are most likely to be married with 61.5% of them married at childbirth, while women with the educational attainment of college or associate's degree are least likely to be married with 91.8% of them unmarried at childbirth.
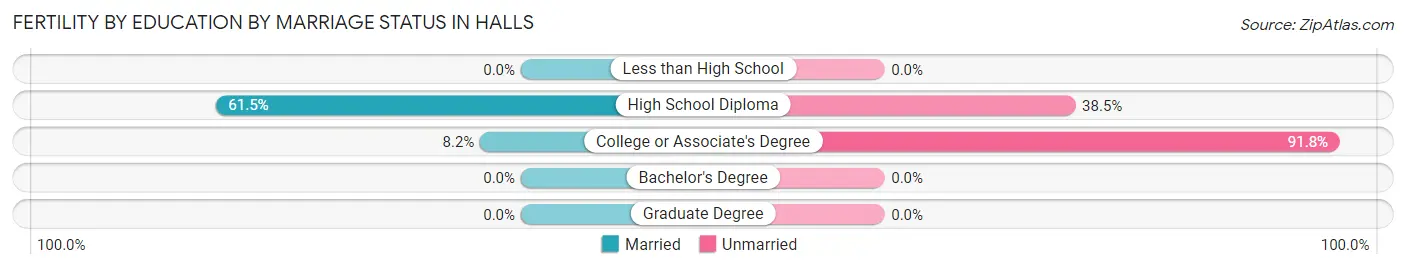
| Educational Attainment | Married | Unmarried |
| Less than High School | 0 (0.0%) | 0 (0.0%) |
| High School Diploma | 8 (61.5%) | 5 (38.5%) |
| College or Associate's Degree | 5 (8.2%) | 56 (91.8%) |
| Bachelor's Degree | 0 (0.0%) | 0 (0.0%) |
| Graduate Degree | 0 (0.0%) | 0 (0.0%) |
| Total | 13 (17.6%) | 61 (82.4%) |
Employment Characteristics in Halls
Employment by Class of Employer in Halls
Among the 745 employed individuals in Halls, private company employees (574 | 77.0%), self-employed (not incorporated) (66 | 8.9%), and local government employees (61 | 8.2%) make up the most common classes of employment.
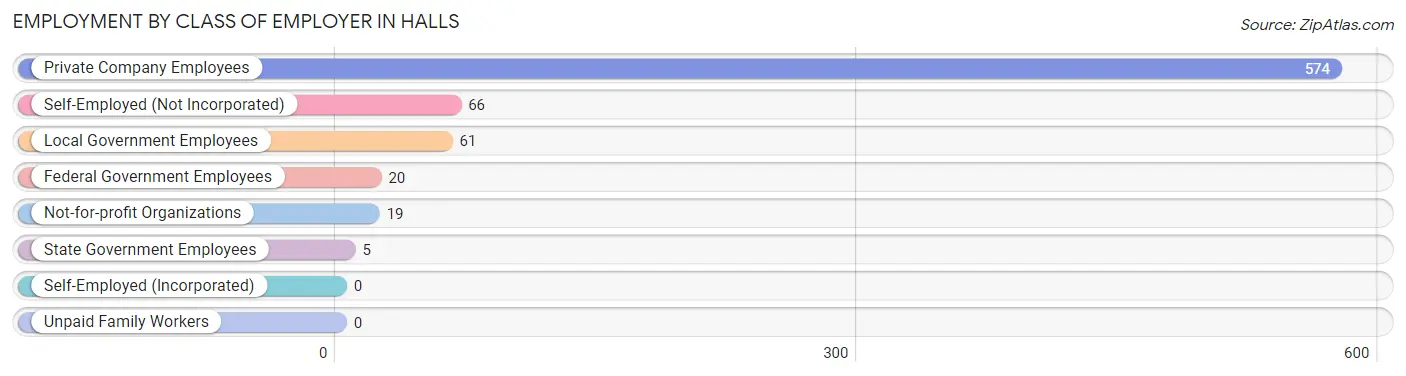
| Employer Class | # Employees | % Employees |
| Private Company Employees | 574 | 77.0% |
| Self-Employed (Incorporated) | 0 | 0.0% |
| Self-Employed (Not Incorporated) | 66 | 8.9% |
| Not-for-profit Organizations | 19 | 2.5% |
| Local Government Employees | 61 | 8.2% |
| State Government Employees | 5 | 0.7% |
| Federal Government Employees | 20 | 2.7% |
| Unpaid Family Workers | 0 | 0.0% |
| Total | 745 | 100.0% |
Employment Status by Age in Halls
According to the labor force statistics for Halls, out of the total population over 16 years of age (1,490), 53.4% or 796 individuals are in the labor force, with 2.3% or 18 of them unemployed. The age group with the highest labor force participation rate is 35 to 44 years, with 75.9% or 220 individuals in the labor force. Within the labor force, the 20 to 24 years age range has the highest percentage of unemployed individuals, with 7.4% or 4 of them being unemployed.
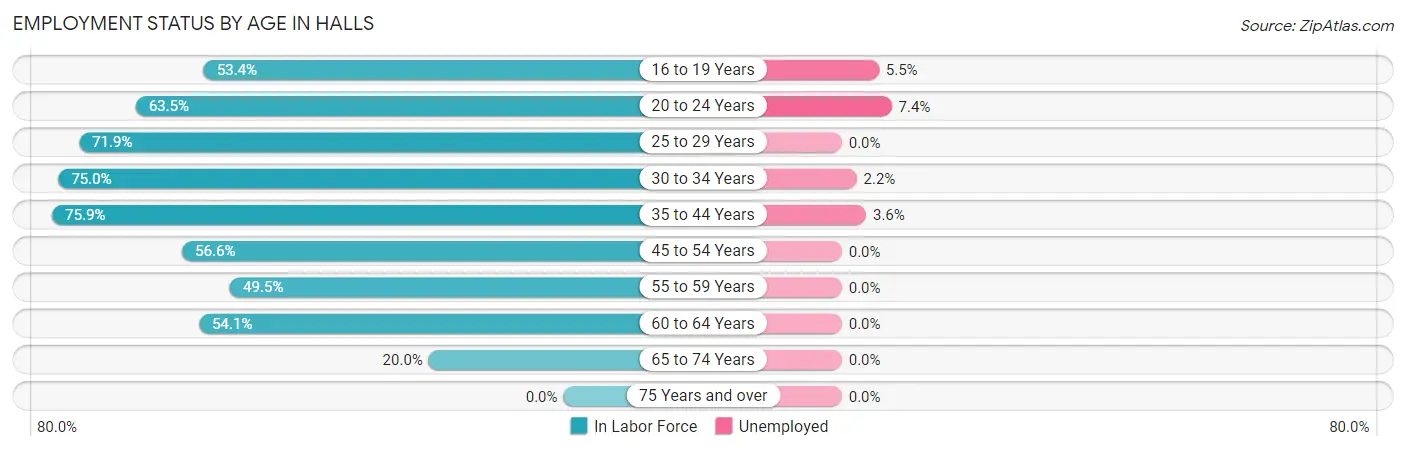
| Age Bracket | In Labor Force | Unemployed |
| 16 to 19 Years | 55 (53.4%) | 3 (5.5%) |
| 20 to 24 Years | 54 (63.5%) | 4 (7.4%) |
| 25 to 29 Years | 92 (71.9%) | 0 (0.0%) |
| 30 to 34 Years | 135 (75.0%) | 3 (2.2%) |
| 35 to 44 Years | 220 (75.9%) | 8 (3.6%) |
| 45 to 54 Years | 128 (56.6%) | 0 (0.0%) |
| 55 to 59 Years | 47 (49.5%) | 0 (0.0%) |
| 60 to 64 Years | 33 (54.1%) | 0 (0.0%) |
| 65 to 74 Years | 31 (20.0%) | 0 (0.0%) |
| 75 Years and over | 0 (0.0%) | 0 (0.0%) |
| Total | 796 (53.4%) | 18 (2.3%) |
Employment Status by Educational Attainment in Halls
According to labor force statistics for Halls, 66.8% of individuals (655) out of the total population between 25 and 64 years of age (980) are in the labor force, with 1.7% or 11 of them being unemployed. The group with the highest labor force participation rate are those with the educational attainment of bachelor's degree or higher, with 83.6% or 51 individuals in the labor force. Within the labor force, individuals with college / associate degree education have the highest percentage of unemployment, with 3.6% or 7 of them being unemployed.
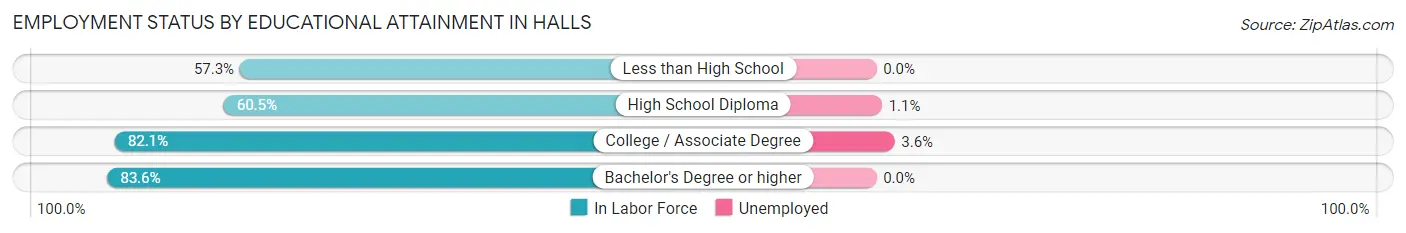
| Educational Attainment | In Labor Force | Unemployed |
| Less than High School | 51 (57.3%) | 0 (0.0%) |
| High School Diploma | 360 (60.5%) | 7 (1.1%) |
| College / Associate Degree | 193 (82.1%) | 8 (3.6%) |
| Bachelor's Degree or higher | 51 (83.6%) | 0 (0.0%) |
| Total | 655 (66.8%) | 17 (1.7%) |
Employment Occupations by Sex in Halls
Management, Business, Science and Arts Occupations
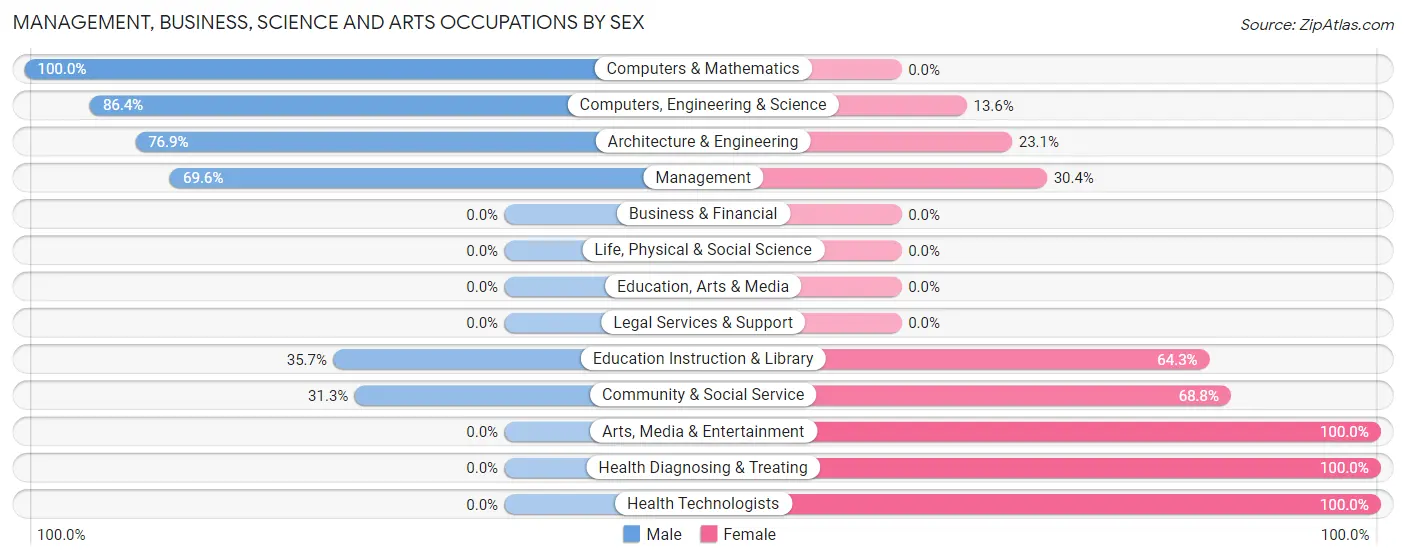
The most common Management, Business, Science and Arts occupations in Halls are Management (56 | 7.2%), Health Diagnosing & Treating (39 | 5.0%), Computers, Engineering & Science (22 | 2.8%), Community & Social Service (16 | 2.1%), and Education Instruction & Library (14 | 1.8%).
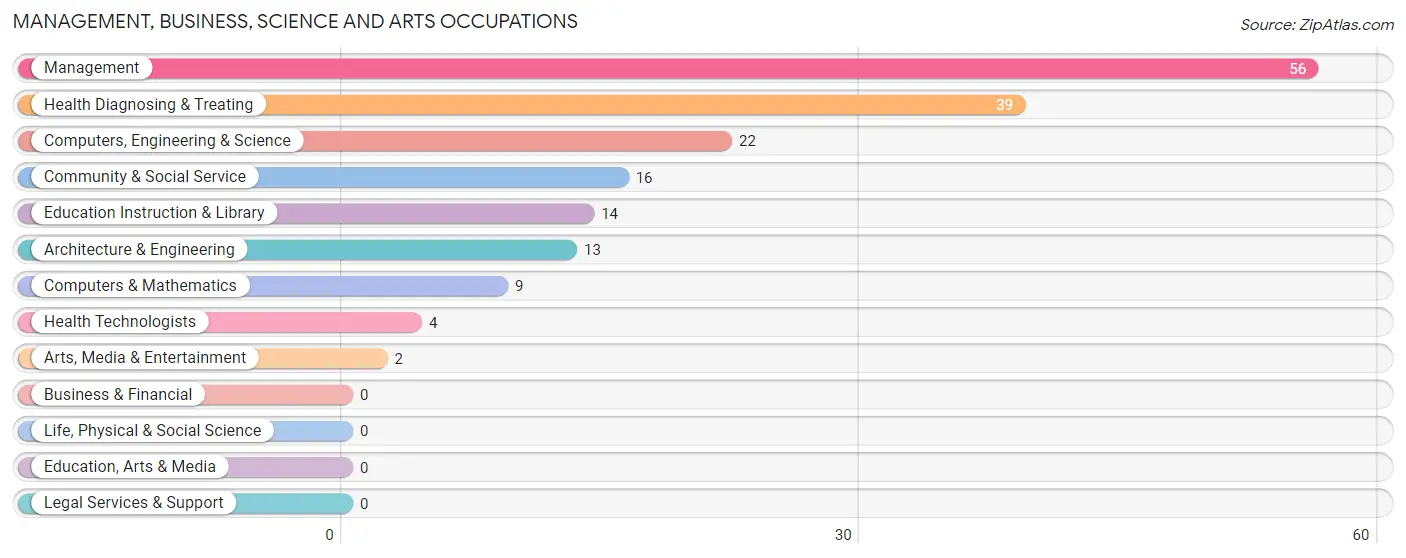
Management, Business, Science and Arts Occupations by Sex
Within the Management, Business, Science and Arts occupations in Halls, the most male-oriented occupations are Computers & Mathematics (100.0%), Computers, Engineering & Science (86.4%), and Architecture & Engineering (76.9%), while the most female-oriented occupations are Arts, Media & Entertainment (100.0%), Health Diagnosing & Treating (100.0%), and Health Technologists (100.0%).
| Occupation | Male | Female |
| Management | 39 (69.6%) | 17 (30.4%) |
| Business & Financial | 0 (0.0%) | 0 (0.0%) |
| Computers, Engineering & Science | 19 (86.4%) | 3 (13.6%) |
| Computers & Mathematics | 9 (100.0%) | 0 (0.0%) |
| Architecture & Engineering | 10 (76.9%) | 3 (23.1%) |
| Life, Physical & Social Science | 0 (0.0%) | 0 (0.0%) |
| Community & Social Service | 5 (31.2%) | 11 (68.8%) |
| Education, Arts & Media | 0 (0.0%) | 0 (0.0%) |
| Legal Services & Support | 0 (0.0%) | 0 (0.0%) |
| Education Instruction & Library | 5 (35.7%) | 9 (64.3%) |
| Arts, Media & Entertainment | 0 (0.0%) | 2 (100.0%) |
| Health Diagnosing & Treating | 0 (0.0%) | 39 (100.0%) |
| Health Technologists | 0 (0.0%) | 4 (100.0%) |
| Total (Category) | 63 (47.4%) | 70 (52.6%) |
| Total (Overall) | 420 (54.0%) | 357 (46.0%) |
Services Occupations
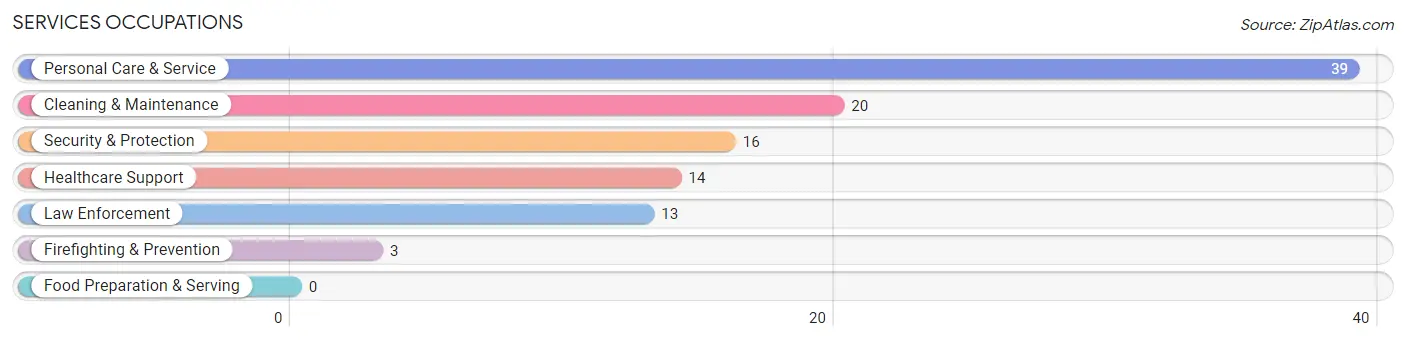
The most common Services occupations in Halls are Personal Care & Service (39 | 5.0%), Cleaning & Maintenance (20 | 2.6%), Security & Protection (16 | 2.1%), Healthcare Support (14 | 1.8%), and Law Enforcement (13 | 1.7%).
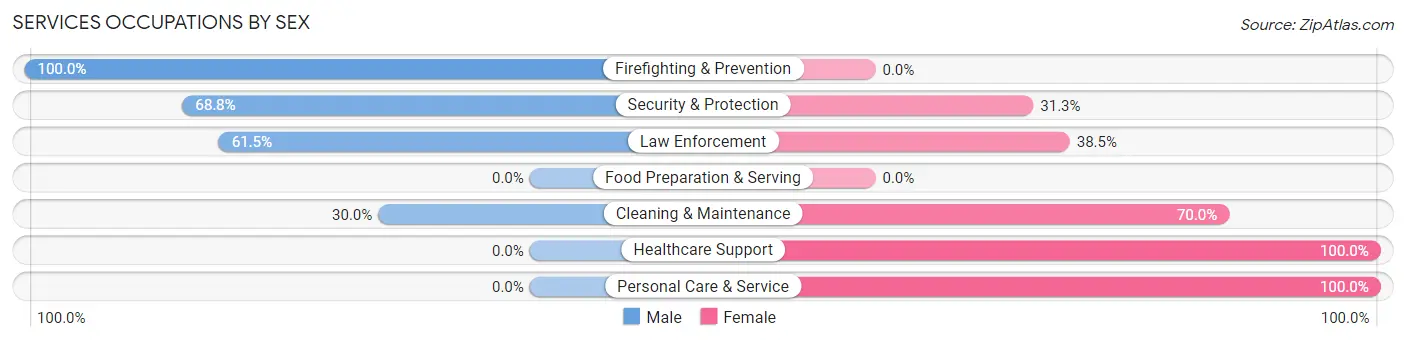
Services Occupations by Sex
Within the Services occupations in Halls, the most male-oriented occupations are Firefighting & Prevention (100.0%), Security & Protection (68.8%), and Law Enforcement (61.5%), while the most female-oriented occupations are Healthcare Support (100.0%), Personal Care & Service (100.0%), and Cleaning & Maintenance (70.0%).
| Occupation | Male | Female |
| Healthcare Support | 0 (0.0%) | 14 (100.0%) |
| Security & Protection | 11 (68.8%) | 5 (31.2%) |
| Firefighting & Prevention | 3 (100.0%) | 0 (0.0%) |
| Law Enforcement | 8 (61.5%) | 5 (38.5%) |
| Food Preparation & Serving | 0 (0.0%) | 0 (0.0%) |
| Cleaning & Maintenance | 6 (30.0%) | 14 (70.0%) |
| Personal Care & Service | 0 (0.0%) | 39 (100.0%) |
| Total (Category) | 17 (19.1%) | 72 (80.9%) |
| Total (Overall) | 420 (54.0%) | 357 (46.0%) |
Sales and Office Occupations
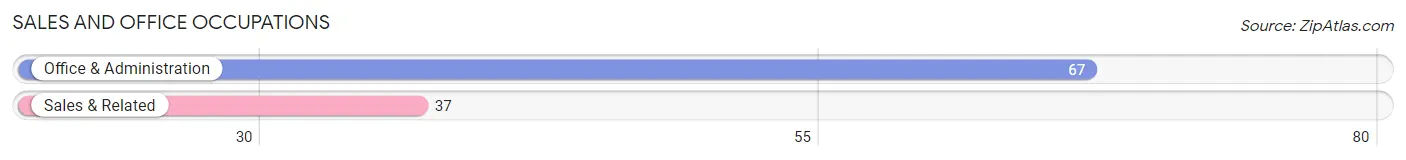
The most common Sales and Office occupations in Halls are Office & Administration (67 | 8.6%), and Sales & Related (37 | 4.8%).
Sales and Office Occupations by Sex
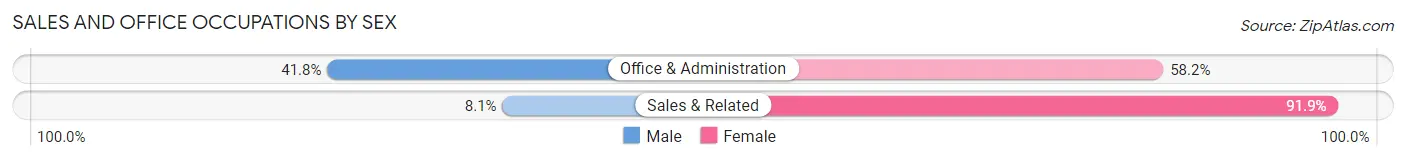
| Occupation | Male | Female |
| Sales & Related | 3 (8.1%) | 34 (91.9%) |
| Office & Administration | 28 (41.8%) | 39 (58.2%) |
| Total (Category) | 31 (29.8%) | 73 (70.2%) |
| Total (Overall) | 420 (54.0%) | 357 (46.0%) |
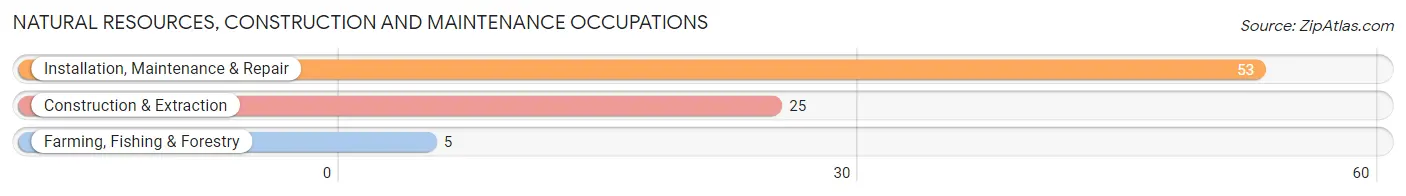
Natural Resources, Construction and Maintenance Occupations
The most common Natural Resources, Construction and Maintenance occupations in Halls are Installation, Maintenance & Repair (53 | 6.8%), Construction & Extraction (25 | 3.2%), and Farming, Fishing & Forestry (5 | 0.6%).
Natural Resources, Construction and Maintenance Occupations by Sex
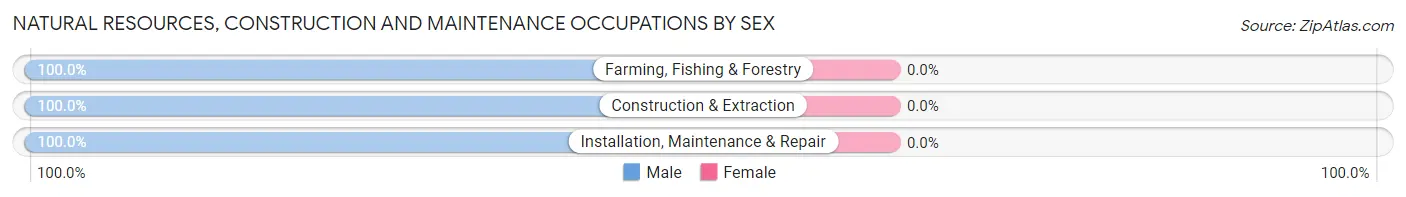
| Occupation | Male | Female |
| Farming, Fishing & Forestry | 5 (100.0%) | 0 (0.0%) |
| Construction & Extraction | 25 (100.0%) | 0 (0.0%) |
| Installation, Maintenance & Repair | 53 (100.0%) | 0 (0.0%) |
| Total (Category) | 83 (100.0%) | 0 (0.0%) |
| Total (Overall) | 420 (54.0%) | 357 (46.0%) |
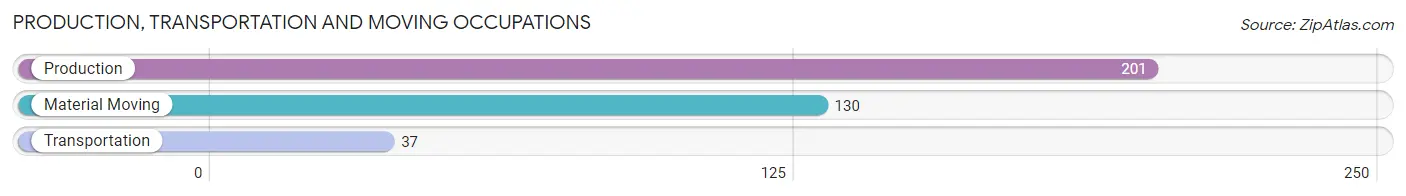
Production, Transportation and Moving Occupations
The most common Production, Transportation and Moving occupations in Halls are Production (201 | 25.9%), Material Moving (130 | 16.7%), and Transportation (37 | 4.8%).
Production, Transportation and Moving Occupations by Sex
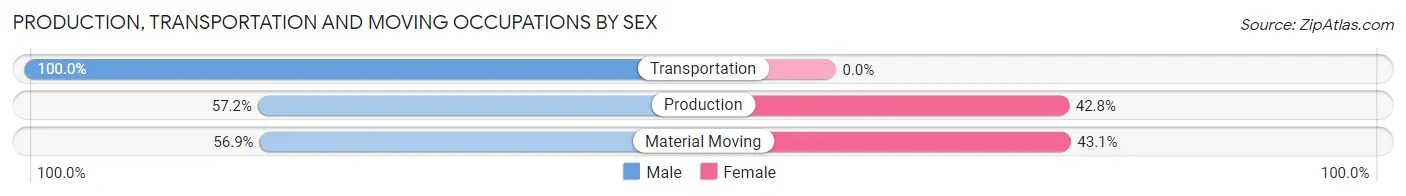
| Occupation | Male | Female |
| Production | 115 (57.2%) | 86 (42.8%) |
| Transportation | 37 (100.0%) | 0 (0.0%) |
| Material Moving | 74 (56.9%) | 56 (43.1%) |
| Total (Category) | 226 (61.4%) | 142 (38.6%) |
| Total (Overall) | 420 (54.0%) | 357 (46.0%) |
Employment Industries by Sex in Halls
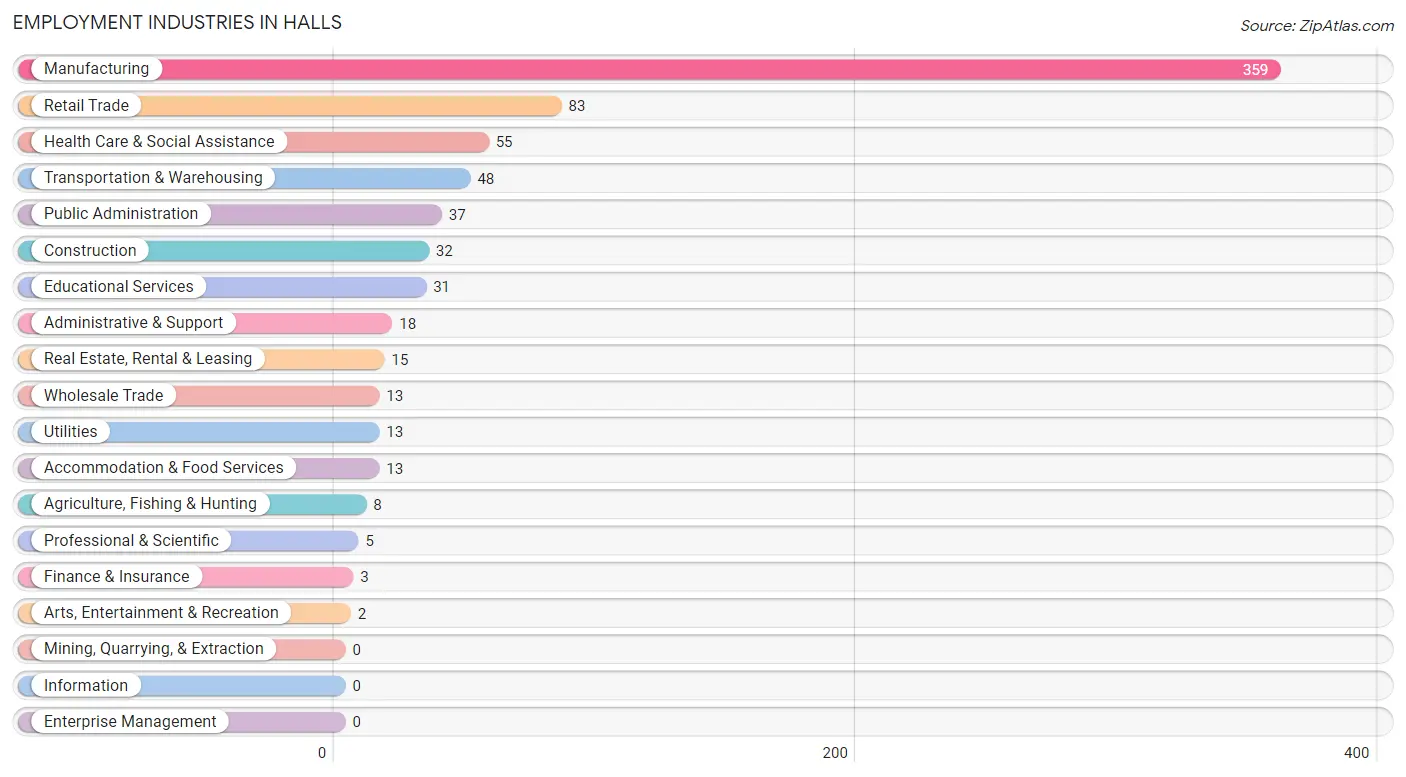
Employment Industries in Halls
The major employment industries in Halls include Manufacturing (359 | 46.2%), Retail Trade (83 | 10.7%), Health Care & Social Assistance (55 | 7.1%), Transportation & Warehousing (48 | 6.2%), and Public Administration (37 | 4.8%).
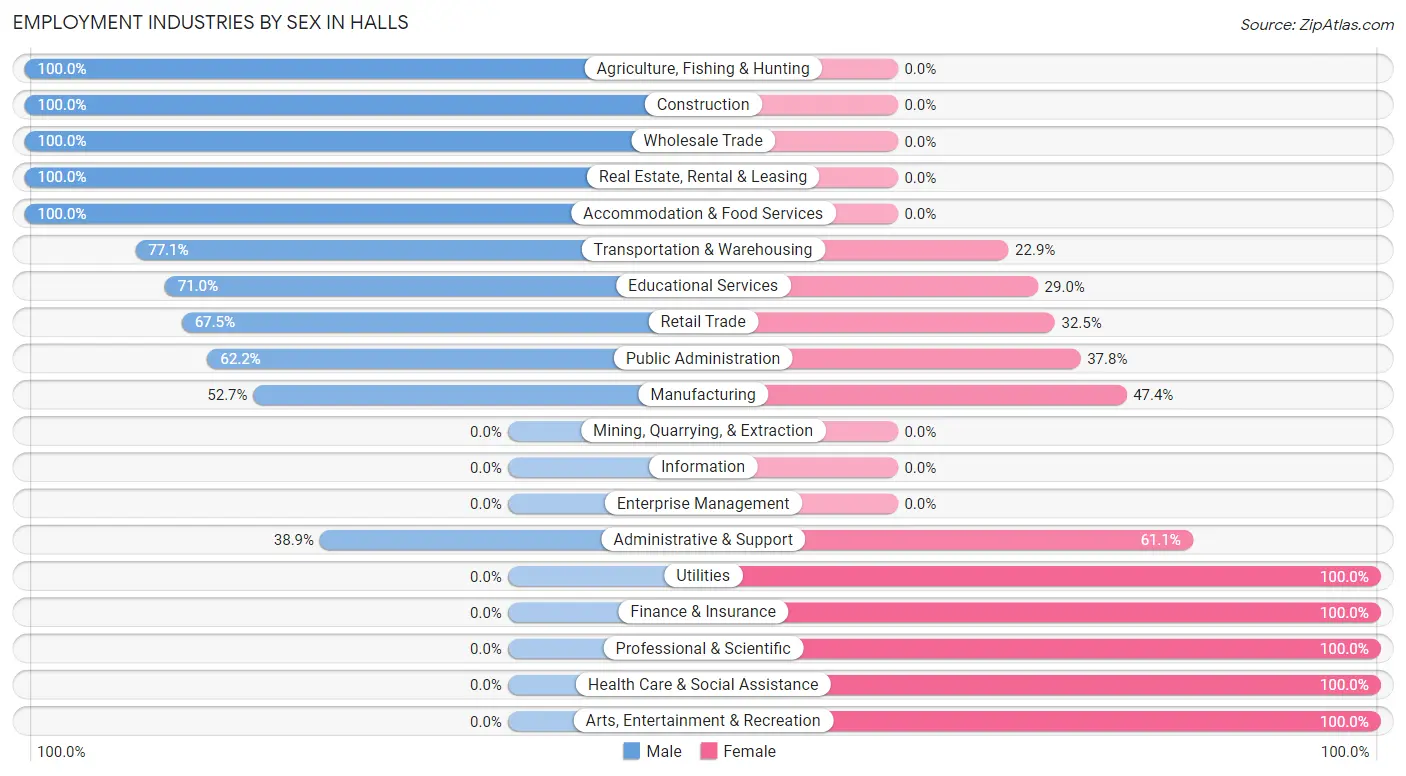
Employment Industries by Sex in Halls
The Halls industries that see more men than women are Agriculture, Fishing & Hunting (100.0%), Construction (100.0%), and Wholesale Trade (100.0%), whereas the industries that tend to have a higher number of women are Utilities (100.0%), Finance & Insurance (100.0%), and Professional & Scientific (100.0%).
| Industry | Male | Female |
| Agriculture, Fishing & Hunting | 8 (100.0%) | 0 (0.0%) |
| Mining, Quarrying, & Extraction | 0 (0.0%) | 0 (0.0%) |
| Construction | 32 (100.0%) | 0 (0.0%) |
| Manufacturing | 189 (52.6%) | 170 (47.3%) |
| Wholesale Trade | 13 (100.0%) | 0 (0.0%) |
| Retail Trade | 56 (67.5%) | 27 (32.5%) |
| Transportation & Warehousing | 37 (77.1%) | 11 (22.9%) |
| Utilities | 0 (0.0%) | 13 (100.0%) |
| Information | 0 (0.0%) | 0 (0.0%) |
| Finance & Insurance | 0 (0.0%) | 3 (100.0%) |
| Real Estate, Rental & Leasing | 15 (100.0%) | 0 (0.0%) |
| Professional & Scientific | 0 (0.0%) | 5 (100.0%) |
| Enterprise Management | 0 (0.0%) | 0 (0.0%) |
| Administrative & Support | 7 (38.9%) | 11 (61.1%) |
| Educational Services | 22 (71.0%) | 9 (29.0%) |
| Health Care & Social Assistance | 0 (0.0%) | 55 (100.0%) |
| Arts, Entertainment & Recreation | 0 (0.0%) | 2 (100.0%) |
| Accommodation & Food Services | 13 (100.0%) | 0 (0.0%) |
| Public Administration | 23 (62.2%) | 14 (37.8%) |
| Total | 420 (54.0%) | 357 (46.0%) |
Education in Halls
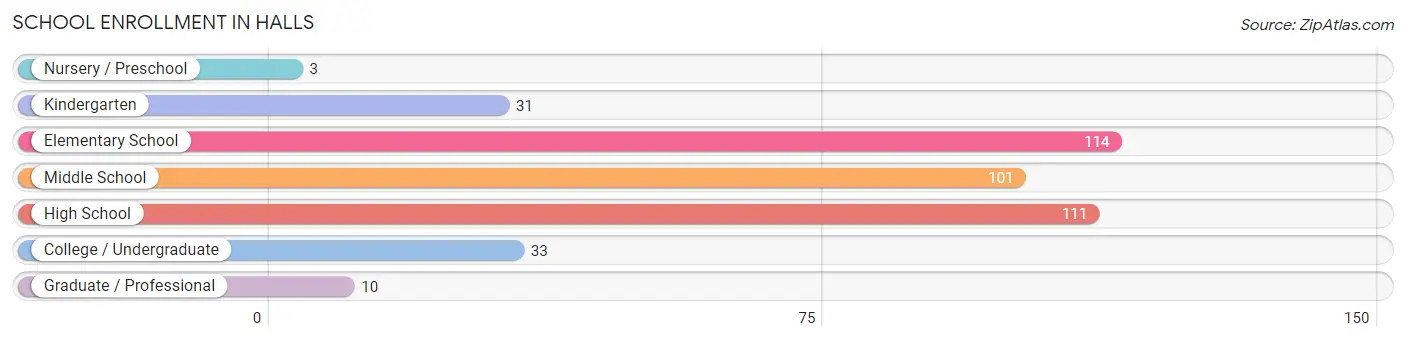
School Enrollment in Halls
The most common levels of schooling among the 403 students in Halls are elementary school (114 | 28.3%), high school (111 | 27.5%), and middle school (101 | 25.1%).
| School Level | # Students | % Students |
| Nursery / Preschool | 3 | 0.7% |
| Kindergarten | 31 | 7.7% |
| Elementary School | 114 | 28.3% |
| Middle School | 101 | 25.1% |
| High School | 111 | 27.5% |
| College / Undergraduate | 33 | 8.2% |
| Graduate / Professional | 10 | 2.5% |
| Total | 403 | 100.0% |
School Enrollment by Age by Funding Source in Halls
Out of a total of 403 students who are enrolled in schools in Halls, 5 (1.2%) attend a private institution, while the remaining 398 (98.8%) are enrolled in public schools. The age group of 15 to 17 year olds has the highest likelihood of being enrolled in private schools, with 5 (10.4% in the age bracket) enrolled. Conversely, the age group of 3 to 4 year olds has the lowest likelihood of being enrolled in a private school, with 3 (100.0% in the age bracket) attending a public institution.
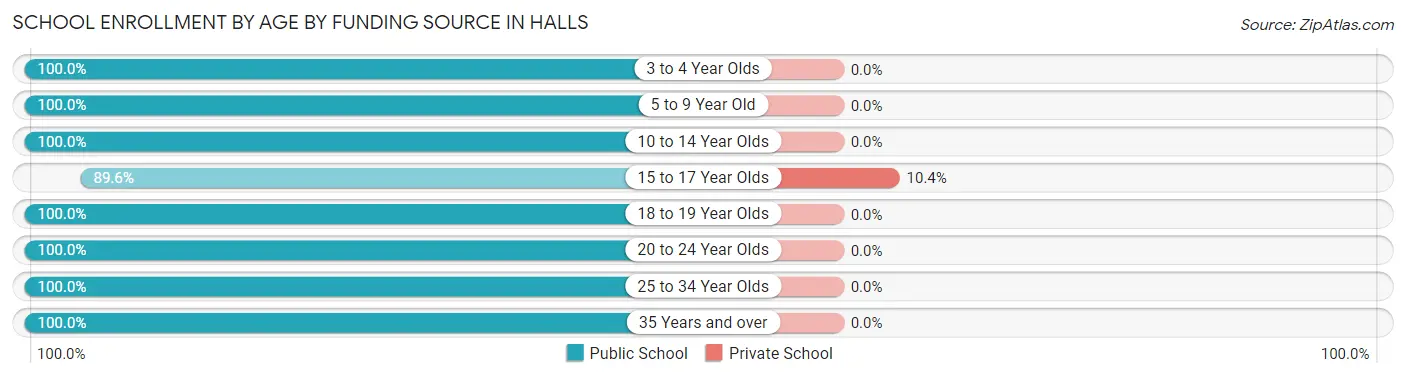
| Age Bracket | Public School | Private School |
| 3 to 4 Year Olds | 3 (100.0%) | 0 (0.0%) |
| 5 to 9 Year Old | 102 (100.0%) | 0 (0.0%) |
| 10 to 14 Year Olds | 173 (100.0%) | 0 (0.0%) |
| 15 to 17 Year Olds | 43 (89.6%) | 5 (10.4%) |
| 18 to 19 Year Olds | 41 (100.0%) | 0 (0.0%) |
| 20 to 24 Year Olds | 15 (100.0%) | 0 (0.0%) |
| 25 to 34 Year Olds | 5 (100.0%) | 0 (0.0%) |
| 35 Years and over | 16 (100.0%) | 0 (0.0%) |
| Total | 398 (98.8%) | 5 (1.2%) |
Educational Attainment by Field of Study in Halls
Education (74 | 51.0%), business (19 | 13.1%), science & technology (15 | 10.3%), literature & languages (9 | 6.2%), and visual & performing arts (6 | 4.1%) are the most common fields of study among 145 individuals in Halls who have obtained a bachelor's degree or higher.
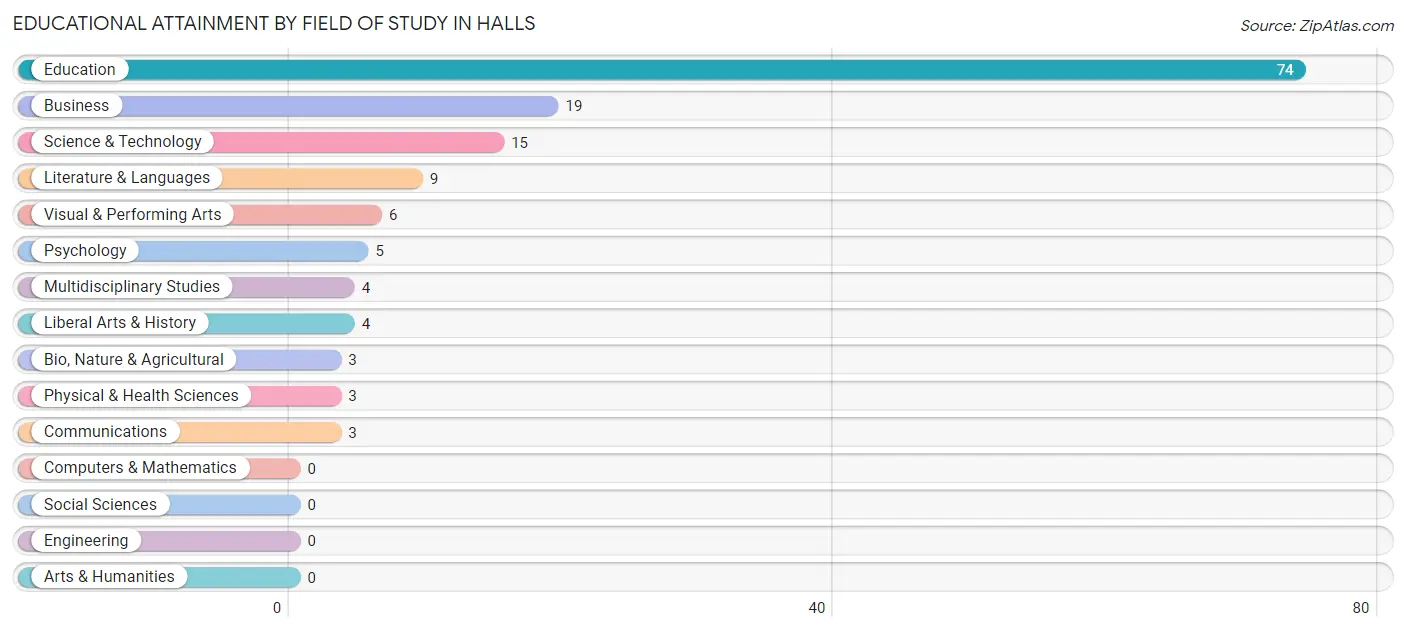
| Field of Study | # Graduates | % Graduates |
| Computers & Mathematics | 0 | 0.0% |
| Bio, Nature & Agricultural | 3 | 2.1% |
| Physical & Health Sciences | 3 | 2.1% |
| Psychology | 5 | 3.5% |
| Social Sciences | 0 | 0.0% |
| Engineering | 0 | 0.0% |
| Multidisciplinary Studies | 4 | 2.8% |
| Science & Technology | 15 | 10.3% |
| Business | 19 | 13.1% |
| Education | 74 | 51.0% |
| Literature & Languages | 9 | 6.2% |
| Liberal Arts & History | 4 | 2.8% |
| Visual & Performing Arts | 6 | 4.1% |
| Communications | 3 | 2.1% |
| Arts & Humanities | 0 | 0.0% |
| Total | 145 | 100.0% |
Transportation & Commute in Halls
Vehicle Availability by Sex in Halls
The most prevalent vehicle ownership categories in Halls are males with 2 vehicles (180, accounting for 44.4%) and females with 2 vehicles (128, making up 53.1%).
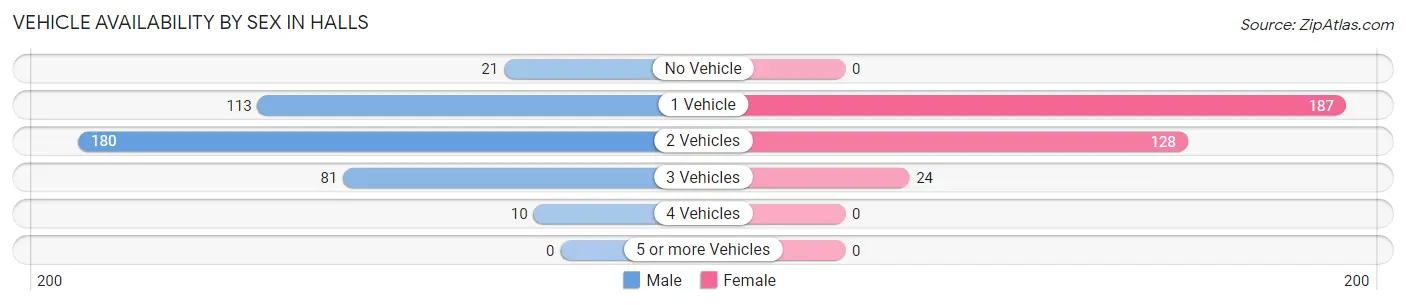
| Vehicles Available | Male | Female |
| No Vehicle | 21 (5.2%) | 0 (0.0%) |
| 1 Vehicle | 113 (27.9%) | 187 (55.2%) |
| 2 Vehicles | 180 (44.4%) | 128 (37.8%) |
| 3 Vehicles | 81 (20.0%) | 24 (7.1%) |
| 4 Vehicles | 10 (2.5%) | 0 (0.0%) |
| 5 or more Vehicles | 0 (0.0%) | 0 (0.0%) |
| Total | 405 (100.0%) | 339 (100.0%) |
Commute Time in Halls
The most frequently occuring commute durations in Halls are 20 to 24 minutes (158 commuters, 21.2%), 15 to 19 minutes (133 commuters, 17.8%), and 25 to 29 minutes (115 commuters, 15.4%).
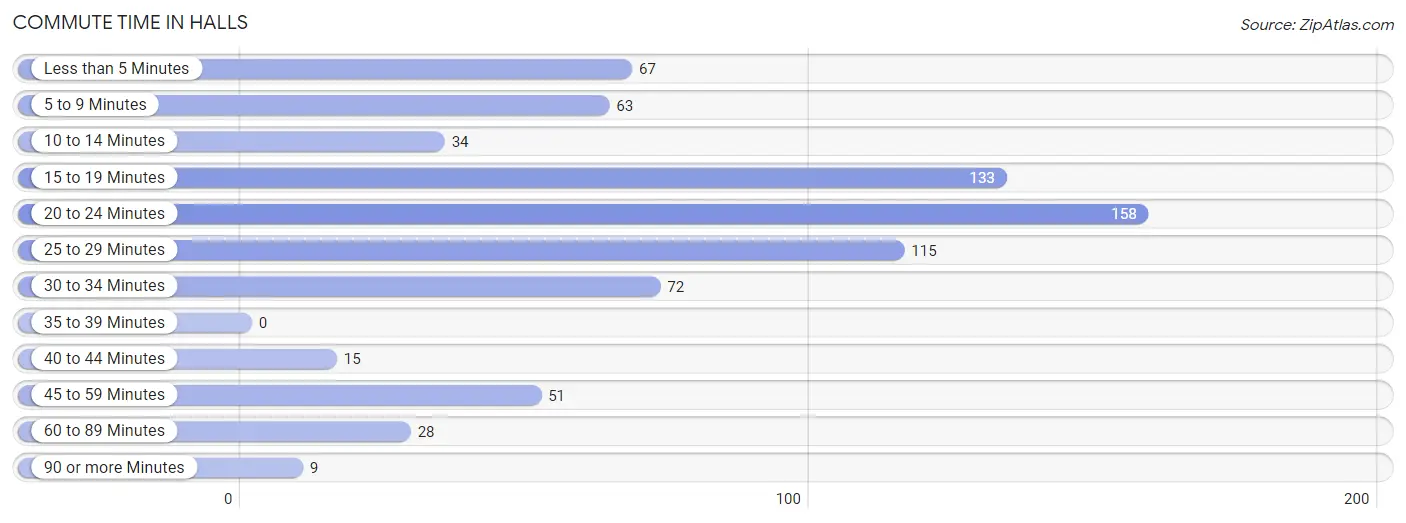
| Commute Time | # Commuters | % Commuters |
| Less than 5 Minutes | 67 | 9.0% |
| 5 to 9 Minutes | 63 | 8.5% |
| 10 to 14 Minutes | 34 | 4.6% |
| 15 to 19 Minutes | 133 | 17.8% |
| 20 to 24 Minutes | 158 | 21.2% |
| 25 to 29 Minutes | 115 | 15.4% |
| 30 to 34 Minutes | 72 | 9.7% |
| 35 to 39 Minutes | 0 | 0.0% |
| 40 to 44 Minutes | 15 | 2.0% |
| 45 to 59 Minutes | 51 | 6.9% |
| 60 to 89 Minutes | 28 | 3.8% |
| 90 or more Minutes | 9 | 1.2% |
Commute Time by Sex in Halls
The most common commute times in Halls are 20 to 24 minutes (90 commuters, 22.2%) for males and 20 to 24 minutes (68 commuters, 20.1%) for females.
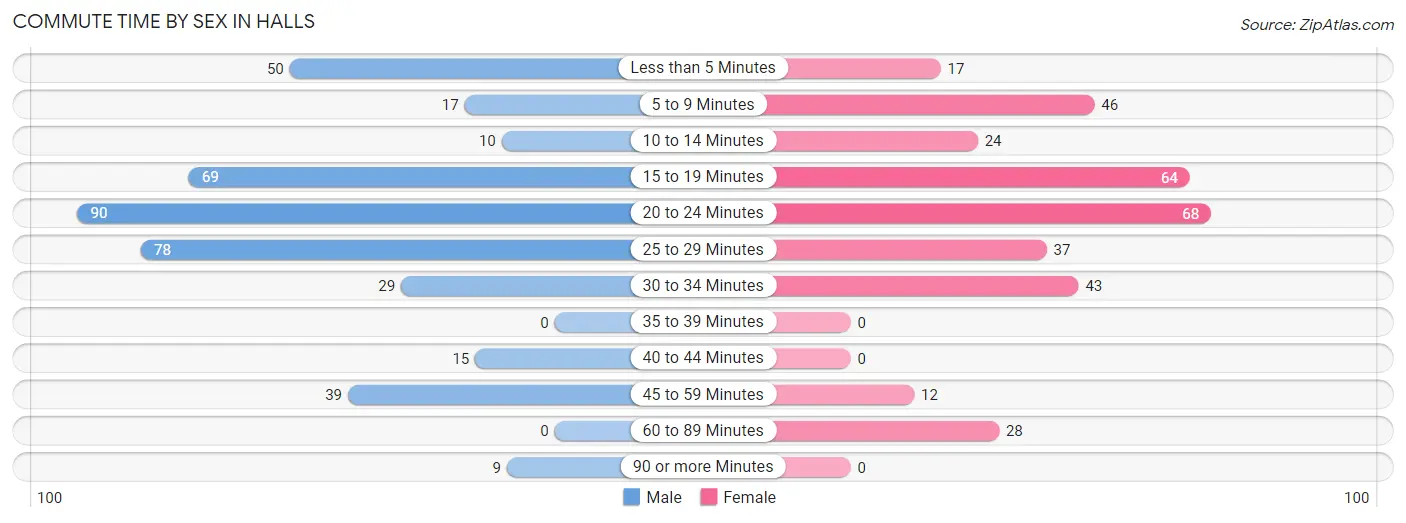
| Commute Time | Male | Female |
| Less than 5 Minutes | 50 (12.3%) | 17 (5.0%) |
| 5 to 9 Minutes | 17 (4.2%) | 46 (13.6%) |
| 10 to 14 Minutes | 10 (2.5%) | 24 (7.1%) |
| 15 to 19 Minutes | 69 (17.0%) | 64 (18.9%) |
| 20 to 24 Minutes | 90 (22.2%) | 68 (20.1%) |
| 25 to 29 Minutes | 78 (19.2%) | 37 (10.9%) |
| 30 to 34 Minutes | 29 (7.1%) | 43 (12.7%) |
| 35 to 39 Minutes | 0 (0.0%) | 0 (0.0%) |
| 40 to 44 Minutes | 15 (3.7%) | 0 (0.0%) |
| 45 to 59 Minutes | 39 (9.6%) | 12 (3.5%) |
| 60 to 89 Minutes | 0 (0.0%) | 28 (8.3%) |
| 90 or more Minutes | 9 (2.2%) | 0 (0.0%) |
Time of Departure to Work by Sex in Halls
The most frequent times of departure to work in Halls are 12:00 AM to 4:59 AM (65, 16.0%) for males and 7:00 AM to 7:29 AM (107, 31.6%) for females.
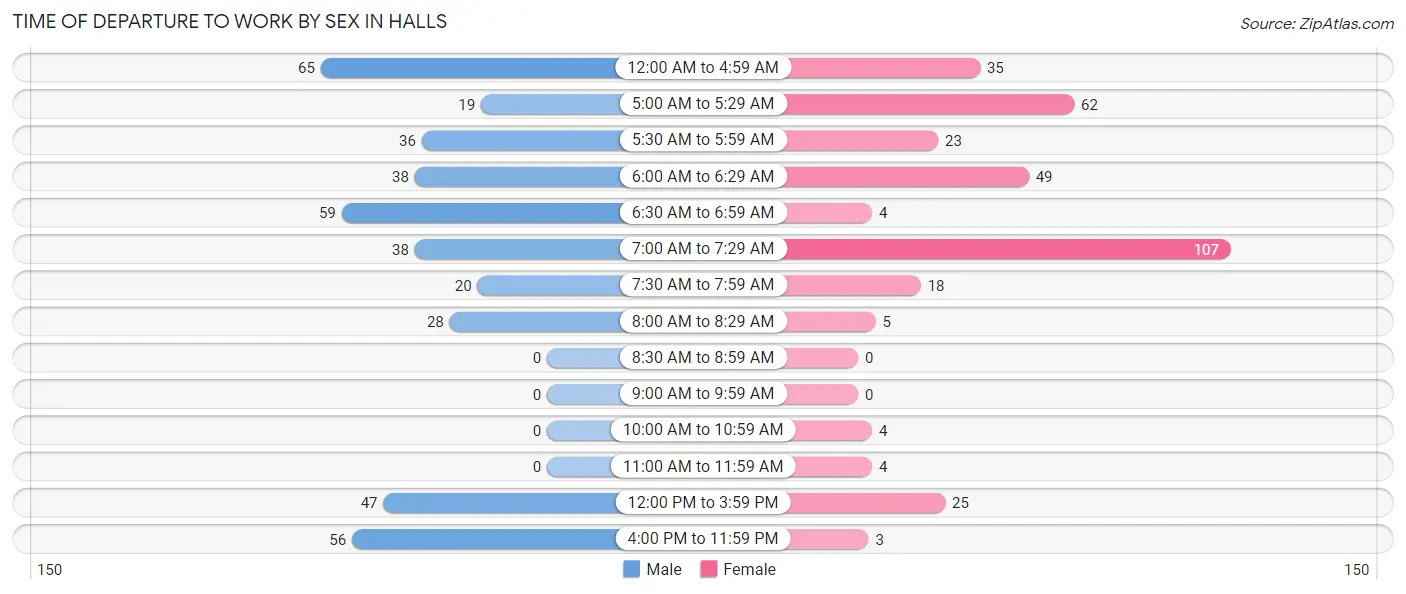
| Time of Departure | Male | Female |
| 12:00 AM to 4:59 AM | 65 (16.0%) | 35 (10.3%) |
| 5:00 AM to 5:29 AM | 19 (4.7%) | 62 (18.3%) |
| 5:30 AM to 5:59 AM | 36 (8.9%) | 23 (6.8%) |
| 6:00 AM to 6:29 AM | 38 (9.4%) | 49 (14.4%) |
| 6:30 AM to 6:59 AM | 59 (14.5%) | 4 (1.2%) |
| 7:00 AM to 7:29 AM | 38 (9.4%) | 107 (31.6%) |
| 7:30 AM to 7:59 AM | 20 (4.9%) | 18 (5.3%) |
| 8:00 AM to 8:29 AM | 28 (6.9%) | 5 (1.5%) |
| 8:30 AM to 8:59 AM | 0 (0.0%) | 0 (0.0%) |
| 9:00 AM to 9:59 AM | 0 (0.0%) | 0 (0.0%) |
| 10:00 AM to 10:59 AM | 0 (0.0%) | 4 (1.2%) |
| 11:00 AM to 11:59 AM | 0 (0.0%) | 4 (1.2%) |
| 12:00 PM to 3:59 PM | 47 (11.6%) | 25 (7.4%) |
| 4:00 PM to 11:59 PM | 56 (13.8%) | 3 (0.9%) |
| Total | 406 (100.0%) | 339 (100.0%) |
Housing Occupancy in Halls
Occupancy by Ownership in Halls
Of the total 891 dwellings in Halls, owner-occupied units account for 405 (45.5%), while renter-occupied units make up 486 (54.5%).
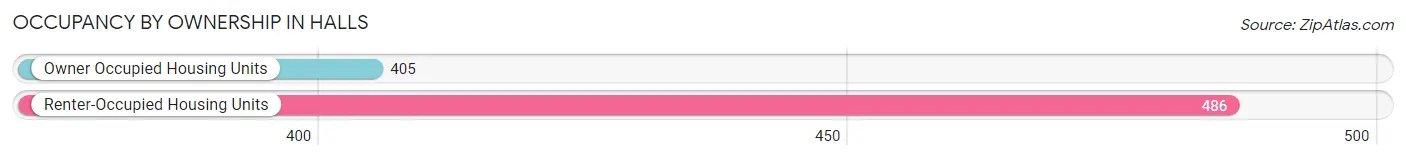
| Occupancy | # Housing Units | % Housing Units |
| Owner Occupied Housing Units | 405 | 45.5% |
| Renter-Occupied Housing Units | 486 | 54.5% |
| Total Occupied Housing Units | 891 | 100.0% |
Occupancy by Household Size in Halls
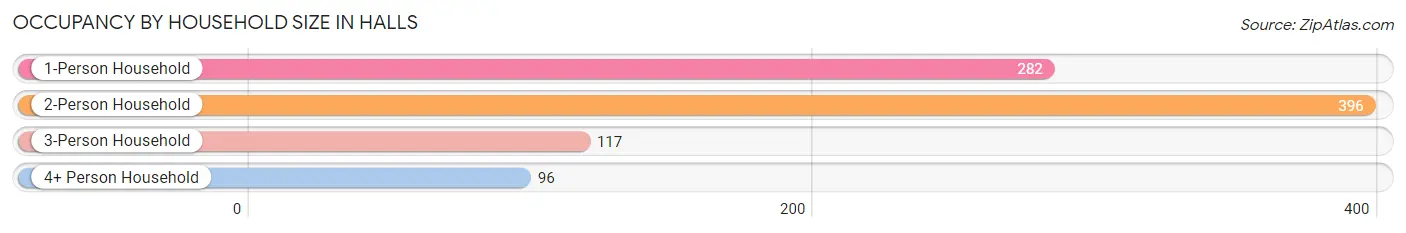
| Household Size | # Housing Units | % Housing Units |
| 1-Person Household | 282 | 31.7% |
| 2-Person Household | 396 | 44.4% |
| 3-Person Household | 117 | 13.1% |
| 4+ Person Household | 96 | 10.8% |
| Total Housing Units | 891 | 100.0% |
Occupancy by Ownership by Household Size in Halls
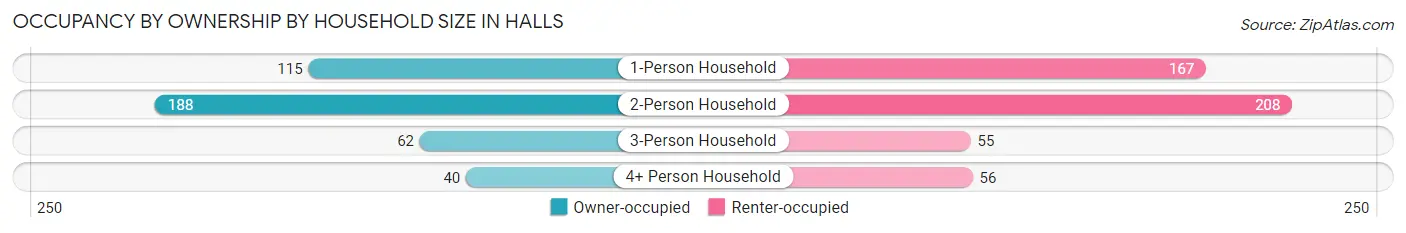
| Household Size | Owner-occupied | Renter-occupied |
| 1-Person Household | 115 (40.8%) | 167 (59.2%) |
| 2-Person Household | 188 (47.5%) | 208 (52.5%) |
| 3-Person Household | 62 (53.0%) | 55 (47.0%) |
| 4+ Person Household | 40 (41.7%) | 56 (58.3%) |
| Total Housing Units | 405 (45.5%) | 486 (54.5%) |
Occupancy by Educational Attainment in Halls
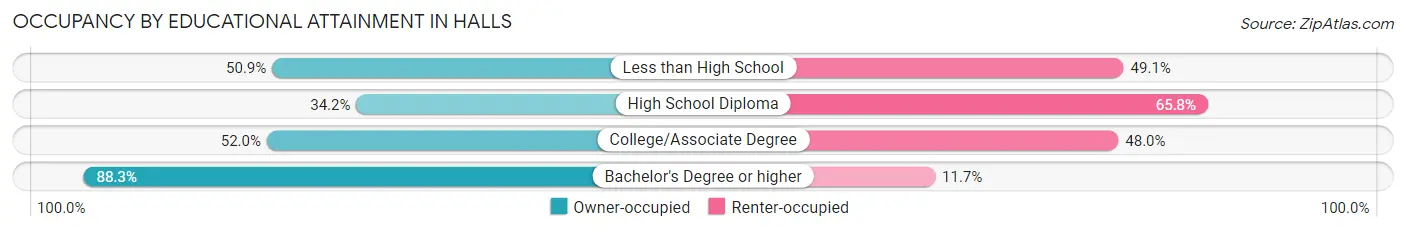
| Household Size | Owner-occupied | Renter-occupied |
| Less than High School | 55 (50.9%) | 53 (49.1%) |
| High School Diploma | 164 (34.2%) | 315 (65.8%) |
| College/Associate Degree | 118 (52.0%) | 109 (48.0%) |
| Bachelor's Degree or higher | 68 (88.3%) | 9 (11.7%) |
Occupancy by Age of Householder in Halls
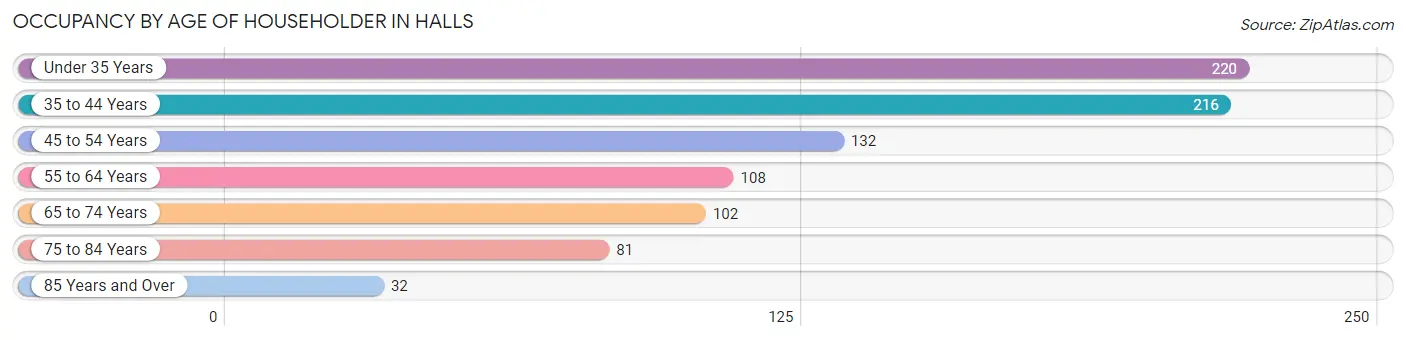
| Age Bracket | # Households | % Households |
| Under 35 Years | 220 | 24.7% |
| 35 to 44 Years | 216 | 24.2% |
| 45 to 54 Years | 132 | 14.8% |
| 55 to 64 Years | 108 | 12.1% |
| 65 to 74 Years | 102 | 11.5% |
| 75 to 84 Years | 81 | 9.1% |
| 85 Years and Over | 32 | 3.6% |
| Total | 891 | 100.0% |
Housing Finances in Halls
Median Income by Occupancy in Halls
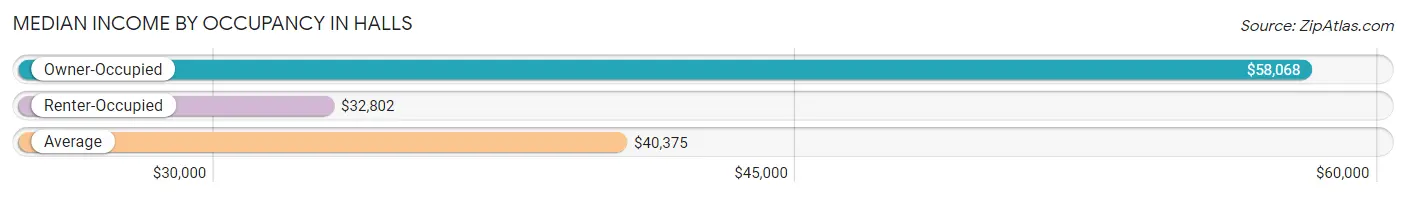
| Occupancy Type | # Households | Median Income |
| Owner-Occupied | 405 (45.5%) | $58,068 |
| Renter-Occupied | 486 (54.5%) | $32,802 |
| Average | 891 (100.0%) | $40,375 |
Occupancy by Householder Income Bracket in Halls
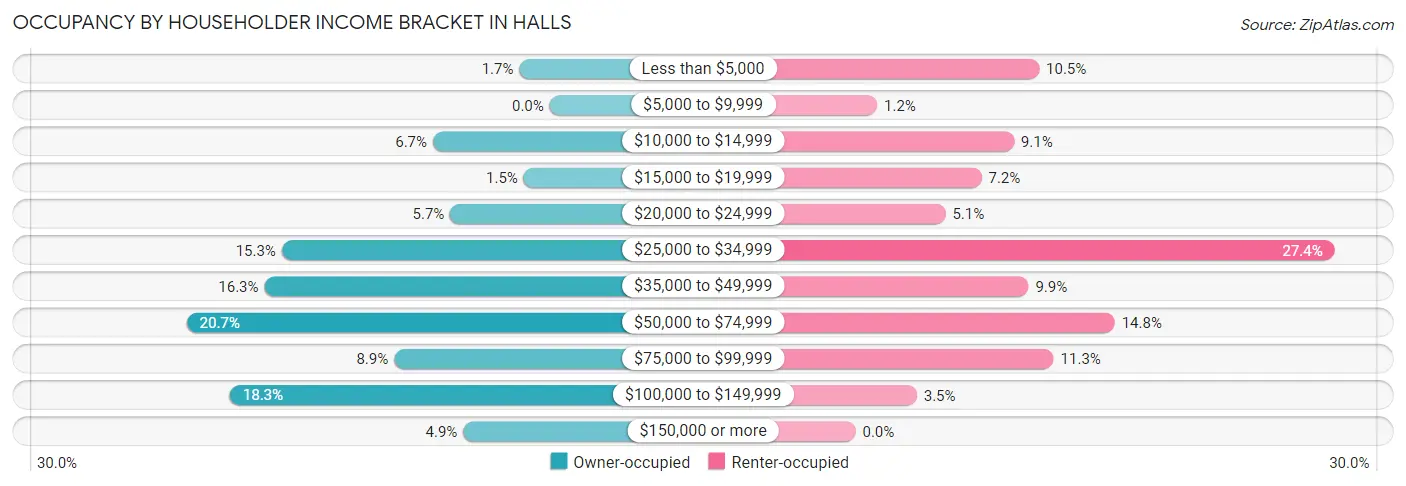
| Income Bracket | Owner-occupied | Renter-occupied |
| Less than $5,000 | 7 (1.7%) | 51 (10.5%) |
| $5,000 to $9,999 | 0 (0.0%) | 6 (1.2%) |
| $10,000 to $14,999 | 27 (6.7%) | 44 (9.0%) |
| $15,000 to $19,999 | 6 (1.5%) | 35 (7.2%) |
| $20,000 to $24,999 | 23 (5.7%) | 25 (5.1%) |
| $25,000 to $34,999 | 62 (15.3%) | 133 (27.4%) |
| $35,000 to $49,999 | 66 (16.3%) | 48 (9.9%) |
| $50,000 to $74,999 | 84 (20.7%) | 72 (14.8%) |
| $75,000 to $99,999 | 36 (8.9%) | 55 (11.3%) |
| $100,000 to $149,999 | 74 (18.3%) | 17 (3.5%) |
| $150,000 or more | 20 (4.9%) | 0 (0.0%) |
| Total | 405 (100.0%) | 486 (100.0%) |
Monthly Housing Cost Tiers in Halls
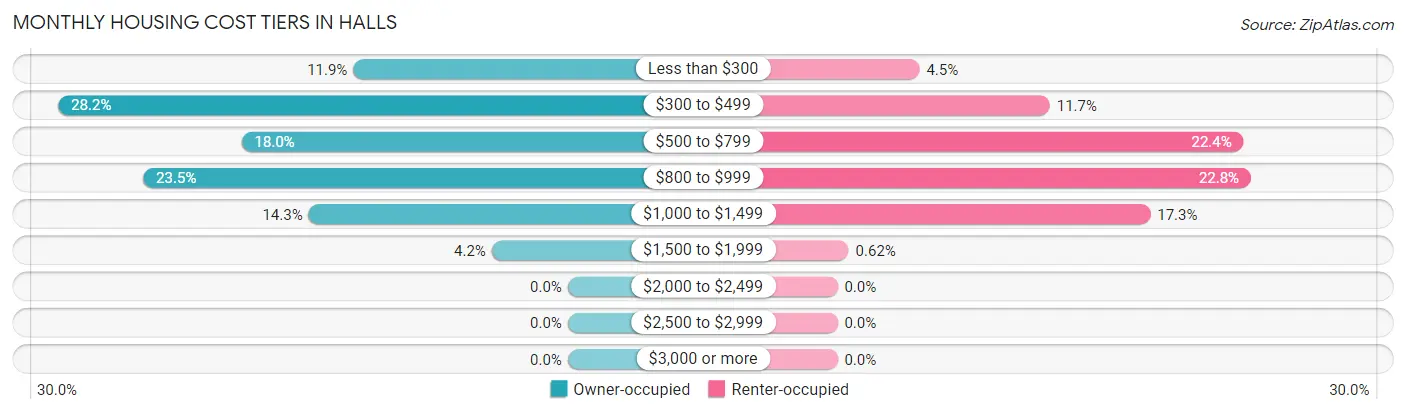
| Monthly Cost | Owner-occupied | Renter-occupied |
| Less than $300 | 48 (11.8%) | 22 (4.5%) |
| $300 to $499 | 114 (28.1%) | 57 (11.7%) |
| $500 to $799 | 73 (18.0%) | 109 (22.4%) |
| $800 to $999 | 95 (23.5%) | 111 (22.8%) |
| $1,000 to $1,499 | 58 (14.3%) | 84 (17.3%) |
| $1,500 to $1,999 | 17 (4.2%) | 3 (0.6%) |
| $2,000 to $2,499 | 0 (0.0%) | 0 (0.0%) |
| $2,500 to $2,999 | 0 (0.0%) | 0 (0.0%) |
| $3,000 or more | 0 (0.0%) | 0 (0.0%) |
| Total | 405 (100.0%) | 486 (100.0%) |
Physical Housing Characteristics in Halls
Housing Structures in Halls
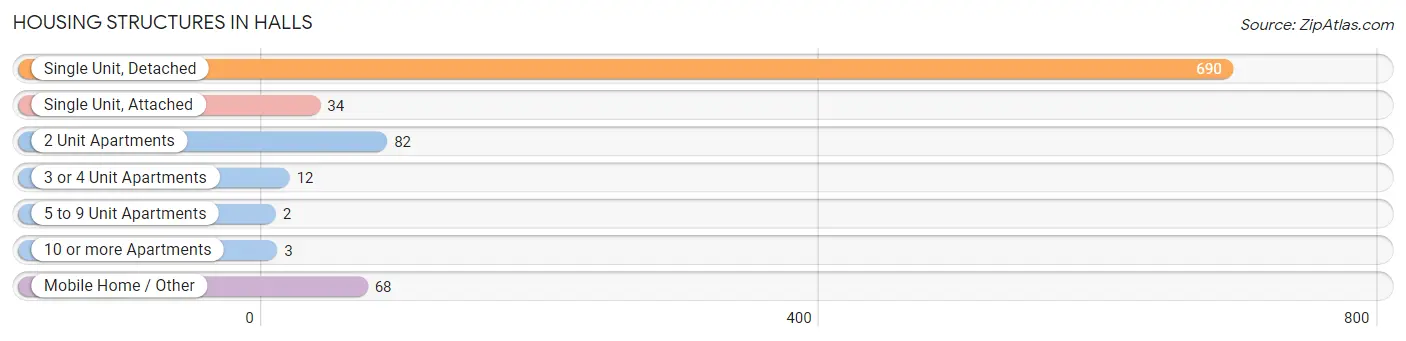
| Structure Type | # Housing Units | % Housing Units |
| Single Unit, Detached | 690 | 77.4% |
| Single Unit, Attached | 34 | 3.8% |
| 2 Unit Apartments | 82 | 9.2% |
| 3 or 4 Unit Apartments | 12 | 1.3% |
| 5 to 9 Unit Apartments | 2 | 0.2% |
| 10 or more Apartments | 3 | 0.3% |
| Mobile Home / Other | 68 | 7.6% |
| Total | 891 | 100.0% |
Housing Structures by Occupancy in Halls
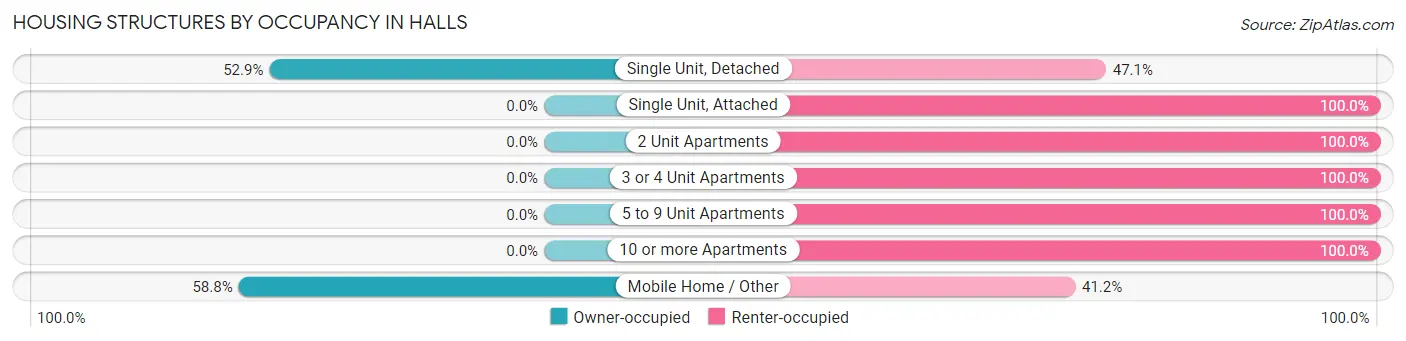
| Structure Type | Owner-occupied | Renter-occupied |
| Single Unit, Detached | 365 (52.9%) | 325 (47.1%) |
| Single Unit, Attached | 0 (0.0%) | 34 (100.0%) |
| 2 Unit Apartments | 0 (0.0%) | 82 (100.0%) |
| 3 or 4 Unit Apartments | 0 (0.0%) | 12 (100.0%) |
| 5 to 9 Unit Apartments | 0 (0.0%) | 2 (100.0%) |
| 10 or more Apartments | 0 (0.0%) | 3 (100.0%) |
| Mobile Home / Other | 40 (58.8%) | 28 (41.2%) |
| Total | 405 (45.5%) | 486 (54.5%) |
Housing Structures by Number of Rooms in Halls
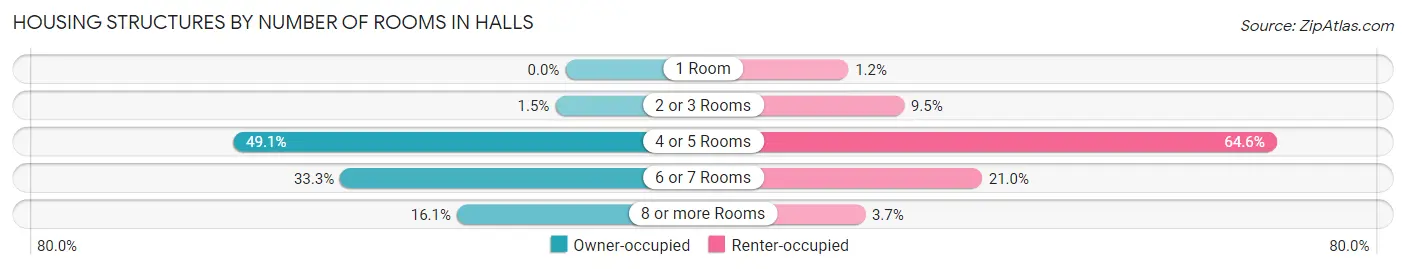
| Number of Rooms | Owner-occupied | Renter-occupied |
| 1 Room | 0 (0.0%) | 6 (1.2%) |
| 2 or 3 Rooms | 6 (1.5%) | 46 (9.5%) |
| 4 or 5 Rooms | 199 (49.1%) | 314 (64.6%) |
| 6 or 7 Rooms | 135 (33.3%) | 102 (21.0%) |
| 8 or more Rooms | 65 (16.1%) | 18 (3.7%) |
| Total | 405 (100.0%) | 486 (100.0%) |
Housing Structure by Heating Type in Halls
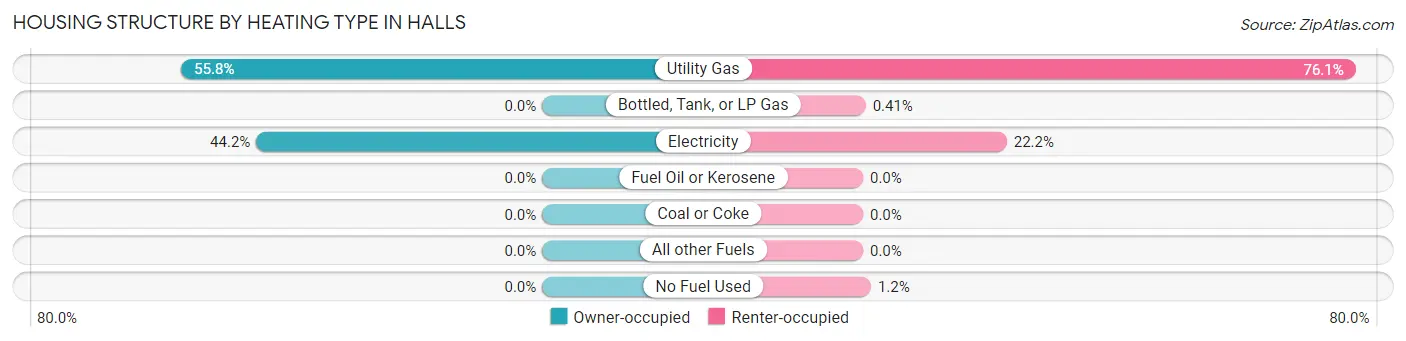
| Heating Type | Owner-occupied | Renter-occupied |
| Utility Gas | 226 (55.8%) | 370 (76.1%) |
| Bottled, Tank, or LP Gas | 0 (0.0%) | 2 (0.4%) |
| Electricity | 179 (44.2%) | 108 (22.2%) |
| Fuel Oil or Kerosene | 0 (0.0%) | 0 (0.0%) |
| Coal or Coke | 0 (0.0%) | 0 (0.0%) |
| All other Fuels | 0 (0.0%) | 0 (0.0%) |
| No Fuel Used | 0 (0.0%) | 6 (1.2%) |
| Total | 405 (100.0%) | 486 (100.0%) |
Household Vehicle Usage in Halls
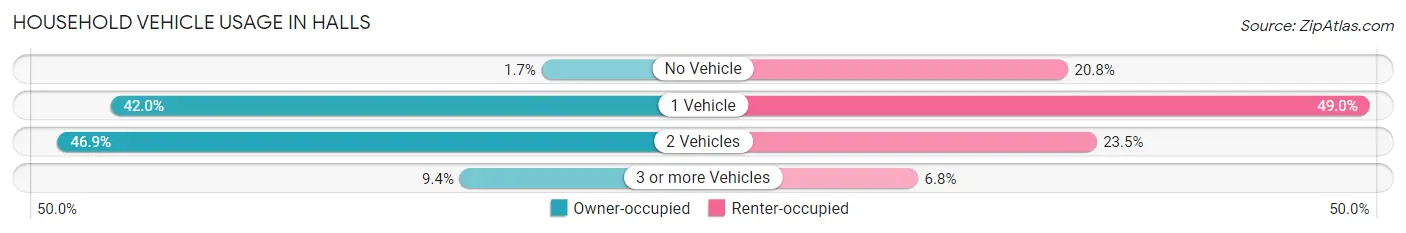
| Vehicles per Household | Owner-occupied | Renter-occupied |
| No Vehicle | 7 (1.7%) | 101 (20.8%) |
| 1 Vehicle | 170 (42.0%) | 238 (49.0%) |
| 2 Vehicles | 190 (46.9%) | 114 (23.5%) |
| 3 or more Vehicles | 38 (9.4%) | 33 (6.8%) |
| Total | 405 (100.0%) | 486 (100.0%) |
Real Estate & Mortgages in Halls
Real Estate and Mortgage Overview in Halls
| Characteristic | Without Mortgage | With Mortgage |
| Housing Units | 232 | 173 |
| Median Property Value | $89,400 | $81,900 |
| Median Household Income | $49,583 | $7 |
| Monthly Housing Costs | $461 | $0 |
| Real Estate Taxes | $916 | $3 |
Property Value by Mortgage Status in Halls
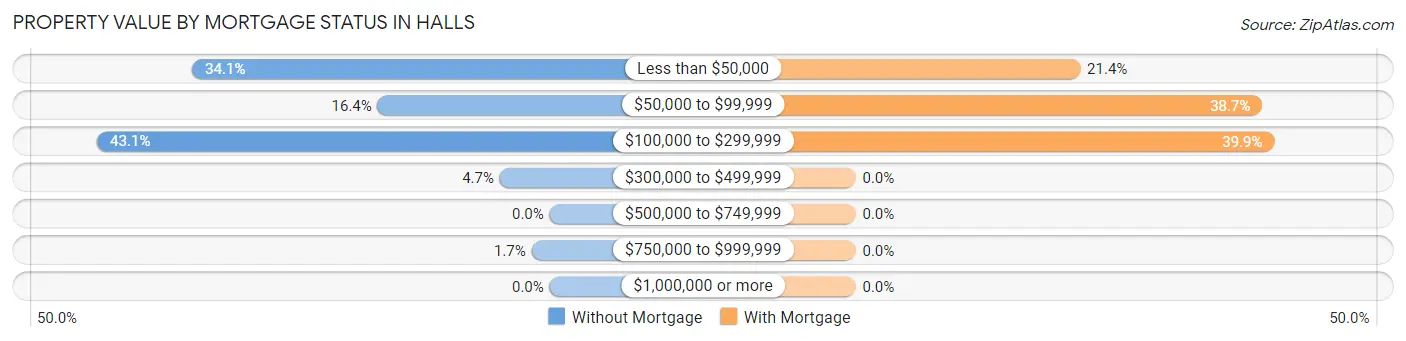
| Property Value | Without Mortgage | With Mortgage |
| Less than $50,000 | 79 (34.1%) | 37 (21.4%) |
| $50,000 to $99,999 | 38 (16.4%) | 67 (38.7%) |
| $100,000 to $299,999 | 100 (43.1%) | 69 (39.9%) |
| $300,000 to $499,999 | 11 (4.7%) | 0 (0.0%) |
| $500,000 to $749,999 | 0 (0.0%) | 0 (0.0%) |
| $750,000 to $999,999 | 4 (1.7%) | 0 (0.0%) |
| $1,000,000 or more | 0 (0.0%) | 0 (0.0%) |
| Total | 232 (100.0%) | 173 (100.0%) |
Household Income by Mortgage Status in Halls
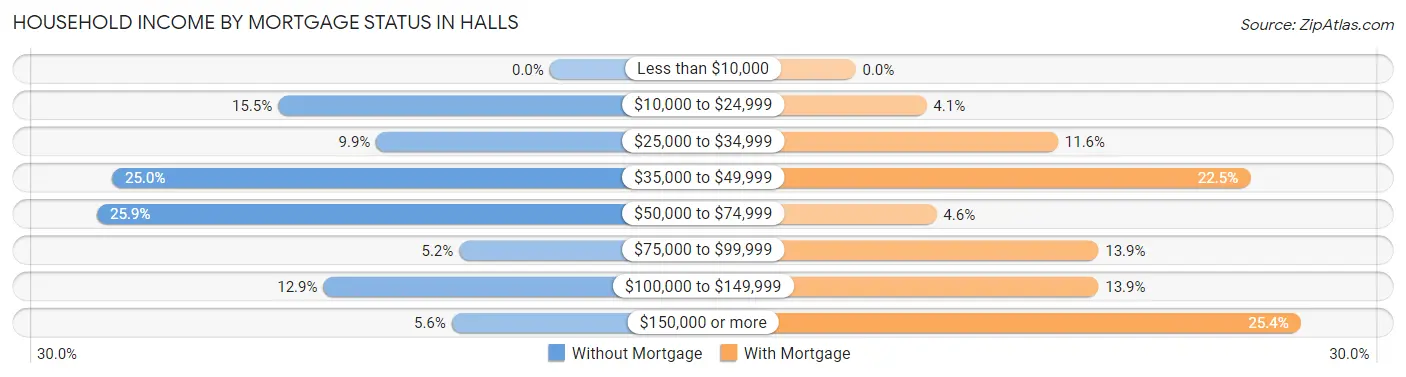
| Household Income | Without Mortgage | With Mortgage |
| Less than $10,000 | 0 (0.0%) | 0 (0.0%) |
| $10,000 to $24,999 | 36 (15.5%) | 7 (4.1%) |
| $25,000 to $34,999 | 23 (9.9%) | 20 (11.6%) |
| $35,000 to $49,999 | 58 (25.0%) | 39 (22.5%) |
| $50,000 to $74,999 | 60 (25.9%) | 8 (4.6%) |
| $75,000 to $99,999 | 12 (5.2%) | 24 (13.9%) |
| $100,000 to $149,999 | 30 (12.9%) | 24 (13.9%) |
| $150,000 or more | 13 (5.6%) | 44 (25.4%) |
| Total | 232 (100.0%) | 173 (100.0%) |
Property Value to Household Income Ratio in Halls
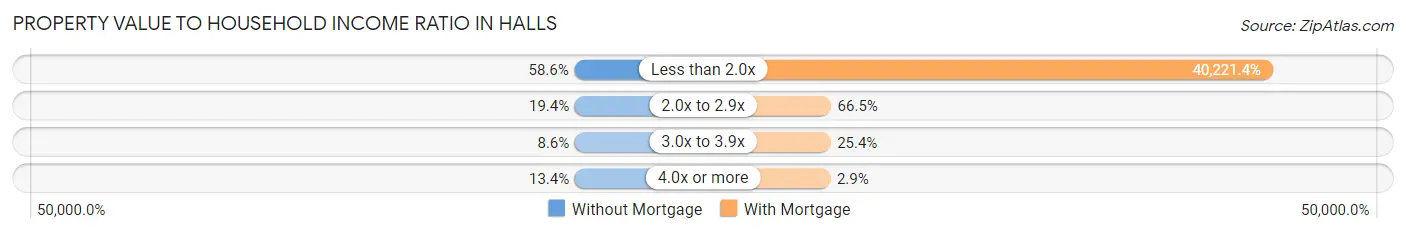
| Value-to-Income Ratio | Without Mortgage | With Mortgage |
| Less than 2.0x | 136 (58.6%) | 69,583 (40,221.4%) |
| 2.0x to 2.9x | 45 (19.4%) | 115 (66.5%) |
| 3.0x to 3.9x | 20 (8.6%) | 44 (25.4%) |
| 4.0x or more | 31 (13.4%) | 5 (2.9%) |
| Total | 232 (100.0%) | 173 (100.0%) |
Real Estate Taxes by Mortgage Status in Halls
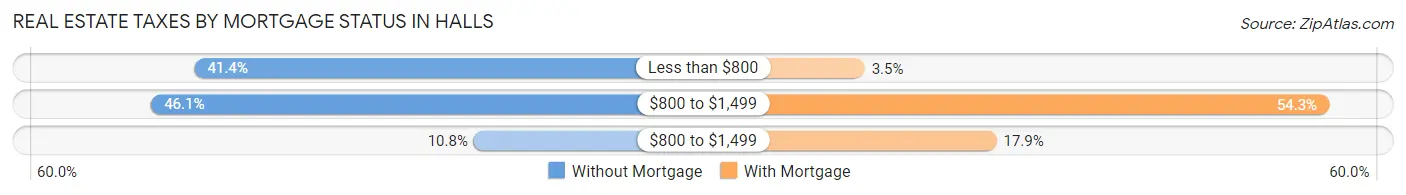
| Property Taxes | Without Mortgage | With Mortgage |
| Less than $800 | 96 (41.4%) | 6 (3.5%) |
| $800 to $1,499 | 107 (46.1%) | 94 (54.3%) |
| $800 to $1,499 | 25 (10.8%) | 31 (17.9%) |
| Total | 232 (100.0%) | 173 (100.0%) |
Health & Disability in Halls
Health Insurance Coverage by Age in Halls
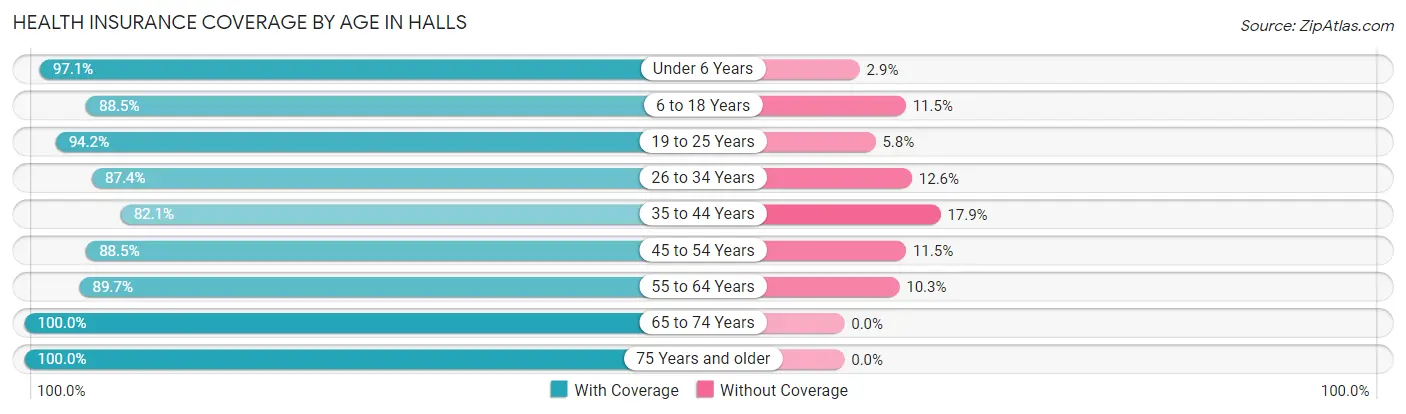
| Age Bracket | With Coverage | Without Coverage |
| Under 6 Years | 136 (97.1%) | 4 (2.9%) |
| 6 to 18 Years | 340 (88.5%) | 44 (11.5%) |
| 19 to 25 Years | 146 (94.2%) | 9 (5.8%) |
| 26 to 34 Years | 215 (87.4%) | 31 (12.6%) |
| 35 to 44 Years | 238 (82.1%) | 52 (17.9%) |
| 45 to 54 Years | 200 (88.5%) | 26 (11.5%) |
| 55 to 64 Years | 140 (89.7%) | 16 (10.3%) |
| 65 to 74 Years | 155 (100.0%) | 0 (0.0%) |
| 75 Years and older | 167 (100.0%) | 0 (0.0%) |
| Total | 1,737 (90.5%) | 182 (9.5%) |
Health Insurance Coverage by Citizenship Status in Halls
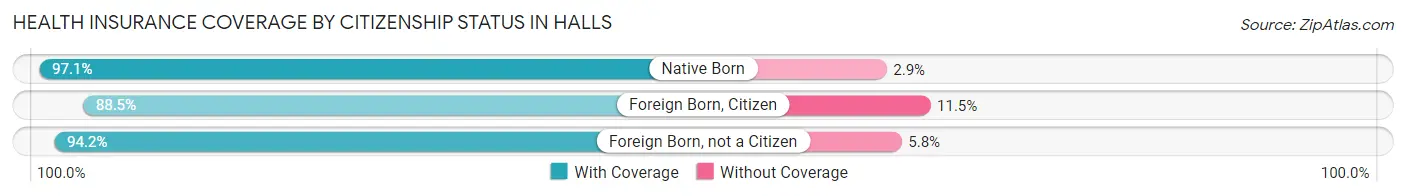
| Citizenship Status | With Coverage | Without Coverage |
| Native Born | 136 (97.1%) | 4 (2.9%) |
| Foreign Born, Citizen | 340 (88.5%) | 44 (11.5%) |
| Foreign Born, not a Citizen | 146 (94.2%) | 9 (5.8%) |
Health Insurance Coverage by Household Income in Halls
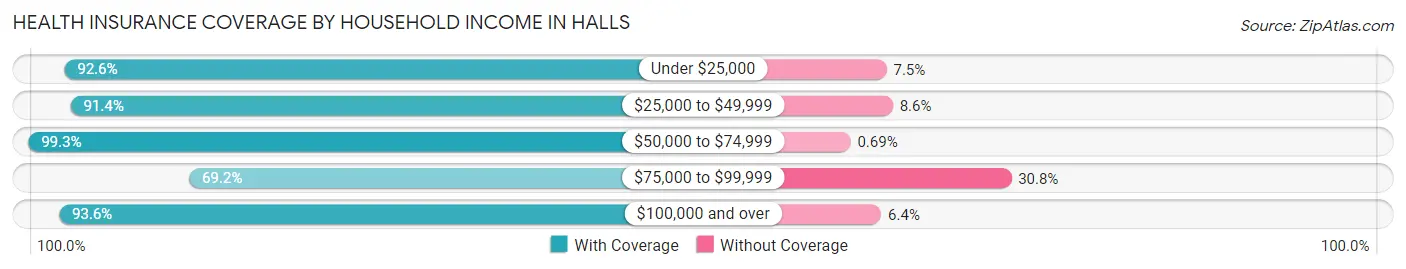
| Household Income | With Coverage | Without Coverage |
| Under $25,000 | 348 (92.5%) | 28 (7.4%) |
| $25,000 to $49,999 | 521 (91.4%) | 49 (8.6%) |
| $50,000 to $74,999 | 429 (99.3%) | 3 (0.7%) |
| $75,000 to $99,999 | 191 (69.2%) | 85 (30.8%) |
| $100,000 and over | 247 (93.6%) | 17 (6.4%) |
Public vs Private Health Insurance Coverage by Age in Halls
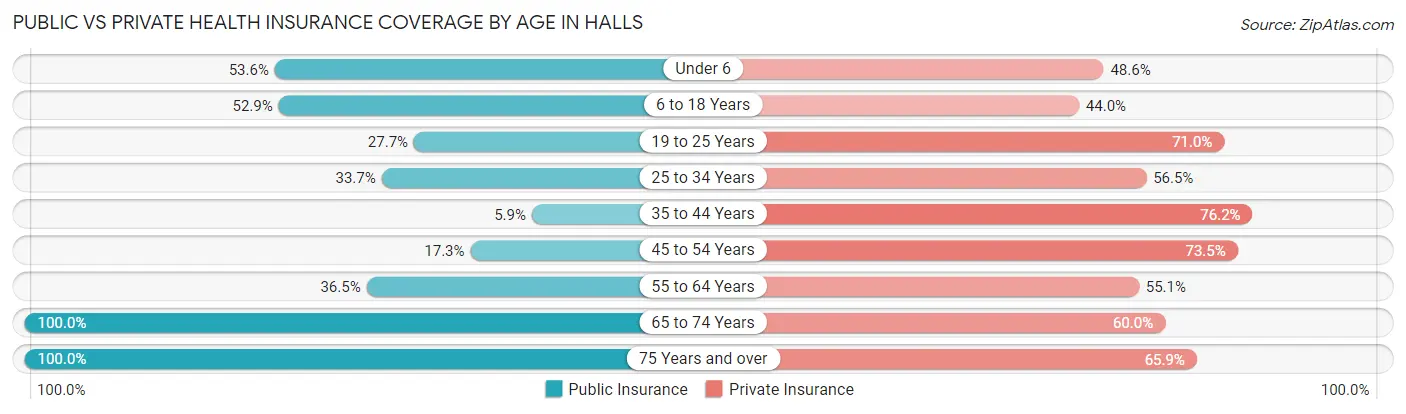
| Age Bracket | Public Insurance | Private Insurance |
| Under 6 | 75 (53.6%) | 68 (48.6%) |
| 6 to 18 Years | 203 (52.9%) | 169 (44.0%) |
| 19 to 25 Years | 43 (27.7%) | 110 (71.0%) |
| 25 to 34 Years | 83 (33.7%) | 139 (56.5%) |
| 35 to 44 Years | 17 (5.9%) | 221 (76.2%) |
| 45 to 54 Years | 39 (17.3%) | 166 (73.5%) |
| 55 to 64 Years | 57 (36.5%) | 86 (55.1%) |
| 65 to 74 Years | 155 (100.0%) | 93 (60.0%) |
| 75 Years and over | 167 (100.0%) | 110 (65.9%) |
| Total | 839 (43.7%) | 1,162 (60.6%) |
Disability Status by Sex by Age in Halls
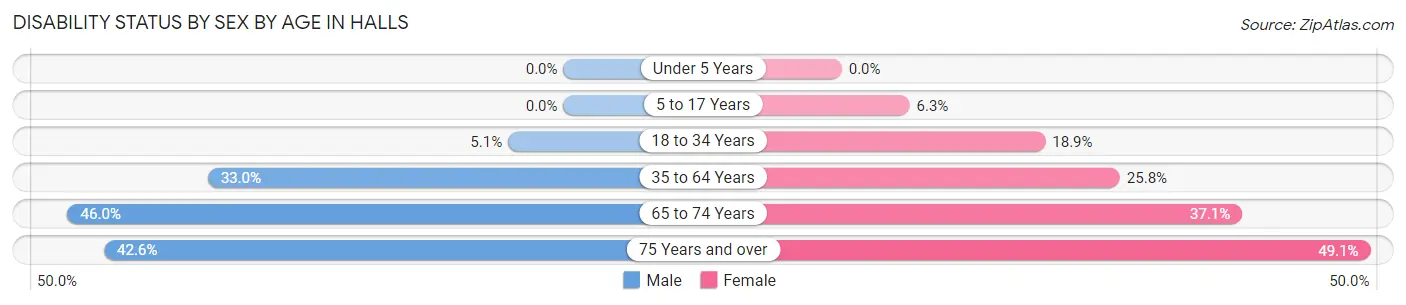
| Age Bracket | Male | Female |
| Under 5 Years | 0 (0.0%) | 0 (0.0%) |
| 5 to 17 Years | 0 (0.0%) | 9 (6.3%) |
| 18 to 34 Years | 11 (5.1%) | 51 (18.9%) |
| 35 to 64 Years | 99 (33.0%) | 96 (25.8%) |
| 65 to 74 Years | 23 (46.0%) | 39 (37.1%) |
| 75 Years and over | 26 (42.6%) | 52 (49.1%) |
Disability Class by Sex by Age in Halls
Disability Class: Hearing Difficulty
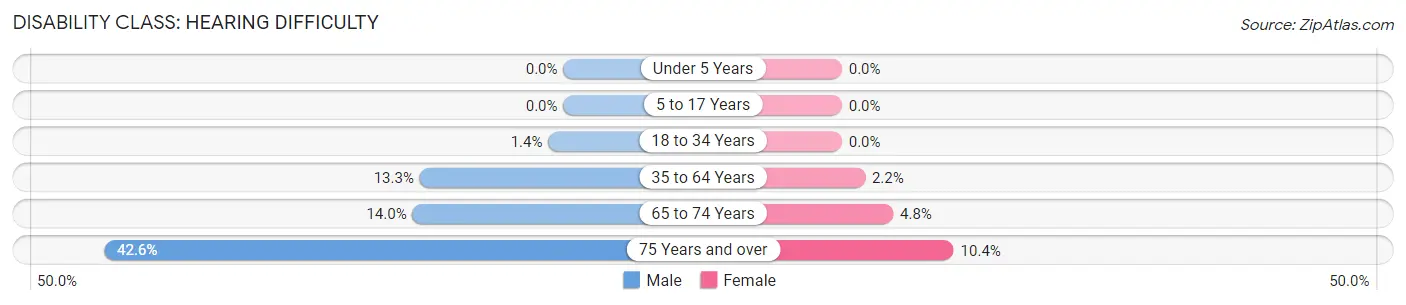
| Age Bracket | Male | Female |
| Under 5 Years | 0 (0.0%) | 0 (0.0%) |
| 5 to 17 Years | 0 (0.0%) | 0 (0.0%) |
| 18 to 34 Years | 3 (1.4%) | 0 (0.0%) |
| 35 to 64 Years | 40 (13.3%) | 8 (2.1%) |
| 65 to 74 Years | 7 (14.0%) | 5 (4.8%) |
| 75 Years and over | 26 (42.6%) | 11 (10.4%) |
Disability Class: Vision Difficulty
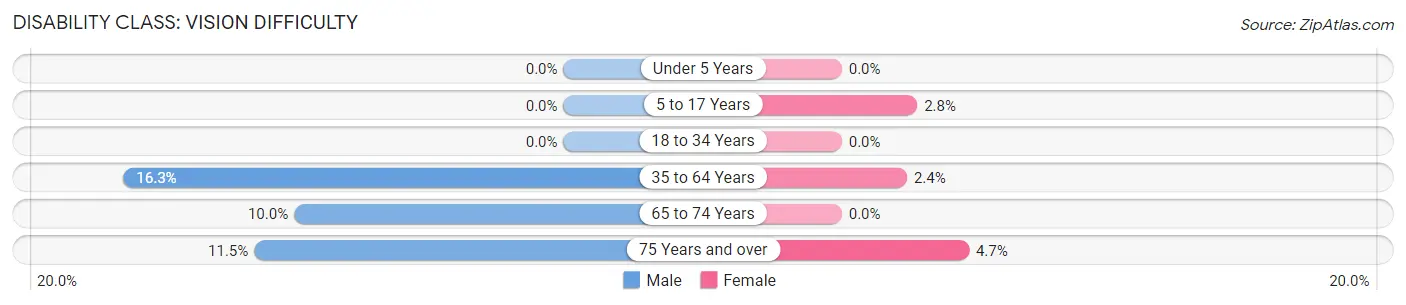
| Age Bracket | Male | Female |
| Under 5 Years | 0 (0.0%) | 0 (0.0%) |
| 5 to 17 Years | 0 (0.0%) | 4 (2.8%) |
| 18 to 34 Years | 0 (0.0%) | 0 (0.0%) |
| 35 to 64 Years | 49 (16.3%) | 9 (2.4%) |
| 65 to 74 Years | 5 (10.0%) | 0 (0.0%) |
| 75 Years and over | 7 (11.5%) | 5 (4.7%) |
Disability Class: Cognitive Difficulty
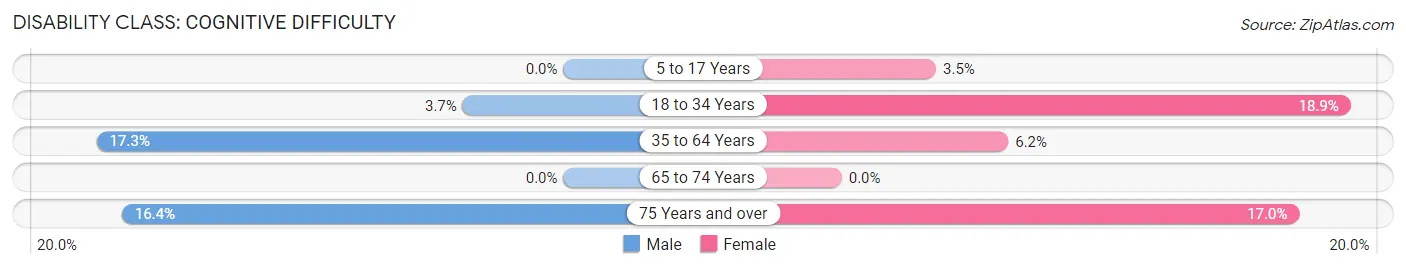
| Age Bracket | Male | Female |
| 5 to 17 Years | 0 (0.0%) | 5 (3.5%) |
| 18 to 34 Years | 8 (3.7%) | 51 (18.9%) |
| 35 to 64 Years | 52 (17.3%) | 23 (6.2%) |
| 65 to 74 Years | 0 (0.0%) | 0 (0.0%) |
| 75 Years and over | 10 (16.4%) | 18 (17.0%) |
Disability Class: Ambulatory Difficulty
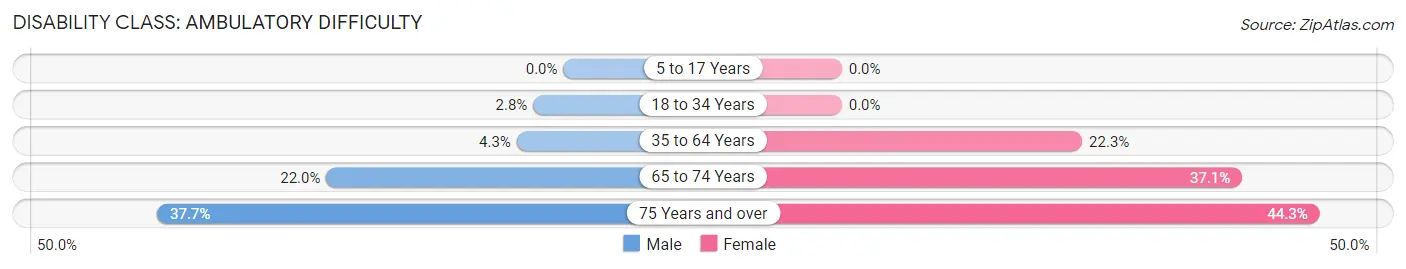
| Age Bracket | Male | Female |
| 5 to 17 Years | 0 (0.0%) | 0 (0.0%) |
| 18 to 34 Years | 6 (2.8%) | 0 (0.0%) |
| 35 to 64 Years | 13 (4.3%) | 83 (22.3%) |
| 65 to 74 Years | 11 (22.0%) | 39 (37.1%) |
| 75 Years and over | 23 (37.7%) | 47 (44.3%) |
Disability Class: Self-Care Difficulty
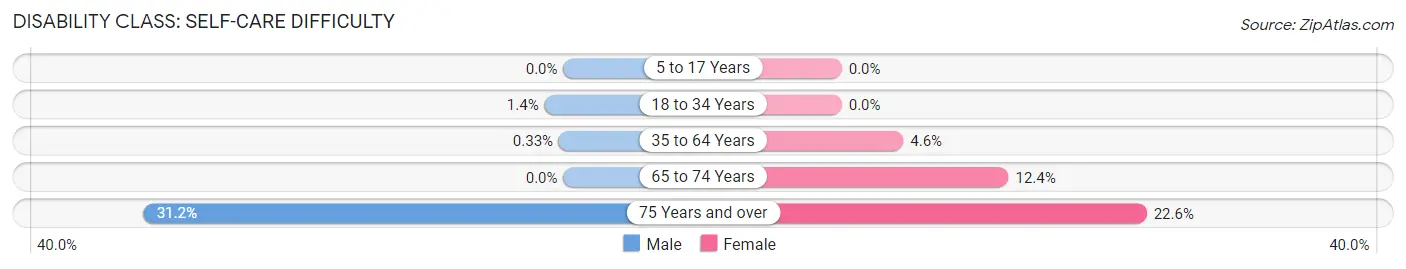
| Age Bracket | Male | Female |
| 5 to 17 Years | 0 (0.0%) | 0 (0.0%) |
| 18 to 34 Years | 3 (1.4%) | 0 (0.0%) |
| 35 to 64 Years | 1 (0.3%) | 17 (4.6%) |
| 65 to 74 Years | 0 (0.0%) | 13 (12.4%) |
| 75 Years and over | 19 (31.1%) | 24 (22.6%) |
Technology Access in Halls
Computing Device Access in Halls
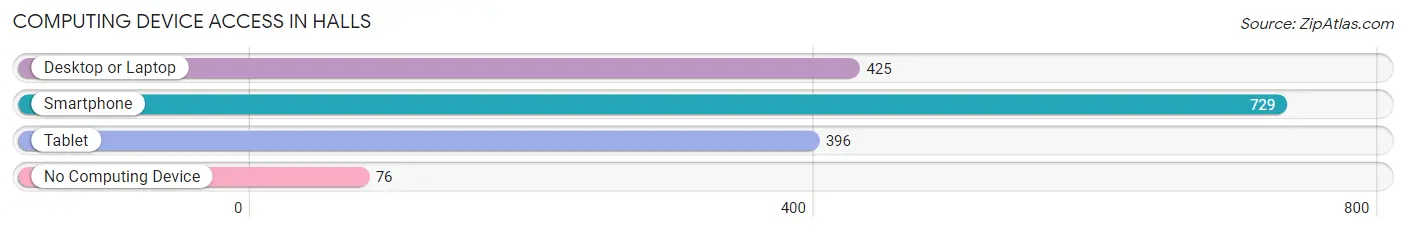
| Device Type | # Households | % Households |
| Desktop or Laptop | 425 | 47.7% |
| Smartphone | 729 | 81.8% |
| Tablet | 396 | 44.4% |
| No Computing Device | 76 | 8.5% |
| Total | 891 | 100.0% |
Internet Access in Halls
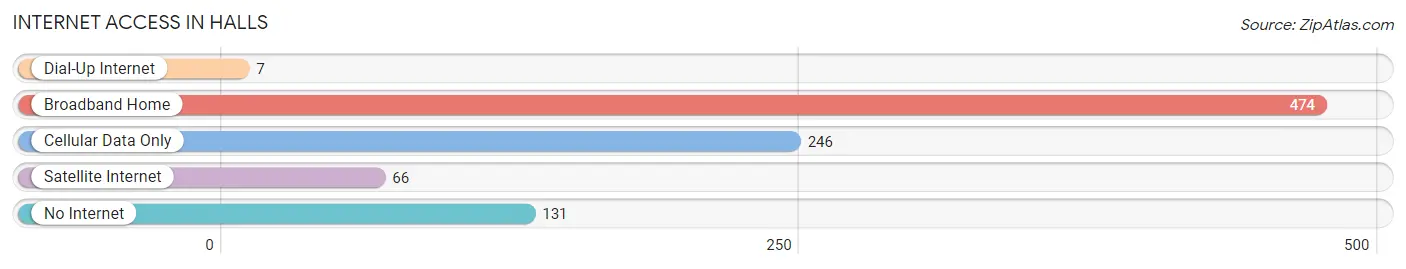
| Internet Type | # Households | % Households |
| Dial-Up Internet | 7 | 0.8% |
| Broadband Home | 474 | 53.2% |
| Cellular Data Only | 246 | 27.6% |
| Satellite Internet | 66 | 7.4% |
| No Internet | 131 | 14.7% |
| Total | 891 | 100.0% |
Halls Summary
Halls is a small town located in the northwest corner of Tennessee, in the United States. It is part of the greater Knoxville metropolitan area and is situated in the foothills of the Great Smoky Mountains. The town has a population of approximately 5,000 people and is known for its rural charm and friendly atmosphere.
History
Halls was first settled in the early 1800s by a group of settlers from North Carolina. The town was originally known as “Halls Crossroads” and was named after the Halls family, who were among the first settlers. The town was officially incorporated in 1875 and has remained a small, rural community ever since.
Geography
Halls is located in the northwest corner of Tennessee, in the foothills of the Great Smoky Mountains. The town is situated along the banks of the Holston River and is surrounded by rolling hills and lush forests. The town is located approximately 20 miles from Knoxville and is easily accessible by car or bus.
Economy
Halls is a small, rural community and the economy is largely based on agriculture. The town is home to several farms and ranches, as well as a few small businesses. The town also has a few manufacturing plants, which provide jobs for many of the town’s residents.
Demographics
As of the 2010 census, Halls had a population of 5,000 people. The town is predominantly white, with a small African American population. The median household income is approximately $35,000 and the median home value is around $100,000.
Halls is a small, rural town with a friendly atmosphere and a strong sense of community. The town is known for its agricultural roots and its close proximity to the Great Smoky Mountains. The town is a great place to live and work, and is a great place to raise a family.
Common Questions
What is Per Capita Income in Halls?
Per Capita income in Halls is $25,850.
What is the Median Family Income in Halls?
Median Family Income in Halls is $44,954.
What is the Median Household income in Halls?
Median Household Income in Halls is $40,375.
What is Income or Wage Gap in Halls?
Income or Wage Gap in Halls is 21.6%.
Women in Halls earn 78.4 cents for every dollar earned by a man.
What is Inequality or Gini Index in Halls?
Inequality or Gini Index in Halls is 0.42.
What is the Total Population of Halls?
Total Population of Halls is 1,919.
What is the Total Male Population of Halls?
Total Male Population of Halls is 847.
What is the Total Female Population of Halls?
Total Female Population of Halls is 1,072.
What is the Ratio of Males per 100 Females in Halls?
There are 79.01 Males per 100 Females in Halls.
What is the Ratio of Females per 100 Males in Halls?
There are 126.56 Females per 100 Males in Halls.
What is the Median Population Age in Halls?
Median Population Age in Halls is 36.8 Years.
What is the Average Family Size in Halls
Average Family Size in Halls is 2.6 People.
What is the Average Household Size in Halls
Average Household Size in Halls is 2.1 People.
How Large is the Labor Force in Halls?
There are 796 People in the Labor Forcein in Halls.
What is the Percentage of People in the Labor Force in Halls?
53.4% of People are in the Labor Force in Halls.
What is the Unemployment Rate in Halls?
Unemployment Rate in Halls is 2.3%.