Clifton, TN Map & Demographics
Clifton Map
Clifton Overview
$11,789
PER CAPITA INCOME
$50,208
AVG FAMILY INCOME
$45,145
AVG HOUSEHOLD INCOME
49.2%
WAGE / INCOME GAP [ % ]
50.8¢/ $1
WAGE / INCOME GAP [ $ ]
0.38
INEQUALITY / GINI INDEX
2,622
TOTAL POPULATION
2,192
MALE POPULATION
430
FEMALE POPULATION
509.77
MALES / 100 FEMALES
19.62
FEMALES / 100 MALES
44.5
MEDIAN AGE
3.5
AVG FAMILY SIZE
3.1
AVG HOUSEHOLD SIZE
377
LABOR FORCE [ PEOPLE ]
15.9%
PERCENT IN LABOR FORCE
3.2%
UNEMPLOYMENT RATE
Clifton Zip Codes
Clifton Area Codes
Income in Clifton
Income Overview in Clifton
Per Capita Income in Clifton is $11,789, while median incomes of families and households are $50,208 and $45,145 respectively.
| Characteristic | Number | Measure |
| Per Capita Income | 2,622 | $11,789 |
| Median Family Income | 232 | $50,208 |
| Mean Family Income | 232 | $56,471 |
| Median Household Income | 363 | $45,145 |
| Mean Household Income | 363 | $50,034 |
| Income Deficit | 232 | $0 |
| Wage / Income Gap (%) | 2,622 | 49.23% |
| Wage / Income Gap ($) | 2,622 | 50.77¢ per $1 |
| Gini / Inequality Index | 2,622 | 0.38 |
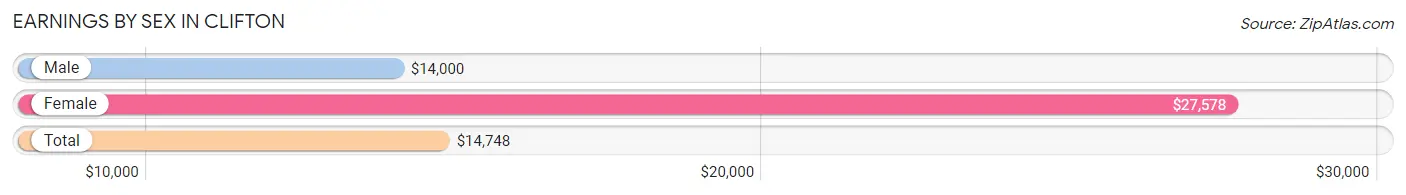
Earnings by Sex in Clifton
Average Earnings in Clifton are $14,748, $14,000 for men and $27,578 for women, a difference of 49.2%.
| Sex | Number | Average Earnings |
| Male | 836 (82.0%) | $14,000 |
| Female | 183 (18.0%) | $27,578 |
| Total | 1,019 (100.0%) | $14,748 |
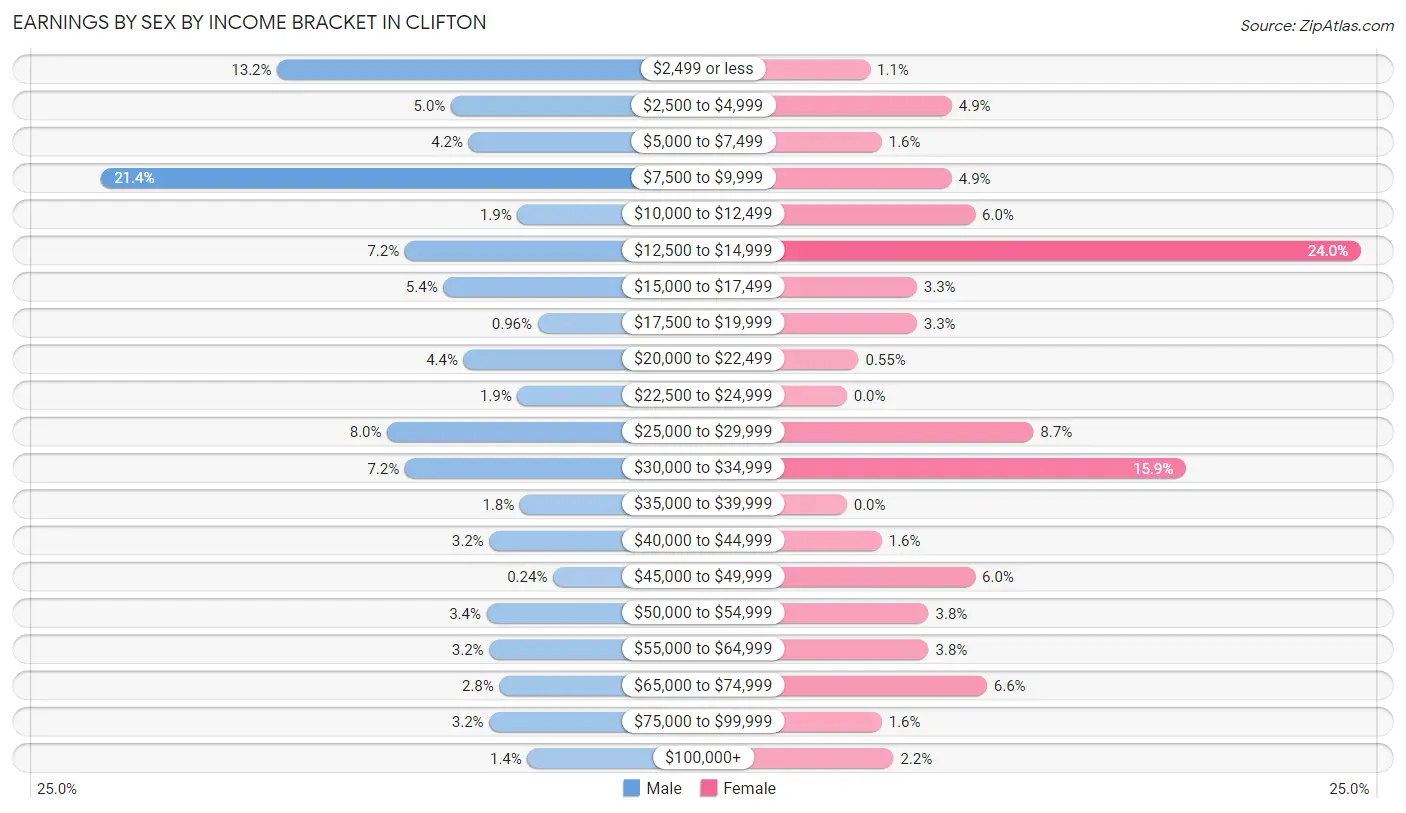
Earnings by Sex by Income Bracket in Clifton
The most common earnings brackets in Clifton are $7,500 to $9,999 for men (179 | 21.4%) and $12,500 to $14,999 for women (44 | 24.0%).
| Income | Male | Female |
| $2,499 or less | 110 (13.2%) | 2 (1.1%) |
| $2,500 to $4,999 | 42 (5.0%) | 9 (4.9%) |
| $5,000 to $7,499 | 35 (4.2%) | 3 (1.6%) |
| $7,500 to $9,999 | 179 (21.4%) | 9 (4.9%) |
| $10,000 to $12,499 | 16 (1.9%) | 11 (6.0%) |
| $12,500 to $14,999 | 60 (7.2%) | 44 (24.0%) |
| $15,000 to $17,499 | 45 (5.4%) | 6 (3.3%) |
| $17,500 to $19,999 | 8 (1.0%) | 6 (3.3%) |
| $20,000 to $22,499 | 37 (4.4%) | 1 (0.5%) |
| $22,500 to $24,999 | 16 (1.9%) | 0 (0.0%) |
| $25,000 to $29,999 | 67 (8.0%) | 16 (8.7%) |
| $30,000 to $34,999 | 60 (7.2%) | 29 (15.9%) |
| $35,000 to $39,999 | 15 (1.8%) | 0 (0.0%) |
| $40,000 to $44,999 | 27 (3.2%) | 3 (1.6%) |
| $45,000 to $49,999 | 2 (0.2%) | 11 (6.0%) |
| $50,000 to $54,999 | 28 (3.4%) | 7 (3.8%) |
| $55,000 to $64,999 | 27 (3.2%) | 7 (3.8%) |
| $65,000 to $74,999 | 23 (2.8%) | 12 (6.6%) |
| $75,000 to $99,999 | 27 (3.2%) | 3 (1.6%) |
| $100,000+ | 12 (1.4%) | 4 (2.2%) |
| Total | 836 (100.0%) | 183 (100.0%) |
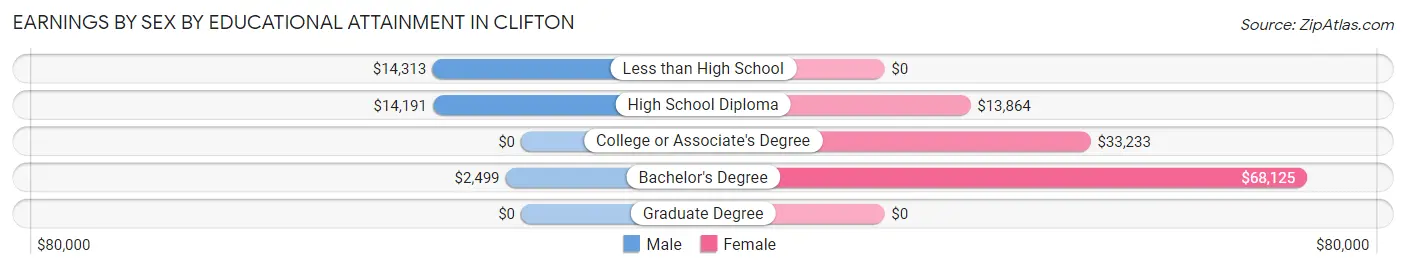
Earnings by Sex by Educational Attainment in Clifton
Average earnings in Clifton are $15,028 for men and $28,047 for women, a difference of 46.4%. Men with an educational attainment of less than high school enjoy the highest average annual earnings of $14,313, while those with bachelor's degree education earn the least with $2,499. Women with an educational attainment of bachelor's degree earn the most with the average annual earnings of $68,125, while those with high school diploma education have the smallest earnings of $13,864.
| Educational Attainment | Male Income | Female Income |
| Less than High School | $14,313 | $0 |
| High School Diploma | $14,191 | $13,864 |
| College or Associate's Degree | - | - |
| Bachelor's Degree | $2,499 | $68,125 |
| Graduate Degree | - | - |
| Total | $15,028 | $28,047 |
Family Income in Clifton
Family Income Brackets in Clifton
According to the Clifton family income data, there are 74 families falling into the $50,000 to $74,999 income range, which is the most common income bracket and makes up 31.9% of all families.
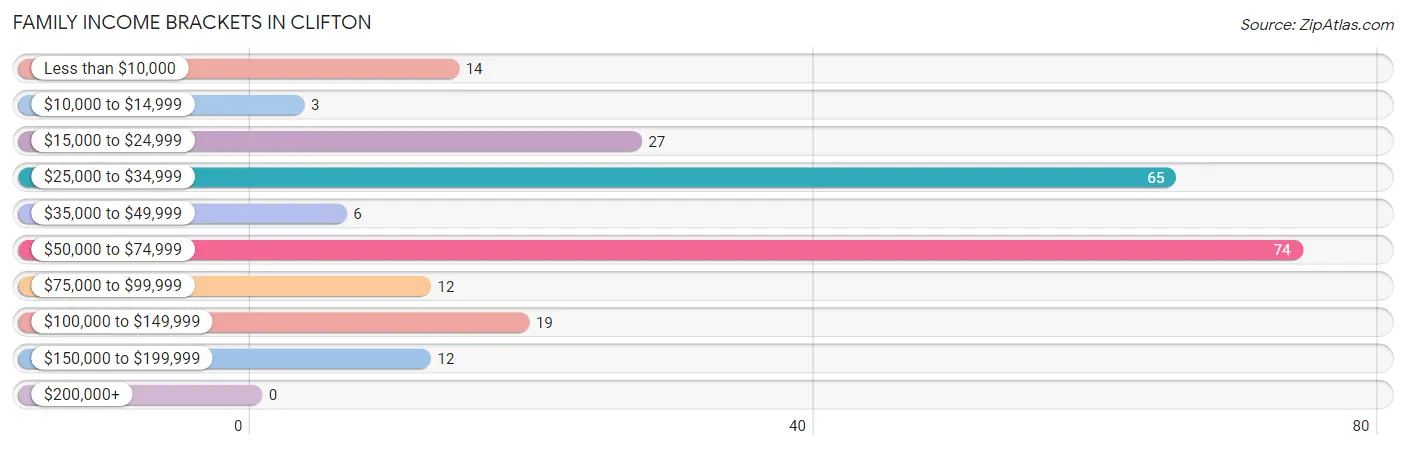
| Income Bracket | # Families | % Families |
| Less than $10,000 | 14 | 6.0% |
| $10,000 to $14,999 | 3 | 1.3% |
| $15,000 to $24,999 | 27 | 11.6% |
| $25,000 to $34,999 | 65 | 28.0% |
| $35,000 to $49,999 | 6 | 2.6% |
| $50,000 to $74,999 | 74 | 31.9% |
| $75,000 to $99,999 | 12 | 5.2% |
| $100,000 to $149,999 | 19 | 8.2% |
| $150,000 to $199,999 | 12 | 5.2% |
| $200,000+ | 0 | 0.0% |
Family Income by Famaliy Size in Clifton
3-person families (62 | 26.7%) account for the highest median family income in Clifton with $62,500 per family, while 2-person families (111 | 47.8%) have the highest median income of $25,312 per family member.
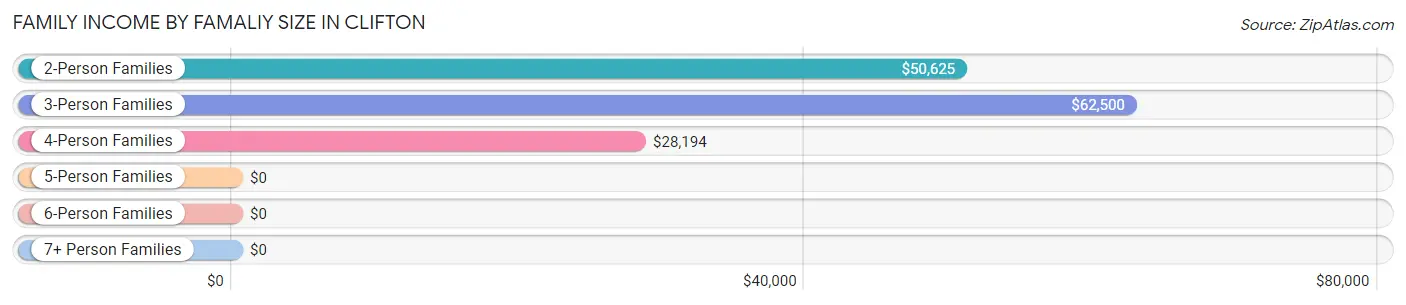
| Income Bracket | # Families | Median Income |
| 2-Person Families | 111 (47.8%) | $50,625 |
| 3-Person Families | 62 (26.7%) | $62,500 |
| 4-Person Families | 33 (14.2%) | $28,194 |
| 5-Person Families | 20 (8.6%) | $0 |
| 6-Person Families | 3 (1.3%) | $0 |
| 7+ Person Families | 3 (1.3%) | $0 |
| Total | 232 (100.0%) | $50,208 |
Family Income by Number of Earners in Clifton
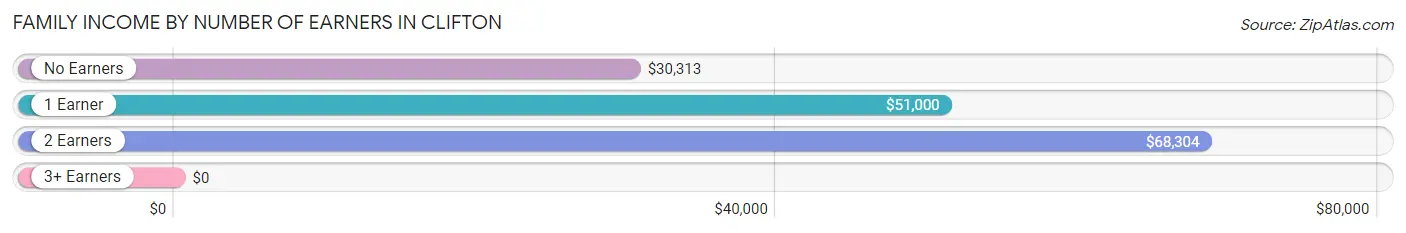
| Number of Earners | # Families | Median Income |
| No Earners | 38 (16.4%) | $30,313 |
| 1 Earner | 132 (56.9%) | $51,000 |
| 2 Earners | 59 (25.4%) | $68,304 |
| 3+ Earners | 3 (1.3%) | $0 |
| Total | 232 (100.0%) | $50,208 |
Household Income in Clifton
Household Income Brackets in Clifton
With 94 households falling in the category, the $25,000 to $34,999 income range is the most frequent in Clifton, accounting for 25.9% of all households.
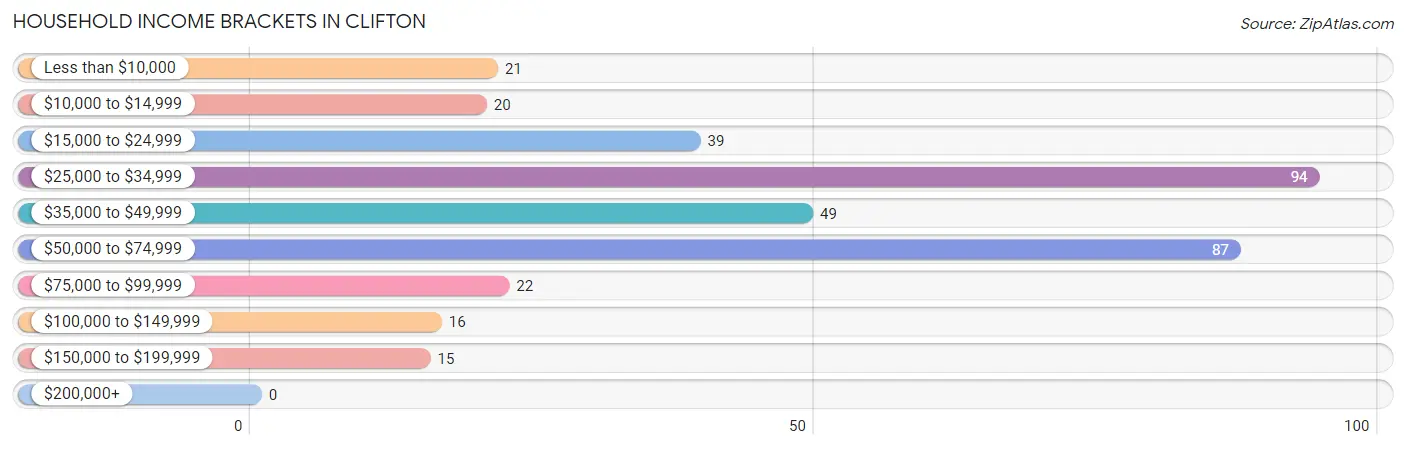
| Income Bracket | # Households | % Households |
| Less than $10,000 | 21 | 5.8% |
| $10,000 to $14,999 | 20 | 5.5% |
| $15,000 to $24,999 | 39 | 10.7% |
| $25,000 to $34,999 | 94 | 25.9% |
| $35,000 to $49,999 | 49 | 13.5% |
| $50,000 to $74,999 | 87 | 24.0% |
| $75,000 to $99,999 | 22 | 6.1% |
| $100,000 to $149,999 | 16 | 4.4% |
| $150,000 to $199,999 | 15 | 4.1% |
| $200,000+ | 0 | 0.0% |
Household Income by Householder Age in Clifton
The median household income in Clifton is $45,145, with the highest median household income of $46,585 found in the 45 to 64 years age bracket for the primary householder. A total of 150 households (41.3%) fall into this category. Meanwhile, the 15 to 24 years age bracket for the primary householder has the lowest median household income of $0, with 4 households (1.1%) in this group.
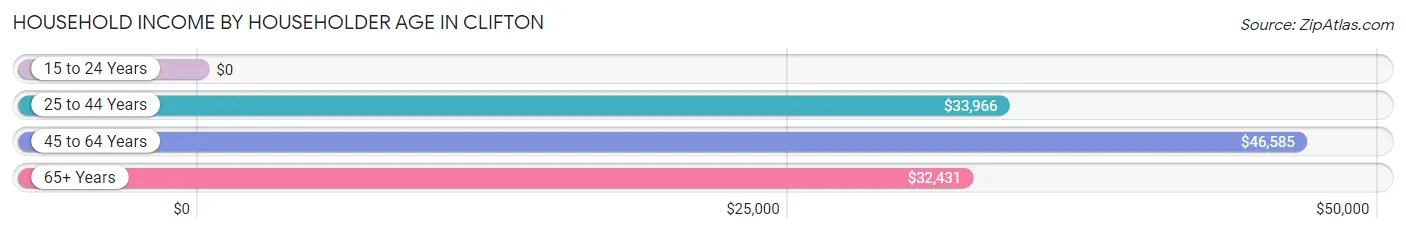
| Income Bracket | # Households | Median Income |
| 15 to 24 Years | 4 (1.1%) | $0 |
| 25 to 44 Years | 112 (30.8%) | $33,966 |
| 45 to 64 Years | 150 (41.3%) | $46,585 |
| 65+ Years | 97 (26.7%) | $32,431 |
| Total | 363 (100.0%) | $45,145 |
Poverty in Clifton
Income Below Poverty by Sex and Age in Clifton
With 48.0% poverty level for males and 37.0% for females among the residents of Clifton, 15 year old males and 5 year old females are the most vulnerable to poverty, with 45 males (95.7%) and 11 females (100.0%) in their respective age groups living below the poverty level.
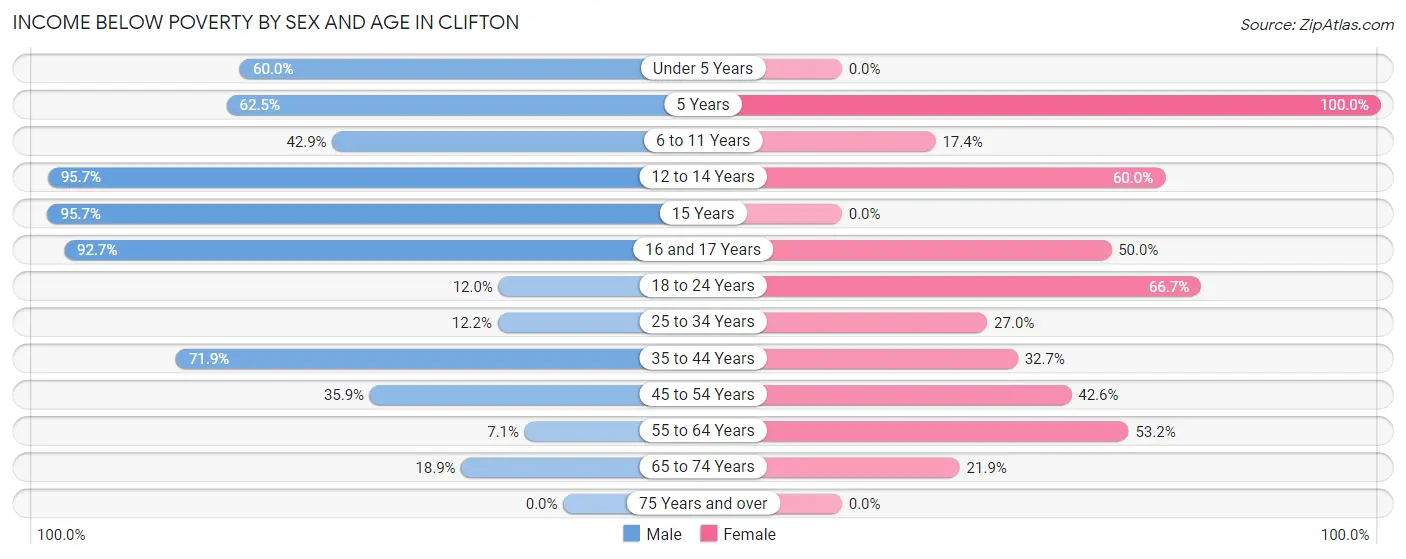
| Age Bracket | Male | Female |
| Under 5 Years | 15 (60.0%) | 0 (0.0%) |
| 5 Years | 5 (62.5%) | 11 (100.0%) |
| 6 to 11 Years | 12 (42.9%) | 8 (17.4%) |
| 12 to 14 Years | 67 (95.7%) | 9 (60.0%) |
| 15 Years | 45 (95.7%) | 0 (0.0%) |
| 16 and 17 Years | 38 (92.7%) | 6 (50.0%) |
| 18 to 24 Years | 3 (12.0%) | 4 (66.7%) |
| 25 to 34 Years | 9 (12.2%) | 17 (27.0%) |
| 35 to 44 Years | 110 (71.9%) | 16 (32.7%) |
| 45 to 54 Years | 14 (35.9%) | 23 (42.6%) |
| 55 to 64 Years | 7 (7.1%) | 58 (53.2%) |
| 65 to 74 Years | 7 (18.9%) | 7 (21.9%) |
| 75 Years and over | 0 (0.0%) | 0 (0.0%) |
| Total | 332 (48.0%) | 159 (37.0%) |
Income Above Poverty by Sex and Age in Clifton
According to the poverty statistics in Clifton, males aged 75 years and over and females aged 75 years and over are the age groups that are most secure financially, with 100.0% of males and 100.0% of females in these age groups living above the poverty line.
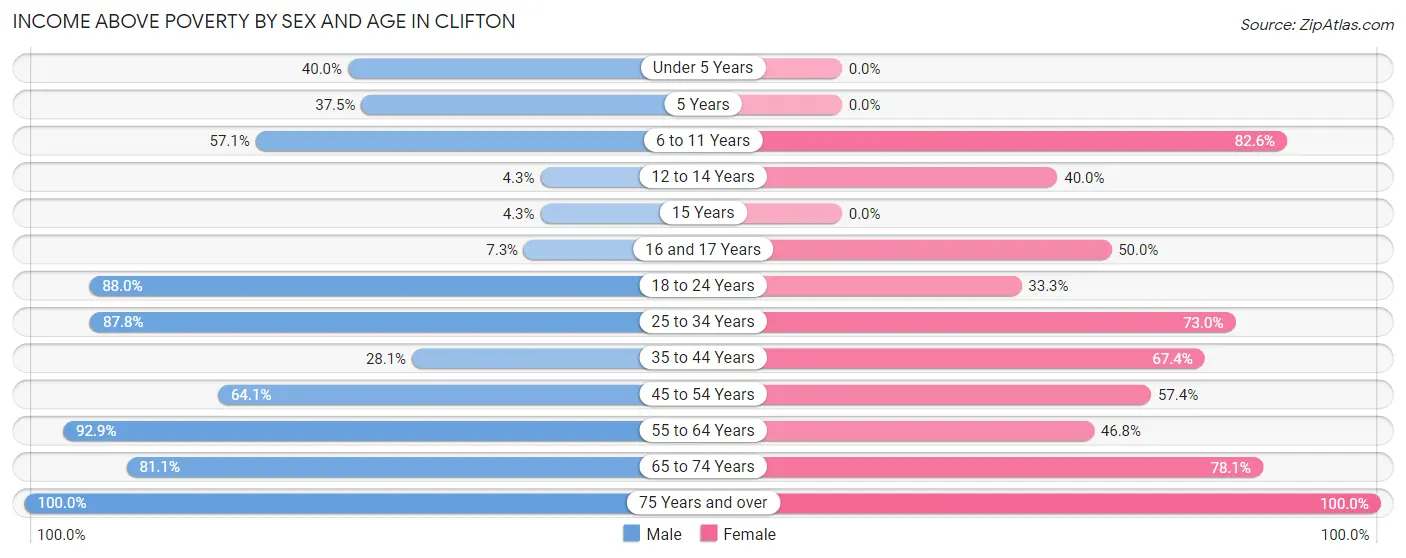
| Age Bracket | Male | Female |
| Under 5 Years | 10 (40.0%) | 0 (0.0%) |
| 5 Years | 3 (37.5%) | 0 (0.0%) |
| 6 to 11 Years | 16 (57.1%) | 38 (82.6%) |
| 12 to 14 Years | 3 (4.3%) | 6 (40.0%) |
| 15 Years | 2 (4.3%) | 0 (0.0%) |
| 16 and 17 Years | 3 (7.3%) | 6 (50.0%) |
| 18 to 24 Years | 22 (88.0%) | 2 (33.3%) |
| 25 to 34 Years | 65 (87.8%) | 46 (73.0%) |
| 35 to 44 Years | 43 (28.1%) | 33 (67.3%) |
| 45 to 54 Years | 25 (64.1%) | 31 (57.4%) |
| 55 to 64 Years | 91 (92.9%) | 51 (46.8%) |
| 65 to 74 Years | 30 (81.1%) | 25 (78.1%) |
| 75 Years and over | 46 (100.0%) | 33 (100.0%) |
| Total | 359 (51.9%) | 271 (63.0%) |
Income Below Poverty Among Married-Couple Families in Clifton
The poverty statistics for married-couple families in Clifton show that 4.4% or 6 of the total 136 families live below the poverty line. Families with 5 or more children have the highest poverty rate of 100.0%, comprising of 3 families. On the other hand, families with no children have the lowest poverty rate of 0.0%, which includes 0 families.
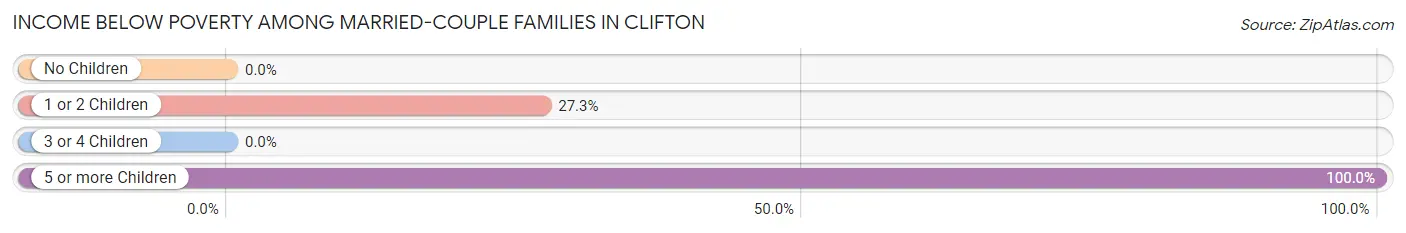
| Children | Above Poverty | Below Poverty |
| No Children | 113 (100.0%) | 0 (0.0%) |
| 1 or 2 Children | 8 (72.7%) | 3 (27.3%) |
| 3 or 4 Children | 9 (100.0%) | 0 (0.0%) |
| 5 or more Children | 0 (0.0%) | 3 (100.0%) |
| Total | 130 (95.6%) | 6 (4.4%) |
Income Below Poverty Among Single-Parent Households in Clifton
According to the poverty data in Clifton, 84.2% or 32 single-father households and 31.0% or 18 single-mother households are living below the poverty line. Among single-father households, those with 3 or 4 children have the highest poverty rate, with 23 households (85.2%) experiencing poverty. Likewise, among single-mother households, those with 3 or 4 children have the highest poverty rate, with 8 households (100.0%) falling below the poverty line.
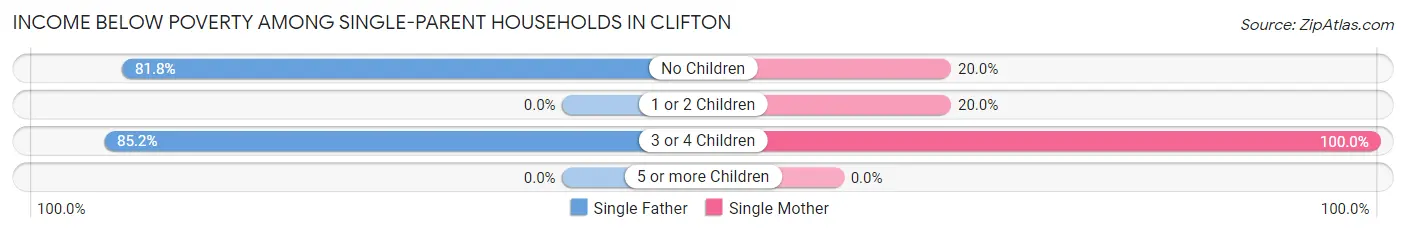
| Children | Single Father | Single Mother |
| No Children | 9 (81.8%) | 1 (20.0%) |
| 1 or 2 Children | 0 (0.0%) | 9 (20.0%) |
| 3 or 4 Children | 23 (85.2%) | 8 (100.0%) |
| 5 or more Children | 0 (0.0%) | 0 (0.0%) |
| Total | 32 (84.2%) | 18 (31.0%) |
Income Below Poverty Among Married-Couple vs Single-Parent Households in Clifton
The poverty data for Clifton shows that 6 of the married-couple family households (4.4%) and 50 of the single-parent households (52.1%) are living below the poverty level. Within the married-couple family households, those with 5 or more children have the highest poverty rate, with 3 households (100.0%) falling below the poverty line. Among the single-parent households, those with 3 or 4 children have the highest poverty rate, with 31 household (88.6%) living below poverty.
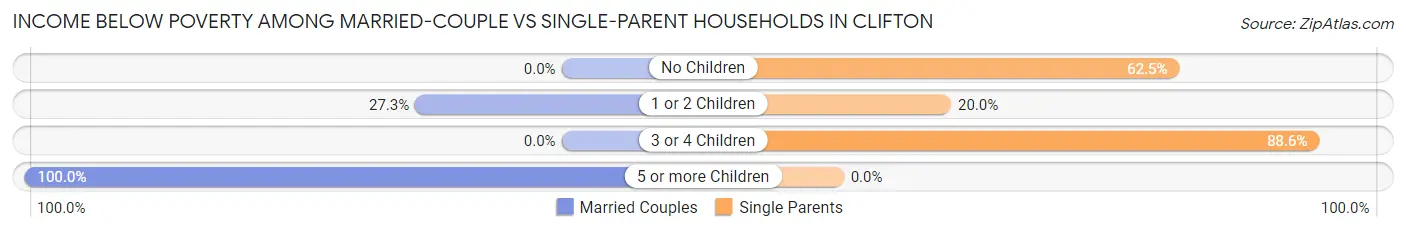
| Children | Married-Couple Families | Single-Parent Households |
| No Children | 0 (0.0%) | 10 (62.5%) |
| 1 or 2 Children | 3 (27.3%) | 9 (20.0%) |
| 3 or 4 Children | 0 (0.0%) | 31 (88.6%) |
| 5 or more Children | 3 (100.0%) | 0 (0.0%) |
| Total | 6 (4.4%) | 50 (52.1%) |
Race in Clifton
The most populous races in Clifton are White / Caucasian (1,748 | 66.7%), Black / African American (513 | 19.6%), and Two or more Races (316 | 12.0%).
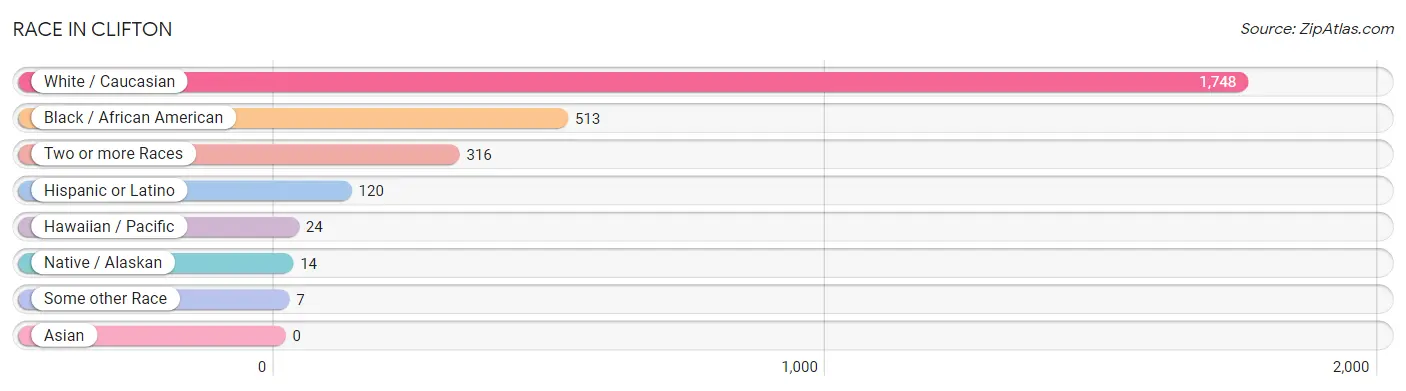
| Race | # Population | % Population |
| Asian | 0 | 0.0% |
| Black / African American | 513 | 19.6% |
| Hawaiian / Pacific | 24 | 0.9% |
| Hispanic or Latino | 120 | 4.6% |
| Native / Alaskan | 14 | 0.5% |
| White / Caucasian | 1,748 | 66.7% |
| Two or more Races | 316 | 12.0% |
| Some other Race | 7 | 0.3% |
| Total | 2,622 | 100.0% |
Ancestry in Clifton
The most populous ancestries reported in Clifton are American (342 | 13.0%), Irish (238 | 9.1%), English (184 | 7.0%), African (164 | 6.2%), and Subsaharan African (164 | 6.2%), together accounting for 41.6% of all Clifton residents.
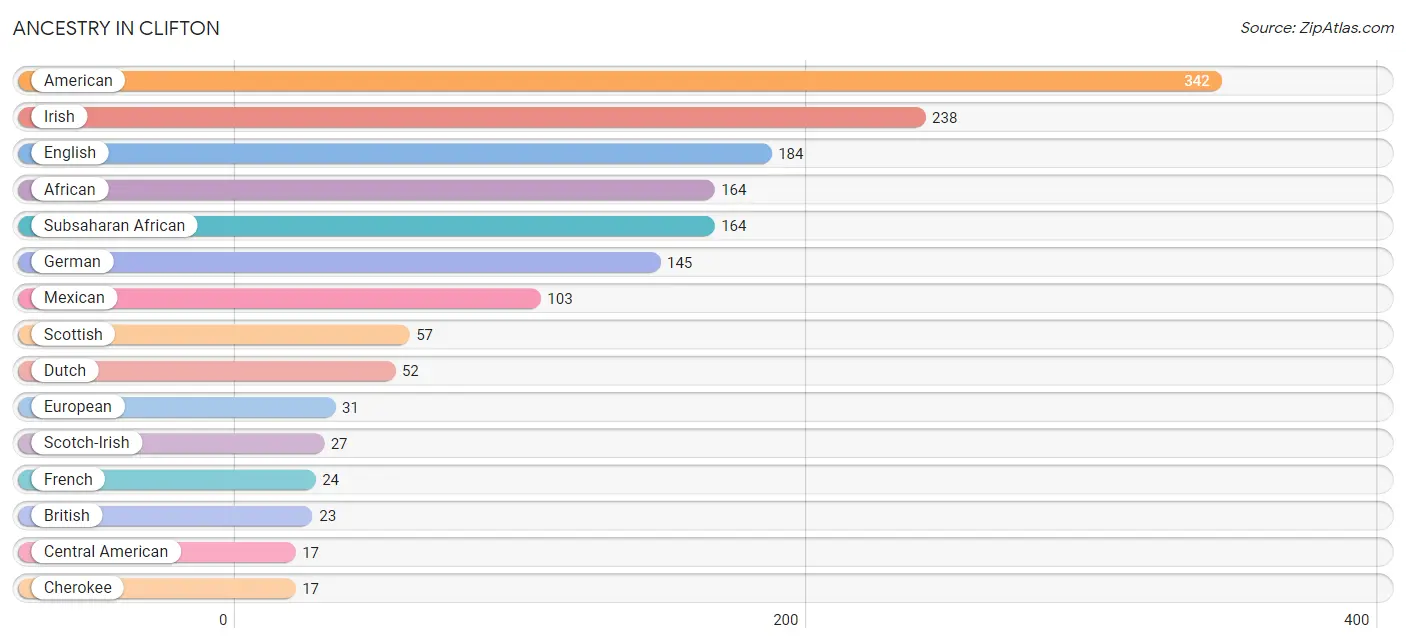
| Ancestry | # Population | % Population |
| African | 164 | 6.2% |
| Alsatian | 14 | 0.5% |
| American | 342 | 13.0% |
| British | 23 | 0.9% |
| Central American | 17 | 0.6% |
| Cherokee | 17 | 0.6% |
| Dutch | 52 | 2.0% |
| English | 184 | 7.0% |
| European | 31 | 1.2% |
| French | 24 | 0.9% |
| French Canadian | 7 | 0.3% |
| German | 145 | 5.5% |
| Greek | 3 | 0.1% |
| Irish | 238 | 9.1% |
| Italian | 11 | 0.4% |
| Mexican | 103 | 3.9% |
| Norwegian | 12 | 0.5% |
| Scotch-Irish | 27 | 1.0% |
| Scottish | 57 | 2.2% |
| Slovene | 3 | 0.1% |
| Subsaharan African | 164 | 6.2% |
| Swedish | 3 | 0.1% |
| Swiss | 6 | 0.2% |
| Welsh | 4 | 0.2% | View All 24 Rows |
Immigrants in Clifton
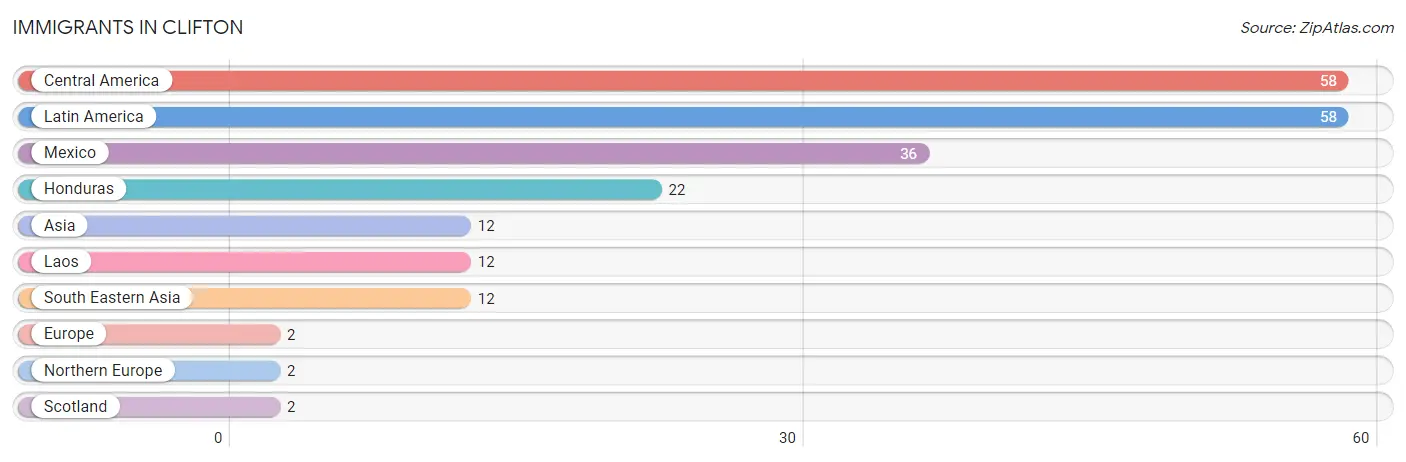
The most numerous immigrant groups reported in Clifton came from Central America (58 | 2.2%), Latin America (58 | 2.2%), Mexico (36 | 1.4%), Honduras (22 | 0.8%), and Asia (12 | 0.5%), together accounting for 7.1% of all Clifton residents.
| Immigration Origin | # Population | % Population |
| Asia | 12 | 0.5% |
| Central America | 58 | 2.2% |
| Europe | 2 | 0.1% |
| Honduras | 22 | 0.8% |
| Laos | 12 | 0.5% |
| Latin America | 58 | 2.2% |
| Mexico | 36 | 1.4% |
| Northern Europe | 2 | 0.1% |
| Scotland | 2 | 0.1% |
| South Eastern Asia | 12 | 0.5% | View All 10 Rows |
Sex and Age in Clifton
Sex and Age in Clifton
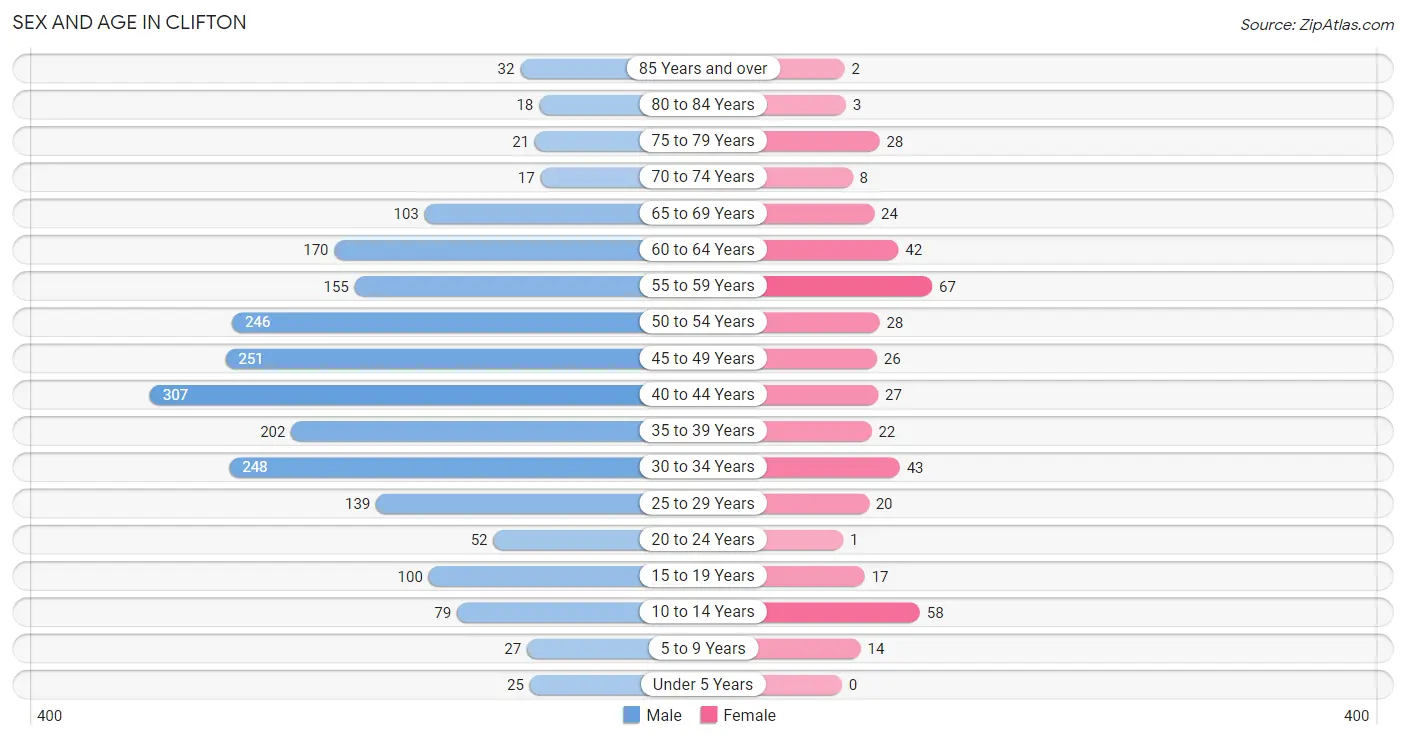
The most populous age groups in Clifton are 40 to 44 Years (307 | 14.0%) for men and 55 to 59 Years (67 | 15.6%) for women.
| Age Bracket | Male | Female |
| Under 5 Years | 25 (1.1%) | 0 (0.0%) |
| 5 to 9 Years | 27 (1.2%) | 14 (3.3%) |
| 10 to 14 Years | 79 (3.6%) | 58 (13.5%) |
| 15 to 19 Years | 100 (4.6%) | 17 (4.0%) |
| 20 to 24 Years | 52 (2.4%) | 1 (0.2%) |
| 25 to 29 Years | 139 (6.3%) | 20 (4.6%) |
| 30 to 34 Years | 248 (11.3%) | 43 (10.0%) |
| 35 to 39 Years | 202 (9.2%) | 22 (5.1%) |
| 40 to 44 Years | 307 (14.0%) | 27 (6.3%) |
| 45 to 49 Years | 251 (11.5%) | 26 (6.0%) |
| 50 to 54 Years | 246 (11.2%) | 28 (6.5%) |
| 55 to 59 Years | 155 (7.1%) | 67 (15.6%) |
| 60 to 64 Years | 170 (7.8%) | 42 (9.8%) |
| 65 to 69 Years | 103 (4.7%) | 24 (5.6%) |
| 70 to 74 Years | 17 (0.8%) | 8 (1.9%) |
| 75 to 79 Years | 21 (1.0%) | 28 (6.5%) |
| 80 to 84 Years | 18 (0.8%) | 3 (0.7%) |
| 85 Years and over | 32 (1.5%) | 2 (0.5%) |
| Total | 2,192 (100.0%) | 430 (100.0%) |
Families and Households in Clifton
Median Family Size in Clifton
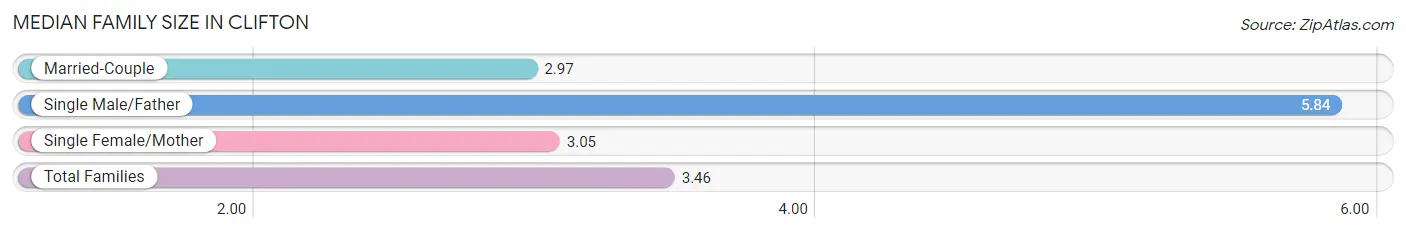
The median family size in Clifton is 3.46 persons per family, with single male/father families (38 | 16.4%) accounting for the largest median family size of 5.84 persons per family. On the other hand, married-couple families (136 | 58.6%) represent the smallest median family size with 2.97 persons per family.
| Family Type | # Families | Family Size |
| Married-Couple | 136 (58.6%) | 2.97 |
| Single Male/Father | 38 (16.4%) | 5.84 |
| Single Female/Mother | 58 (25.0%) | 3.05 |
| Total Families | 232 (100.0%) | 3.46 |
Median Household Size in Clifton
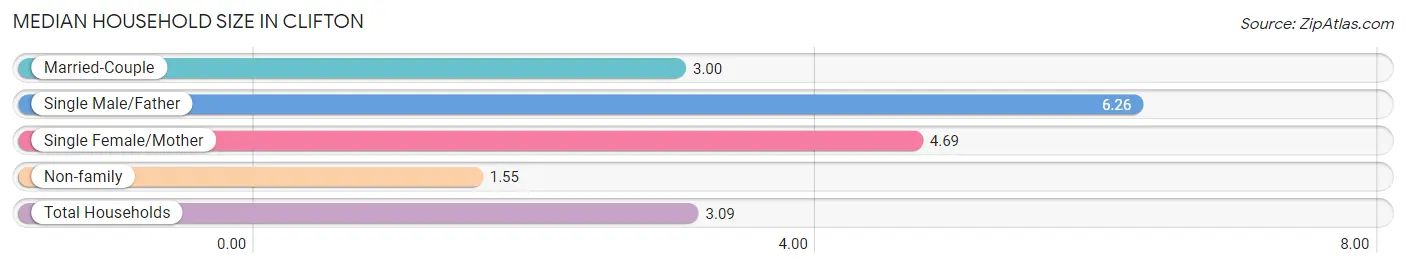
The median household size in Clifton is 3.09 persons per household, with single male/father households (38 | 10.5%) accounting for the largest median household size of 6.26 persons per household. non-family households (131 | 36.1%) represent the smallest median household size with 1.55 persons per household.
| Household Type | # Households | Household Size |
| Married-Couple | 136 (37.5%) | 3.00 |
| Single Male/Father | 38 (10.5%) | 6.26 |
| Single Female/Mother | 58 (16.0%) | 4.69 |
| Non-family | 131 (36.1%) | 1.55 |
| Total Households | 363 (100.0%) | 3.09 |
Household Size by Marriage Status in Clifton
Out of a total of 363 households in Clifton, 232 (63.9%) are family households, while 131 (36.1%) are nonfamily households. The most numerous type of family households are 3-person households, comprising 90, and the most common type of nonfamily households are 1-person households, comprising 77.
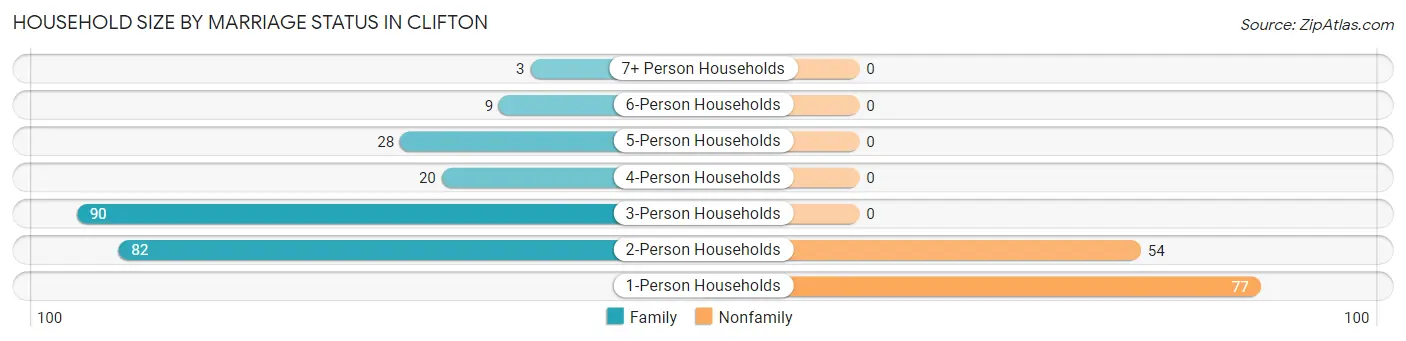
| Household Size | Family Households | Nonfamily Households |
| 1-Person Households | - | 77 (21.2%) |
| 2-Person Households | 82 (22.6%) | 54 (14.9%) |
| 3-Person Households | 90 (24.8%) | 0 (0.0%) |
| 4-Person Households | 20 (5.5%) | 0 (0.0%) |
| 5-Person Households | 28 (7.7%) | 0 (0.0%) |
| 6-Person Households | 9 (2.5%) | 0 (0.0%) |
| 7+ Person Households | 3 (0.8%) | 0 (0.0%) |
| Total | 232 (63.9%) | 131 (36.1%) |
Female Fertility in Clifton
Fertility by Age in Clifton
Average fertility rate in Clifton is 51.0 births per 1,000 women. Women in the age bracket of 15 to 19 years have the highest fertility rate with 176.0 births per 1,000 women. Women in the age bracket of 20 to 34 years acount for 62.5% of all women with births.
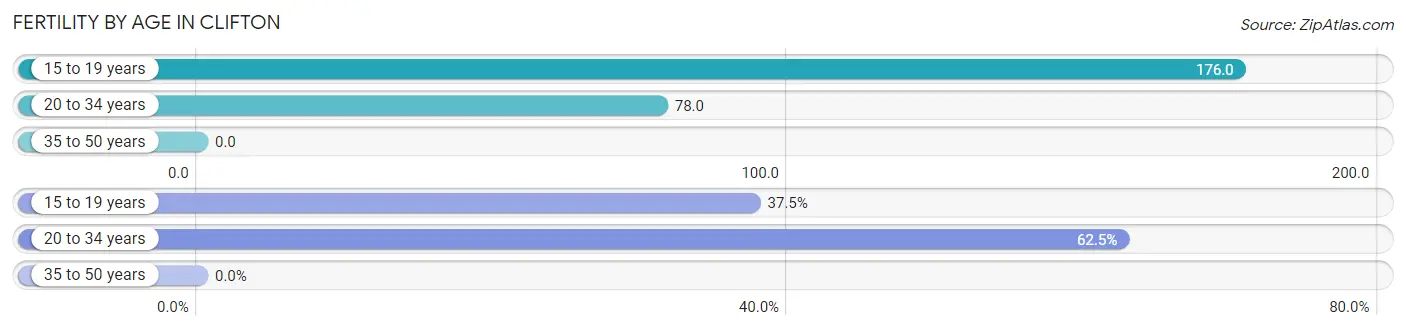
| Age Bracket | Women with Births | Births / 1,000 Women |
| 15 to 19 years | 3 (37.5%) | 176.0 |
| 20 to 34 years | 5 (62.5%) | 78.0 |
| 35 to 50 years | 0 (0.0%) | 0.0 |
| Total | 8 (100.0%) | 51.0 |
Fertility by Age by Marriage Status in Clifton
62.5% of women with births (8) in Clifton are married. The highest percentage of unmarried women with births falls into 15 to 19 years age bracket with 100.0% of them unmarried at the time of birth, while the lowest percentage of unmarried women with births belong to 20 to 34 years age bracket with 0.0% of them unmarried.
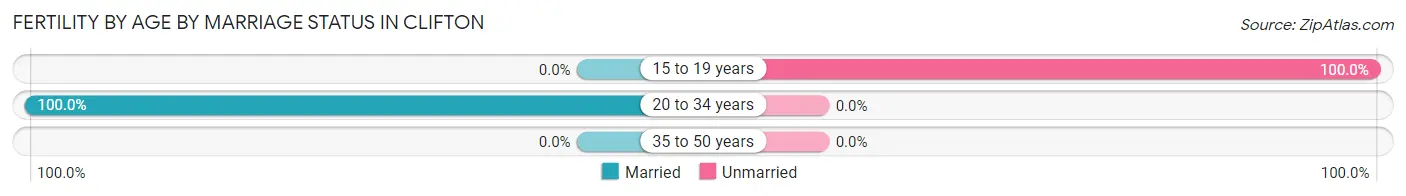
| Age Bracket | Married | Unmarried |
| 15 to 19 years | 0 (0.0%) | 3 (100.0%) |
| 20 to 34 years | 5 (100.0%) | 0 (0.0%) |
| 35 to 50 years | 0 (0.0%) | 0 (0.0%) |
| Total | 5 (62.5%) | 3 (37.5%) |
Fertility by Education in Clifton
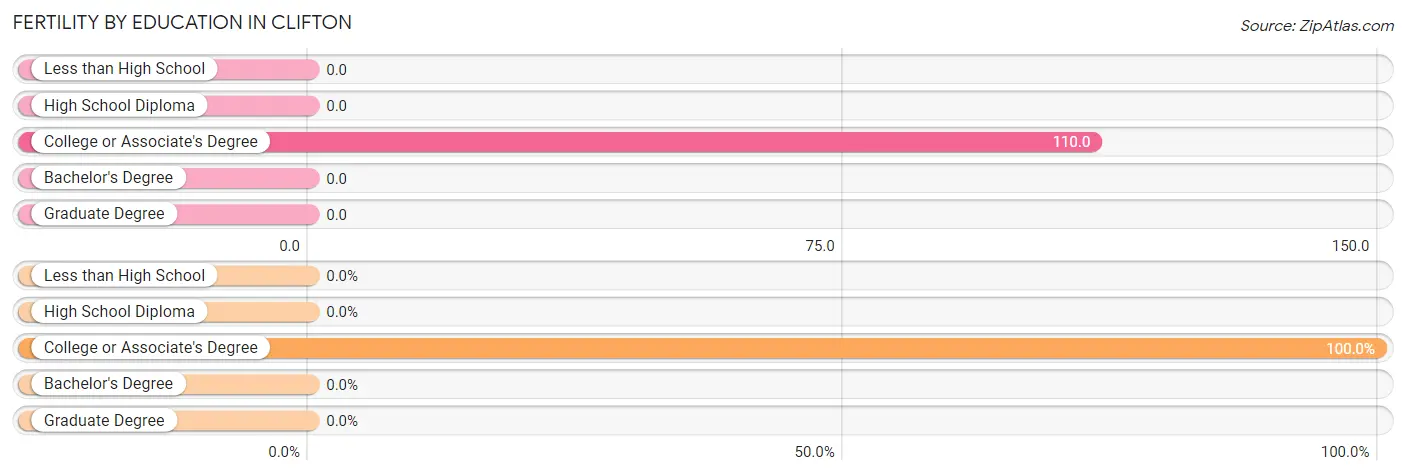
| Educational Attainment | Women with Births | Births / 1,000 Women |
| Less than High School | 0 (0.0%) | 0.0 |
| High School Diploma | 0 (0.0%) | 0.0 |
| College or Associate's Degree | 8 (100.0%) | 110.0 |
| Bachelor's Degree | 0 (0.0%) | 0.0 |
| Graduate Degree | 0 (0.0%) | 0.0 |
| Total | 8 (100.0%) | 51.0 |
Fertility by Education by Marriage Status in Clifton
37.5% of women with births in Clifton are unmarried. Women with the educational attainment of college or associate's degree are most likely to be married with 62.5% of them married at childbirth, while women with the educational attainment of college or associate's degree are least likely to be married with 37.5% of them unmarried at childbirth.
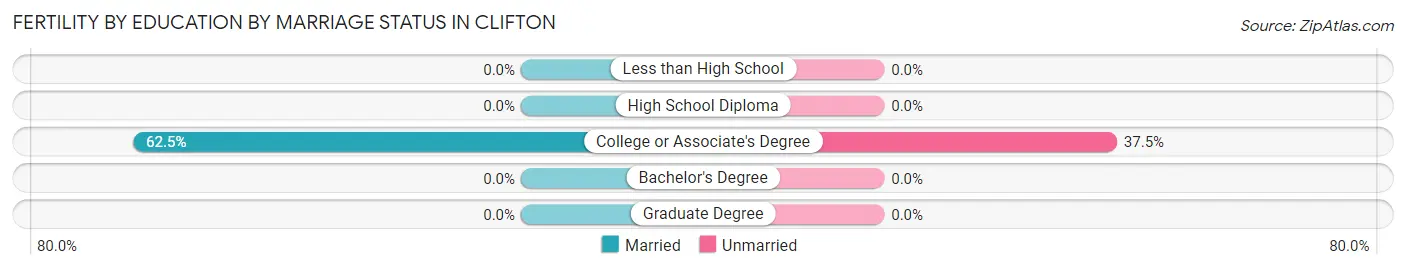
| Educational Attainment | Married | Unmarried |
| Less than High School | 0 (0.0%) | 0 (0.0%) |
| High School Diploma | 0 (0.0%) | 0 (0.0%) |
| College or Associate's Degree | 5 (62.5%) | 3 (37.5%) |
| Bachelor's Degree | 0 (0.0%) | 0 (0.0%) |
| Graduate Degree | 0 (0.0%) | 0 (0.0%) |
| Total | 5 (62.5%) | 3 (37.5%) |
Employment Characteristics in Clifton
Employment by Class of Employer in Clifton
Among the 354 employed individuals in Clifton, private company employees (177 | 50.0%), local government employees (82 | 23.2%), and state government employees (50 | 14.1%) make up the most common classes of employment.
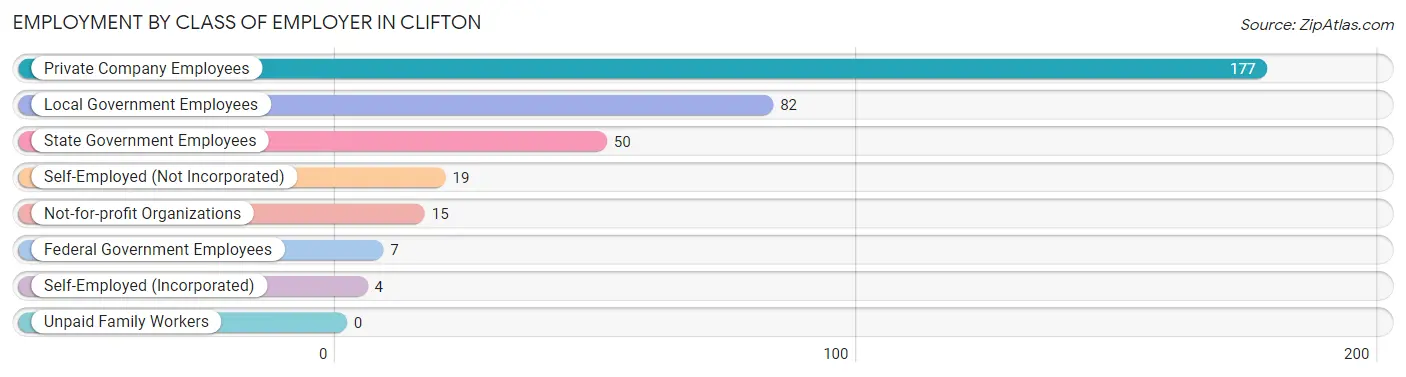
| Employer Class | # Employees | % Employees |
| Private Company Employees | 177 | 50.0% |
| Self-Employed (Incorporated) | 4 | 1.1% |
| Self-Employed (Not Incorporated) | 19 | 5.4% |
| Not-for-profit Organizations | 15 | 4.2% |
| Local Government Employees | 82 | 23.2% |
| State Government Employees | 50 | 14.1% |
| Federal Government Employees | 7 | 2.0% |
| Unpaid Family Workers | 0 | 0.0% |
| Total | 354 | 100.0% |
Employment Status by Age in Clifton
According to the labor force statistics for Clifton, out of the total population over 16 years of age (2,372), 15.9% or 377 individuals are in the labor force, with 3.2% or 12 of them unemployed. The age group with the highest labor force participation rate is 16 to 19 years, with 68.6% or 48 individuals in the labor force. Within the labor force, the 20 to 24 years age range has the highest percentage of unemployed individuals, with 50.0% or 3 of them being unemployed.
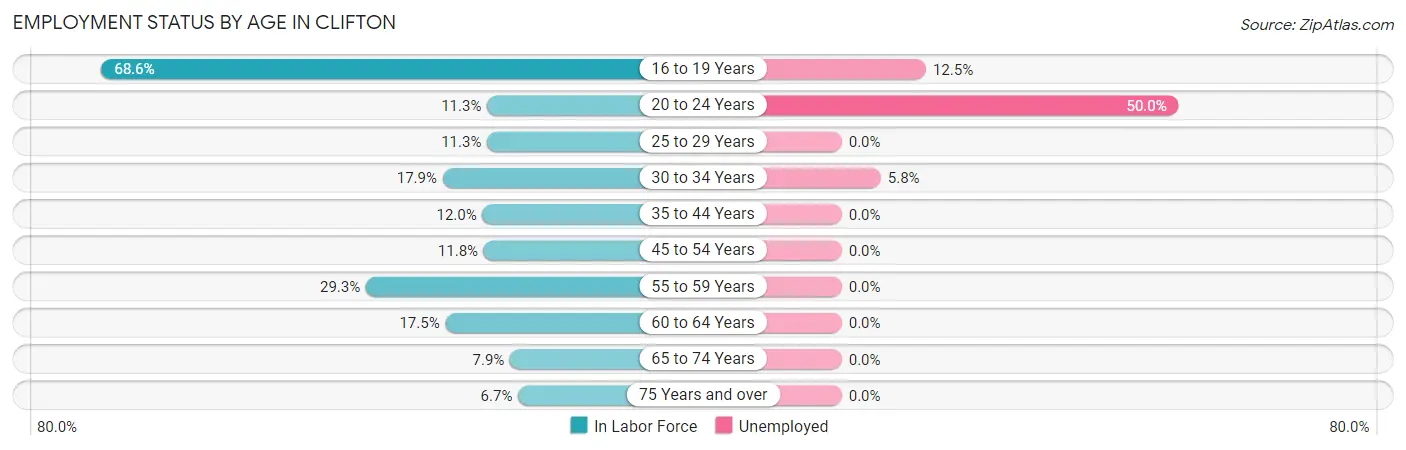
| Age Bracket | In Labor Force | Unemployed |
| 16 to 19 Years | 48 (68.6%) | 6 (12.5%) |
| 20 to 24 Years | 6 (11.3%) | 3 (50.0%) |
| 25 to 29 Years | 18 (11.3%) | 0 (0.0%) |
| 30 to 34 Years | 52 (17.9%) | 3 (5.8%) |
| 35 to 44 Years | 67 (12.0%) | 0 (0.0%) |
| 45 to 54 Years | 65 (11.8%) | 0 (0.0%) |
| 55 to 59 Years | 65 (29.3%) | 0 (0.0%) |
| 60 to 64 Years | 37 (17.5%) | 0 (0.0%) |
| 65 to 74 Years | 12 (7.9%) | 0 (0.0%) |
| 75 Years and over | 7 (6.7%) | 0 (0.0%) |
| Total | 377 (15.9%) | 12 (3.2%) |
Employment Status by Educational Attainment in Clifton
According to labor force statistics for Clifton, 15.3% of individuals (305) out of the total population between 25 and 64 years of age (1,993) are in the labor force, with 1.0% or 3 of them being unemployed. The group with the highest labor force participation rate are those with the educational attainment of college / associate degree, with 35.1% or 142 individuals in the labor force. Within the labor force, individuals with college / associate degree education have the highest percentage of unemployment, with 2.1% or 3 of them being unemployed.
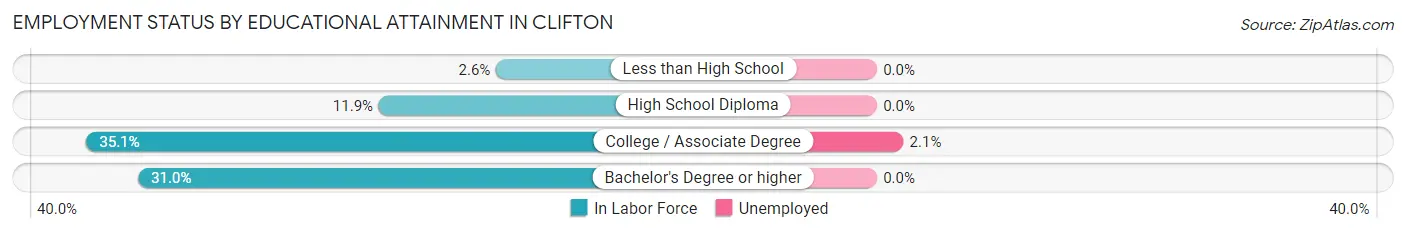
| Educational Attainment | In Labor Force | Unemployed |
| Less than High School | 12 (2.6%) | 0 (0.0%) |
| High School Diploma | 123 (11.9%) | 0 (0.0%) |
| College / Associate Degree | 142 (35.1%) | 9 (2.1%) |
| Bachelor's Degree or higher | 27 (31.0%) | 0 (0.0%) |
| Total | 305 (15.3%) | 20 (1.0%) |
Employment Occupations by Sex in Clifton
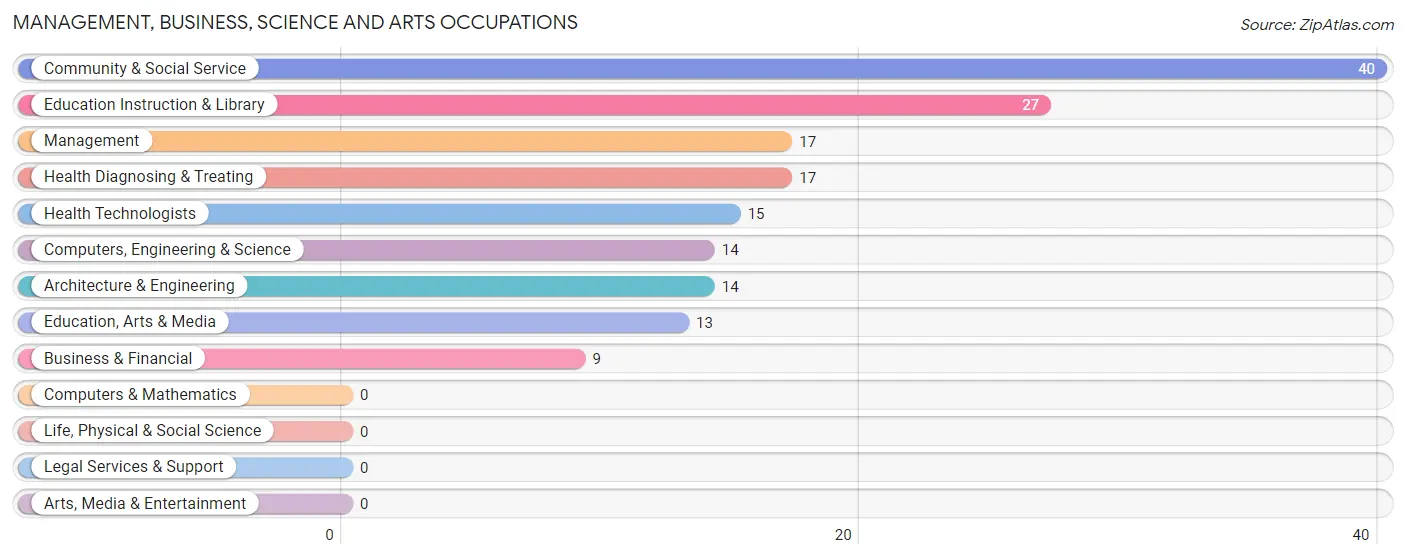
Management, Business, Science and Arts Occupations
The most common Management, Business, Science and Arts occupations in Clifton are Community & Social Service (40 | 11.0%), Education Instruction & Library (27 | 7.4%), Management (17 | 4.7%), Health Diagnosing & Treating (17 | 4.7%), and Health Technologists (15 | 4.1%).
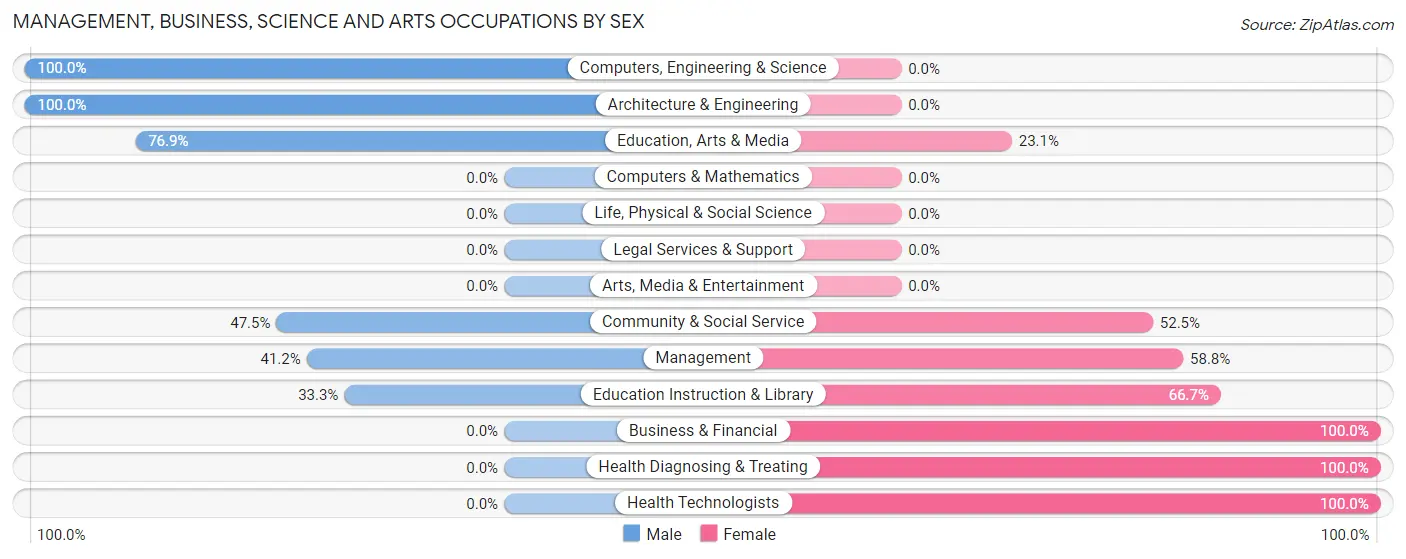
Management, Business, Science and Arts Occupations by Sex
Within the Management, Business, Science and Arts occupations in Clifton, the most male-oriented occupations are Computers, Engineering & Science (100.0%), Architecture & Engineering (100.0%), and Education, Arts & Media (76.9%), while the most female-oriented occupations are Business & Financial (100.0%), Health Diagnosing & Treating (100.0%), and Health Technologists (100.0%).
| Occupation | Male | Female |
| Management | 7 (41.2%) | 10 (58.8%) |
| Business & Financial | 0 (0.0%) | 9 (100.0%) |
| Computers, Engineering & Science | 14 (100.0%) | 0 (0.0%) |
| Computers & Mathematics | 0 (0.0%) | 0 (0.0%) |
| Architecture & Engineering | 14 (100.0%) | 0 (0.0%) |
| Life, Physical & Social Science | 0 (0.0%) | 0 (0.0%) |
| Community & Social Service | 19 (47.5%) | 21 (52.5%) |
| Education, Arts & Media | 10 (76.9%) | 3 (23.1%) |
| Legal Services & Support | 0 (0.0%) | 0 (0.0%) |
| Education Instruction & Library | 9 (33.3%) | 18 (66.7%) |
| Arts, Media & Entertainment | 0 (0.0%) | 0 (0.0%) |
| Health Diagnosing & Treating | 0 (0.0%) | 17 (100.0%) |
| Health Technologists | 0 (0.0%) | 15 (100.0%) |
| Total (Category) | 40 (41.2%) | 57 (58.8%) |
| Total (Overall) | 193 (52.9%) | 172 (47.1%) |
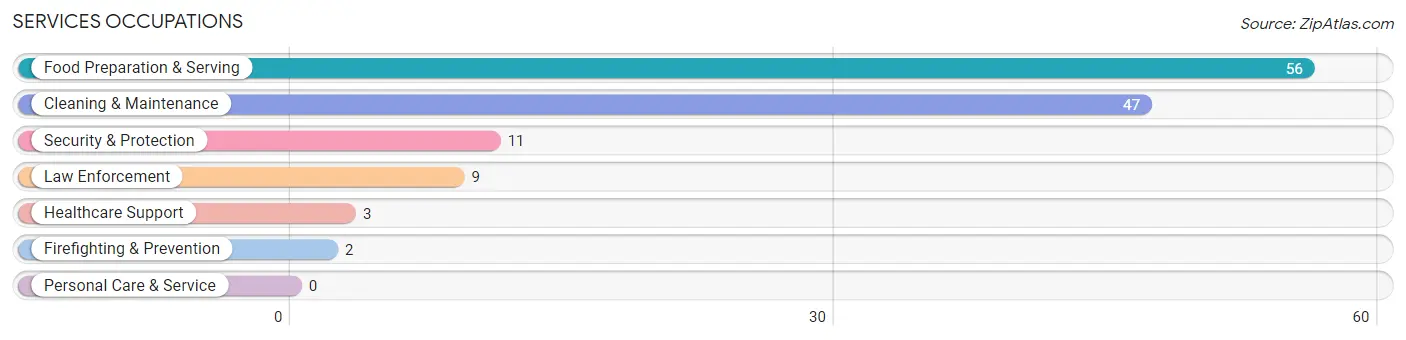
Services Occupations
The most common Services occupations in Clifton are Food Preparation & Serving (56 | 15.3%), Cleaning & Maintenance (47 | 12.9%), Security & Protection (11 | 3.0%), Law Enforcement (9 | 2.5%), and Healthcare Support (3 | 0.8%).
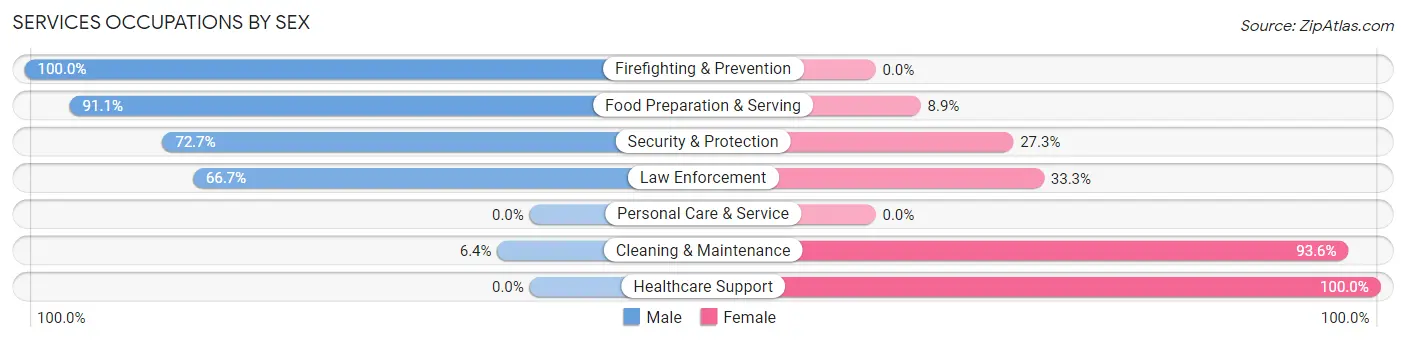
Services Occupations by Sex
Within the Services occupations in Clifton, the most male-oriented occupations are Firefighting & Prevention (100.0%), Food Preparation & Serving (91.1%), and Security & Protection (72.7%), while the most female-oriented occupations are Healthcare Support (100.0%), Cleaning & Maintenance (93.6%), and Law Enforcement (33.3%).
| Occupation | Male | Female |
| Healthcare Support | 0 (0.0%) | 3 (100.0%) |
| Security & Protection | 8 (72.7%) | 3 (27.3%) |
| Firefighting & Prevention | 2 (100.0%) | 0 (0.0%) |
| Law Enforcement | 6 (66.7%) | 3 (33.3%) |
| Food Preparation & Serving | 51 (91.1%) | 5 (8.9%) |
| Cleaning & Maintenance | 3 (6.4%) | 44 (93.6%) |
| Personal Care & Service | 0 (0.0%) | 0 (0.0%) |
| Total (Category) | 62 (53.0%) | 55 (47.0%) |
| Total (Overall) | 193 (52.9%) | 172 (47.1%) |
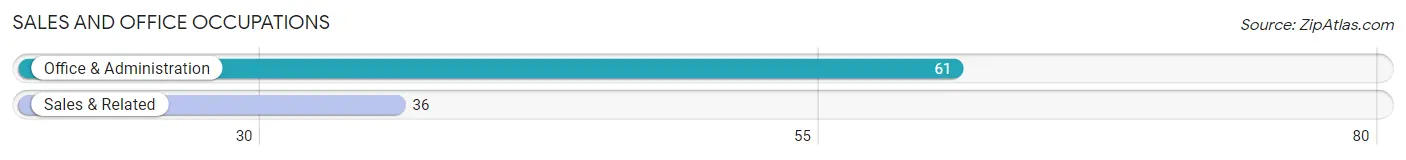
Sales and Office Occupations
The most common Sales and Office occupations in Clifton are Office & Administration (61 | 16.7%), and Sales & Related (36 | 9.9%).
Sales and Office Occupations by Sex
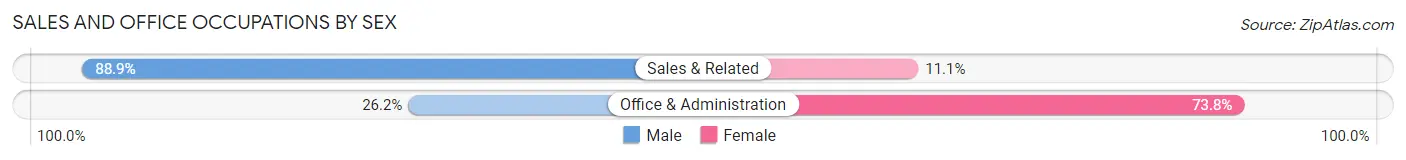
| Occupation | Male | Female |
| Sales & Related | 32 (88.9%) | 4 (11.1%) |
| Office & Administration | 16 (26.2%) | 45 (73.8%) |
| Total (Category) | 48 (49.5%) | 49 (50.5%) |
| Total (Overall) | 193 (52.9%) | 172 (47.1%) |
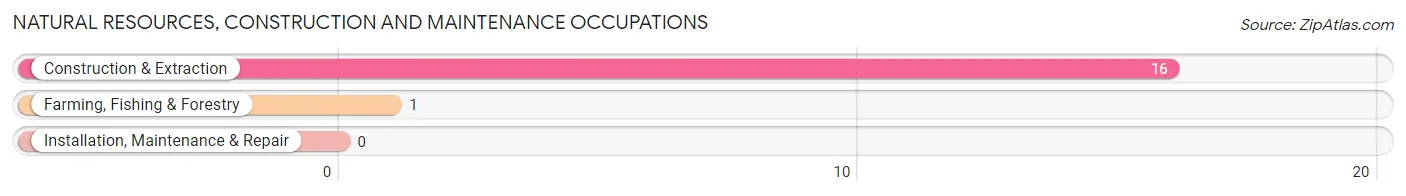
Natural Resources, Construction and Maintenance Occupations
The most common Natural Resources, Construction and Maintenance occupations in Clifton are Construction & Extraction (16 | 4.4%), and Farming, Fishing & Forestry (1 | 0.3%).
Natural Resources, Construction and Maintenance Occupations by Sex
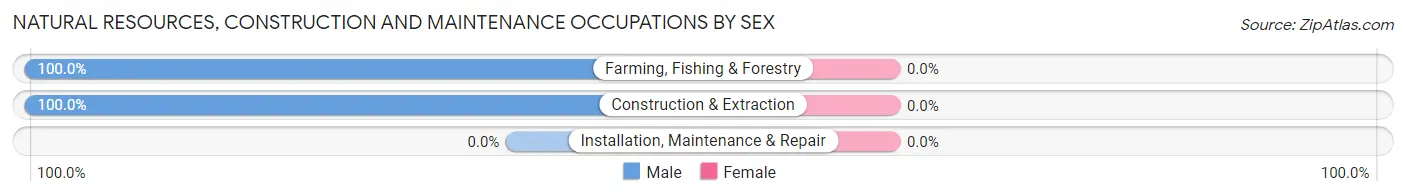
| Occupation | Male | Female |
| Farming, Fishing & Forestry | 1 (100.0%) | 0 (0.0%) |
| Construction & Extraction | 16 (100.0%) | 0 (0.0%) |
| Installation, Maintenance & Repair | 0 (0.0%) | 0 (0.0%) |
| Total (Category) | 17 (100.0%) | 0 (0.0%) |
| Total (Overall) | 193 (52.9%) | 172 (47.1%) |
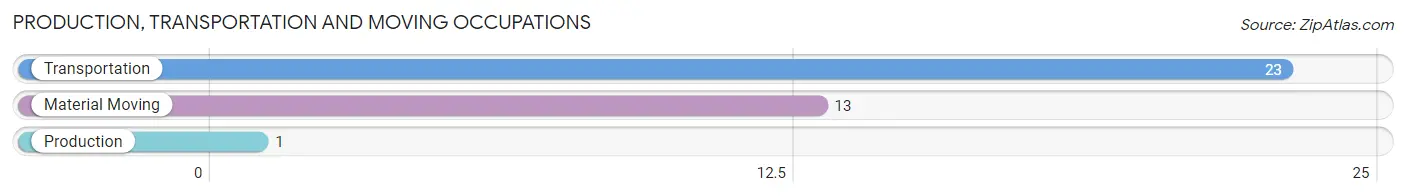
Production, Transportation and Moving Occupations
The most common Production, Transportation and Moving occupations in Clifton are Transportation (23 | 6.3%), Material Moving (13 | 3.6%), and Production (1 | 0.3%).
Production, Transportation and Moving Occupations by Sex
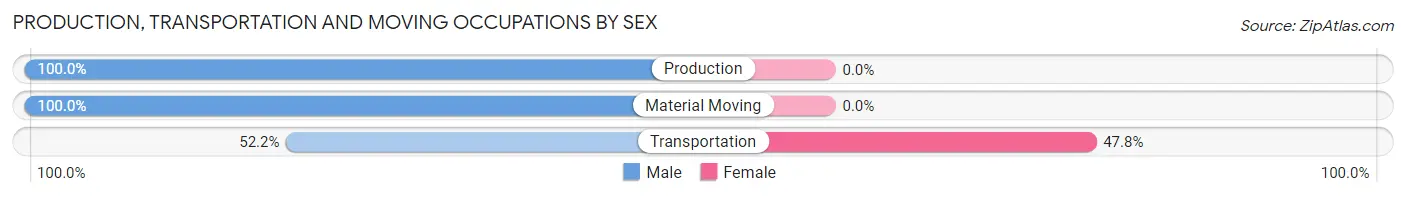
| Occupation | Male | Female |
| Production | 1 (100.0%) | 0 (0.0%) |
| Transportation | 12 (52.2%) | 11 (47.8%) |
| Material Moving | 13 (100.0%) | 0 (0.0%) |
| Total (Category) | 26 (70.3%) | 11 (29.7%) |
| Total (Overall) | 193 (52.9%) | 172 (47.1%) |
Employment Industries by Sex in Clifton
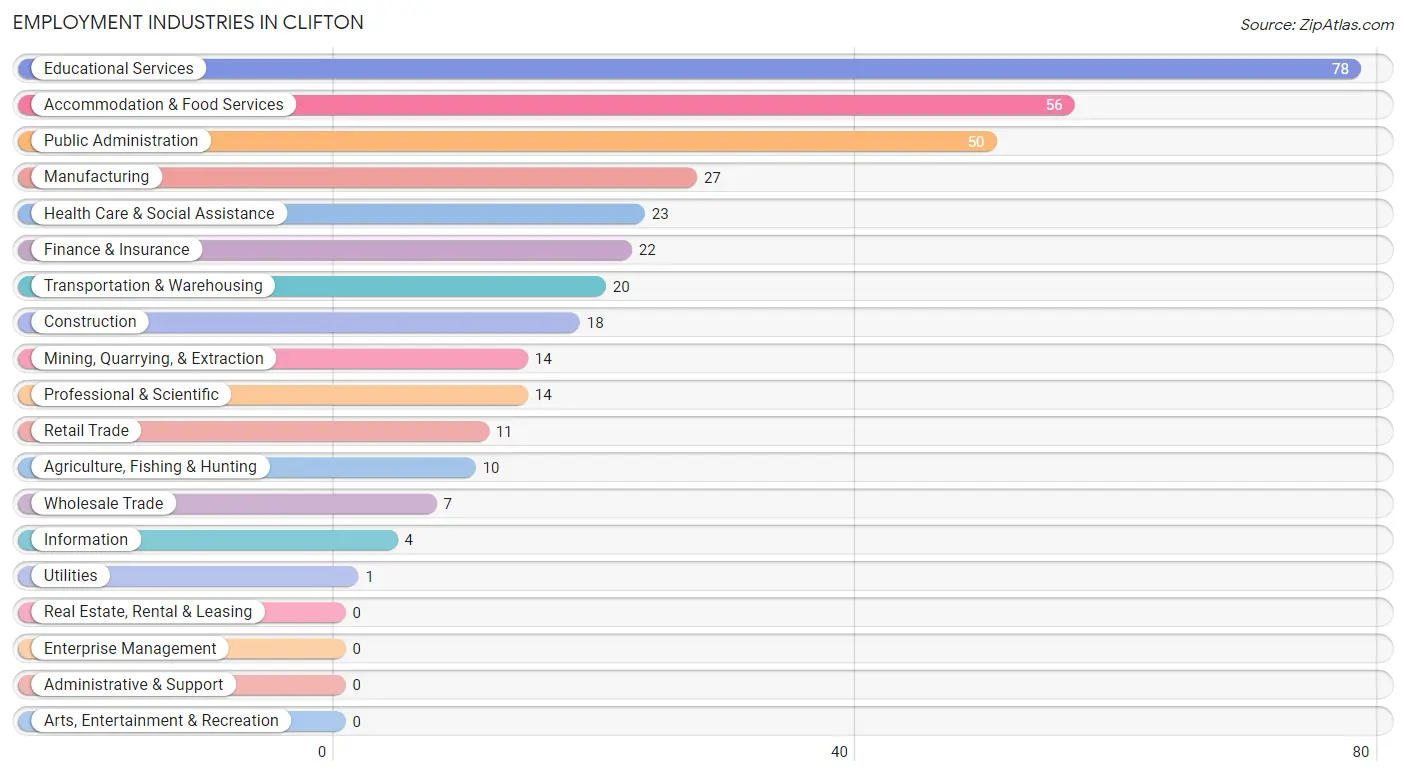
Employment Industries in Clifton
The major employment industries in Clifton include Educational Services (78 | 21.4%), Accommodation & Food Services (56 | 15.3%), Public Administration (50 | 13.7%), Manufacturing (27 | 7.4%), and Health Care & Social Assistance (23 | 6.3%).
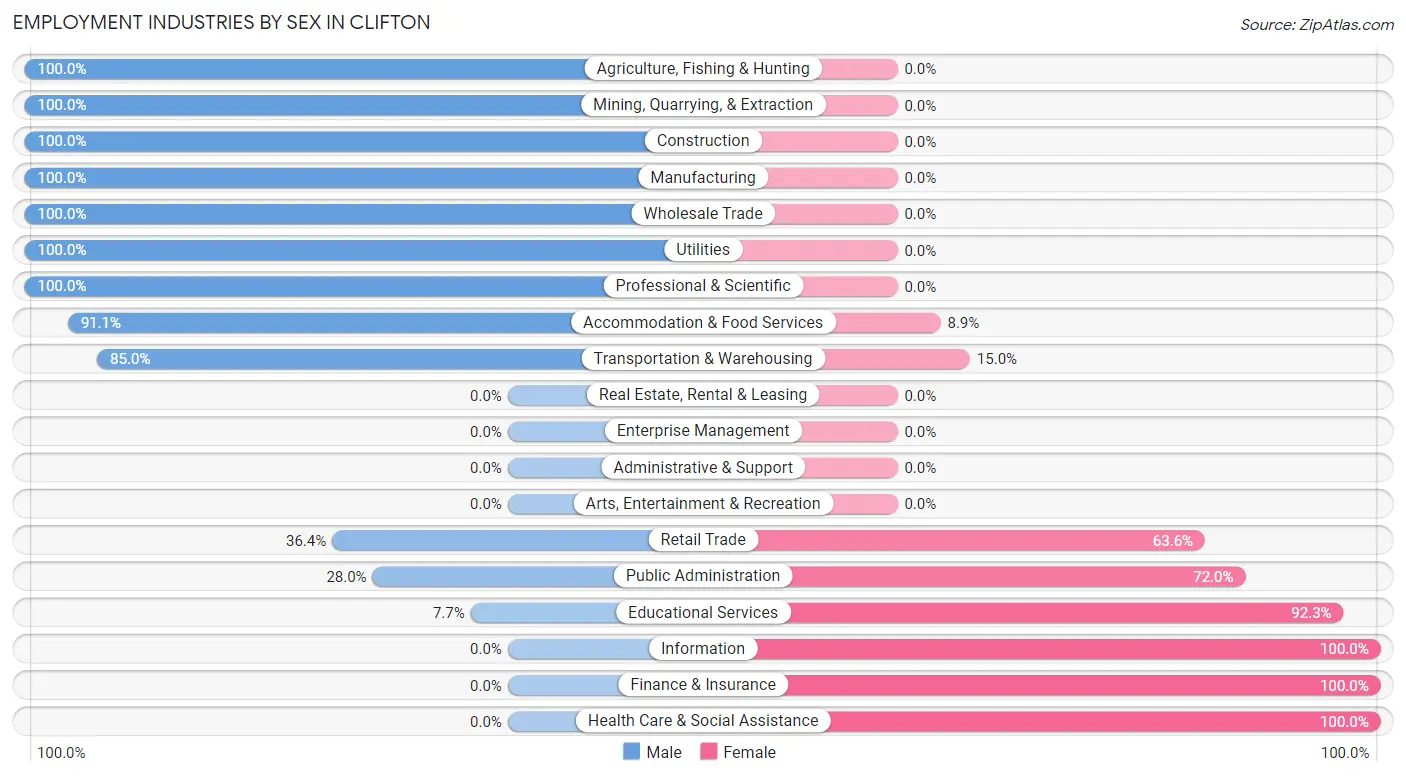
Employment Industries by Sex in Clifton
The Clifton industries that see more men than women are Agriculture, Fishing & Hunting (100.0%), Mining, Quarrying, & Extraction (100.0%), and Construction (100.0%), whereas the industries that tend to have a higher number of women are Information (100.0%), Finance & Insurance (100.0%), and Health Care & Social Assistance (100.0%).
| Industry | Male | Female |
| Agriculture, Fishing & Hunting | 10 (100.0%) | 0 (0.0%) |
| Mining, Quarrying, & Extraction | 14 (100.0%) | 0 (0.0%) |
| Construction | 18 (100.0%) | 0 (0.0%) |
| Manufacturing | 27 (100.0%) | 0 (0.0%) |
| Wholesale Trade | 7 (100.0%) | 0 (0.0%) |
| Retail Trade | 4 (36.4%) | 7 (63.6%) |
| Transportation & Warehousing | 17 (85.0%) | 3 (15.0%) |
| Utilities | 1 (100.0%) | 0 (0.0%) |
| Information | 0 (0.0%) | 4 (100.0%) |
| Finance & Insurance | 0 (0.0%) | 22 (100.0%) |
| Real Estate, Rental & Leasing | 0 (0.0%) | 0 (0.0%) |
| Professional & Scientific | 14 (100.0%) | 0 (0.0%) |
| Enterprise Management | 0 (0.0%) | 0 (0.0%) |
| Administrative & Support | 0 (0.0%) | 0 (0.0%) |
| Educational Services | 6 (7.7%) | 72 (92.3%) |
| Health Care & Social Assistance | 0 (0.0%) | 23 (100.0%) |
| Arts, Entertainment & Recreation | 0 (0.0%) | 0 (0.0%) |
| Accommodation & Food Services | 51 (91.1%) | 5 (8.9%) |
| Public Administration | 14 (28.0%) | 36 (72.0%) |
| Total | 193 (52.9%) | 172 (47.1%) |
Education in Clifton
School Enrollment in Clifton
The most common levels of schooling among the 395 students in Clifton are middle school (168 | 42.5%), high school (92 | 23.3%), and college / undergraduate (80 | 20.3%).
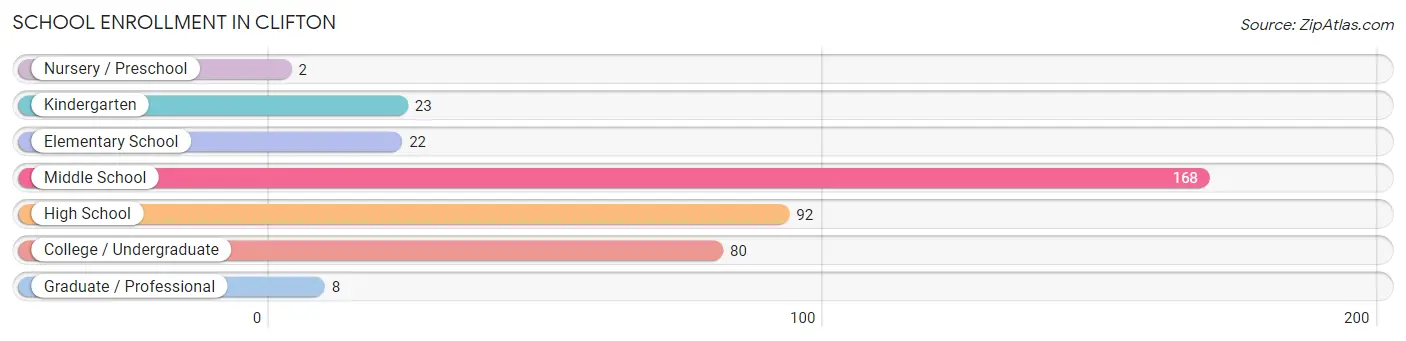
| School Level | # Students | % Students |
| Nursery / Preschool | 2 | 0.5% |
| Kindergarten | 23 | 5.8% |
| Elementary School | 22 | 5.6% |
| Middle School | 168 | 42.5% |
| High School | 92 | 23.3% |
| College / Undergraduate | 80 | 20.3% |
| Graduate / Professional | 8 | 2.0% |
| Total | 395 | 100.0% |
School Enrollment by Age by Funding Source in Clifton
Out of a total of 395 students who are enrolled in schools in Clifton, 90 (22.8%) attend a private institution, while the remaining 305 (77.2%) are enrolled in public schools. The age group of 20 to 24 year olds has the highest likelihood of being enrolled in private schools, with 8 (100.0% in the age bracket) enrolled. Conversely, the age group of 3 to 4 year olds has the lowest likelihood of being enrolled in a private school, with 2 (100.0% in the age bracket) attending a public institution.
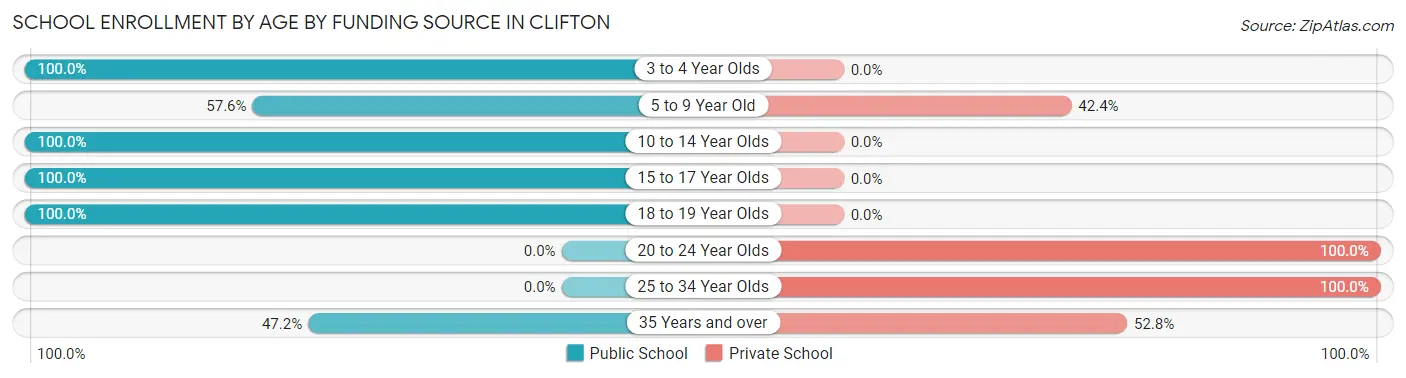
| Age Bracket | Public School | Private School |
| 3 to 4 Year Olds | 2 (100.0%) | 0 (0.0%) |
| 5 to 9 Year Old | 19 (57.6%) | 14 (42.4%) |
| 10 to 14 Year Olds | 137 (100.0%) | 0 (0.0%) |
| 15 to 17 Year Olds | 100 (100.0%) | 0 (0.0%) |
| 18 to 19 Year Olds | 13 (100.0%) | 0 (0.0%) |
| 20 to 24 Year Olds | 0 (0.0%) | 8 (100.0%) |
| 25 to 34 Year Olds | 0 (0.0%) | 30 (100.0%) |
| 35 Years and over | 34 (47.2%) | 38 (52.8%) |
| Total | 305 (77.2%) | 90 (22.8%) |
Educational Attainment by Field of Study in Clifton
Arts & humanities (27 | 23.1%), psychology (22 | 18.8%), science & technology (15 | 12.8%), computers & mathematics (13 | 11.1%), and liberal arts & history (13 | 11.1%) are the most common fields of study among 117 individuals in Clifton who have obtained a bachelor's degree or higher.
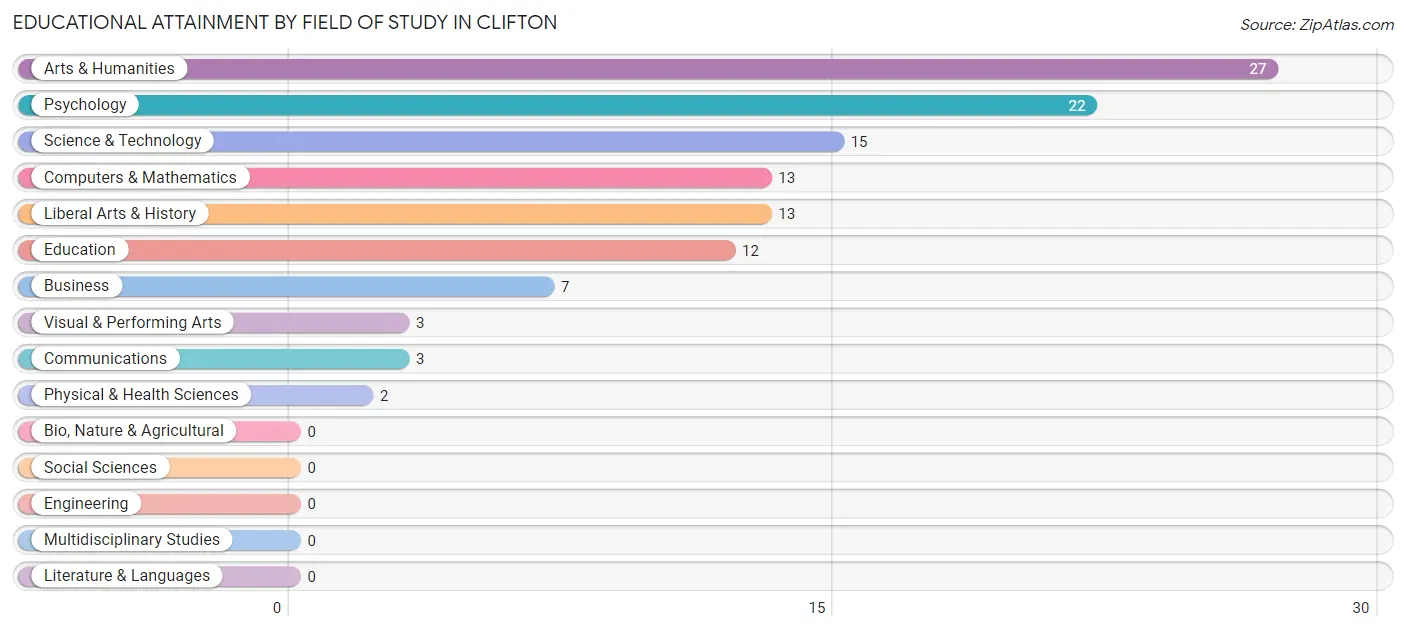
| Field of Study | # Graduates | % Graduates |
| Computers & Mathematics | 13 | 11.1% |
| Bio, Nature & Agricultural | 0 | 0.0% |
| Physical & Health Sciences | 2 | 1.7% |
| Psychology | 22 | 18.8% |
| Social Sciences | 0 | 0.0% |
| Engineering | 0 | 0.0% |
| Multidisciplinary Studies | 0 | 0.0% |
| Science & Technology | 15 | 12.8% |
| Business | 7 | 6.0% |
| Education | 12 | 10.3% |
| Literature & Languages | 0 | 0.0% |
| Liberal Arts & History | 13 | 11.1% |
| Visual & Performing Arts | 3 | 2.6% |
| Communications | 3 | 2.6% |
| Arts & Humanities | 27 | 23.1% |
| Total | 117 | 100.0% |
Transportation & Commute in Clifton
Vehicle Availability by Sex in Clifton
The most prevalent vehicle ownership categories in Clifton are males with 1 vehicle (102, accounting for 53.7%) and females with 1 vehicle (48, making up 62.2%).
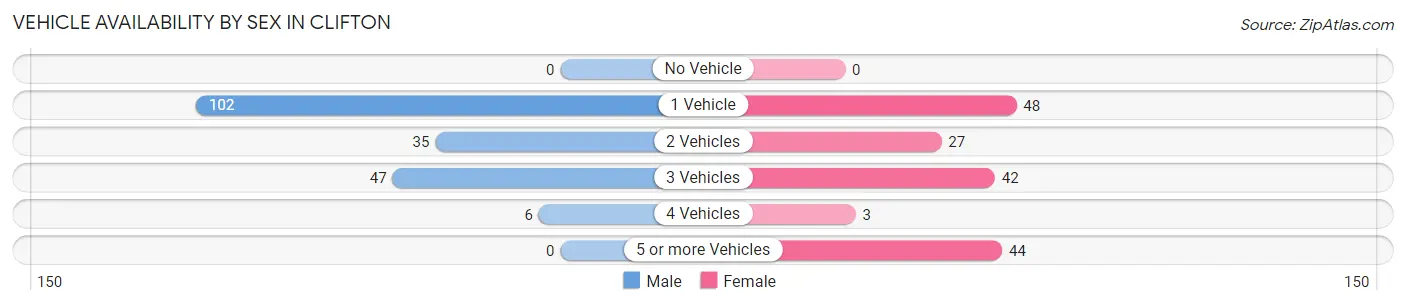
| Vehicles Available | Male | Female |
| No Vehicle | 0 (0.0%) | 0 (0.0%) |
| 1 Vehicle | 102 (53.7%) | 48 (29.3%) |
| 2 Vehicles | 35 (18.4%) | 27 (16.5%) |
| 3 Vehicles | 47 (24.7%) | 42 (25.6%) |
| 4 Vehicles | 6 (3.2%) | 3 (1.8%) |
| 5 or more Vehicles | 0 (0.0%) | 44 (26.8%) |
| Total | 190 (100.0%) | 164 (100.0%) |
Commute Time in Clifton
The most frequently occuring commute durations in Clifton are 30 to 34 minutes (106 commuters, 30.6%), 25 to 29 minutes (53 commuters, 15.3%), and 10 to 14 minutes (49 commuters, 14.2%).
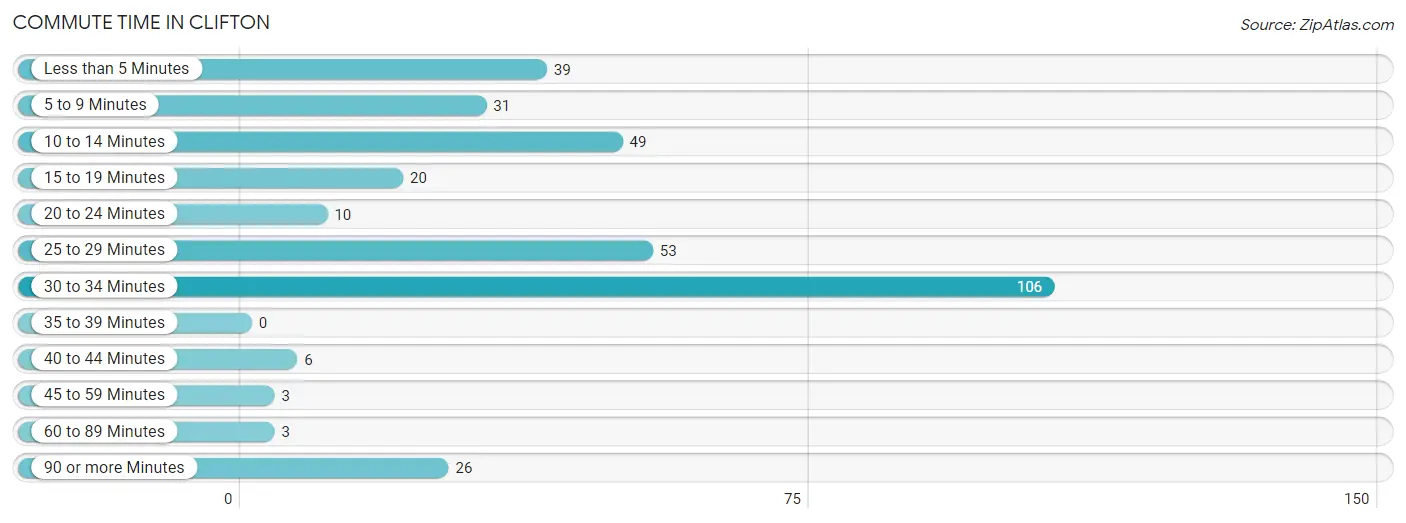
| Commute Time | # Commuters | % Commuters |
| Less than 5 Minutes | 39 | 11.3% |
| 5 to 9 Minutes | 31 | 9.0% |
| 10 to 14 Minutes | 49 | 14.2% |
| 15 to 19 Minutes | 20 | 5.8% |
| 20 to 24 Minutes | 10 | 2.9% |
| 25 to 29 Minutes | 53 | 15.3% |
| 30 to 34 Minutes | 106 | 30.6% |
| 35 to 39 Minutes | 0 | 0.0% |
| 40 to 44 Minutes | 6 | 1.7% |
| 45 to 59 Minutes | 3 | 0.9% |
| 60 to 89 Minutes | 3 | 0.9% |
| 90 or more Minutes | 26 | 7.5% |
Commute Time by Sex in Clifton
The most common commute times in Clifton are 30 to 34 minutes (57 commuters, 30.5%) for males and 30 to 34 minutes (49 commuters, 30.8%) for females.
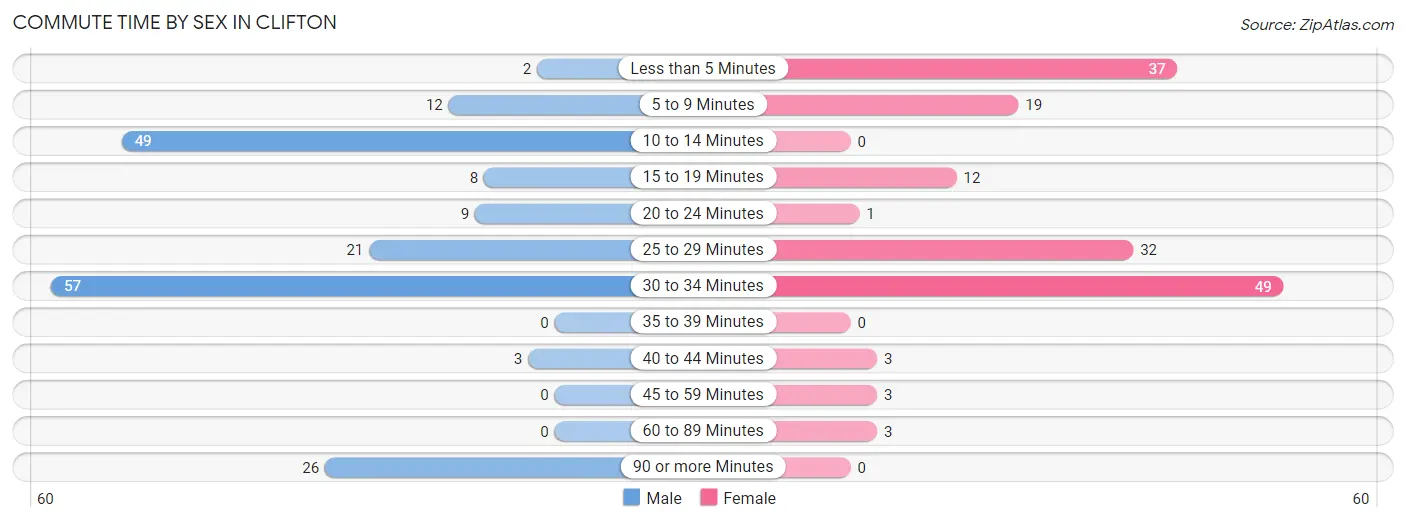
| Commute Time | Male | Female |
| Less than 5 Minutes | 2 (1.1%) | 37 (23.3%) |
| 5 to 9 Minutes | 12 (6.4%) | 19 (11.9%) |
| 10 to 14 Minutes | 49 (26.2%) | 0 (0.0%) |
| 15 to 19 Minutes | 8 (4.3%) | 12 (7.5%) |
| 20 to 24 Minutes | 9 (4.8%) | 1 (0.6%) |
| 25 to 29 Minutes | 21 (11.2%) | 32 (20.1%) |
| 30 to 34 Minutes | 57 (30.5%) | 49 (30.8%) |
| 35 to 39 Minutes | 0 (0.0%) | 0 (0.0%) |
| 40 to 44 Minutes | 3 (1.6%) | 3 (1.9%) |
| 45 to 59 Minutes | 0 (0.0%) | 3 (1.9%) |
| 60 to 89 Minutes | 0 (0.0%) | 3 (1.9%) |
| 90 or more Minutes | 26 (13.9%) | 0 (0.0%) |
Time of Departure to Work by Sex in Clifton
The most frequent times of departure to work in Clifton are 5:30 AM to 5:59 AM (55, 29.4%) for males and 6:00 AM to 6:29 AM (44, 27.7%) for females.
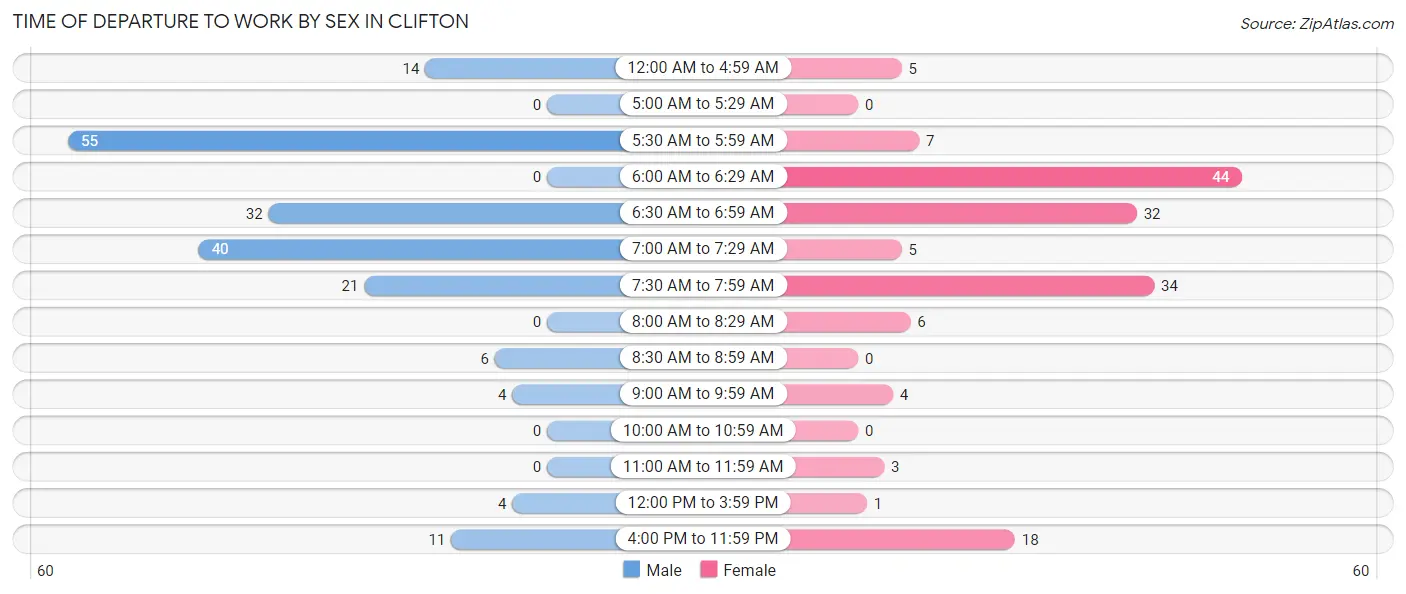
| Time of Departure | Male | Female |
| 12:00 AM to 4:59 AM | 14 (7.5%) | 5 (3.1%) |
| 5:00 AM to 5:29 AM | 0 (0.0%) | 0 (0.0%) |
| 5:30 AM to 5:59 AM | 55 (29.4%) | 7 (4.4%) |
| 6:00 AM to 6:29 AM | 0 (0.0%) | 44 (27.7%) |
| 6:30 AM to 6:59 AM | 32 (17.1%) | 32 (20.1%) |
| 7:00 AM to 7:29 AM | 40 (21.4%) | 5 (3.1%) |
| 7:30 AM to 7:59 AM | 21 (11.2%) | 34 (21.4%) |
| 8:00 AM to 8:29 AM | 0 (0.0%) | 6 (3.8%) |
| 8:30 AM to 8:59 AM | 6 (3.2%) | 0 (0.0%) |
| 9:00 AM to 9:59 AM | 4 (2.1%) | 4 (2.5%) |
| 10:00 AM to 10:59 AM | 0 (0.0%) | 0 (0.0%) |
| 11:00 AM to 11:59 AM | 0 (0.0%) | 3 (1.9%) |
| 12:00 PM to 3:59 PM | 4 (2.1%) | 1 (0.6%) |
| 4:00 PM to 11:59 PM | 11 (5.9%) | 18 (11.3%) |
| Total | 187 (100.0%) | 159 (100.0%) |
Housing Occupancy in Clifton
Occupancy by Ownership in Clifton
Of the total 363 dwellings in Clifton, owner-occupied units account for 223 (61.4%), while renter-occupied units make up 140 (38.6%).
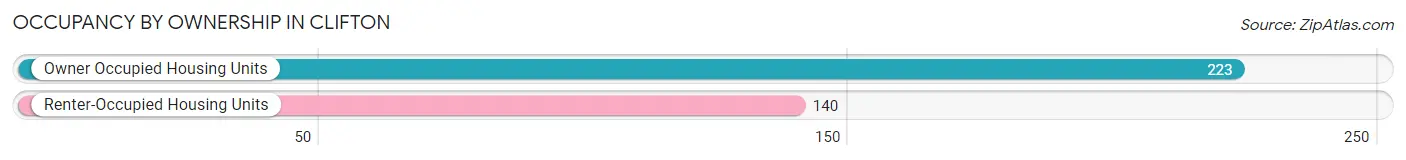
| Occupancy | # Housing Units | % Housing Units |
| Owner Occupied Housing Units | 223 | 61.4% |
| Renter-Occupied Housing Units | 140 | 38.6% |
| Total Occupied Housing Units | 363 | 100.0% |
Occupancy by Household Size in Clifton
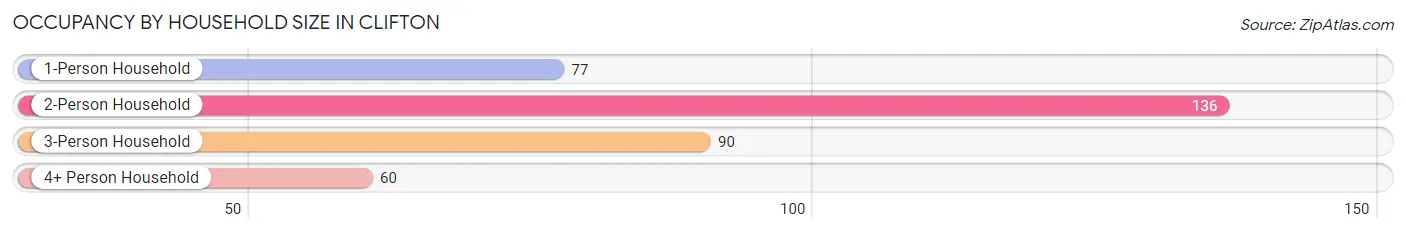
| Household Size | # Housing Units | % Housing Units |
| 1-Person Household | 77 | 21.2% |
| 2-Person Household | 136 | 37.5% |
| 3-Person Household | 90 | 24.8% |
| 4+ Person Household | 60 | 16.5% |
| Total Housing Units | 363 | 100.0% |
Occupancy by Ownership by Household Size in Clifton
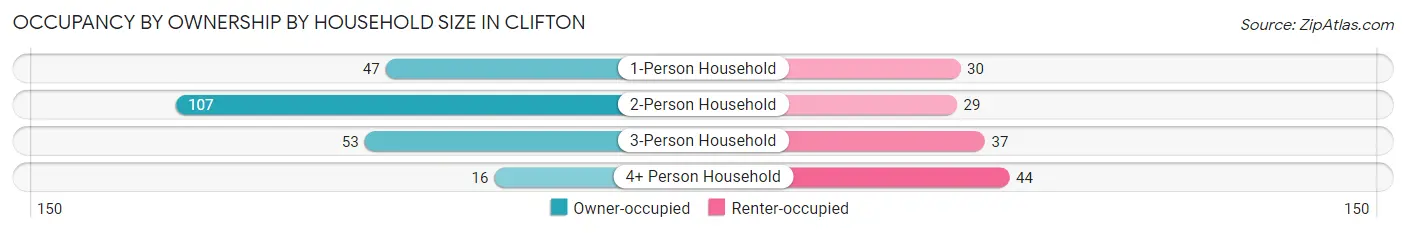
| Household Size | Owner-occupied | Renter-occupied |
| 1-Person Household | 47 (61.0%) | 30 (39.0%) |
| 2-Person Household | 107 (78.7%) | 29 (21.3%) |
| 3-Person Household | 53 (58.9%) | 37 (41.1%) |
| 4+ Person Household | 16 (26.7%) | 44 (73.3%) |
| Total Housing Units | 223 (61.4%) | 140 (38.6%) |
Occupancy by Educational Attainment in Clifton
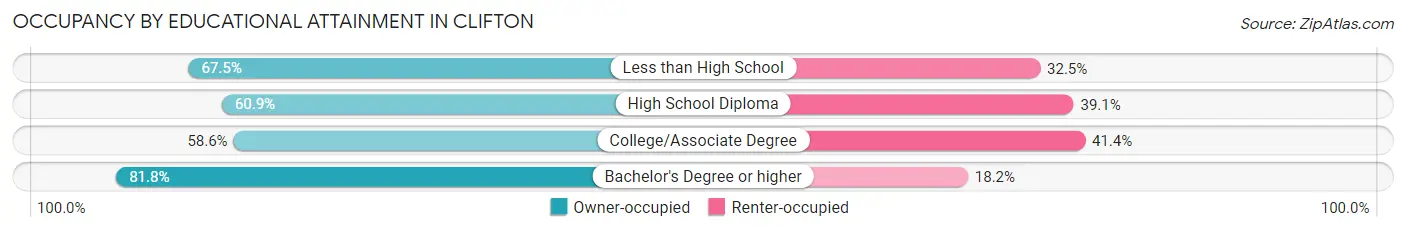
| Household Size | Owner-occupied | Renter-occupied |
| Less than High School | 27 (67.5%) | 13 (32.5%) |
| High School Diploma | 112 (60.9%) | 72 (39.1%) |
| College/Associate Degree | 75 (58.6%) | 53 (41.4%) |
| Bachelor's Degree or higher | 9 (81.8%) | 2 (18.2%) |
Occupancy by Age of Householder in Clifton
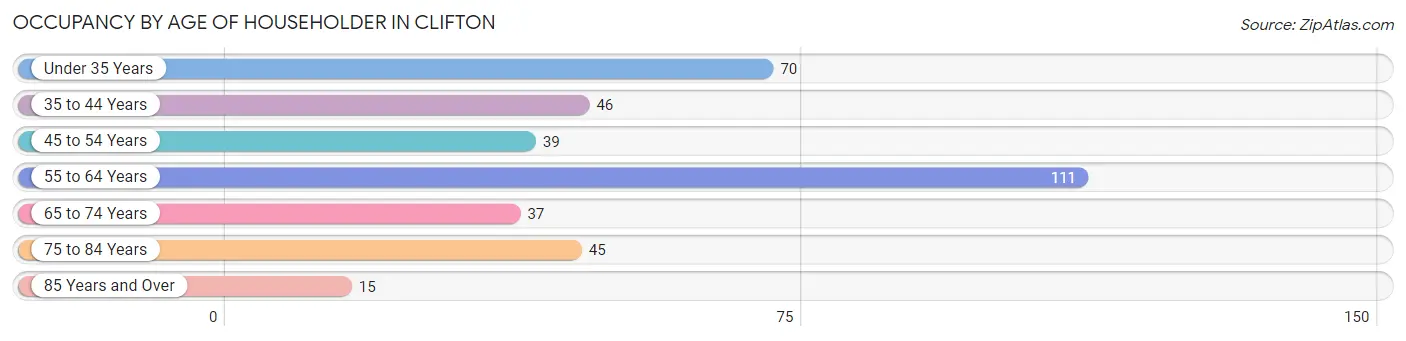
| Age Bracket | # Households | % Households |
| Under 35 Years | 70 | 19.3% |
| 35 to 44 Years | 46 | 12.7% |
| 45 to 54 Years | 39 | 10.7% |
| 55 to 64 Years | 111 | 30.6% |
| 65 to 74 Years | 37 | 10.2% |
| 75 to 84 Years | 45 | 12.4% |
| 85 Years and Over | 15 | 4.1% |
| Total | 363 | 100.0% |
Housing Finances in Clifton
Median Income by Occupancy in Clifton
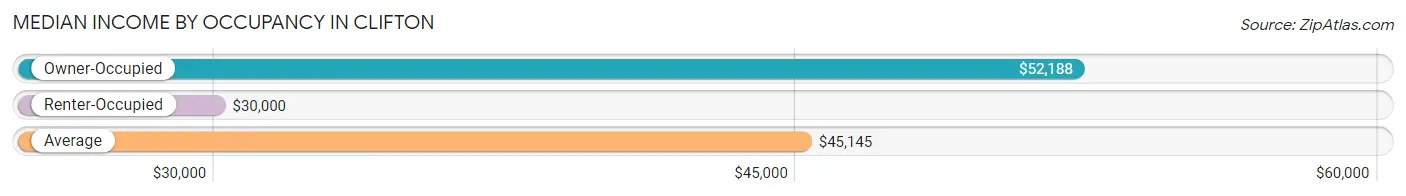
| Occupancy Type | # Households | Median Income |
| Owner-Occupied | 223 (61.4%) | $52,188 |
| Renter-Occupied | 140 (38.6%) | $30,000 |
| Average | 363 (100.0%) | $45,145 |
Occupancy by Householder Income Bracket in Clifton
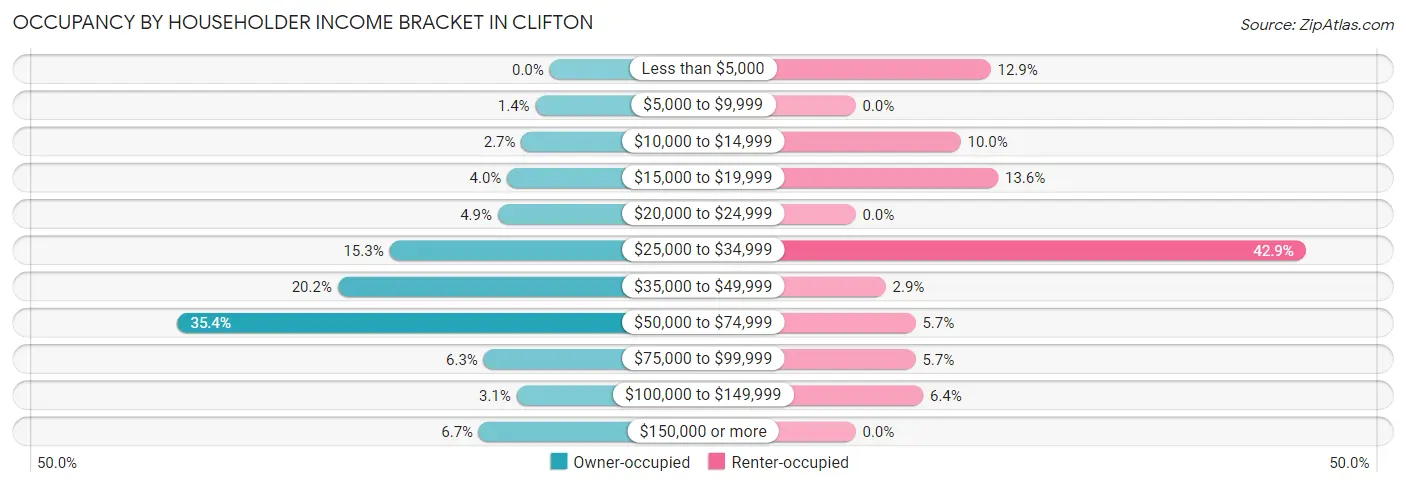
| Income Bracket | Owner-occupied | Renter-occupied |
| Less than $5,000 | 0 (0.0%) | 18 (12.9%) |
| $5,000 to $9,999 | 3 (1.3%) | 0 (0.0%) |
| $10,000 to $14,999 | 6 (2.7%) | 14 (10.0%) |
| $15,000 to $19,999 | 9 (4.0%) | 19 (13.6%) |
| $20,000 to $24,999 | 11 (4.9%) | 0 (0.0%) |
| $25,000 to $34,999 | 34 (15.2%) | 60 (42.9%) |
| $35,000 to $49,999 | 45 (20.2%) | 4 (2.9%) |
| $50,000 to $74,999 | 79 (35.4%) | 8 (5.7%) |
| $75,000 to $99,999 | 14 (6.3%) | 8 (5.7%) |
| $100,000 to $149,999 | 7 (3.1%) | 9 (6.4%) |
| $150,000 or more | 15 (6.7%) | 0 (0.0%) |
| Total | 223 (100.0%) | 140 (100.0%) |
Monthly Housing Cost Tiers in Clifton
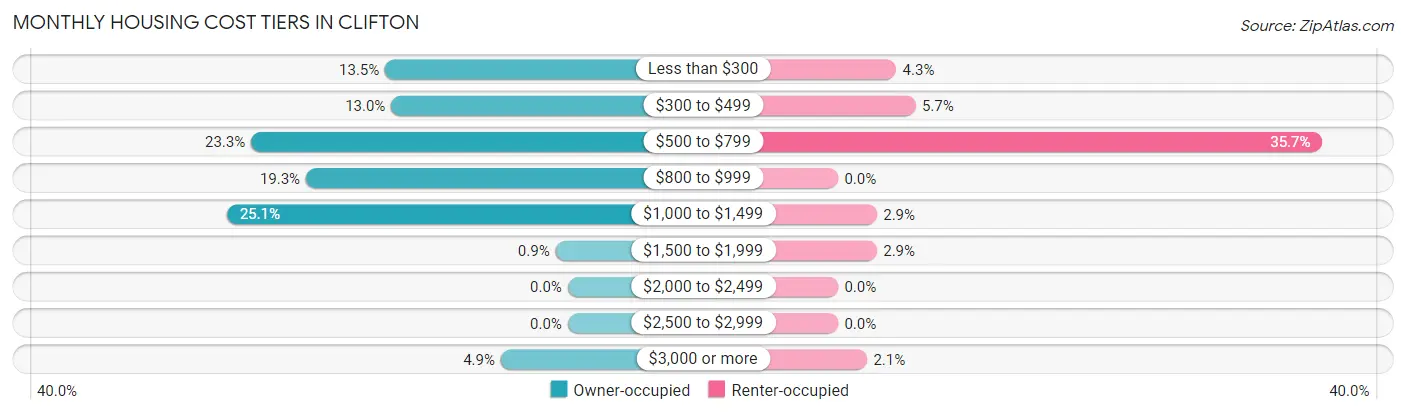
| Monthly Cost | Owner-occupied | Renter-occupied |
| Less than $300 | 30 (13.5%) | 6 (4.3%) |
| $300 to $499 | 29 (13.0%) | 8 (5.7%) |
| $500 to $799 | 52 (23.3%) | 50 (35.7%) |
| $800 to $999 | 43 (19.3%) | 0 (0.0%) |
| $1,000 to $1,499 | 56 (25.1%) | 4 (2.9%) |
| $1,500 to $1,999 | 2 (0.9%) | 4 (2.9%) |
| $2,000 to $2,499 | 0 (0.0%) | 0 (0.0%) |
| $2,500 to $2,999 | 0 (0.0%) | 0 (0.0%) |
| $3,000 or more | 11 (4.9%) | 3 (2.1%) |
| Total | 223 (100.0%) | 140 (100.0%) |
Physical Housing Characteristics in Clifton
Housing Structures in Clifton
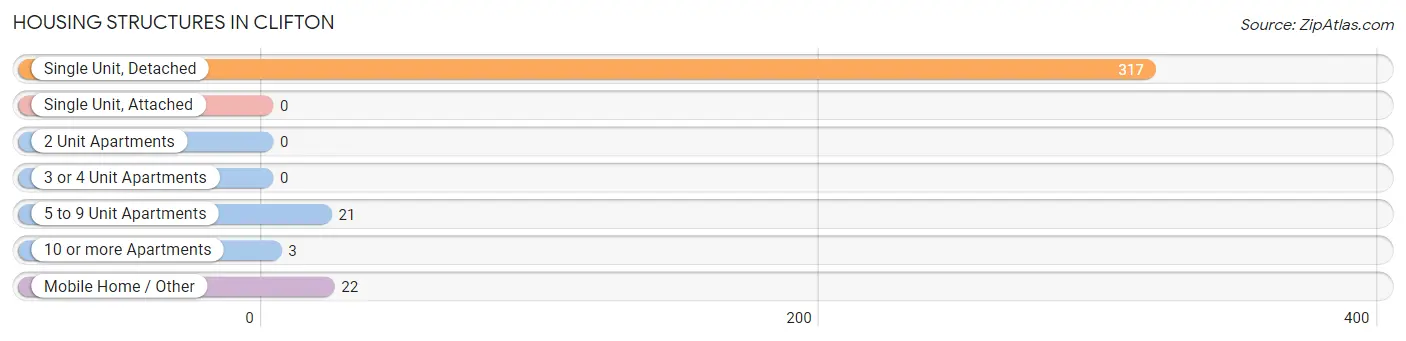
| Structure Type | # Housing Units | % Housing Units |
| Single Unit, Detached | 317 | 87.3% |
| Single Unit, Attached | 0 | 0.0% |
| 2 Unit Apartments | 0 | 0.0% |
| 3 or 4 Unit Apartments | 0 | 0.0% |
| 5 to 9 Unit Apartments | 21 | 5.8% |
| 10 or more Apartments | 3 | 0.8% |
| Mobile Home / Other | 22 | 6.1% |
| Total | 363 | 100.0% |
Housing Structures by Occupancy in Clifton
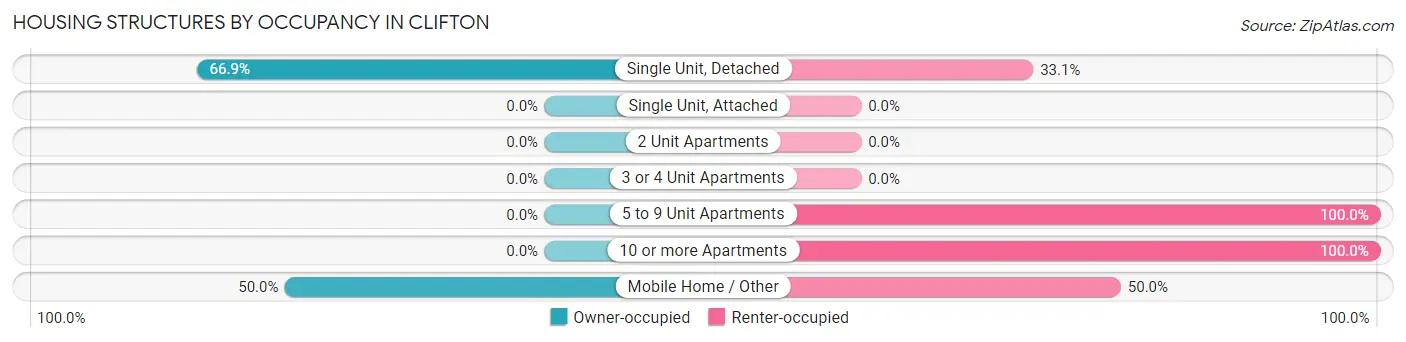
| Structure Type | Owner-occupied | Renter-occupied |
| Single Unit, Detached | 212 (66.9%) | 105 (33.1%) |
| Single Unit, Attached | 0 (0.0%) | 0 (0.0%) |
| 2 Unit Apartments | 0 (0.0%) | 0 (0.0%) |
| 3 or 4 Unit Apartments | 0 (0.0%) | 0 (0.0%) |
| 5 to 9 Unit Apartments | 0 (0.0%) | 21 (100.0%) |
| 10 or more Apartments | 0 (0.0%) | 3 (100.0%) |
| Mobile Home / Other | 11 (50.0%) | 11 (50.0%) |
| Total | 223 (61.4%) | 140 (38.6%) |
Housing Structures by Number of Rooms in Clifton
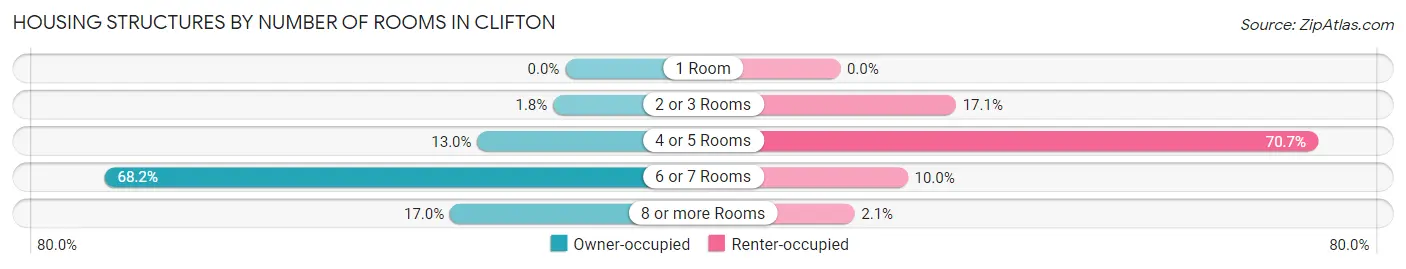
| Number of Rooms | Owner-occupied | Renter-occupied |
| 1 Room | 0 (0.0%) | 0 (0.0%) |
| 2 or 3 Rooms | 4 (1.8%) | 24 (17.1%) |
| 4 or 5 Rooms | 29 (13.0%) | 99 (70.7%) |
| 6 or 7 Rooms | 152 (68.2%) | 14 (10.0%) |
| 8 or more Rooms | 38 (17.0%) | 3 (2.1%) |
| Total | 223 (100.0%) | 140 (100.0%) |
Housing Structure by Heating Type in Clifton
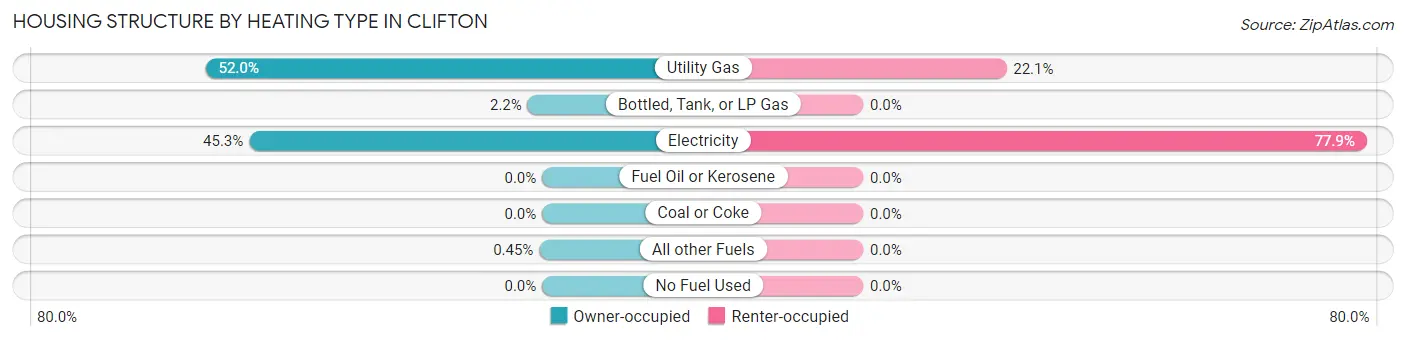
| Heating Type | Owner-occupied | Renter-occupied |
| Utility Gas | 116 (52.0%) | 31 (22.1%) |
| Bottled, Tank, or LP Gas | 5 (2.2%) | 0 (0.0%) |
| Electricity | 101 (45.3%) | 109 (77.9%) |
| Fuel Oil or Kerosene | 0 (0.0%) | 0 (0.0%) |
| Coal or Coke | 0 (0.0%) | 0 (0.0%) |
| All other Fuels | 1 (0.4%) | 0 (0.0%) |
| No Fuel Used | 0 (0.0%) | 0 (0.0%) |
| Total | 223 (100.0%) | 140 (100.0%) |
Household Vehicle Usage in Clifton
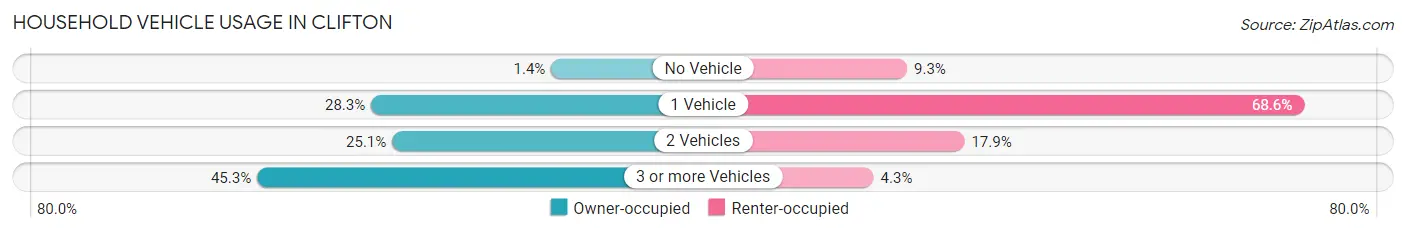
| Vehicles per Household | Owner-occupied | Renter-occupied |
| No Vehicle | 3 (1.3%) | 13 (9.3%) |
| 1 Vehicle | 63 (28.2%) | 96 (68.6%) |
| 2 Vehicles | 56 (25.1%) | 25 (17.9%) |
| 3 or more Vehicles | 101 (45.3%) | 6 (4.3%) |
| Total | 223 (100.0%) | 140 (100.0%) |
Real Estate & Mortgages in Clifton
Real Estate and Mortgage Overview in Clifton
| Characteristic | Without Mortgage | With Mortgage |
| Housing Units | 115 | 108 |
| Median Property Value | $171,500 | $130,200 |
| Median Household Income | $63,281 | $8 |
| Monthly Housing Costs | $503 | $11 |
| Real Estate Taxes | $809 | $0 |
Property Value by Mortgage Status in Clifton
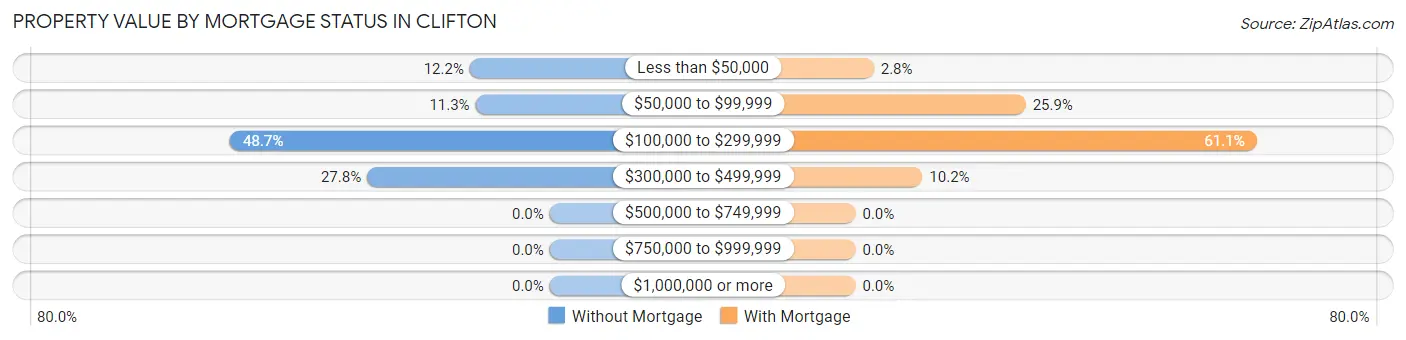
| Property Value | Without Mortgage | With Mortgage |
| Less than $50,000 | 14 (12.2%) | 3 (2.8%) |
| $50,000 to $99,999 | 13 (11.3%) | 28 (25.9%) |
| $100,000 to $299,999 | 56 (48.7%) | 66 (61.1%) |
| $300,000 to $499,999 | 32 (27.8%) | 11 (10.2%) |
| $500,000 to $749,999 | 0 (0.0%) | 0 (0.0%) |
| $750,000 to $999,999 | 0 (0.0%) | 0 (0.0%) |
| $1,000,000 or more | 0 (0.0%) | 0 (0.0%) |
| Total | 115 (100.0%) | 108 (100.0%) |
Household Income by Mortgage Status in Clifton
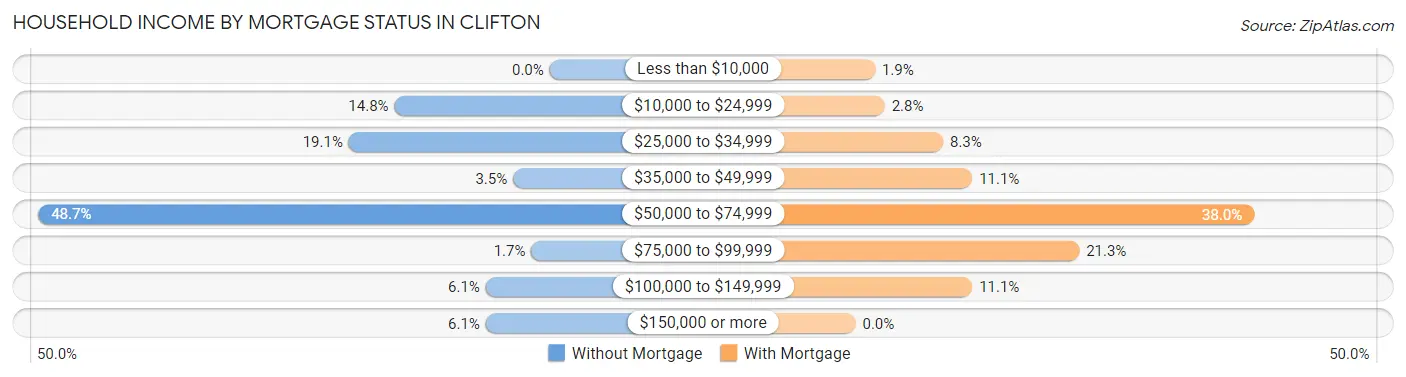
| Household Income | Without Mortgage | With Mortgage |
| Less than $10,000 | 0 (0.0%) | 2 (1.8%) |
| $10,000 to $24,999 | 17 (14.8%) | 3 (2.8%) |
| $25,000 to $34,999 | 22 (19.1%) | 9 (8.3%) |
| $35,000 to $49,999 | 4 (3.5%) | 12 (11.1%) |
| $50,000 to $74,999 | 56 (48.7%) | 41 (38.0%) |
| $75,000 to $99,999 | 2 (1.7%) | 23 (21.3%) |
| $100,000 to $149,999 | 7 (6.1%) | 12 (11.1%) |
| $150,000 or more | 7 (6.1%) | 0 (0.0%) |
| Total | 115 (100.0%) | 108 (100.0%) |
Property Value to Household Income Ratio in Clifton
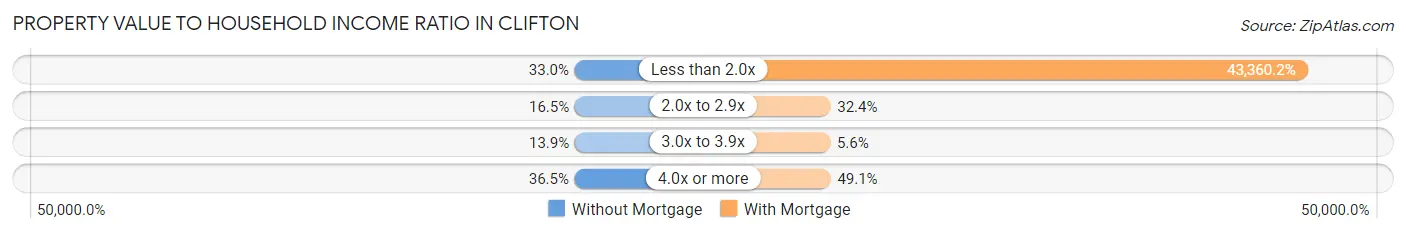
| Value-to-Income Ratio | Without Mortgage | With Mortgage |
| Less than 2.0x | 38 (33.0%) | 46,829 (43,360.2%) |
| 2.0x to 2.9x | 19 (16.5%) | 35 (32.4%) |
| 3.0x to 3.9x | 16 (13.9%) | 6 (5.6%) |
| 4.0x or more | 42 (36.5%) | 53 (49.1%) |
| Total | 115 (100.0%) | 108 (100.0%) |
Real Estate Taxes by Mortgage Status in Clifton
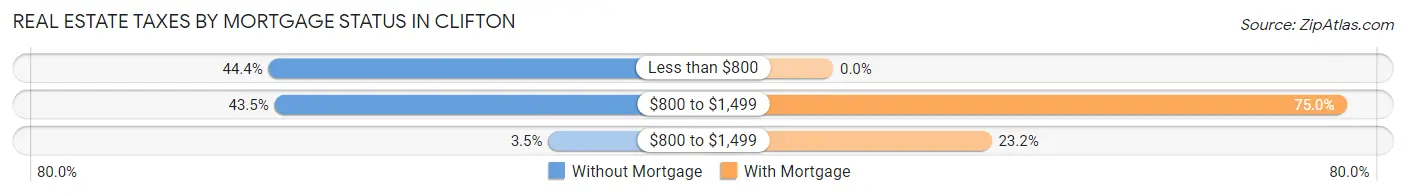
| Property Taxes | Without Mortgage | With Mortgage |
| Less than $800 | 51 (44.4%) | 0 (0.0%) |
| $800 to $1,499 | 50 (43.5%) | 81 (75.0%) |
| $800 to $1,499 | 4 (3.5%) | 25 (23.2%) |
| Total | 115 (100.0%) | 108 (100.0%) |
Health & Disability in Clifton
Health Insurance Coverage by Age in Clifton
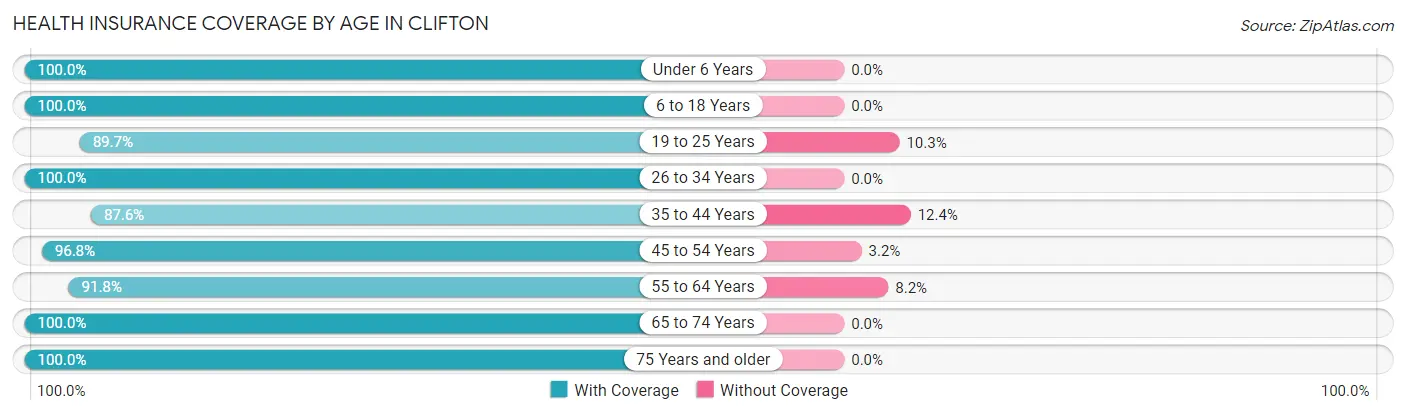
| Age Bracket | With Coverage | Without Coverage |
| Under 6 Years | 44 (100.0%) | 0 (0.0%) |
| 6 to 18 Years | 267 (100.0%) | 0 (0.0%) |
| 19 to 25 Years | 61 (89.7%) | 7 (10.3%) |
| 26 to 34 Years | 92 (100.0%) | 0 (0.0%) |
| 35 to 44 Years | 177 (87.6%) | 25 (12.4%) |
| 45 to 54 Years | 90 (96.8%) | 3 (3.2%) |
| 55 to 64 Years | 190 (91.8%) | 17 (8.2%) |
| 65 to 74 Years | 69 (100.0%) | 0 (0.0%) |
| 75 Years and older | 79 (100.0%) | 0 (0.0%) |
| Total | 1,069 (95.4%) | 52 (4.6%) |
Health Insurance Coverage by Citizenship Status in Clifton
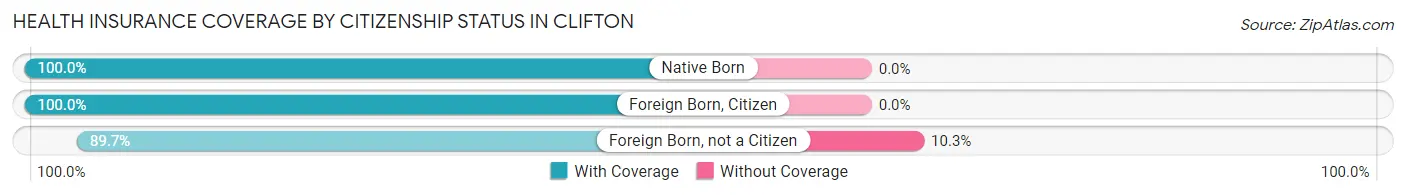
| Citizenship Status | With Coverage | Without Coverage |
| Native Born | 44 (100.0%) | 0 (0.0%) |
| Foreign Born, Citizen | 267 (100.0%) | 0 (0.0%) |
| Foreign Born, not a Citizen | 61 (89.7%) | 7 (10.3%) |
Health Insurance Coverage by Household Income in Clifton
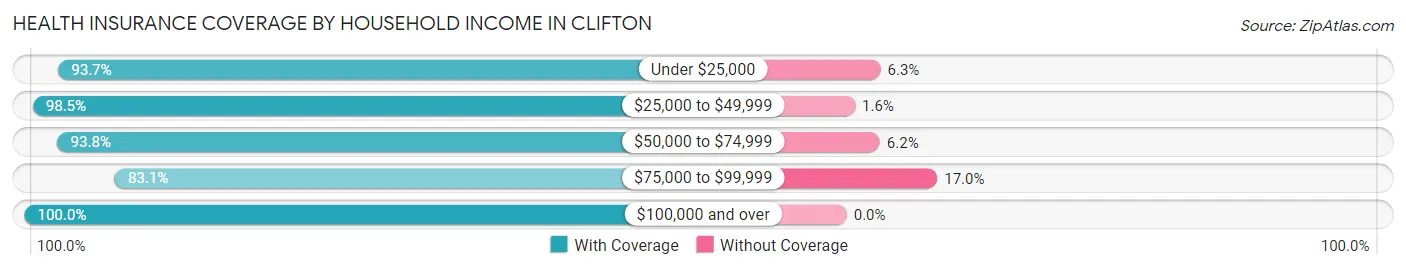
| Household Income | With Coverage | Without Coverage |
| Under $25,000 | 311 (93.7%) | 21 (6.3%) |
| $25,000 to $49,999 | 381 (98.5%) | 6 (1.5%) |
| $50,000 to $74,999 | 227 (93.8%) | 15 (6.2%) |
| $75,000 to $99,999 | 49 (83.1%) | 10 (17.0%) |
| $100,000 and over | 101 (100.0%) | 0 (0.0%) |
Public vs Private Health Insurance Coverage by Age in Clifton
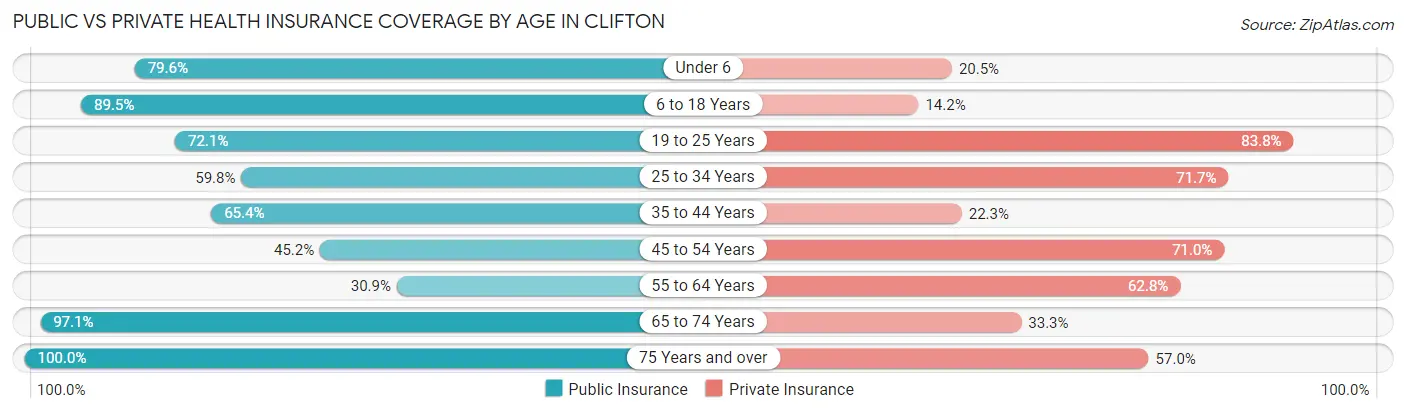
| Age Bracket | Public Insurance | Private Insurance |
| Under 6 | 35 (79.5%) | 9 (20.4%) |
| 6 to 18 Years | 239 (89.5%) | 38 (14.2%) |
| 19 to 25 Years | 49 (72.1%) | 57 (83.8%) |
| 25 to 34 Years | 55 (59.8%) | 66 (71.7%) |
| 35 to 44 Years | 132 (65.3%) | 45 (22.3%) |
| 45 to 54 Years | 42 (45.2%) | 66 (71.0%) |
| 55 to 64 Years | 64 (30.9%) | 130 (62.8%) |
| 65 to 74 Years | 67 (97.1%) | 23 (33.3%) |
| 75 Years and over | 79 (100.0%) | 45 (57.0%) |
| Total | 762 (68.0%) | 479 (42.7%) |
Disability Status by Sex by Age in Clifton
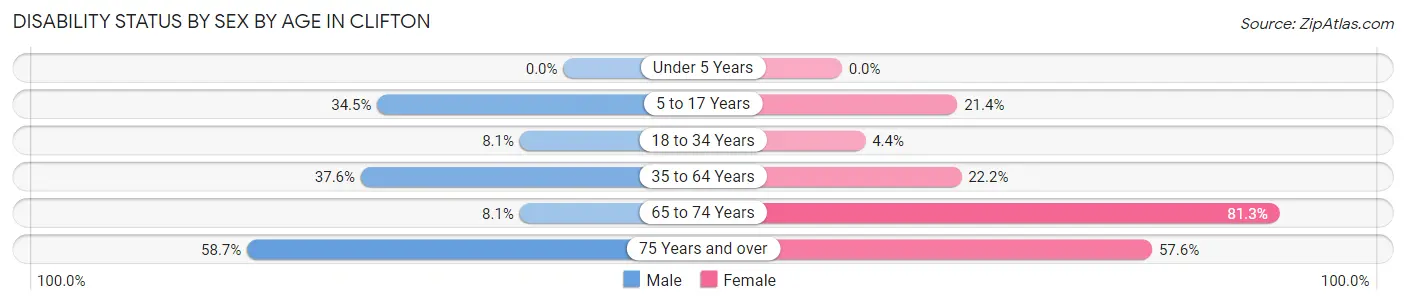
| Age Bracket | Male | Female |
| Under 5 Years | 0 (0.0%) | 0 (0.0%) |
| 5 to 17 Years | 67 (34.5%) | 18 (21.4%) |
| 18 to 34 Years | 8 (8.1%) | 3 (4.3%) |
| 35 to 64 Years | 109 (37.6%) | 47 (22.2%) |
| 65 to 74 Years | 3 (8.1%) | 26 (81.2%) |
| 75 Years and over | 27 (58.7%) | 19 (57.6%) |
Disability Class by Sex by Age in Clifton
Disability Class: Hearing Difficulty
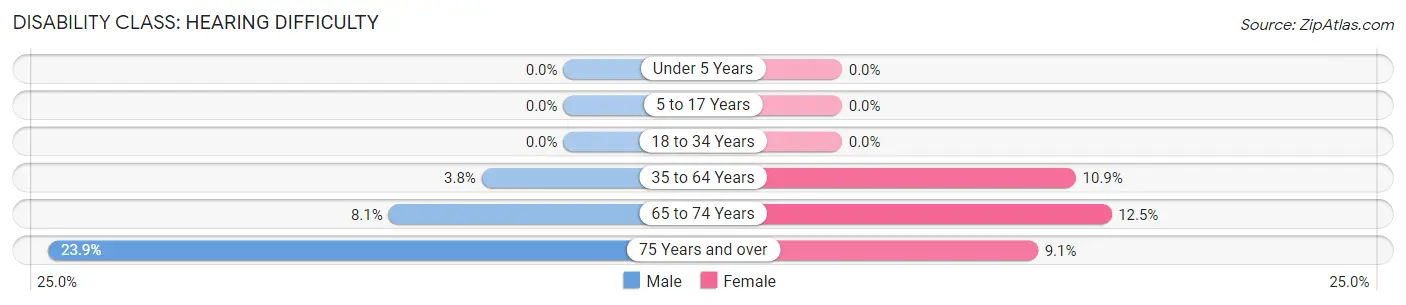
| Age Bracket | Male | Female |
| Under 5 Years | 0 (0.0%) | 0 (0.0%) |
| 5 to 17 Years | 0 (0.0%) | 0 (0.0%) |
| 18 to 34 Years | 0 (0.0%) | 0 (0.0%) |
| 35 to 64 Years | 11 (3.8%) | 23 (10.8%) |
| 65 to 74 Years | 3 (8.1%) | 4 (12.5%) |
| 75 Years and over | 11 (23.9%) | 3 (9.1%) |
Disability Class: Vision Difficulty
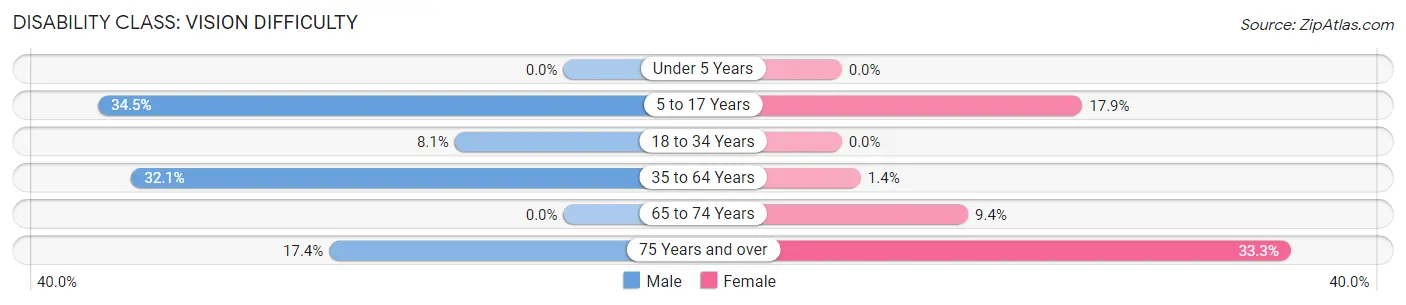
| Age Bracket | Male | Female |
| Under 5 Years | 0 (0.0%) | 0 (0.0%) |
| 5 to 17 Years | 67 (34.5%) | 15 (17.9%) |
| 18 to 34 Years | 8 (8.1%) | 0 (0.0%) |
| 35 to 64 Years | 93 (32.1%) | 3 (1.4%) |
| 65 to 74 Years | 0 (0.0%) | 3 (9.4%) |
| 75 Years and over | 8 (17.4%) | 11 (33.3%) |
Disability Class: Cognitive Difficulty
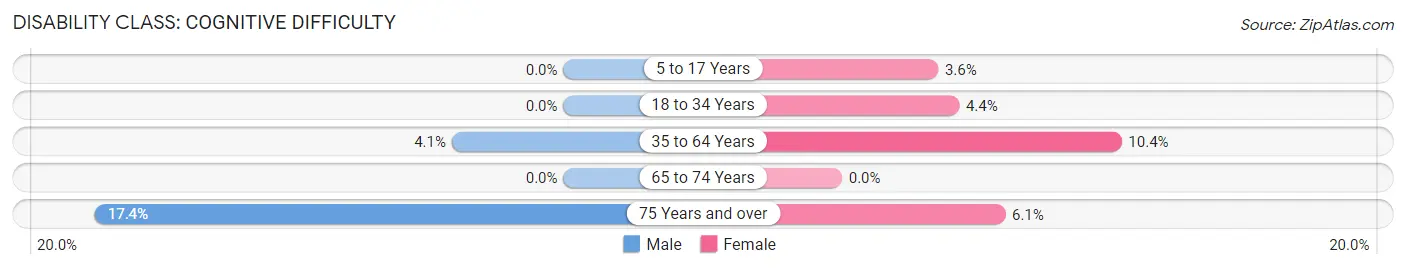
| Age Bracket | Male | Female |
| 5 to 17 Years | 0 (0.0%) | 3 (3.6%) |
| 18 to 34 Years | 0 (0.0%) | 3 (4.3%) |
| 35 to 64 Years | 12 (4.1%) | 22 (10.4%) |
| 65 to 74 Years | 0 (0.0%) | 0 (0.0%) |
| 75 Years and over | 8 (17.4%) | 2 (6.1%) |
Disability Class: Ambulatory Difficulty
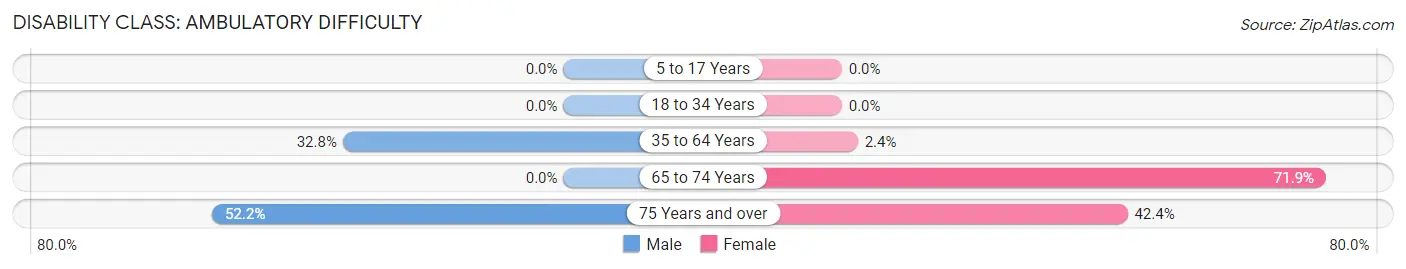
| Age Bracket | Male | Female |
| 5 to 17 Years | 0 (0.0%) | 0 (0.0%) |
| 18 to 34 Years | 0 (0.0%) | 0 (0.0%) |
| 35 to 64 Years | 95 (32.8%) | 5 (2.4%) |
| 65 to 74 Years | 0 (0.0%) | 23 (71.9%) |
| 75 Years and over | 24 (52.2%) | 14 (42.4%) |
Disability Class: Self-Care Difficulty
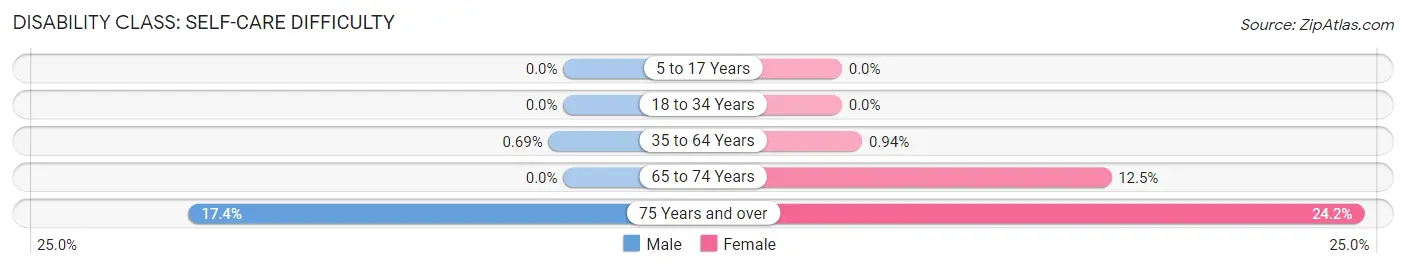
| Age Bracket | Male | Female |
| 5 to 17 Years | 0 (0.0%) | 0 (0.0%) |
| 18 to 34 Years | 0 (0.0%) | 0 (0.0%) |
| 35 to 64 Years | 2 (0.7%) | 2 (0.9%) |
| 65 to 74 Years | 0 (0.0%) | 4 (12.5%) |
| 75 Years and over | 8 (17.4%) | 8 (24.2%) |
Technology Access in Clifton
Computing Device Access in Clifton
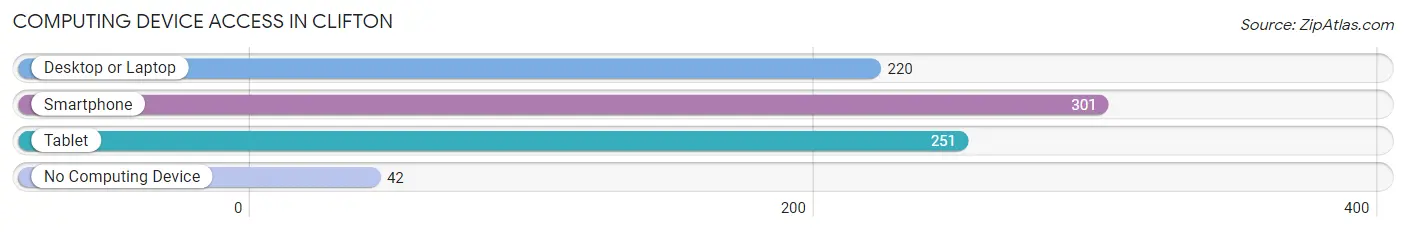
| Device Type | # Households | % Households |
| Desktop or Laptop | 220 | 60.6% |
| Smartphone | 301 | 82.9% |
| Tablet | 251 | 69.2% |
| No Computing Device | 42 | 11.6% |
| Total | 363 | 100.0% |
Internet Access in Clifton
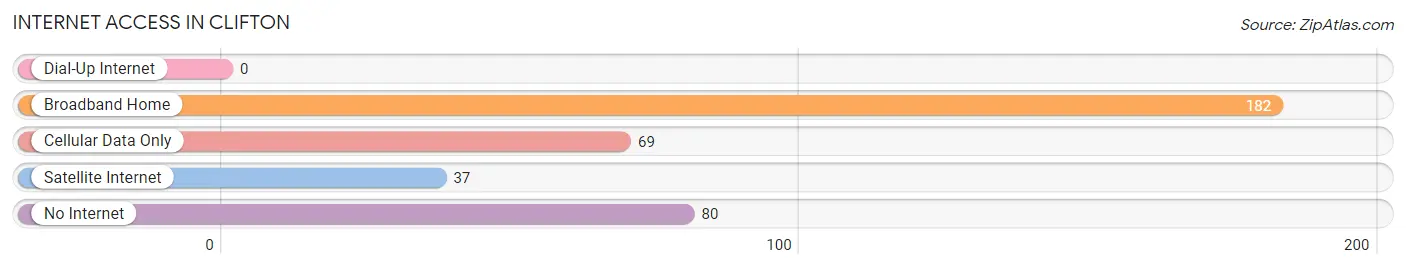
| Internet Type | # Households | % Households |
| Dial-Up Internet | 0 | 0.0% |
| Broadband Home | 182 | 50.1% |
| Cellular Data Only | 69 | 19.0% |
| Satellite Internet | 37 | 10.2% |
| No Internet | 80 | 22.0% |
| Total | 363 | 100.0% |
Clifton Summary
Clifton, Tennessee is a small town located in Wayne County, Tennessee. It is situated on the banks of the Clifton River, which is a tributary of the Tennessee River. The town was founded in 1820 and is the county seat of Wayne County. The population of Clifton was 1,845 as of the 2010 census.
History
Clifton was founded in 1820 by a group of settlers from North Carolina. The town was named after the Clifton River, which runs through the area. The town was originally a trading post and was the first county seat of Wayne County. In 1821, the first courthouse was built in Clifton. The town was incorporated in 1836 and the first post office was established in 1837.
In the late 19th century, Clifton was a thriving agricultural center. The town was home to several cotton gins, a sawmill, and a gristmill. The town also had a hotel, a bank, and several stores.
In the early 20th century, Clifton began to decline as the railroad bypassed the town. The population decreased and many of the businesses closed. In the 1950s, the town was revitalized with the construction of a new courthouse and the opening of a new school.
Geography
Clifton is located in Wayne County, Tennessee. It is situated on the banks of the Clifton River, which is a tributary of the Tennessee River. The town is located at an elevation of 545 feet above sea level.
The climate in Clifton is humid subtropical, with hot summers and mild winters. The average annual temperature is 63°F. The average annual precipitation is 48 inches.
Economy
The economy of Clifton is largely based on agriculture. The town is home to several farms, which produce corn, soybeans, cotton, and hay. The town also has several small businesses, including a grocery store, a hardware store, and a restaurant.
Demographics
As of the 2010 census, the population of Clifton was 1,845. The racial makeup of the town was 95.3% White, 2.2% African American, 0.3% Native American, 0.2% Asian, 0.1% Pacific Islander, 0.7% from other races, and 1.3% from two or more races. Hispanic or Latino of any race were 1.7% of the population.
The median household income in Clifton was $30,938, and the median family income was $37,813. The per capita income was $17,845. About 17.2% of the population was below the poverty line.
Common Questions
What is Per Capita Income in Clifton?
Per Capita income in Clifton is $11,789.
What is the Median Family Income in Clifton?
Median Family Income in Clifton is $50,208.
What is the Median Household income in Clifton?
Median Household Income in Clifton is $45,145.
What is Income or Wage Gap in Clifton?
Income or Wage Gap in Clifton is 49.2%.
Women in Clifton earn 50.8 cents for every dollar earned by a man.
What is Inequality or Gini Index in Clifton?
Inequality or Gini Index in Clifton is 0.38.
What is the Total Population of Clifton?
Total Population of Clifton is 2,622.
What is the Total Male Population of Clifton?
Total Male Population of Clifton is 2,192.
What is the Total Female Population of Clifton?
Total Female Population of Clifton is 430.
What is the Ratio of Males per 100 Females in Clifton?
There are 509.77 Males per 100 Females in Clifton.
What is the Ratio of Females per 100 Males in Clifton?
There are 19.62 Females per 100 Males in Clifton.
What is the Median Population Age in Clifton?
Median Population Age in Clifton is 44.5 Years.
What is the Average Family Size in Clifton
Average Family Size in Clifton is 3.5 People.
What is the Average Household Size in Clifton
Average Household Size in Clifton is 3.1 People.
How Large is the Labor Force in Clifton?
There are 377 People in the Labor Forcein in Clifton.
What is the Percentage of People in the Labor Force in Clifton?
15.9% of People are in the Labor Force in Clifton.
What is the Unemployment Rate in Clifton?
Unemployment Rate in Clifton is 3.2%.