Pulaski, TN Map & Demographics
Pulaski Map
Pulaski Overview
$23,826
PER CAPITA INCOME
$49,800
AVG FAMILY INCOME
$41,585
AVG HOUSEHOLD INCOME
13.0%
WAGE / INCOME GAP [ % ]
87.0¢/ $1
WAGE / INCOME GAP [ $ ]
0.49
INEQUALITY / GINI INDEX
8,301
TOTAL POPULATION
3,916
MALE POPULATION
4,385
FEMALE POPULATION
89.30
MALES / 100 FEMALES
111.98
FEMALES / 100 MALES
39.9
MEDIAN AGE
2.9
AVG FAMILY SIZE
2.3
AVG HOUSEHOLD SIZE
3,258
LABOR FORCE [ PEOPLE ]
48.8%
PERCENT IN LABOR FORCE
7.4%
UNEMPLOYMENT RATE
Pulaski Zip Codes
Pulaski Area Codes
Income in Pulaski
Income Overview in Pulaski
Per Capita Income in Pulaski is $23,826, while median incomes of families and households are $49,800 and $41,585 respectively.
| Characteristic | Number | Measure |
| Per Capita Income | 8,301 | $23,826 |
| Median Family Income | 1,982 | $49,800 |
| Mean Family Income | 1,982 | $64,318 |
| Median Household Income | 3,316 | $41,585 |
| Mean Household Income | 3,316 | $53,681 |
| Income Deficit | 1,982 | $0 |
| Wage / Income Gap (%) | 8,301 | 12.97% |
| Wage / Income Gap ($) | 8,301 | 87.03¢ per $1 |
| Gini / Inequality Index | 8,301 | 0.49 |
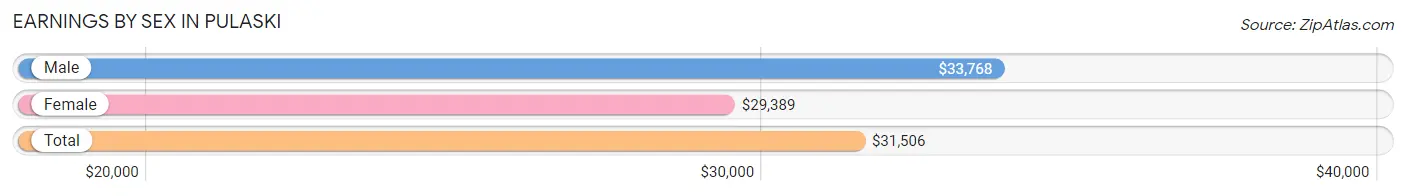
Earnings by Sex in Pulaski
Average Earnings in Pulaski are $31,506, $33,768 for men and $29,389 for women, a difference of 13.0%.
| Sex | Number | Average Earnings |
| Male | 1,678 (46.2%) | $33,768 |
| Female | 1,956 (53.8%) | $29,389 |
| Total | 3,634 (100.0%) | $31,506 |
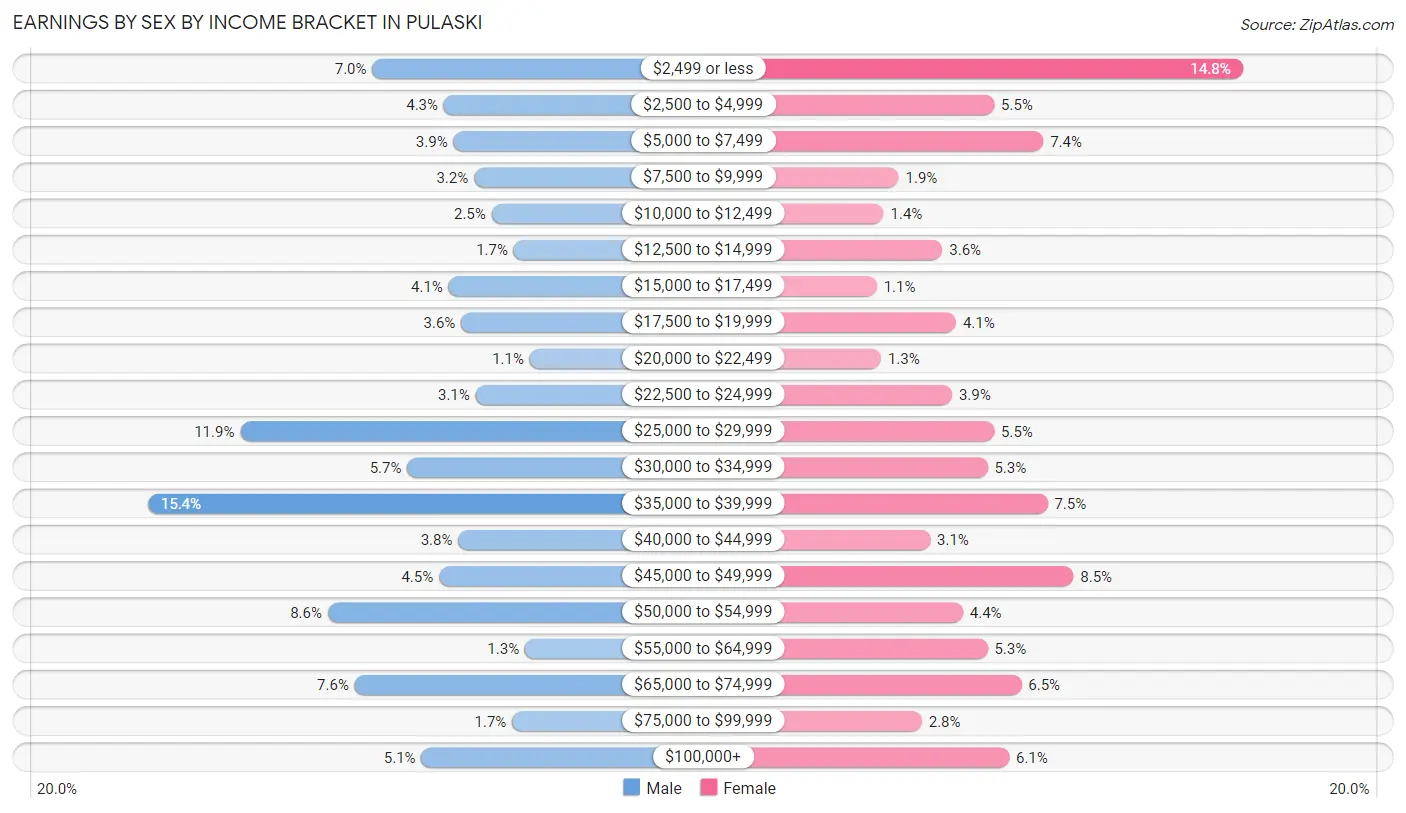
Earnings by Sex by Income Bracket in Pulaski
The most common earnings brackets in Pulaski are $35,000 to $39,999 for men (258 | 15.4%) and $2,499 or less for women (290 | 14.8%).
| Income | Male | Female |
| $2,499 or less | 117 (7.0%) | 290 (14.8%) |
| $2,500 to $4,999 | 72 (4.3%) | 108 (5.5%) |
| $5,000 to $7,499 | 66 (3.9%) | 144 (7.4%) |
| $7,500 to $9,999 | 53 (3.2%) | 38 (1.9%) |
| $10,000 to $12,499 | 42 (2.5%) | 27 (1.4%) |
| $12,500 to $14,999 | 28 (1.7%) | 70 (3.6%) |
| $15,000 to $17,499 | 69 (4.1%) | 22 (1.1%) |
| $17,500 to $19,999 | 61 (3.6%) | 80 (4.1%) |
| $20,000 to $22,499 | 18 (1.1%) | 25 (1.3%) |
| $22,500 to $24,999 | 52 (3.1%) | 77 (3.9%) |
| $25,000 to $29,999 | 200 (11.9%) | 108 (5.5%) |
| $30,000 to $34,999 | 95 (5.7%) | 103 (5.3%) |
| $35,000 to $39,999 | 258 (15.4%) | 147 (7.5%) |
| $40,000 to $44,999 | 63 (3.7%) | 61 (3.1%) |
| $45,000 to $49,999 | 75 (4.5%) | 166 (8.5%) |
| $50,000 to $54,999 | 145 (8.6%) | 85 (4.3%) |
| $55,000 to $64,999 | 21 (1.3%) | 103 (5.3%) |
| $65,000 to $74,999 | 128 (7.6%) | 128 (6.5%) |
| $75,000 to $99,999 | 29 (1.7%) | 55 (2.8%) |
| $100,000+ | 86 (5.1%) | 119 (6.1%) |
| Total | 1,678 (100.0%) | 1,956 (100.0%) |
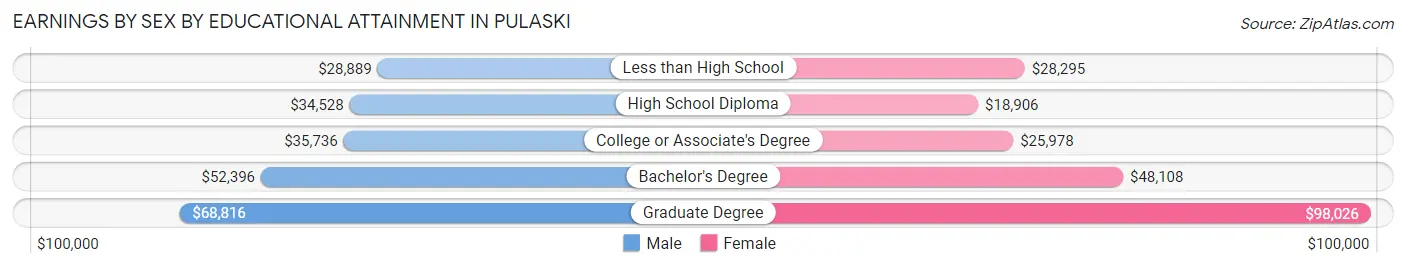
Earnings by Sex by Educational Attainment in Pulaski
Average earnings in Pulaski are $36,083 for men and $34,375 for women, a difference of 4.7%. Men with an educational attainment of graduate degree enjoy the highest average annual earnings of $68,816, while those with less than high school education earn the least with $28,889. Women with an educational attainment of graduate degree earn the most with the average annual earnings of $98,026, while those with high school diploma education have the smallest earnings of $18,906.
| Educational Attainment | Male Income | Female Income |
| Less than High School | $28,889 | $28,295 |
| High School Diploma | $34,528 | $18,906 |
| College or Associate's Degree | $35,736 | $25,978 |
| Bachelor's Degree | $52,396 | $48,108 |
| Graduate Degree | $68,816 | $98,026 |
| Total | $36,083 | $34,375 |
Family Income in Pulaski
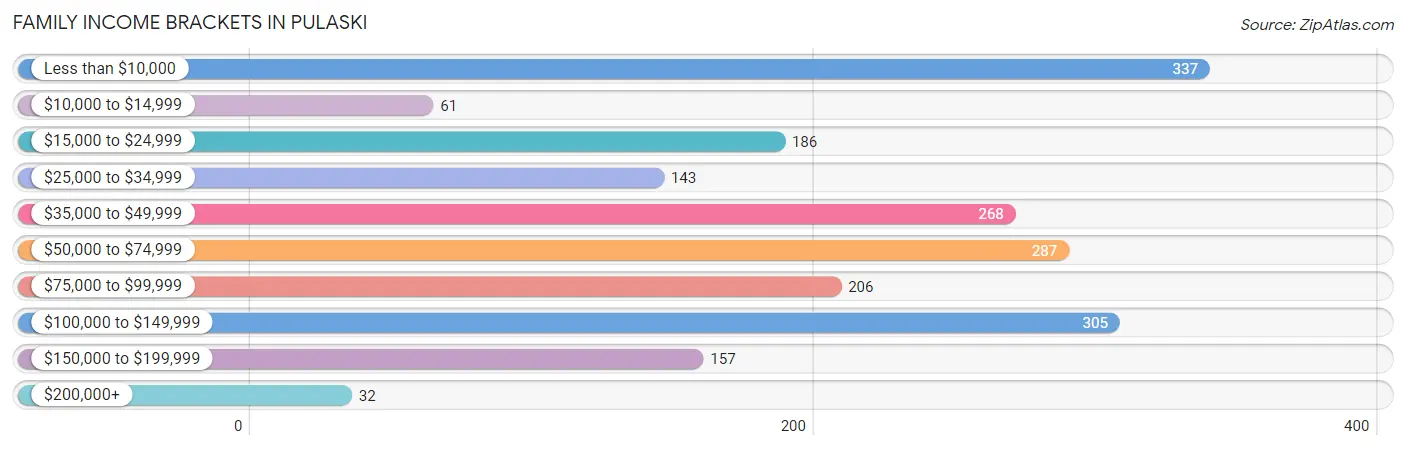
Family Income Brackets in Pulaski
According to the Pulaski family income data, there are 337 families falling into the less than $10,000 income range, which is the most common income bracket and makes up 17.0% of all families. Conversely, the $200,000+ income bracket is the least frequent group with only 32 families (1.6%) belonging to this category.
| Income Bracket | # Families | % Families |
| Less than $10,000 | 337 | 17.0% |
| $10,000 to $14,999 | 61 | 3.1% |
| $15,000 to $24,999 | 186 | 9.4% |
| $25,000 to $34,999 | 143 | 7.2% |
| $35,000 to $49,999 | 268 | 13.5% |
| $50,000 to $74,999 | 287 | 14.5% |
| $75,000 to $99,999 | 206 | 10.4% |
| $100,000 to $149,999 | 305 | 15.4% |
| $150,000 to $199,999 | 157 | 7.9% |
| $200,000+ | 32 | 1.6% |
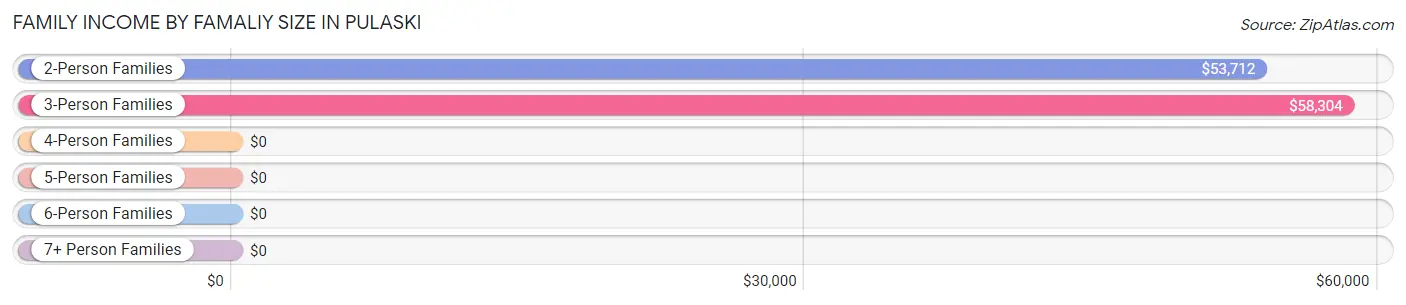
Family Income by Famaliy Size in Pulaski
3-person families (529 | 26.7%) account for the highest median family income in Pulaski with $58,304 per family, while 2-person families (1,228 | 62.0%) have the highest median income of $26,856 per family member.
| Income Bracket | # Families | Median Income |
| 2-Person Families | 1,228 (62.0%) | $53,712 |
| 3-Person Families | 529 (26.7%) | $58,304 |
| 4-Person Families | 188 (9.5%) | $0 |
| 5-Person Families | 37 (1.9%) | $0 |
| 6-Person Families | 0 (0.0%) | $0 |
| 7+ Person Families | 0 (0.0%) | $0 |
| Total | 1,982 (100.0%) | $49,800 |
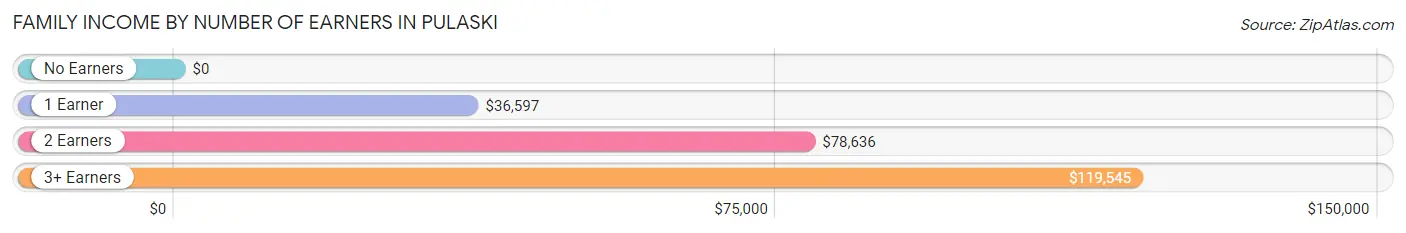
Family Income by Number of Earners in Pulaski
| Number of Earners | # Families | Median Income |
| No Earners | 616 (31.1%) | $0 |
| 1 Earner | 728 (36.7%) | $36,597 |
| 2 Earners | 528 (26.6%) | $78,636 |
| 3+ Earners | 110 (5.6%) | $119,545 |
| Total | 1,982 (100.0%) | $49,800 |
Household Income in Pulaski
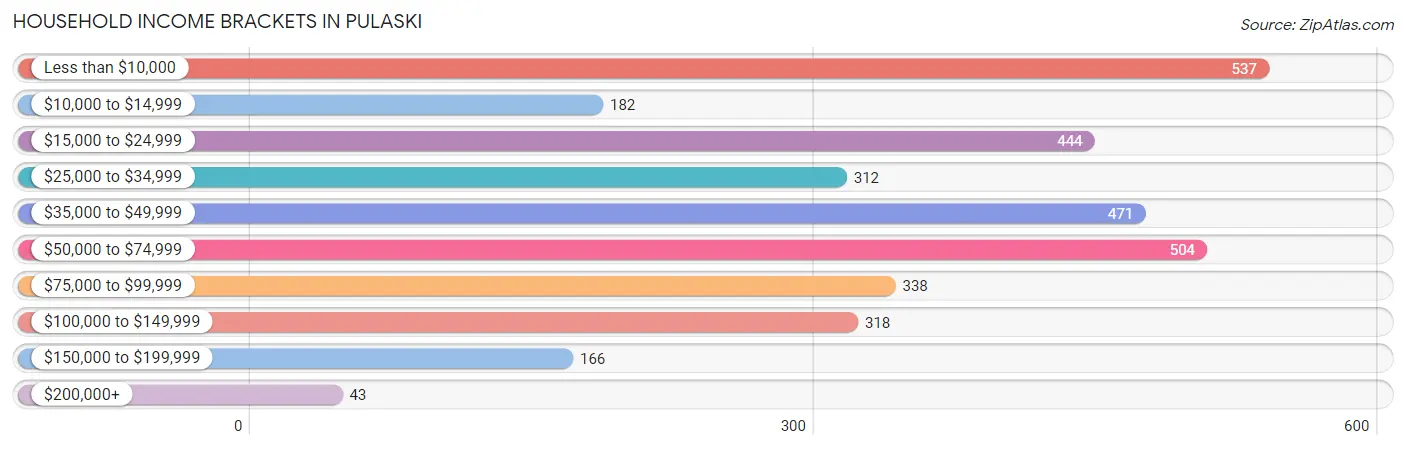
Household Income Brackets in Pulaski
With 537 households falling in the category, the less than $10,000 income range is the most frequent in Pulaski, accounting for 16.2% of all households. In contrast, only 43 households (1.3%) fall into the $200,000+ income bracket, making it the least populous group.
| Income Bracket | # Households | % Households |
| Less than $10,000 | 537 | 16.2% |
| $10,000 to $14,999 | 182 | 5.5% |
| $15,000 to $24,999 | 444 | 13.4% |
| $25,000 to $34,999 | 312 | 9.4% |
| $35,000 to $49,999 | 471 | 14.2% |
| $50,000 to $74,999 | 504 | 15.2% |
| $75,000 to $99,999 | 338 | 10.2% |
| $100,000 to $149,999 | 318 | 9.6% |
| $150,000 to $199,999 | 166 | 5.0% |
| $200,000+ | 43 | 1.3% |
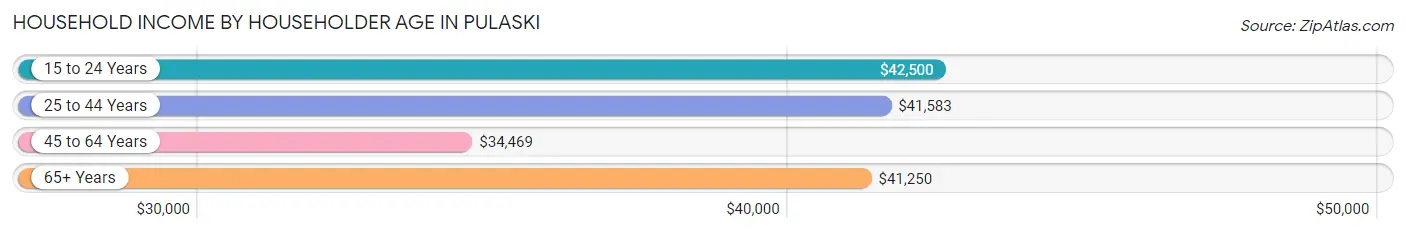
Household Income by Householder Age in Pulaski
The median household income in Pulaski is $41,585, with the highest median household income of $42,500 found in the 15 to 24 years age bracket for the primary householder. A total of 166 households (5.0%) fall into this category. Meanwhile, the 45 to 64 years age bracket for the primary householder has the lowest median household income of $34,469, with 1,149 households (34.6%) in this group.
| Income Bracket | # Households | Median Income |
| 15 to 24 Years | 166 (5.0%) | $42,500 |
| 25 to 44 Years | 952 (28.7%) | $41,583 |
| 45 to 64 Years | 1,149 (34.6%) | $34,469 |
| 65+ Years | 1,049 (31.6%) | $41,250 |
| Total | 3,316 (100.0%) | $41,585 |
Poverty in Pulaski
Income Below Poverty by Sex and Age in Pulaski
With 25.9% poverty level for males and 30.7% for females among the residents of Pulaski, 6 to 11 year old males and 5 year old females are the most vulnerable to poverty, with 159 males (70.4%) and 12 females (100.0%) in their respective age groups living below the poverty level.
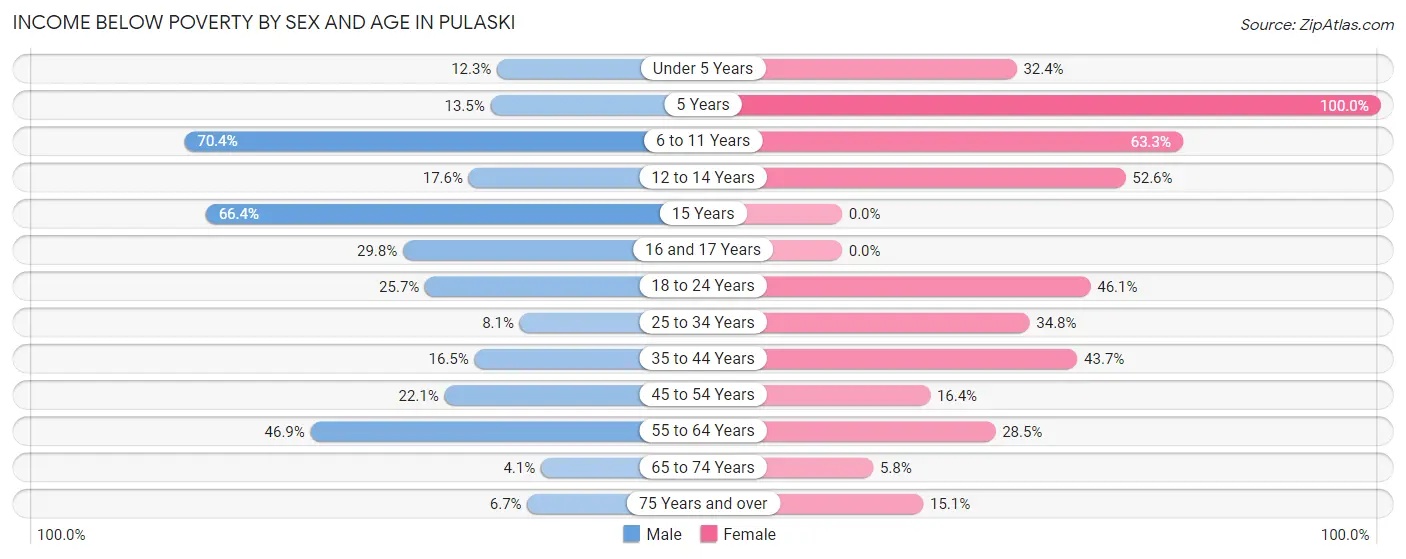
| Age Bracket | Male | Female |
| Under 5 Years | 21 (12.3%) | 95 (32.4%) |
| 5 Years | 10 (13.5%) | 12 (100.0%) |
| 6 to 11 Years | 159 (70.4%) | 231 (63.3%) |
| 12 to 14 Years | 33 (17.5%) | 50 (52.6%) |
| 15 Years | 77 (66.4%) | 0 (0.0%) |
| 16 and 17 Years | 25 (29.8%) | 0 (0.0%) |
| 18 to 24 Years | 118 (25.7%) | 113 (46.1%) |
| 25 to 34 Years | 27 (8.1%) | 211 (34.8%) |
| 35 to 44 Years | 71 (16.5%) | 180 (43.7%) |
| 45 to 54 Years | 101 (22.1%) | 53 (16.4%) |
| 55 to 64 Years | 266 (46.9%) | 156 (28.5%) |
| 65 to 74 Years | 13 (4.1%) | 31 (5.8%) |
| 75 Years and over | 12 (6.7%) | 73 (15.1%) |
| Total | 933 (25.9%) | 1,205 (30.7%) |
Income Above Poverty by Sex and Age in Pulaski
According to the poverty statistics in Pulaski, males aged 65 to 74 years and females aged 16 and 17 years are the age groups that are most secure financially, with 95.9% of males and 100.0% of females in these age groups living above the poverty line.
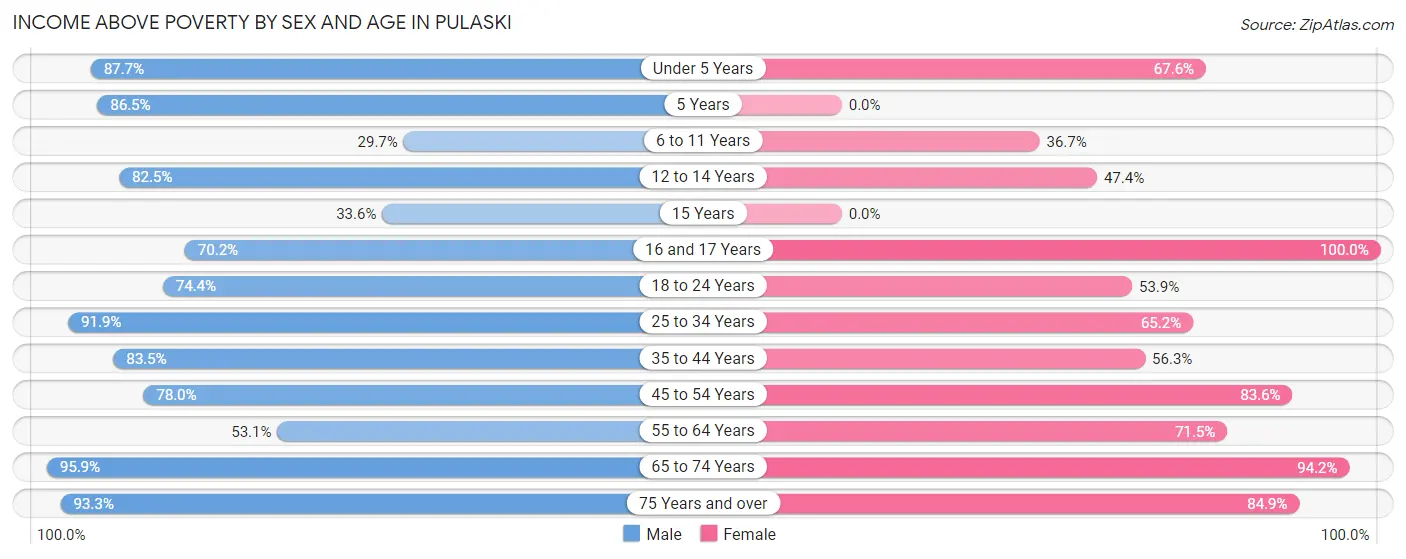
| Age Bracket | Male | Female |
| Under 5 Years | 150 (87.7%) | 198 (67.6%) |
| 5 Years | 64 (86.5%) | 0 (0.0%) |
| 6 to 11 Years | 67 (29.6%) | 134 (36.7%) |
| 12 to 14 Years | 155 (82.5%) | 45 (47.4%) |
| 15 Years | 39 (33.6%) | 0 (0.0%) |
| 16 and 17 Years | 59 (70.2%) | 11 (100.0%) |
| 18 to 24 Years | 342 (74.4%) | 132 (53.9%) |
| 25 to 34 Years | 307 (91.9%) | 395 (65.2%) |
| 35 to 44 Years | 360 (83.5%) | 232 (56.3%) |
| 45 to 54 Years | 357 (77.9%) | 271 (83.6%) |
| 55 to 64 Years | 301 (53.1%) | 392 (71.5%) |
| 65 to 74 Years | 301 (95.9%) | 504 (94.2%) |
| 75 Years and over | 168 (93.3%) | 411 (84.9%) |
| Total | 2,670 (74.1%) | 2,725 (69.3%) |
Income Below Poverty Among Married-Couple Families in Pulaski
The poverty statistics for married-couple families in Pulaski show that 21.0% or 247 of the total 1,176 families live below the poverty line. Families with 1 or 2 children have the highest poverty rate of 21.3%, comprising of 46 families. On the other hand, families with 3 or 4 children have the lowest poverty rate of 0.0%, which includes 0 families.

| Children | Above Poverty | Below Poverty |
| No Children | 748 (78.8%) | 201 (21.2%) |
| 1 or 2 Children | 170 (78.7%) | 46 (21.3%) |
| 3 or 4 Children | 11 (100.0%) | 0 (0.0%) |
| 5 or more Children | 0 (0.0%) | 0 (0.0%) |
| Total | 929 (79.0%) | 247 (21.0%) |
Income Below Poverty Among Single-Parent Households in Pulaski
According to the poverty data in Pulaski, 10.9% or 25 single-father households and 47.0% or 271 single-mother households are living below the poverty line. Among single-father households, those with 1 or 2 children have the highest poverty rate, with 25 households (16.1%) experiencing poverty. Likewise, among single-mother households, those with 1 or 2 children have the highest poverty rate, with 234 households (67.0%) falling below the poverty line.
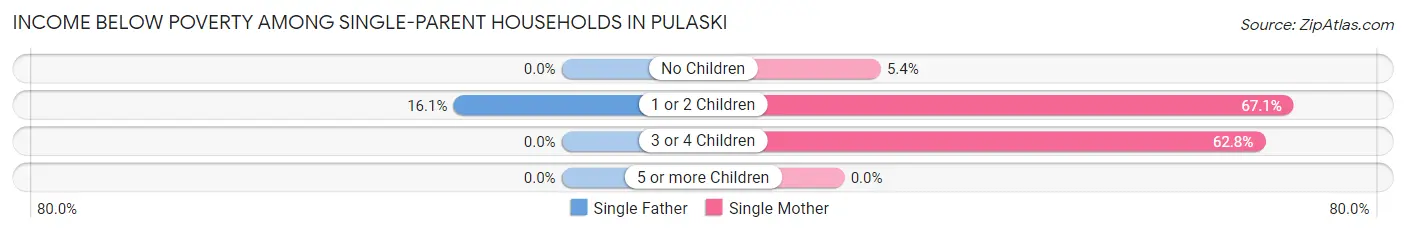
| Children | Single Father | Single Mother |
| No Children | 0 (0.0%) | 10 (5.4%) |
| 1 or 2 Children | 25 (16.1%) | 234 (67.0%) |
| 3 or 4 Children | 0 (0.0%) | 27 (62.8%) |
| 5 or more Children | 0 (0.0%) | 0 (0.0%) |
| Total | 25 (10.9%) | 271 (47.0%) |
Income Below Poverty Among Married-Couple vs Single-Parent Households in Pulaski
The poverty data for Pulaski shows that 247 of the married-couple family households (21.0%) and 296 of the single-parent households (36.7%) are living below the poverty level. Within the married-couple family households, those with 1 or 2 children have the highest poverty rate, with 46 households (21.3%) falling below the poverty line. Among the single-parent households, those with 3 or 4 children have the highest poverty rate, with 27 household (62.8%) living below poverty.
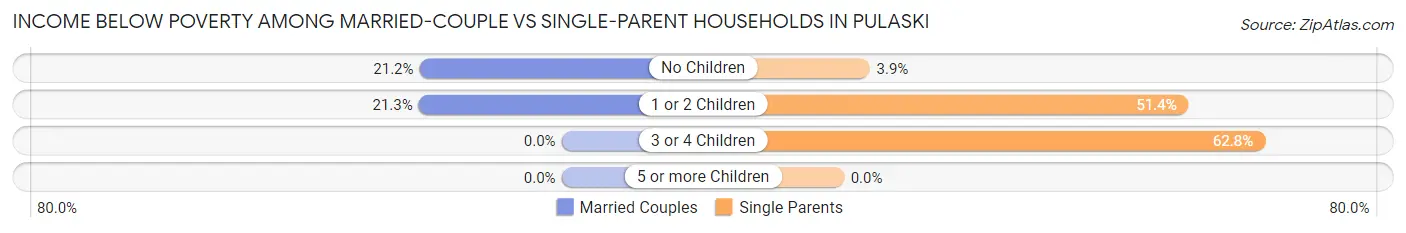
| Children | Married-Couple Families | Single-Parent Households |
| No Children | 201 (21.2%) | 10 (3.9%) |
| 1 or 2 Children | 46 (21.3%) | 259 (51.4%) |
| 3 or 4 Children | 0 (0.0%) | 27 (62.8%) |
| 5 or more Children | 0 (0.0%) | 0 (0.0%) |
| Total | 247 (21.0%) | 296 (36.7%) |
Race in Pulaski
The most populous races in Pulaski are White / Caucasian (5,640 | 67.9%), Black / African American (1,543 | 18.6%), and Two or more Races (819 | 9.9%).
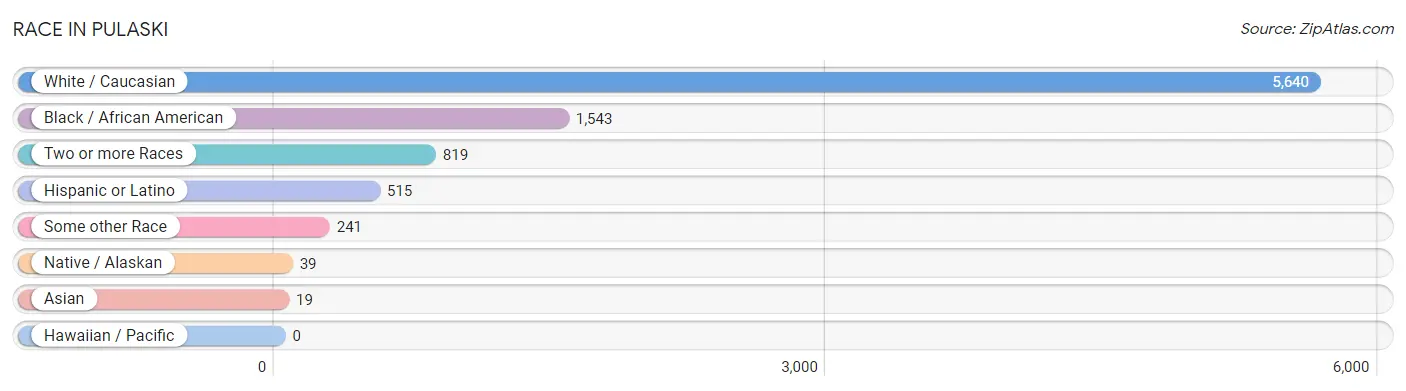
| Race | # Population | % Population |
| Asian | 19 | 0.2% |
| Black / African American | 1,543 | 18.6% |
| Hawaiian / Pacific | 0 | 0.0% |
| Hispanic or Latino | 515 | 6.2% |
| Native / Alaskan | 39 | 0.5% |
| White / Caucasian | 5,640 | 67.9% |
| Two or more Races | 819 | 9.9% |
| Some other Race | 241 | 2.9% |
| Total | 8,301 | 100.0% |
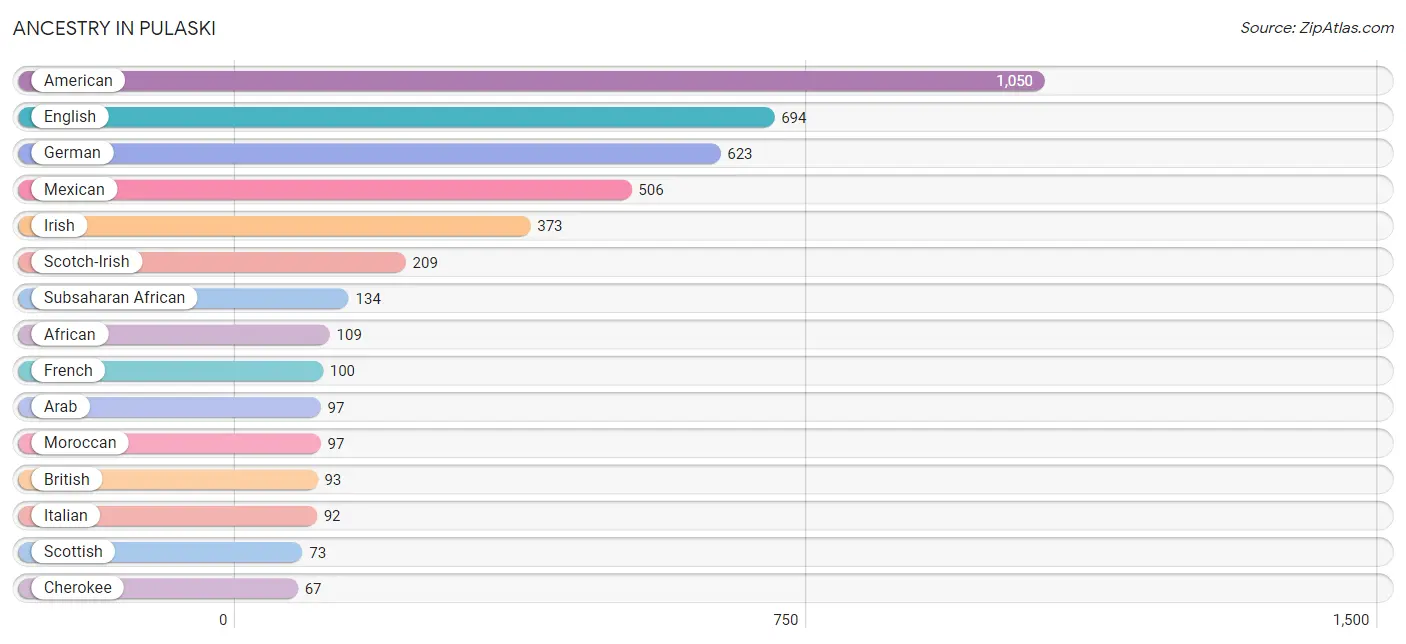
Ancestry in Pulaski
The most populous ancestries reported in Pulaski are American (1,050 | 12.7%), English (694 | 8.4%), German (623 | 7.5%), Mexican (506 | 6.1%), and Irish (373 | 4.5%), together accounting for 39.1% of all Pulaski residents.
| Ancestry | # Population | % Population |
| African | 109 | 1.3% |
| American | 1,050 | 12.7% |
| Arab | 97 | 1.2% |
| Australian | 2 | 0.0% |
| Bhutanese | 10 | 0.1% |
| British | 93 | 1.1% |
| Canadian | 11 | 0.1% |
| Cherokee | 67 | 0.8% |
| Dutch | 44 | 0.5% |
| Ecuadorian | 2 | 0.0% |
| English | 694 | 8.4% |
| European | 51 | 0.6% |
| French | 100 | 1.2% |
| German | 623 | 7.5% |
| Greek | 14 | 0.2% |
| Hungarian | 13 | 0.2% |
| Irish | 373 | 4.5% |
| Italian | 92 | 1.1% |
| Kenyan | 6 | 0.1% |
| Mexican | 506 | 6.1% |
| Mexican American Indian | 36 | 0.4% |
| Moroccan | 97 | 1.2% |
| Norwegian | 14 | 0.2% |
| Polish | 56 | 0.7% |
| Puerto Rican | 5 | 0.1% |
| Samoan | 9 | 0.1% |
| Scandinavian | 39 | 0.5% |
| Scotch-Irish | 209 | 2.5% |
| Scottish | 73 | 0.9% |
| South American | 2 | 0.0% |
| Subsaharan African | 134 | 1.6% |
| Swedish | 48 | 0.6% |
| Swiss | 10 | 0.1% |
| Thai | 9 | 0.1% |
| Welsh | 20 | 0.2% | View All 35 Rows |
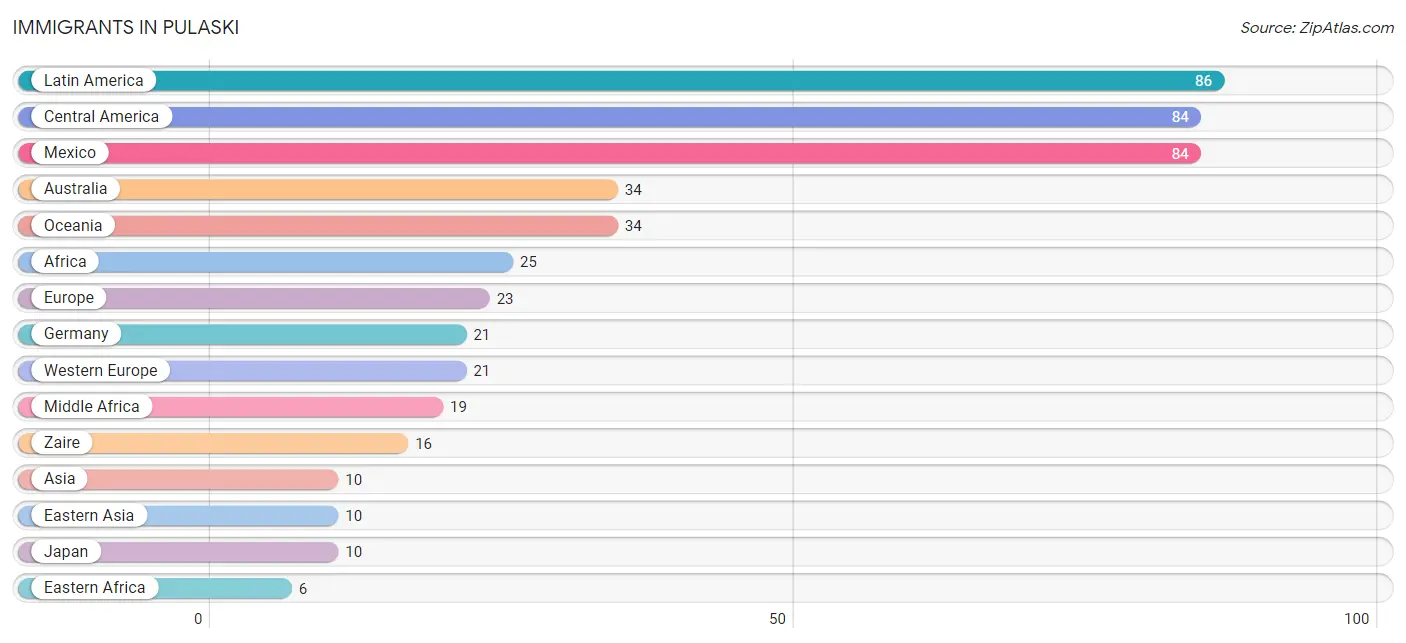
Immigrants in Pulaski
The most numerous immigrant groups reported in Pulaski came from Latin America (86 | 1.0%), Central America (84 | 1.0%), Mexico (84 | 1.0%), Australia (34 | 0.4%), and Oceania (34 | 0.4%), together accounting for 3.9% of all Pulaski residents.
| Immigration Origin | # Population | % Population |
| Africa | 25 | 0.3% |
| Asia | 10 | 0.1% |
| Australia | 34 | 0.4% |
| Cameroon | 3 | 0.0% |
| Central America | 84 | 1.0% |
| Eastern Africa | 6 | 0.1% |
| Eastern Asia | 10 | 0.1% |
| Ecuador | 2 | 0.0% |
| Europe | 23 | 0.3% |
| Germany | 21 | 0.3% |
| Japan | 10 | 0.1% |
| Kenya | 6 | 0.1% |
| Latin America | 86 | 1.0% |
| Mexico | 84 | 1.0% |
| Middle Africa | 19 | 0.2% |
| Northern Europe | 2 | 0.0% |
| Oceania | 34 | 0.4% |
| South America | 2 | 0.0% |
| Western Europe | 21 | 0.3% |
| Zaire | 16 | 0.2% | View All 20 Rows |
Sex and Age in Pulaski
Sex and Age in Pulaski
The most populous age groups in Pulaski are 15 to 19 Years (510 | 13.0%) for men and 30 to 34 Years (379 | 8.6%) for women.
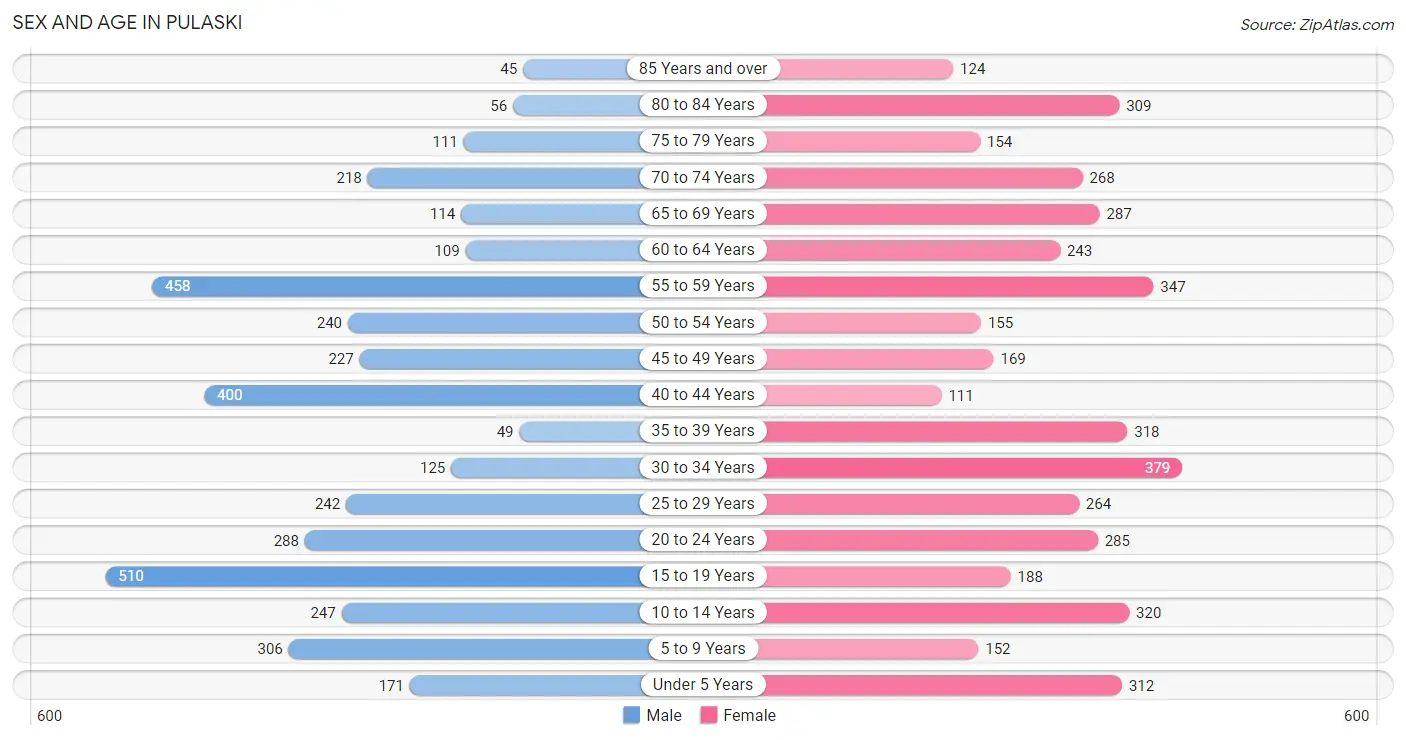
| Age Bracket | Male | Female |
| Under 5 Years | 171 (4.4%) | 312 (7.1%) |
| 5 to 9 Years | 306 (7.8%) | 152 (3.5%) |
| 10 to 14 Years | 247 (6.3%) | 320 (7.3%) |
| 15 to 19 Years | 510 (13.0%) | 188 (4.3%) |
| 20 to 24 Years | 288 (7.3%) | 285 (6.5%) |
| 25 to 29 Years | 242 (6.2%) | 264 (6.0%) |
| 30 to 34 Years | 125 (3.2%) | 379 (8.6%) |
| 35 to 39 Years | 49 (1.3%) | 318 (7.2%) |
| 40 to 44 Years | 400 (10.2%) | 111 (2.5%) |
| 45 to 49 Years | 227 (5.8%) | 169 (3.8%) |
| 50 to 54 Years | 240 (6.1%) | 155 (3.5%) |
| 55 to 59 Years | 458 (11.7%) | 347 (7.9%) |
| 60 to 64 Years | 109 (2.8%) | 243 (5.5%) |
| 65 to 69 Years | 114 (2.9%) | 287 (6.6%) |
| 70 to 74 Years | 218 (5.6%) | 268 (6.1%) |
| 75 to 79 Years | 111 (2.8%) | 154 (3.5%) |
| 80 to 84 Years | 56 (1.4%) | 309 (7.0%) |
| 85 Years and over | 45 (1.1%) | 124 (2.8%) |
| Total | 3,916 (100.0%) | 4,385 (100.0%) |
Families and Households in Pulaski
Median Family Size in Pulaski
The median family size in Pulaski is 2.91 persons per family, with single female/mother families (577 | 29.1%) accounting for the largest median family size of 3.66 persons per family. On the other hand, married-couple families (1,176 | 59.3%) represent the smallest median family size with 2.41 persons per family.
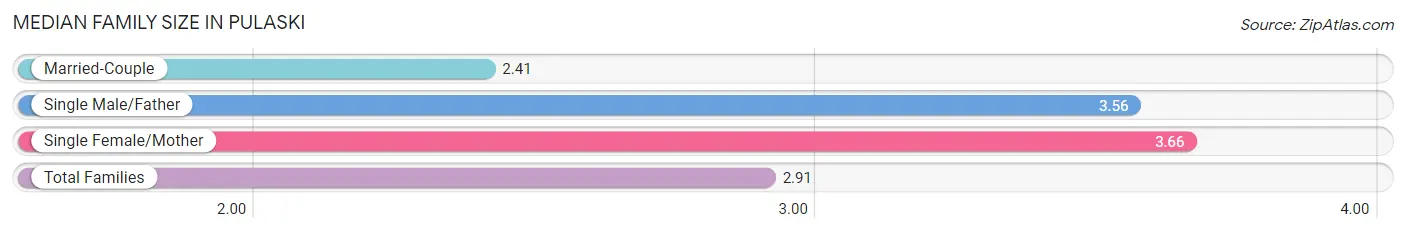
| Family Type | # Families | Family Size |
| Married-Couple | 1,176 (59.3%) | 2.41 |
| Single Male/Father | 229 (11.6%) | 3.56 |
| Single Female/Mother | 577 (29.1%) | 3.66 |
| Total Families | 1,982 (100.0%) | 2.91 |
Median Household Size in Pulaski
The median household size in Pulaski is 2.30 persons per household, with single male/father households (229 | 6.9%) accounting for the largest median household size of 4.57 persons per household. non-family households (1,334 | 40.2%) represent the smallest median household size with 1.20 persons per household.
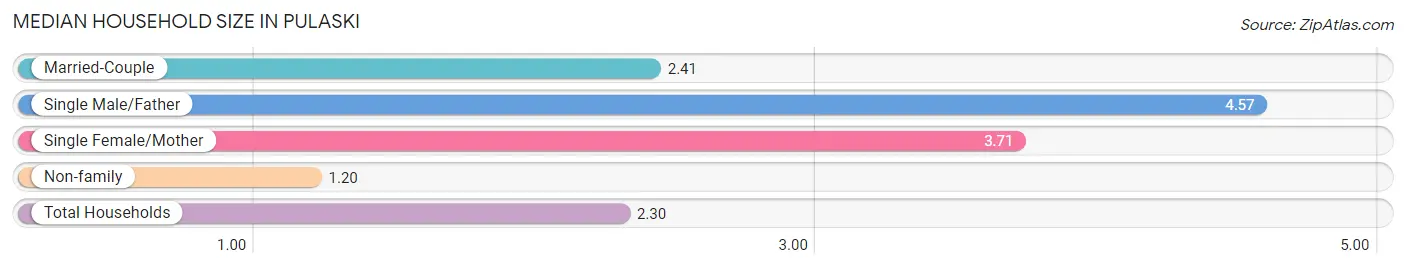
| Household Type | # Households | Household Size |
| Married-Couple | 1,176 (35.5%) | 2.41 |
| Single Male/Father | 229 (6.9%) | 4.57 |
| Single Female/Mother | 577 (17.4%) | 3.71 |
| Non-family | 1,334 (40.2%) | 1.20 |
| Total Households | 3,316 (100.0%) | 2.30 |
Household Size by Marriage Status in Pulaski
Out of a total of 3,316 households in Pulaski, 1,982 (59.8%) are family households, while 1,334 (40.2%) are nonfamily households. The most numerous type of family households are 2-person households, comprising 1,152, and the most common type of nonfamily households are 1-person households, comprising 1,168.
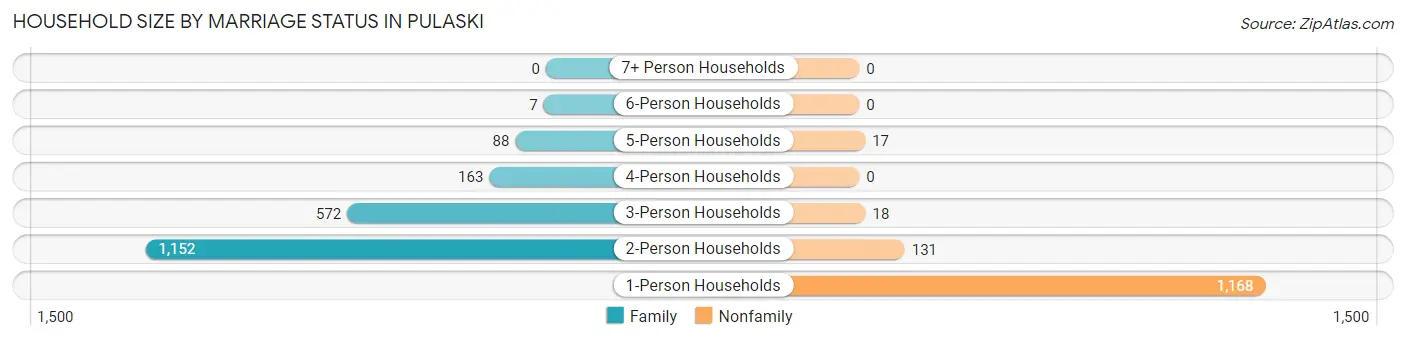
| Household Size | Family Households | Nonfamily Households |
| 1-Person Households | - | 1,168 (35.2%) |
| 2-Person Households | 1,152 (34.7%) | 131 (4.0%) |
| 3-Person Households | 572 (17.2%) | 18 (0.5%) |
| 4-Person Households | 163 (4.9%) | 0 (0.0%) |
| 5-Person Households | 88 (2.6%) | 17 (0.5%) |
| 6-Person Households | 7 (0.2%) | 0 (0.0%) |
| 7+ Person Households | 0 (0.0%) | 0 (0.0%) |
| Total | 1,982 (59.8%) | 1,334 (40.2%) |
Female Fertility in Pulaski
Fertility by Age in Pulaski
Average fertility rate in Pulaski is 45.0 births per 1,000 women. Women in the age bracket of 20 to 34 years have the highest fertility rate with 70.0 births per 1,000 women. Women in the age bracket of 20 to 34 years acount for 82.3% of all women with births.
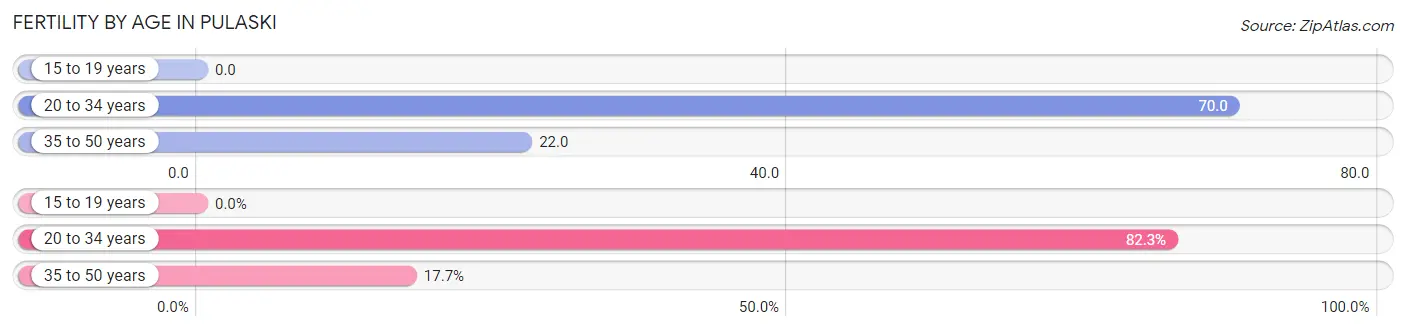
| Age Bracket | Women with Births | Births / 1,000 Women |
| 15 to 19 years | 0 (0.0%) | 0.0 |
| 20 to 34 years | 65 (82.3%) | 70.0 |
| 35 to 50 years | 14 (17.7%) | 22.0 |
| Total | 79 (100.0%) | 45.0 |
Fertility by Age by Marriage Status in Pulaski
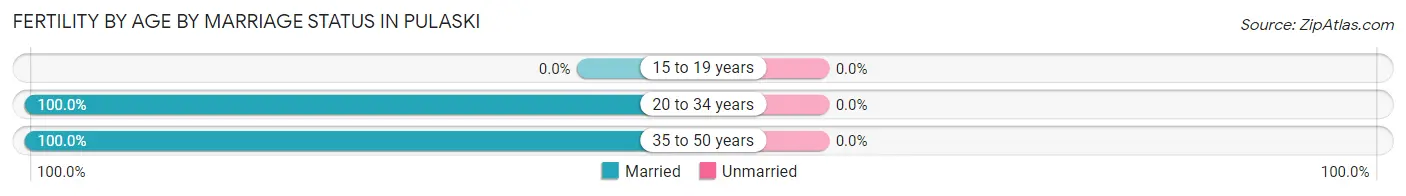
| Age Bracket | Married | Unmarried |
| 15 to 19 years | 0 (0.0%) | 0 (0.0%) |
| 20 to 34 years | 65 (100.0%) | 0 (0.0%) |
| 35 to 50 years | 14 (100.0%) | 0 (0.0%) |
| Total | 79 (100.0%) | 0 (0.0%) |
Fertility by Education in Pulaski
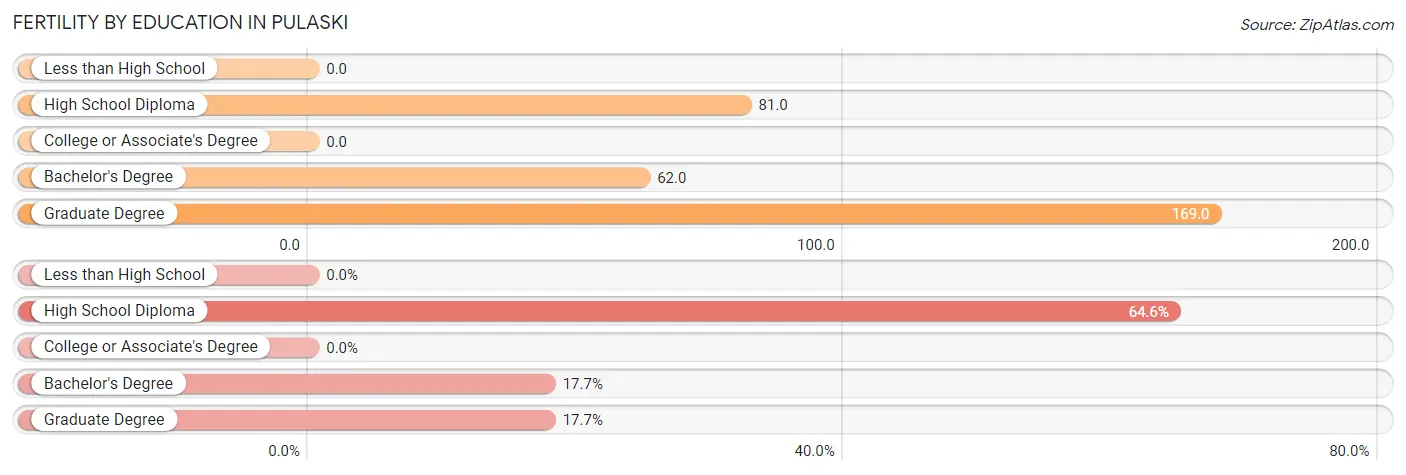
| Educational Attainment | Women with Births | Births / 1,000 Women |
| Less than High School | 0 (0.0%) | 0.0 |
| High School Diploma | 51 (64.6%) | 81.0 |
| College or Associate's Degree | 0 (0.0%) | 0.0 |
| Bachelor's Degree | 14 (17.7%) | 62.0 |
| Graduate Degree | 14 (17.7%) | 169.0 |
| Total | 79 (100.0%) | 45.0 |
Fertility by Education by Marriage Status in Pulaski
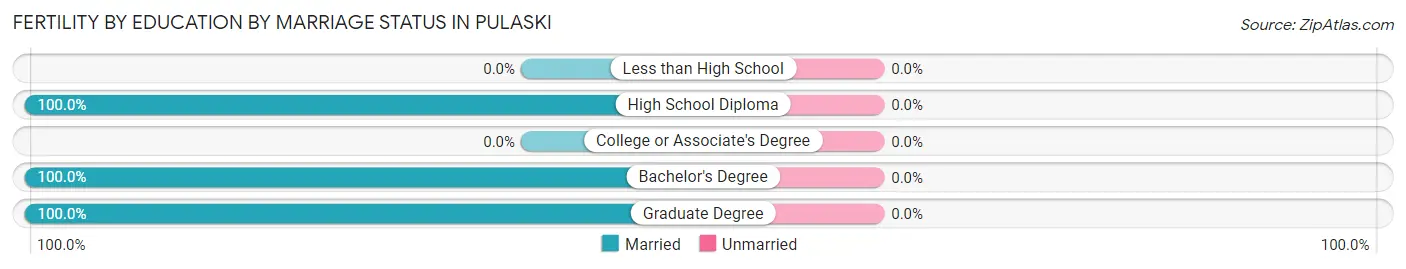
| Educational Attainment | Married | Unmarried |
| Less than High School | 0 (0.0%) | 0 (0.0%) |
| High School Diploma | 51 (100.0%) | 0 (0.0%) |
| College or Associate's Degree | 0 (0.0%) | 0 (0.0%) |
| Bachelor's Degree | 14 (100.0%) | 0 (0.0%) |
| Graduate Degree | 14 (100.0%) | 0 (0.0%) |
| Total | 79 (100.0%) | 0 (0.0%) |
Employment Characteristics in Pulaski
Employment by Class of Employer in Pulaski
Among the 3,001 employed individuals in Pulaski, private company employees (2,238 | 74.6%), local government employees (247 | 8.2%), and self-employed (not incorporated) (196 | 6.5%) make up the most common classes of employment.
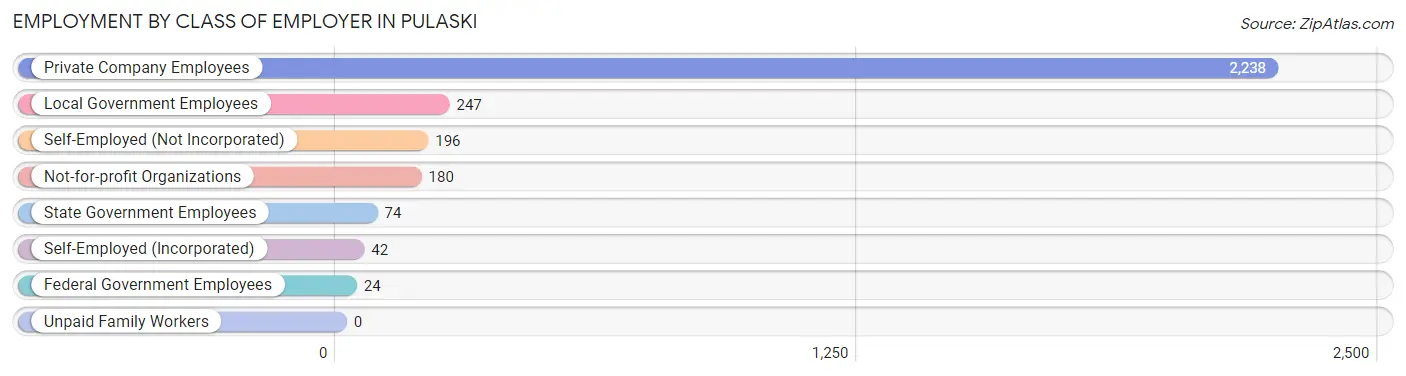
| Employer Class | # Employees | % Employees |
| Private Company Employees | 2,238 | 74.6% |
| Self-Employed (Incorporated) | 42 | 1.4% |
| Self-Employed (Not Incorporated) | 196 | 6.5% |
| Not-for-profit Organizations | 180 | 6.0% |
| Local Government Employees | 247 | 8.2% |
| State Government Employees | 74 | 2.5% |
| Federal Government Employees | 24 | 0.8% |
| Unpaid Family Workers | 0 | 0.0% |
| Total | 3,001 | 100.0% |
Employment Status by Age in Pulaski
According to the labor force statistics for Pulaski, out of the total population over 16 years of age (6,677), 48.8% or 3,258 individuals are in the labor force, with 7.4% or 241 of them unemployed. The age group with the highest labor force participation rate is 25 to 29 years, with 87.5% or 443 individuals in the labor force. Within the labor force, the 30 to 34 years age range has the highest percentage of unemployed individuals, with 23.5% or 88 of them being unemployed.
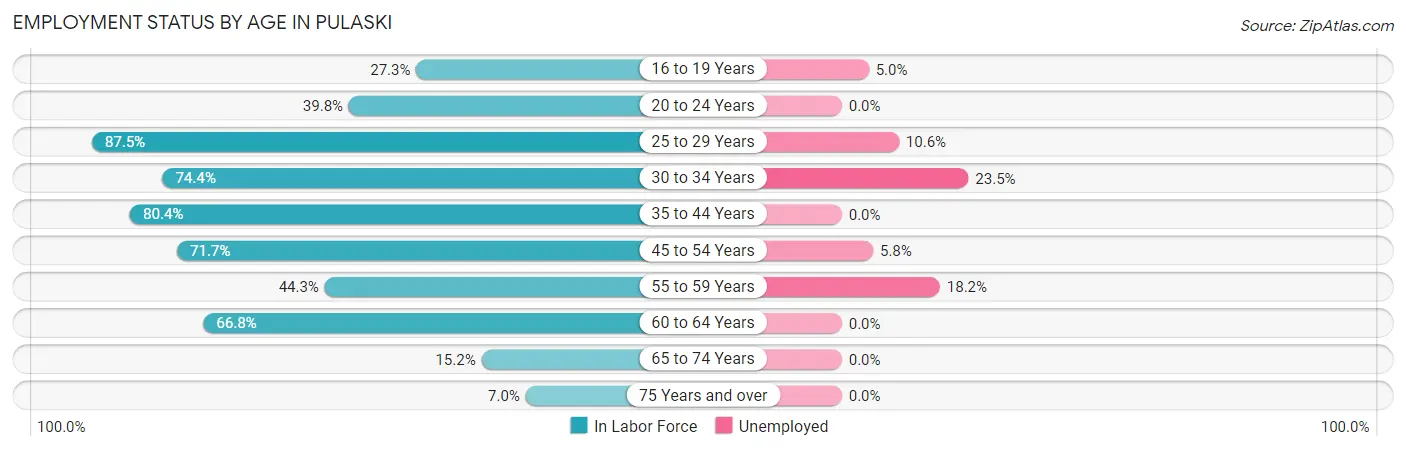
| Age Bracket | In Labor Force | Unemployed |
| 16 to 19 Years | 159 (27.3%) | 8 (5.0%) |
| 20 to 24 Years | 228 (39.8%) | 0 (0.0%) |
| 25 to 29 Years | 443 (87.5%) | 47 (10.6%) |
| 30 to 34 Years | 375 (74.4%) | 88 (23.5%) |
| 35 to 44 Years | 706 (80.4%) | 0 (0.0%) |
| 45 to 54 Years | 567 (71.7%) | 33 (5.8%) |
| 55 to 59 Years | 357 (44.3%) | 65 (18.2%) |
| 60 to 64 Years | 235 (66.8%) | 0 (0.0%) |
| 65 to 74 Years | 135 (15.2%) | 0 (0.0%) |
| 75 Years and over | 56 (7.0%) | 0 (0.0%) |
| Total | 3,258 (48.8%) | 241 (7.4%) |
Employment Status by Educational Attainment in Pulaski
According to labor force statistics for Pulaski, 69.9% of individuals (2,681) out of the total population between 25 and 64 years of age (3,836) are in the labor force, with 8.7% or 233 of them being unemployed. The group with the highest labor force participation rate are those with the educational attainment of bachelor's degree or higher, with 90.8% or 748 individuals in the labor force. Within the labor force, individuals with bachelor's degree or higher education have the highest percentage of unemployment, with 11.8% or 88 of them being unemployed.
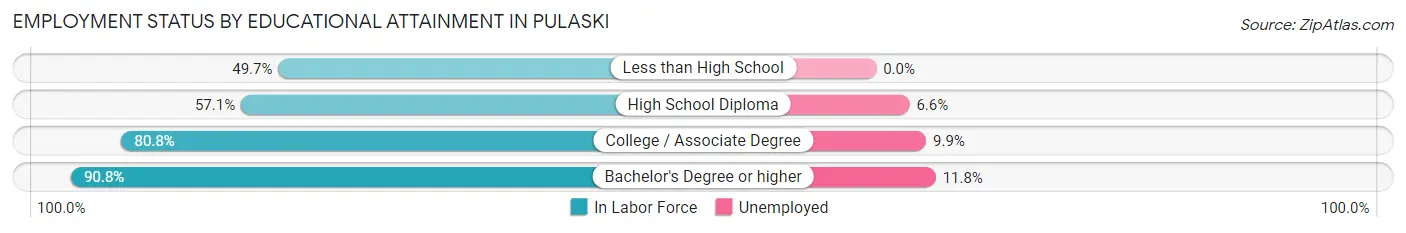
| Educational Attainment | In Labor Force | Unemployed |
| Less than High School | 142 (49.7%) | 0 (0.0%) |
| High School Diploma | 988 (57.1%) | 114 (6.6%) |
| College / Associate Degree | 805 (80.8%) | 99 (9.9%) |
| Bachelor's Degree or higher | 748 (90.8%) | 97 (11.8%) |
| Total | 2,681 (69.9%) | 334 (8.7%) |
Employment Occupations by Sex in Pulaski
Management, Business, Science and Arts Occupations
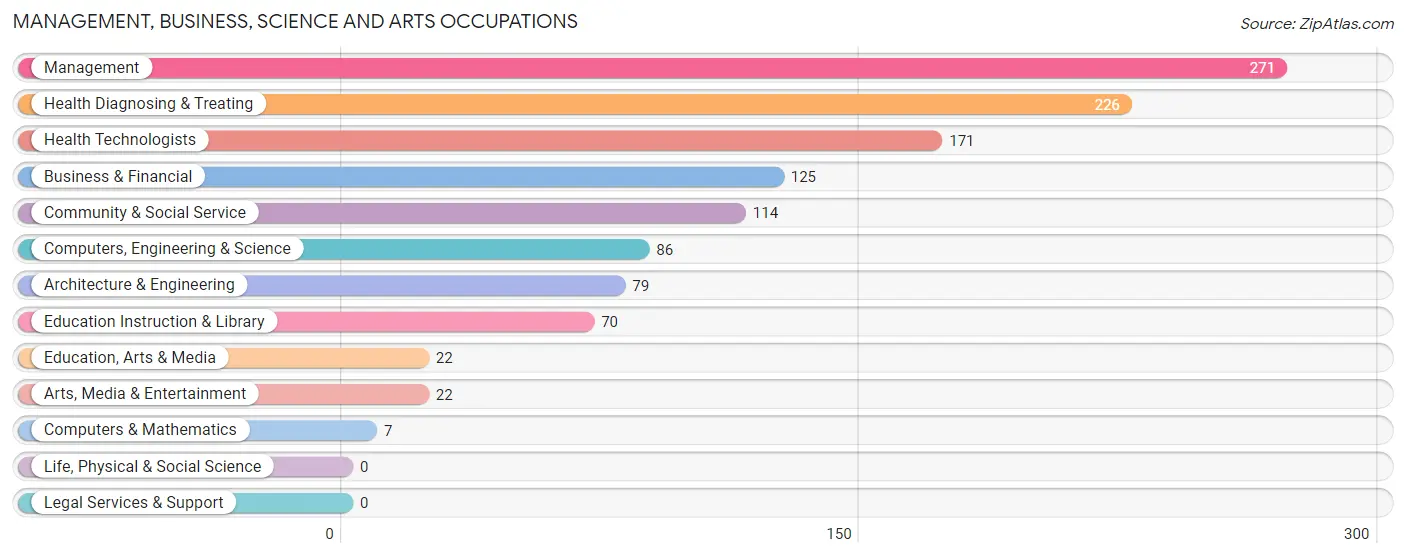
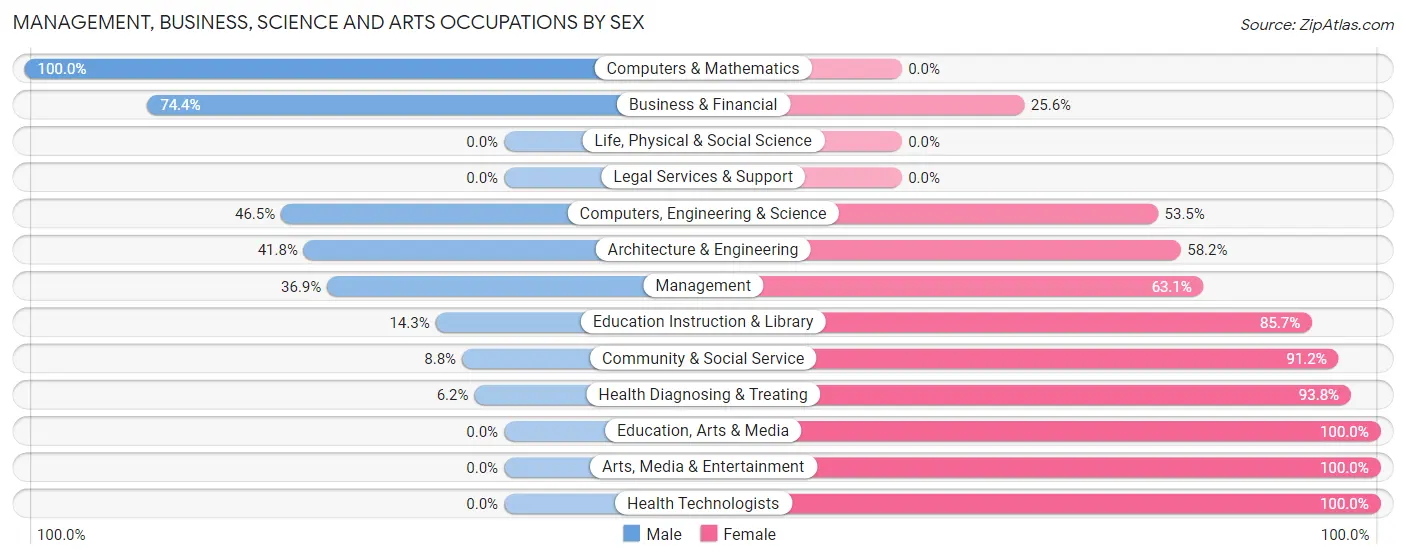
The most common Management, Business, Science and Arts occupations in Pulaski are Management (271 | 9.0%), Health Diagnosing & Treating (226 | 7.5%), Health Technologists (171 | 5.7%), Business & Financial (125 | 4.1%), and Community & Social Service (114 | 3.8%).
Management, Business, Science and Arts Occupations by Sex
Within the Management, Business, Science and Arts occupations in Pulaski, the most male-oriented occupations are Computers & Mathematics (100.0%), Business & Financial (74.4%), and Computers, Engineering & Science (46.5%), while the most female-oriented occupations are Education, Arts & Media (100.0%), Arts, Media & Entertainment (100.0%), and Health Technologists (100.0%).
| Occupation | Male | Female |
| Management | 100 (36.9%) | 171 (63.1%) |
| Business & Financial | 93 (74.4%) | 32 (25.6%) |
| Computers, Engineering & Science | 40 (46.5%) | 46 (53.5%) |
| Computers & Mathematics | 7 (100.0%) | 0 (0.0%) |
| Architecture & Engineering | 33 (41.8%) | 46 (58.2%) |
| Life, Physical & Social Science | 0 (0.0%) | 0 (0.0%) |
| Community & Social Service | 10 (8.8%) | 104 (91.2%) |
| Education, Arts & Media | 0 (0.0%) | 22 (100.0%) |
| Legal Services & Support | 0 (0.0%) | 0 (0.0%) |
| Education Instruction & Library | 10 (14.3%) | 60 (85.7%) |
| Arts, Media & Entertainment | 0 (0.0%) | 22 (100.0%) |
| Health Diagnosing & Treating | 14 (6.2%) | 212 (93.8%) |
| Health Technologists | 0 (0.0%) | 171 (100.0%) |
| Total (Category) | 257 (31.3%) | 565 (68.7%) |
| Total (Overall) | 1,435 (47.5%) | 1,585 (52.5%) |
Services Occupations
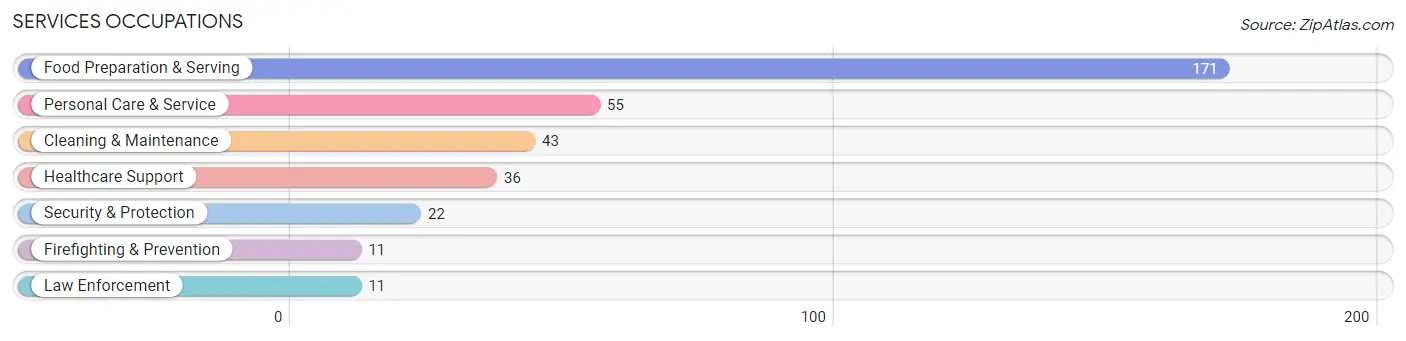
The most common Services occupations in Pulaski are Food Preparation & Serving (171 | 5.7%), Personal Care & Service (55 | 1.8%), Cleaning & Maintenance (43 | 1.4%), Healthcare Support (36 | 1.2%), and Security & Protection (22 | 0.7%).
Services Occupations by Sex
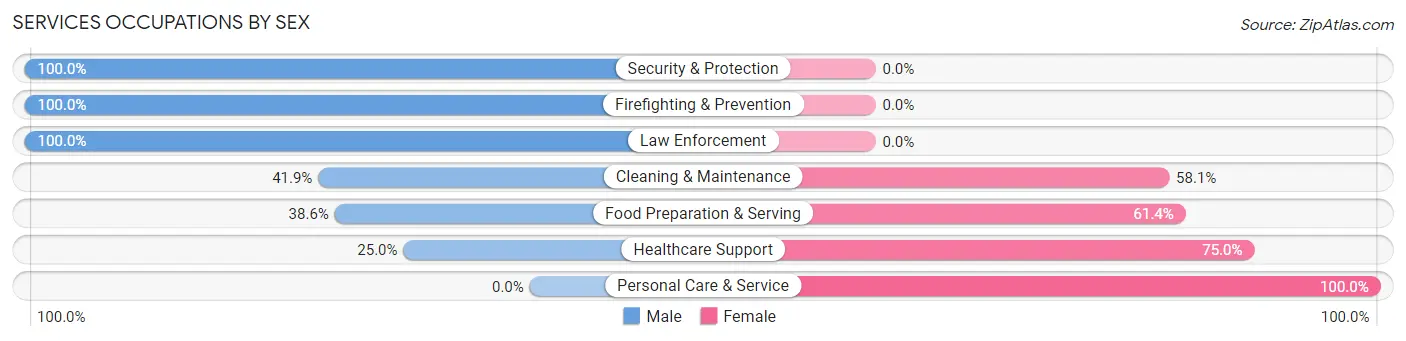
Within the Services occupations in Pulaski, the most male-oriented occupations are Security & Protection (100.0%), Firefighting & Prevention (100.0%), and Law Enforcement (100.0%), while the most female-oriented occupations are Personal Care & Service (100.0%), Healthcare Support (75.0%), and Food Preparation & Serving (61.4%).
| Occupation | Male | Female |
| Healthcare Support | 9 (25.0%) | 27 (75.0%) |
| Security & Protection | 22 (100.0%) | 0 (0.0%) |
| Firefighting & Prevention | 11 (100.0%) | 0 (0.0%) |
| Law Enforcement | 11 (100.0%) | 0 (0.0%) |
| Food Preparation & Serving | 66 (38.6%) | 105 (61.4%) |
| Cleaning & Maintenance | 18 (41.9%) | 25 (58.1%) |
| Personal Care & Service | 0 (0.0%) | 55 (100.0%) |
| Total (Category) | 115 (35.2%) | 212 (64.8%) |
| Total (Overall) | 1,435 (47.5%) | 1,585 (52.5%) |
Sales and Office Occupations
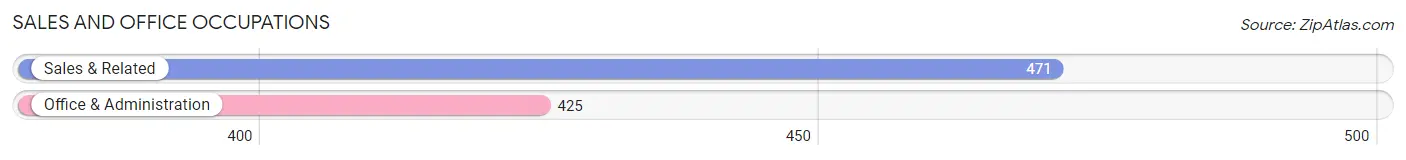
The most common Sales and Office occupations in Pulaski are Sales & Related (471 | 15.6%), and Office & Administration (425 | 14.1%).
Sales and Office Occupations by Sex
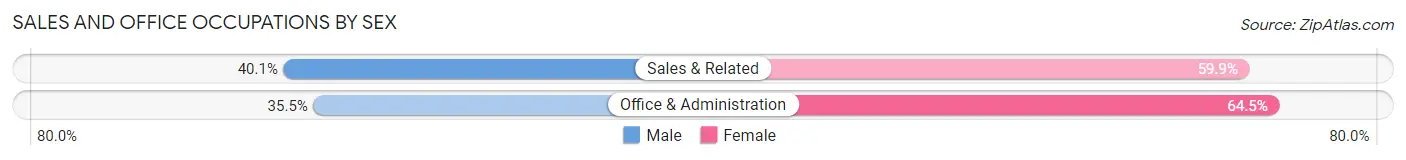
| Occupation | Male | Female |
| Sales & Related | 189 (40.1%) | 282 (59.9%) |
| Office & Administration | 151 (35.5%) | 274 (64.5%) |
| Total (Category) | 340 (38.0%) | 556 (62.1%) |
| Total (Overall) | 1,435 (47.5%) | 1,585 (52.5%) |
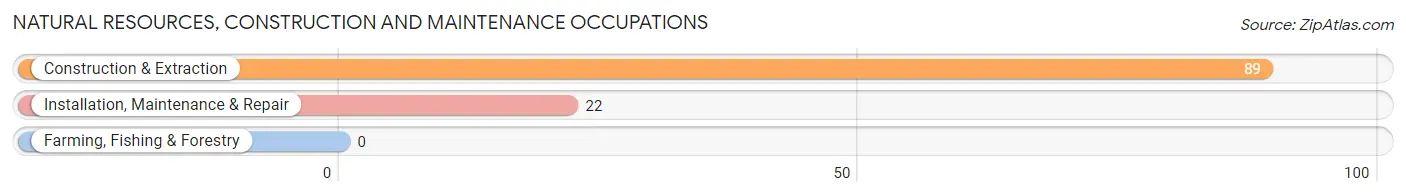
Natural Resources, Construction and Maintenance Occupations
The most common Natural Resources, Construction and Maintenance occupations in Pulaski are Construction & Extraction (89 | 2.9%), and Installation, Maintenance & Repair (22 | 0.7%).
Natural Resources, Construction and Maintenance Occupations by Sex
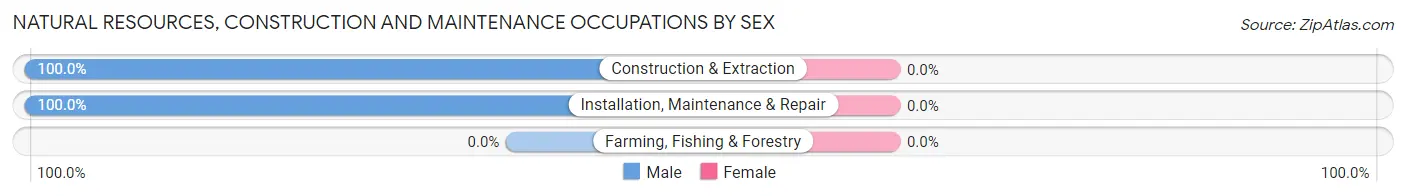
| Occupation | Male | Female |
| Farming, Fishing & Forestry | 0 (0.0%) | 0 (0.0%) |
| Construction & Extraction | 89 (100.0%) | 0 (0.0%) |
| Installation, Maintenance & Repair | 22 (100.0%) | 0 (0.0%) |
| Total (Category) | 111 (100.0%) | 0 (0.0%) |
| Total (Overall) | 1,435 (47.5%) | 1,585 (52.5%) |
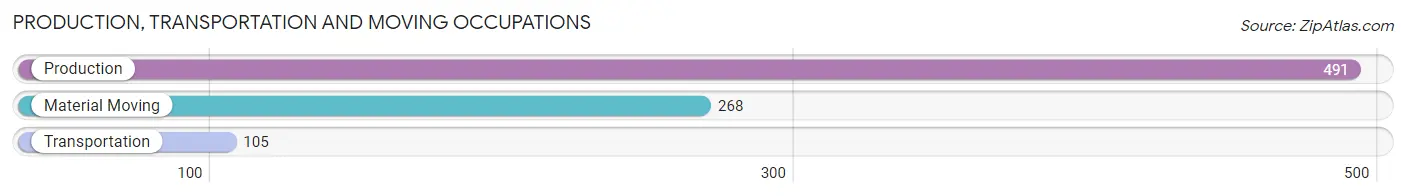
Production, Transportation and Moving Occupations
The most common Production, Transportation and Moving occupations in Pulaski are Production (491 | 16.3%), Material Moving (268 | 8.9%), and Transportation (105 | 3.5%).
Production, Transportation and Moving Occupations by Sex
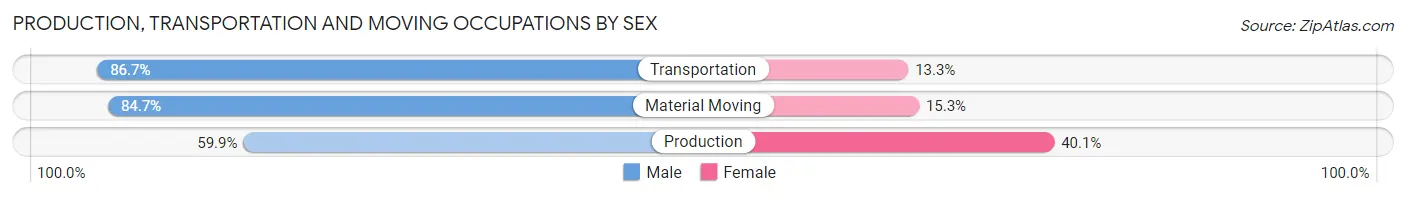
| Occupation | Male | Female |
| Production | 294 (59.9%) | 197 (40.1%) |
| Transportation | 91 (86.7%) | 14 (13.3%) |
| Material Moving | 227 (84.7%) | 41 (15.3%) |
| Total (Category) | 612 (70.8%) | 252 (29.2%) |
| Total (Overall) | 1,435 (47.5%) | 1,585 (52.5%) |
Employment Industries by Sex in Pulaski
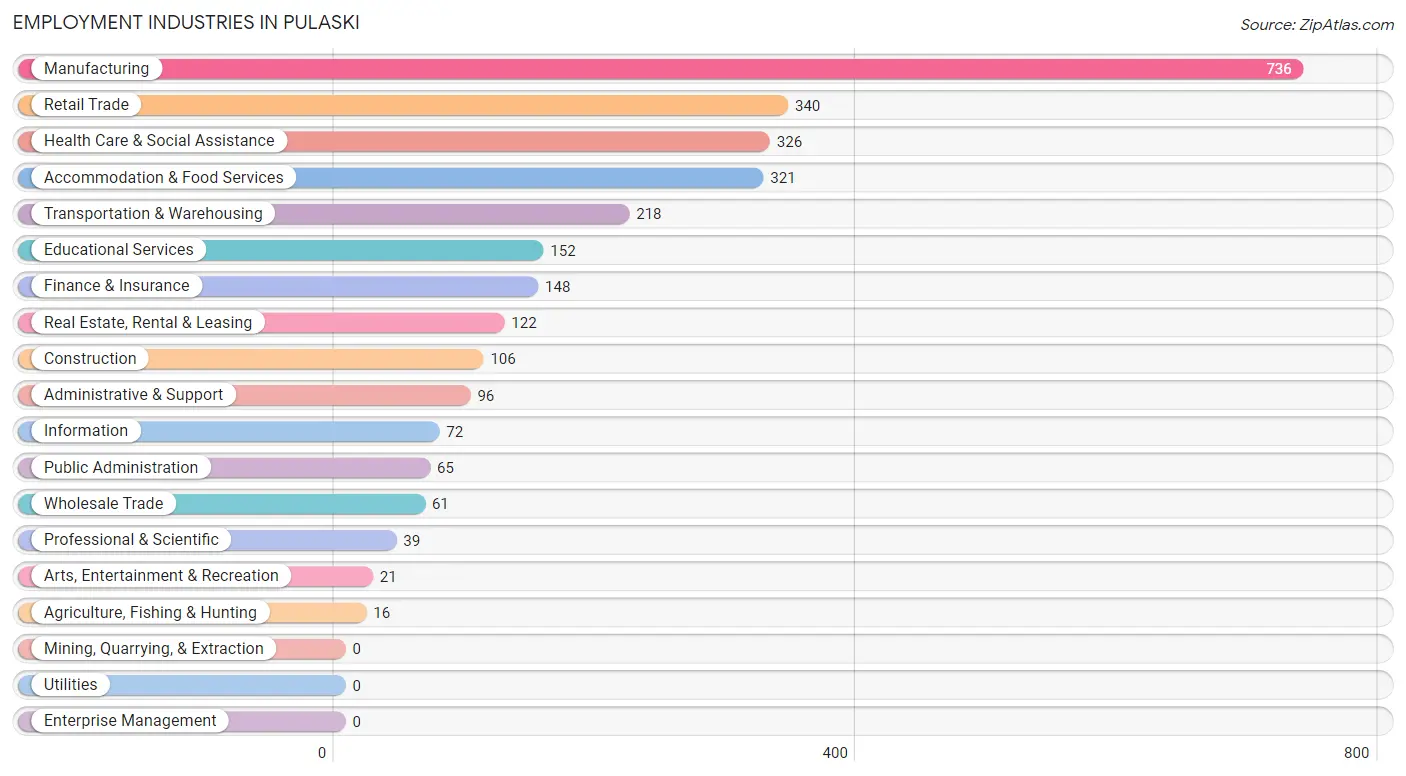
Employment Industries in Pulaski
The major employment industries in Pulaski include Manufacturing (736 | 24.4%), Retail Trade (340 | 11.3%), Health Care & Social Assistance (326 | 10.8%), Accommodation & Food Services (321 | 10.6%), and Transportation & Warehousing (218 | 7.2%).
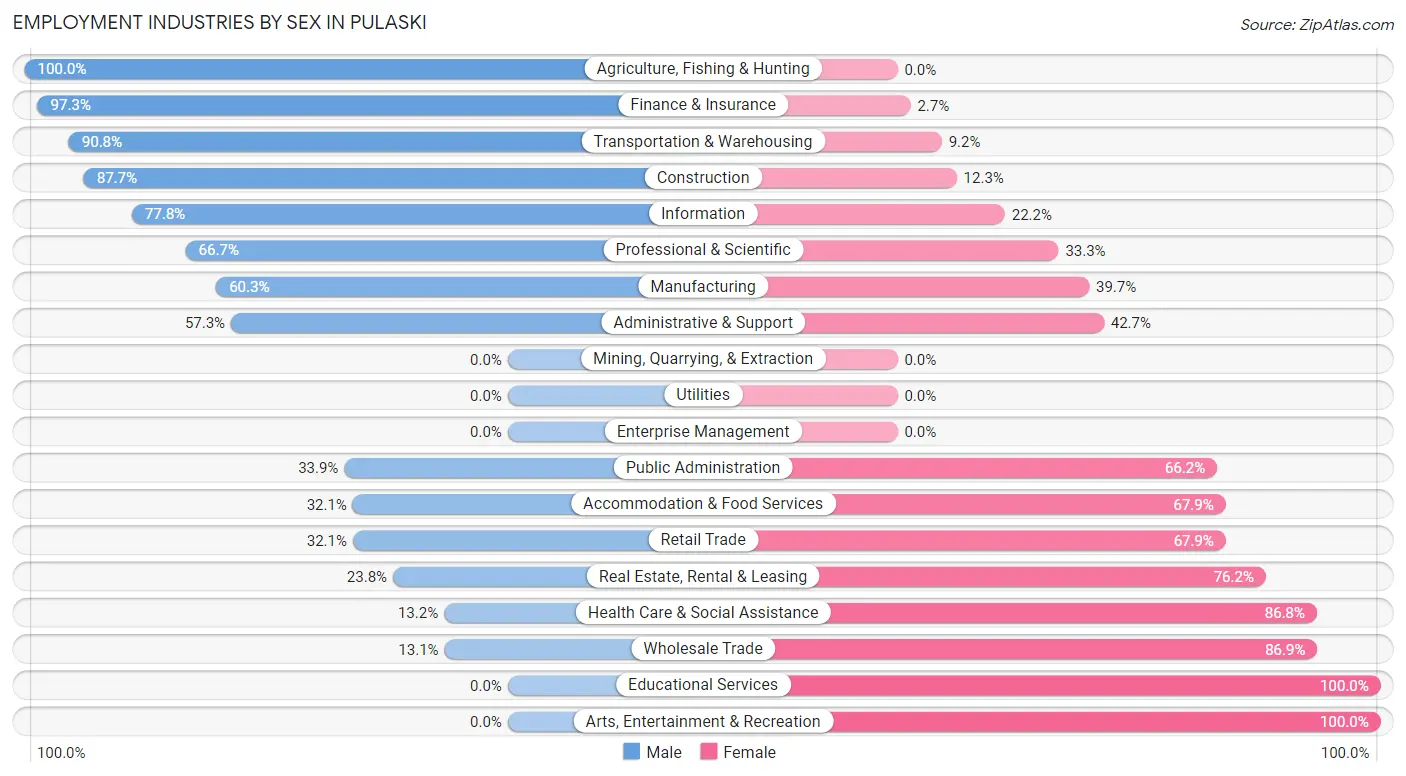
Employment Industries by Sex in Pulaski
The Pulaski industries that see more men than women are Agriculture, Fishing & Hunting (100.0%), Finance & Insurance (97.3%), and Transportation & Warehousing (90.8%), whereas the industries that tend to have a higher number of women are Educational Services (100.0%), Arts, Entertainment & Recreation (100.0%), and Wholesale Trade (86.9%).
| Industry | Male | Female |
| Agriculture, Fishing & Hunting | 16 (100.0%) | 0 (0.0%) |
| Mining, Quarrying, & Extraction | 0 (0.0%) | 0 (0.0%) |
| Construction | 93 (87.7%) | 13 (12.3%) |
| Manufacturing | 444 (60.3%) | 292 (39.7%) |
| Wholesale Trade | 8 (13.1%) | 53 (86.9%) |
| Retail Trade | 109 (32.1%) | 231 (67.9%) |
| Transportation & Warehousing | 198 (90.8%) | 20 (9.2%) |
| Utilities | 0 (0.0%) | 0 (0.0%) |
| Information | 56 (77.8%) | 16 (22.2%) |
| Finance & Insurance | 144 (97.3%) | 4 (2.7%) |
| Real Estate, Rental & Leasing | 29 (23.8%) | 93 (76.2%) |
| Professional & Scientific | 26 (66.7%) | 13 (33.3%) |
| Enterprise Management | 0 (0.0%) | 0 (0.0%) |
| Administrative & Support | 55 (57.3%) | 41 (42.7%) |
| Educational Services | 0 (0.0%) | 152 (100.0%) |
| Health Care & Social Assistance | 43 (13.2%) | 283 (86.8%) |
| Arts, Entertainment & Recreation | 0 (0.0%) | 21 (100.0%) |
| Accommodation & Food Services | 103 (32.1%) | 218 (67.9%) |
| Public Administration | 22 (33.9%) | 43 (66.1%) |
| Total | 1,435 (47.5%) | 1,585 (52.5%) |
Education in Pulaski
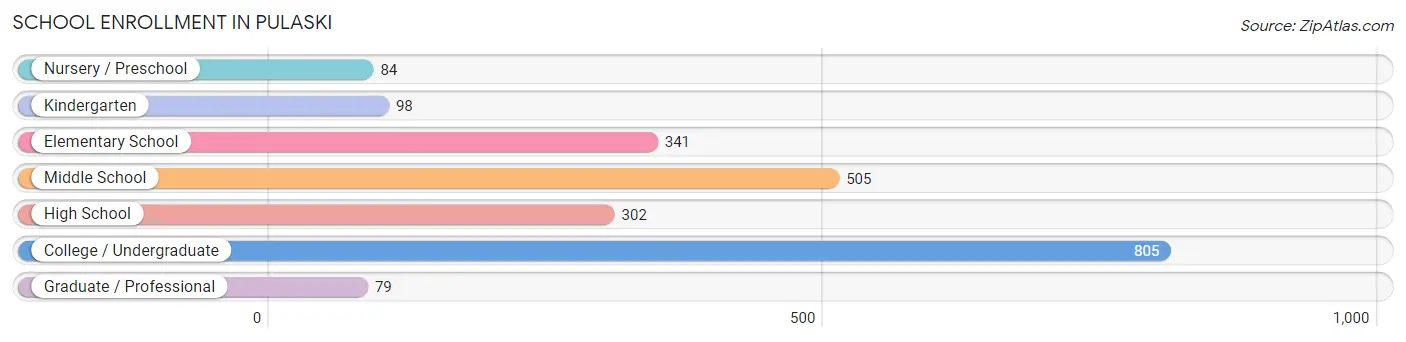
School Enrollment in Pulaski
The most common levels of schooling among the 2,214 students in Pulaski are college / undergraduate (805 | 36.4%), middle school (505 | 22.8%), and elementary school (341 | 15.4%).
| School Level | # Students | % Students |
| Nursery / Preschool | 84 | 3.8% |
| Kindergarten | 98 | 4.4% |
| Elementary School | 341 | 15.4% |
| Middle School | 505 | 22.8% |
| High School | 302 | 13.6% |
| College / Undergraduate | 805 | 36.4% |
| Graduate / Professional | 79 | 3.6% |
| Total | 2,214 | 100.0% |
School Enrollment by Age by Funding Source in Pulaski
Out of a total of 2,214 students who are enrolled in schools in Pulaski, 379 (17.1%) attend a private institution, while the remaining 1,835 (82.9%) are enrolled in public schools. The age group of 20 to 24 year olds has the highest likelihood of being enrolled in private schools, with 172 (50.0% in the age bracket) enrolled. Conversely, the age group of 3 to 4 year olds has the lowest likelihood of being enrolled in a private school, with 51 (100.0% in the age bracket) attending a public institution.
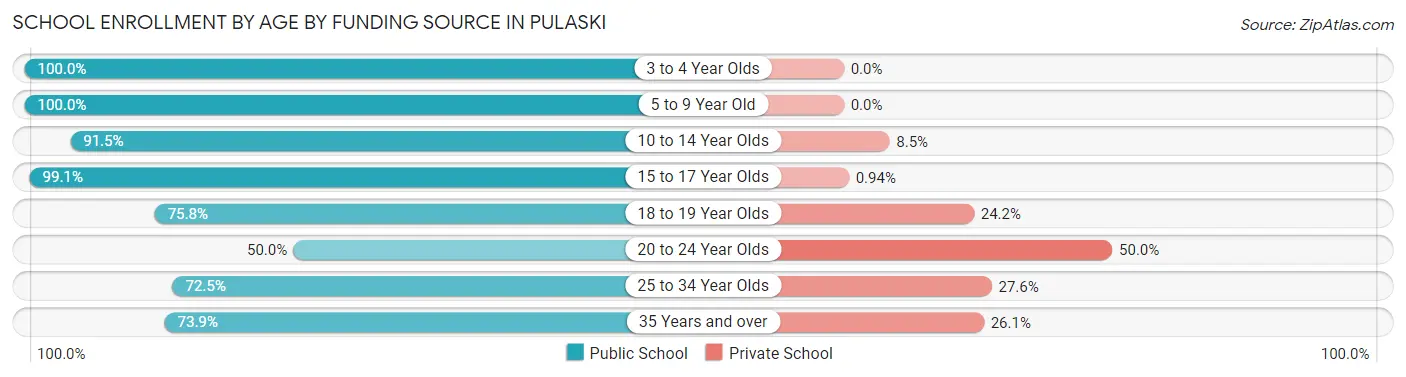
| Age Bracket | Public School | Private School |
| 3 to 4 Year Olds | 51 (100.0%) | 0 (0.0%) |
| 5 to 9 Year Old | 425 (100.0%) | 0 (0.0%) |
| 10 to 14 Year Olds | 505 (91.5%) | 47 (8.5%) |
| 15 to 17 Year Olds | 211 (99.1%) | 2 (0.9%) |
| 18 to 19 Year Olds | 350 (75.8%) | 112 (24.2%) |
| 20 to 24 Year Olds | 172 (50.0%) | 172 (50.0%) |
| 25 to 34 Year Olds | 71 (72.5%) | 27 (27.6%) |
| 35 Years and over | 51 (73.9%) | 18 (26.1%) |
| Total | 1,835 (82.9%) | 379 (17.1%) |
Educational Attainment by Field of Study in Pulaski
Business (273 | 22.3%), arts & humanities (194 | 15.9%), education (148 | 12.1%), science & technology (139 | 11.4%), and engineering (114 | 9.3%) are the most common fields of study among 1,222 individuals in Pulaski who have obtained a bachelor's degree or higher.
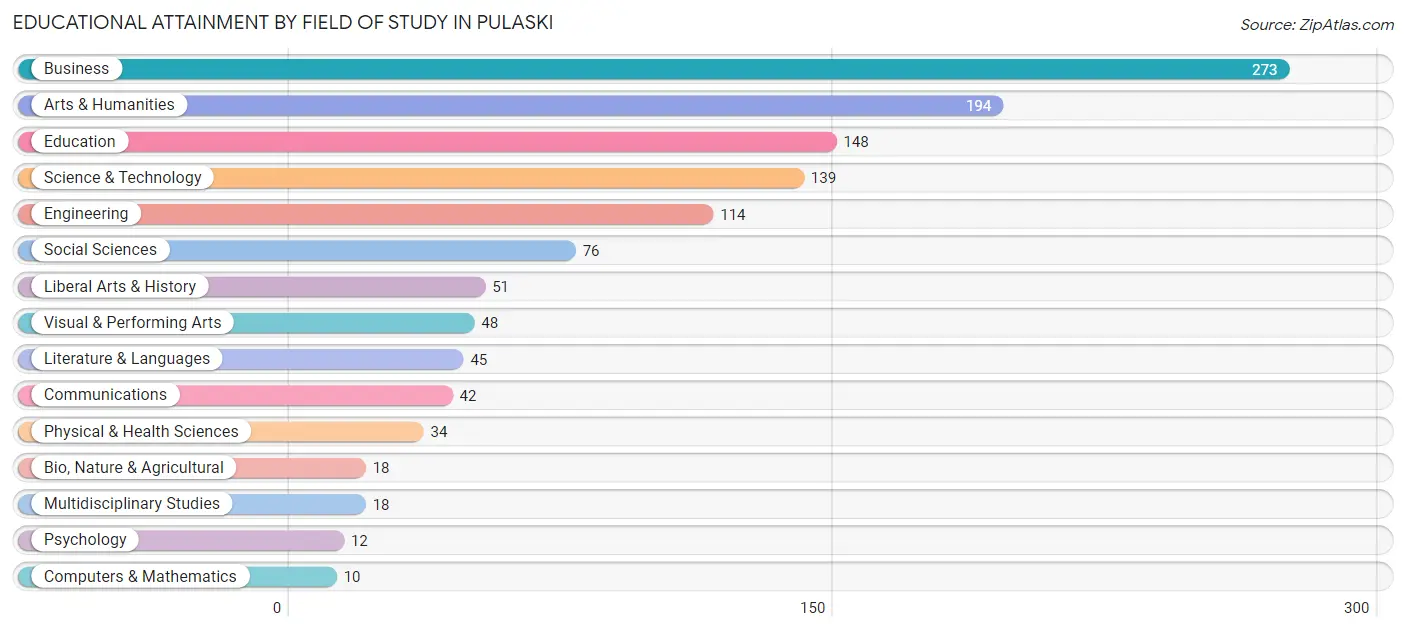
| Field of Study | # Graduates | % Graduates |
| Computers & Mathematics | 10 | 0.8% |
| Bio, Nature & Agricultural | 18 | 1.5% |
| Physical & Health Sciences | 34 | 2.8% |
| Psychology | 12 | 1.0% |
| Social Sciences | 76 | 6.2% |
| Engineering | 114 | 9.3% |
| Multidisciplinary Studies | 18 | 1.5% |
| Science & Technology | 139 | 11.4% |
| Business | 273 | 22.3% |
| Education | 148 | 12.1% |
| Literature & Languages | 45 | 3.7% |
| Liberal Arts & History | 51 | 4.2% |
| Visual & Performing Arts | 48 | 3.9% |
| Communications | 42 | 3.4% |
| Arts & Humanities | 194 | 15.9% |
| Total | 1,222 | 100.0% |
Transportation & Commute in Pulaski
Vehicle Availability by Sex in Pulaski
The most prevalent vehicle ownership categories in Pulaski are males with 2 vehicles (529, accounting for 38.1%) and females with 2 vehicles (609, making up 34.5%).
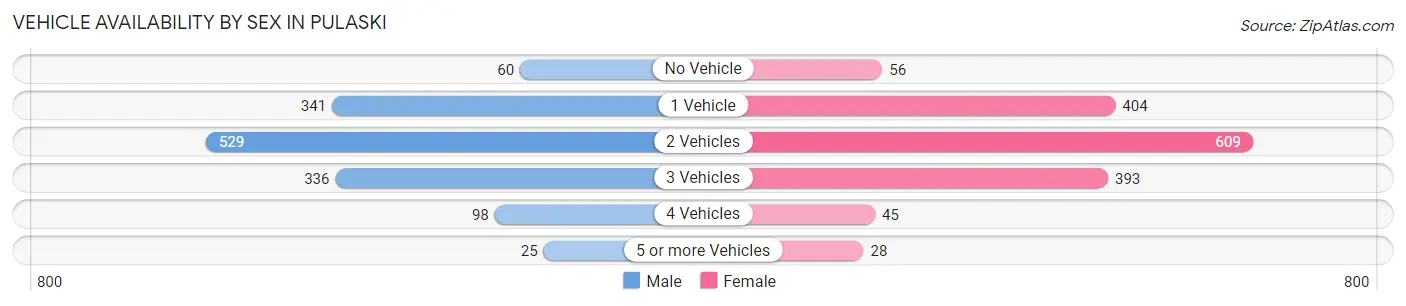
| Vehicles Available | Male | Female |
| No Vehicle | 60 (4.3%) | 56 (3.6%) |
| 1 Vehicle | 341 (24.5%) | 404 (26.3%) |
| 2 Vehicles | 529 (38.1%) | 609 (39.7%) |
| 3 Vehicles | 336 (24.2%) | 393 (25.6%) |
| 4 Vehicles | 98 (7.1%) | 45 (2.9%) |
| 5 or more Vehicles | 25 (1.8%) | 28 (1.8%) |
| Total | 1,389 (100.0%) | 1,535 (100.0%) |
Commute Time in Pulaski
The most frequently occuring commute durations in Pulaski are 5 to 9 minutes (718 commuters, 24.9%), 10 to 14 minutes (620 commuters, 21.5%), and 60 to 89 minutes (376 commuters, 13.0%).
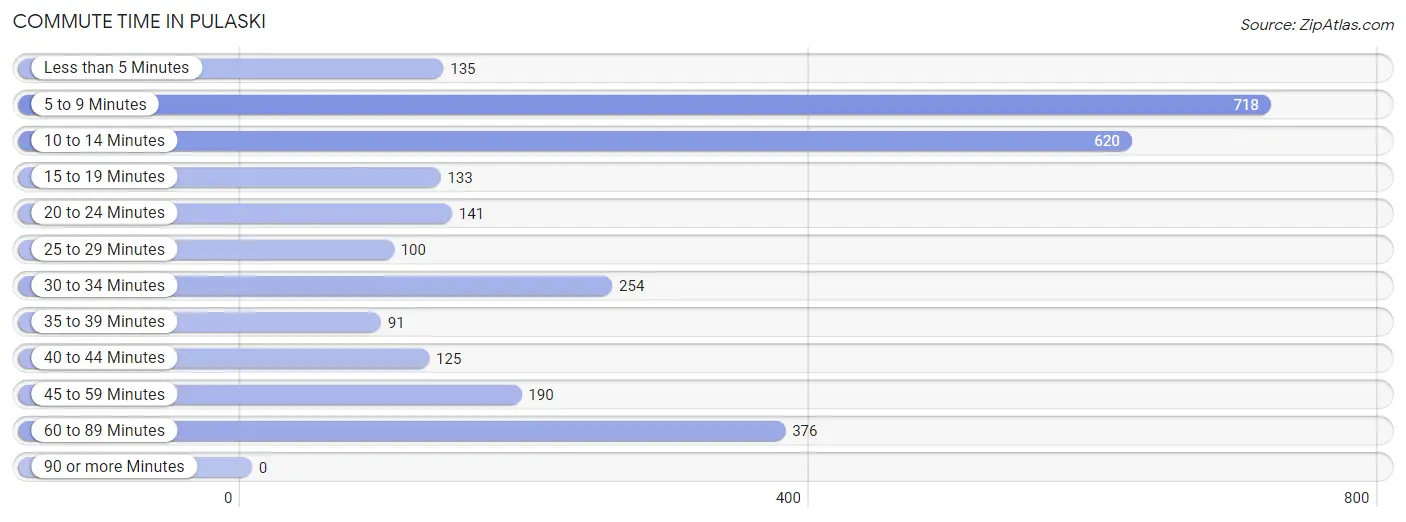
| Commute Time | # Commuters | % Commuters |
| Less than 5 Minutes | 135 | 4.7% |
| 5 to 9 Minutes | 718 | 24.9% |
| 10 to 14 Minutes | 620 | 21.5% |
| 15 to 19 Minutes | 133 | 4.6% |
| 20 to 24 Minutes | 141 | 4.9% |
| 25 to 29 Minutes | 100 | 3.5% |
| 30 to 34 Minutes | 254 | 8.8% |
| 35 to 39 Minutes | 91 | 3.2% |
| 40 to 44 Minutes | 125 | 4.3% |
| 45 to 59 Minutes | 190 | 6.6% |
| 60 to 89 Minutes | 376 | 13.0% |
| 90 or more Minutes | 0 | 0.0% |
Commute Time by Sex in Pulaski
The most common commute times in Pulaski are 10 to 14 minutes (357 commuters, 25.5%) for males and 5 to 9 minutes (495 commuters, 33.4%) for females.
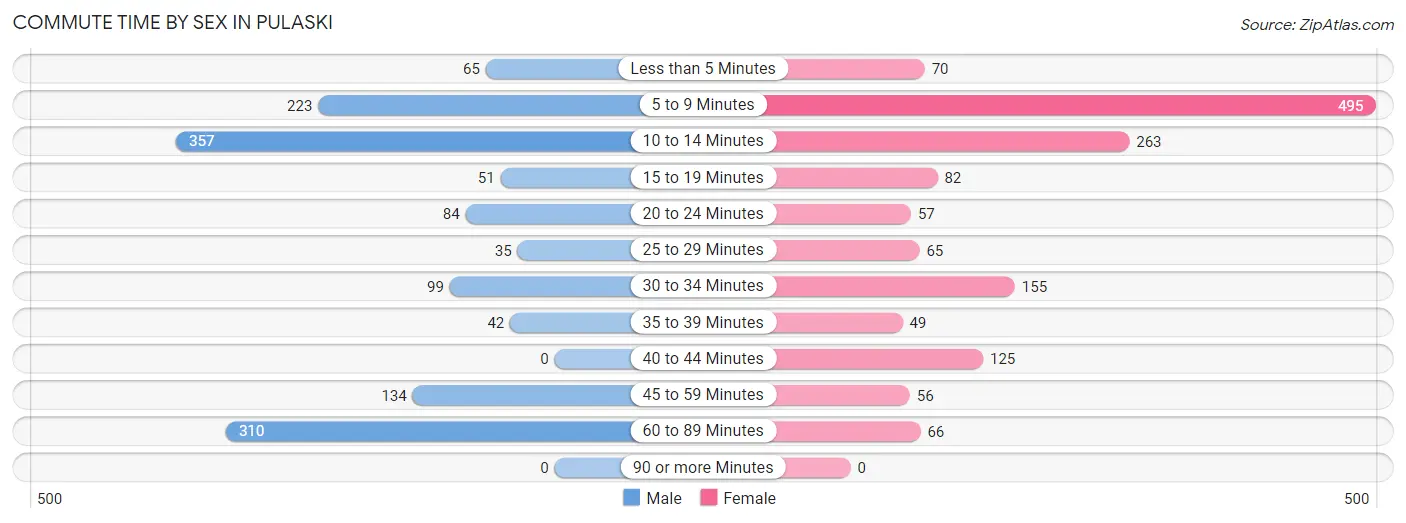
| Commute Time | Male | Female |
| Less than 5 Minutes | 65 (4.6%) | 70 (4.7%) |
| 5 to 9 Minutes | 223 (15.9%) | 495 (33.4%) |
| 10 to 14 Minutes | 357 (25.5%) | 263 (17.7%) |
| 15 to 19 Minutes | 51 (3.6%) | 82 (5.5%) |
| 20 to 24 Minutes | 84 (6.0%) | 57 (3.8%) |
| 25 to 29 Minutes | 35 (2.5%) | 65 (4.4%) |
| 30 to 34 Minutes | 99 (7.1%) | 155 (10.4%) |
| 35 to 39 Minutes | 42 (3.0%) | 49 (3.3%) |
| 40 to 44 Minutes | 0 (0.0%) | 125 (8.4%) |
| 45 to 59 Minutes | 134 (9.6%) | 56 (3.8%) |
| 60 to 89 Minutes | 310 (22.1%) | 66 (4.4%) |
| 90 or more Minutes | 0 (0.0%) | 0 (0.0%) |
Time of Departure to Work by Sex in Pulaski
The most frequent times of departure to work in Pulaski are 12:00 PM to 3:59 PM (290, 20.7%) for males and 7:00 AM to 7:29 AM (301, 20.3%) for females.
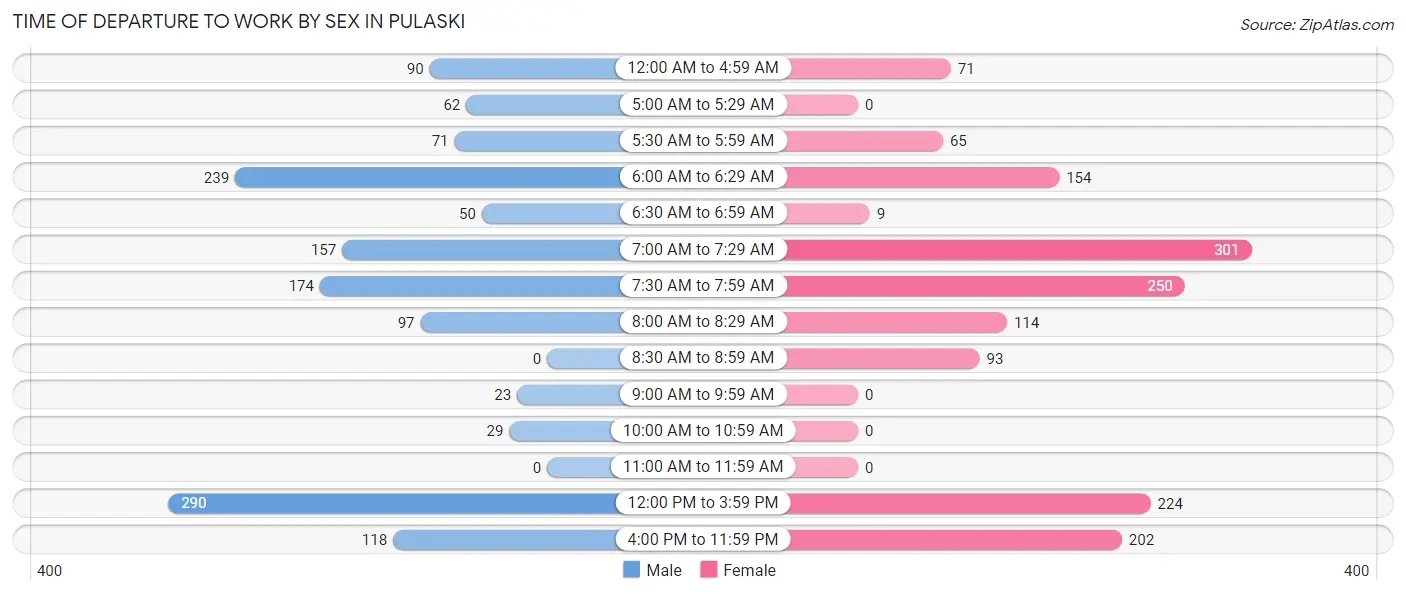
| Time of Departure | Male | Female |
| 12:00 AM to 4:59 AM | 90 (6.4%) | 71 (4.8%) |
| 5:00 AM to 5:29 AM | 62 (4.4%) | 0 (0.0%) |
| 5:30 AM to 5:59 AM | 71 (5.1%) | 65 (4.4%) |
| 6:00 AM to 6:29 AM | 239 (17.1%) | 154 (10.4%) |
| 6:30 AM to 6:59 AM | 50 (3.6%) | 9 (0.6%) |
| 7:00 AM to 7:29 AM | 157 (11.2%) | 301 (20.3%) |
| 7:30 AM to 7:59 AM | 174 (12.4%) | 250 (16.9%) |
| 8:00 AM to 8:29 AM | 97 (6.9%) | 114 (7.7%) |
| 8:30 AM to 8:59 AM | 0 (0.0%) | 93 (6.3%) |
| 9:00 AM to 9:59 AM | 23 (1.6%) | 0 (0.0%) |
| 10:00 AM to 10:59 AM | 29 (2.1%) | 0 (0.0%) |
| 11:00 AM to 11:59 AM | 0 (0.0%) | 0 (0.0%) |
| 12:00 PM to 3:59 PM | 290 (20.7%) | 224 (15.1%) |
| 4:00 PM to 11:59 PM | 118 (8.4%) | 202 (13.6%) |
| Total | 1,400 (100.0%) | 1,483 (100.0%) |
Housing Occupancy in Pulaski
Occupancy by Ownership in Pulaski
Of the total 3,316 dwellings in Pulaski, owner-occupied units account for 1,371 (41.3%), while renter-occupied units make up 1,945 (58.7%).
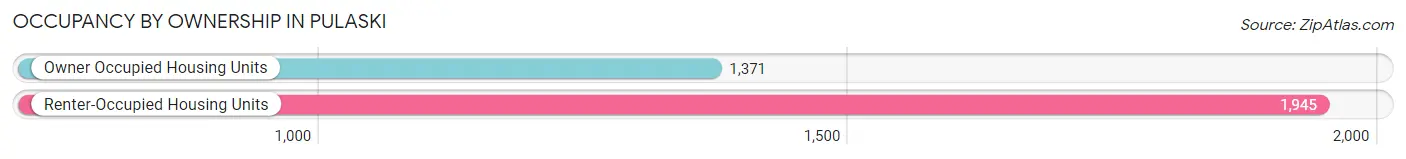
| Occupancy | # Housing Units | % Housing Units |
| Owner Occupied Housing Units | 1,371 | 41.3% |
| Renter-Occupied Housing Units | 1,945 | 58.7% |
| Total Occupied Housing Units | 3,316 | 100.0% |
Occupancy by Household Size in Pulaski
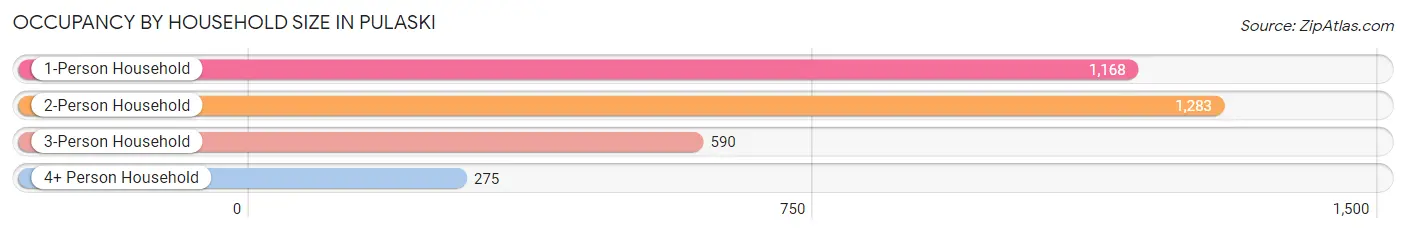
| Household Size | # Housing Units | % Housing Units |
| 1-Person Household | 1,168 | 35.2% |
| 2-Person Household | 1,283 | 38.7% |
| 3-Person Household | 590 | 17.8% |
| 4+ Person Household | 275 | 8.3% |
| Total Housing Units | 3,316 | 100.0% |
Occupancy by Ownership by Household Size in Pulaski
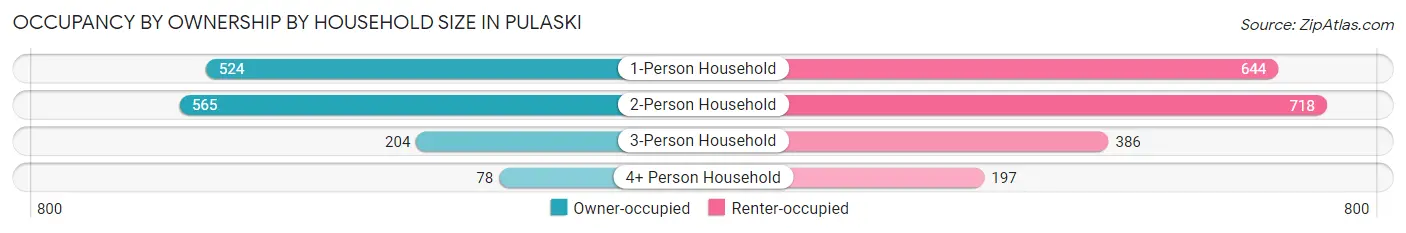
| Household Size | Owner-occupied | Renter-occupied |
| 1-Person Household | 524 (44.9%) | 644 (55.1%) |
| 2-Person Household | 565 (44.0%) | 718 (56.0%) |
| 3-Person Household | 204 (34.6%) | 386 (65.4%) |
| 4+ Person Household | 78 (28.4%) | 197 (71.6%) |
| Total Housing Units | 1,371 (41.3%) | 1,945 (58.7%) |
Occupancy by Educational Attainment in Pulaski
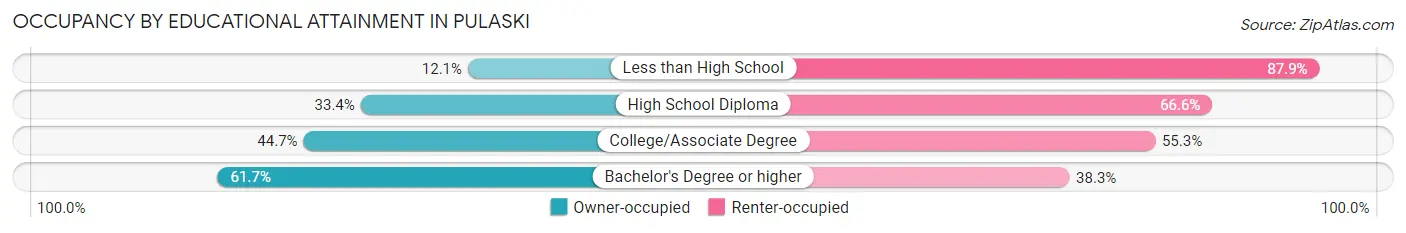
| Household Size | Owner-occupied | Renter-occupied |
| Less than High School | 28 (12.1%) | 203 (87.9%) |
| High School Diploma | 477 (33.4%) | 952 (66.6%) |
| College/Associate Degree | 411 (44.7%) | 508 (55.3%) |
| Bachelor's Degree or higher | 455 (61.7%) | 282 (38.3%) |
Occupancy by Age of Householder in Pulaski
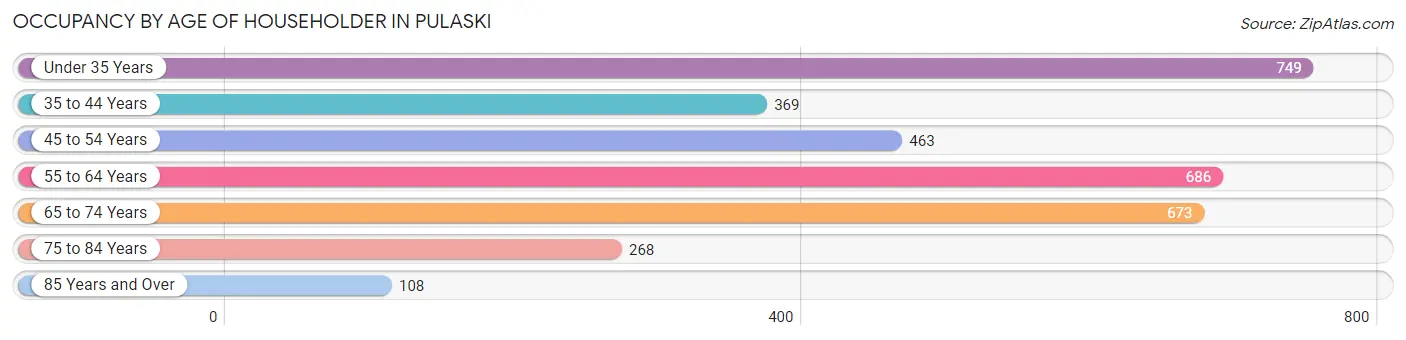
| Age Bracket | # Households | % Households |
| Under 35 Years | 749 | 22.6% |
| 35 to 44 Years | 369 | 11.1% |
| 45 to 54 Years | 463 | 14.0% |
| 55 to 64 Years | 686 | 20.7% |
| 65 to 74 Years | 673 | 20.3% |
| 75 to 84 Years | 268 | 8.1% |
| 85 Years and Over | 108 | 3.3% |
| Total | 3,316 | 100.0% |
Housing Finances in Pulaski
Median Income by Occupancy in Pulaski
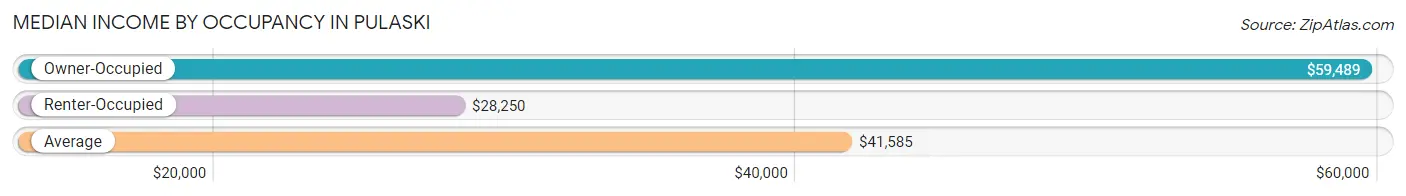
| Occupancy Type | # Households | Median Income |
| Owner-Occupied | 1,371 (41.3%) | $59,489 |
| Renter-Occupied | 1,945 (58.7%) | $28,250 |
| Average | 3,316 (100.0%) | $41,585 |
Occupancy by Householder Income Bracket in Pulaski
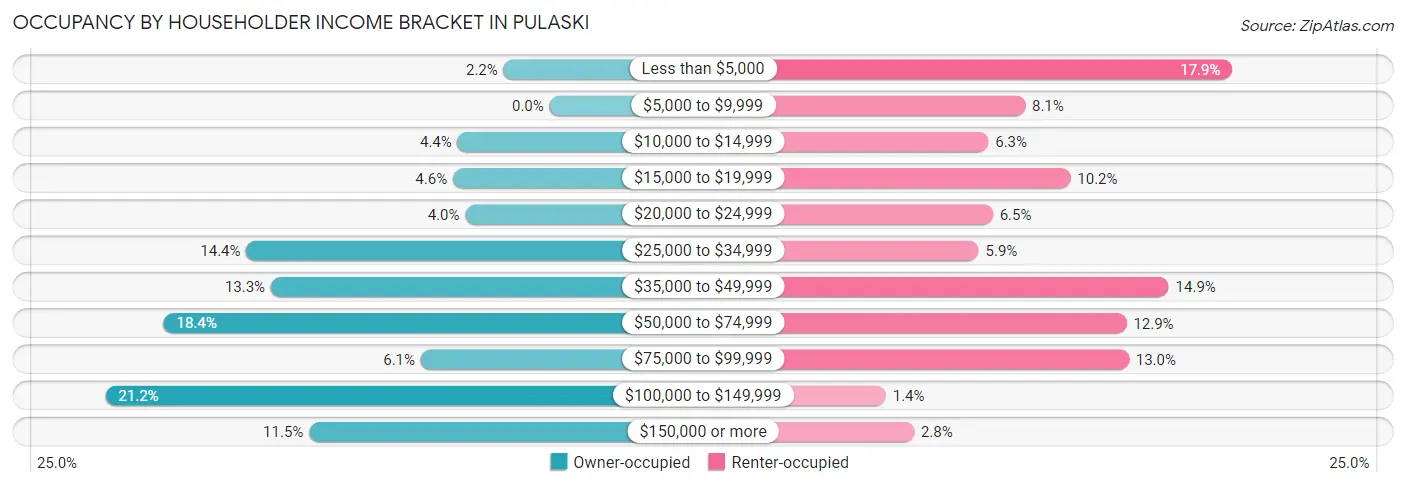
| Income Bracket | Owner-occupied | Renter-occupied |
| Less than $5,000 | 30 (2.2%) | 349 (17.9%) |
| $5,000 to $9,999 | 0 (0.0%) | 157 (8.1%) |
| $10,000 to $14,999 | 60 (4.4%) | 123 (6.3%) |
| $15,000 to $19,999 | 63 (4.6%) | 199 (10.2%) |
| $20,000 to $24,999 | 55 (4.0%) | 127 (6.5%) |
| $25,000 to $34,999 | 198 (14.4%) | 114 (5.9%) |
| $35,000 to $49,999 | 182 (13.3%) | 290 (14.9%) |
| $50,000 to $74,999 | 252 (18.4%) | 251 (12.9%) |
| $75,000 to $99,999 | 84 (6.1%) | 253 (13.0%) |
| $100,000 to $149,999 | 290 (21.1%) | 28 (1.4%) |
| $150,000 or more | 157 (11.5%) | 54 (2.8%) |
| Total | 1,371 (100.0%) | 1,945 (100.0%) |
Monthly Housing Cost Tiers in Pulaski
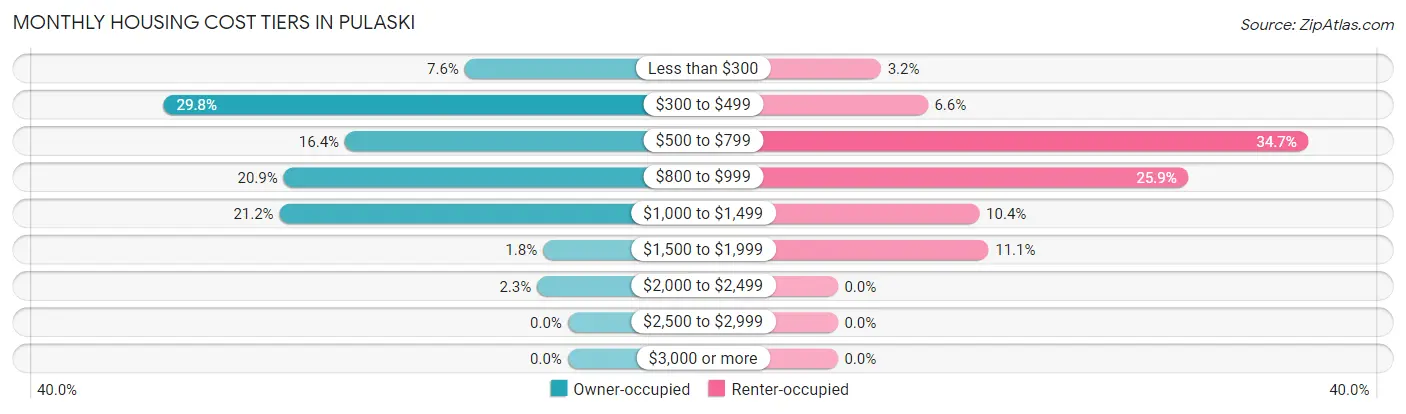
| Monthly Cost | Owner-occupied | Renter-occupied |
| Less than $300 | 104 (7.6%) | 62 (3.2%) |
| $300 to $499 | 408 (29.8%) | 129 (6.6%) |
| $500 to $799 | 225 (16.4%) | 675 (34.7%) |
| $800 to $999 | 287 (20.9%) | 503 (25.9%) |
| $1,000 to $1,499 | 291 (21.2%) | 203 (10.4%) |
| $1,500 to $1,999 | 25 (1.8%) | 216 (11.1%) |
| $2,000 to $2,499 | 31 (2.3%) | 0 (0.0%) |
| $2,500 to $2,999 | 0 (0.0%) | 0 (0.0%) |
| $3,000 or more | 0 (0.0%) | 0 (0.0%) |
| Total | 1,371 (100.0%) | 1,945 (100.0%) |
Physical Housing Characteristics in Pulaski
Housing Structures in Pulaski
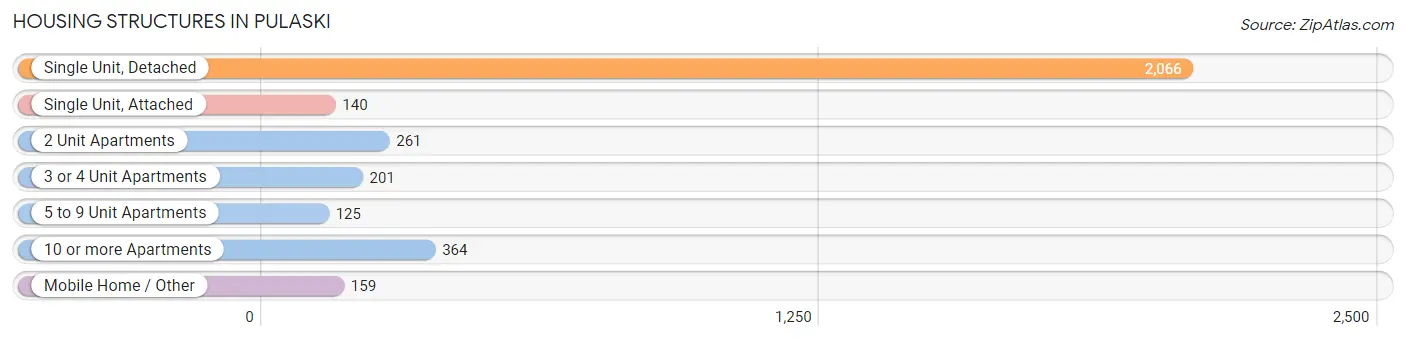
| Structure Type | # Housing Units | % Housing Units |
| Single Unit, Detached | 2,066 | 62.3% |
| Single Unit, Attached | 140 | 4.2% |
| 2 Unit Apartments | 261 | 7.9% |
| 3 or 4 Unit Apartments | 201 | 6.1% |
| 5 to 9 Unit Apartments | 125 | 3.8% |
| 10 or more Apartments | 364 | 11.0% |
| Mobile Home / Other | 159 | 4.8% |
| Total | 3,316 | 100.0% |
Housing Structures by Occupancy in Pulaski
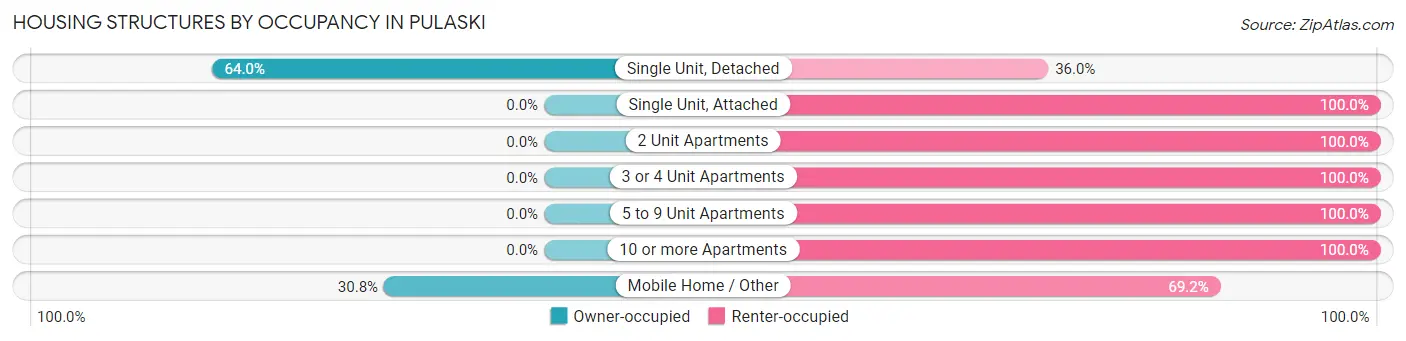
| Structure Type | Owner-occupied | Renter-occupied |
| Single Unit, Detached | 1,322 (64.0%) | 744 (36.0%) |
| Single Unit, Attached | 0 (0.0%) | 140 (100.0%) |
| 2 Unit Apartments | 0 (0.0%) | 261 (100.0%) |
| 3 or 4 Unit Apartments | 0 (0.0%) | 201 (100.0%) |
| 5 to 9 Unit Apartments | 0 (0.0%) | 125 (100.0%) |
| 10 or more Apartments | 0 (0.0%) | 364 (100.0%) |
| Mobile Home / Other | 49 (30.8%) | 110 (69.2%) |
| Total | 1,371 (41.3%) | 1,945 (58.7%) |
Housing Structures by Number of Rooms in Pulaski
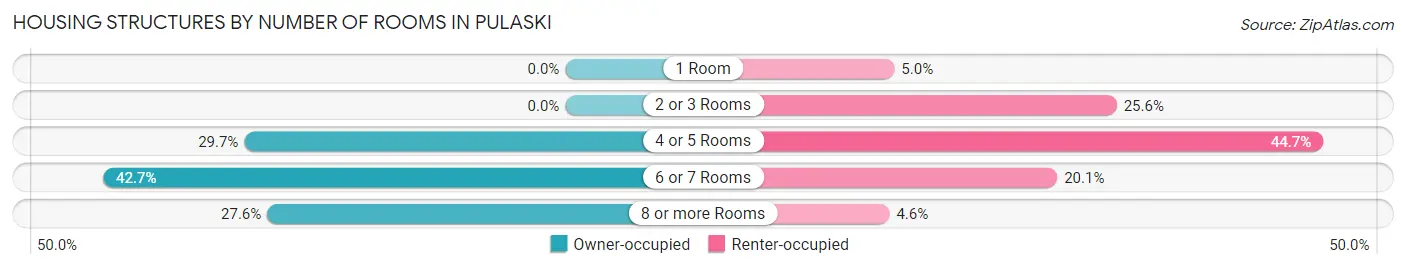
| Number of Rooms | Owner-occupied | Renter-occupied |
| 1 Room | 0 (0.0%) | 98 (5.0%) |
| 2 or 3 Rooms | 0 (0.0%) | 498 (25.6%) |
| 4 or 5 Rooms | 407 (29.7%) | 869 (44.7%) |
| 6 or 7 Rooms | 586 (42.7%) | 391 (20.1%) |
| 8 or more Rooms | 378 (27.6%) | 89 (4.6%) |
| Total | 1,371 (100.0%) | 1,945 (100.0%) |
Housing Structure by Heating Type in Pulaski
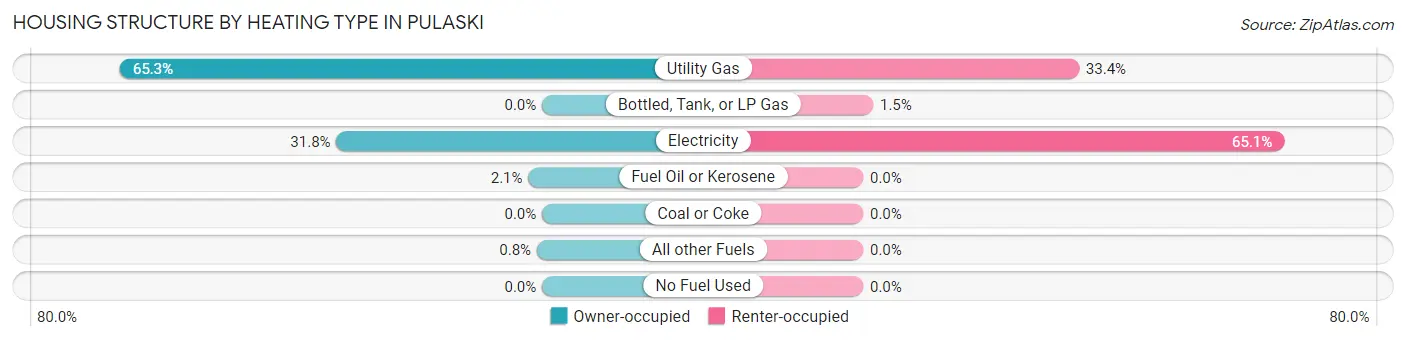
| Heating Type | Owner-occupied | Renter-occupied |
| Utility Gas | 895 (65.3%) | 649 (33.4%) |
| Bottled, Tank, or LP Gas | 0 (0.0%) | 30 (1.5%) |
| Electricity | 436 (31.8%) | 1,266 (65.1%) |
| Fuel Oil or Kerosene | 29 (2.1%) | 0 (0.0%) |
| Coal or Coke | 0 (0.0%) | 0 (0.0%) |
| All other Fuels | 11 (0.8%) | 0 (0.0%) |
| No Fuel Used | 0 (0.0%) | 0 (0.0%) |
| Total | 1,371 (100.0%) | 1,945 (100.0%) |
Household Vehicle Usage in Pulaski
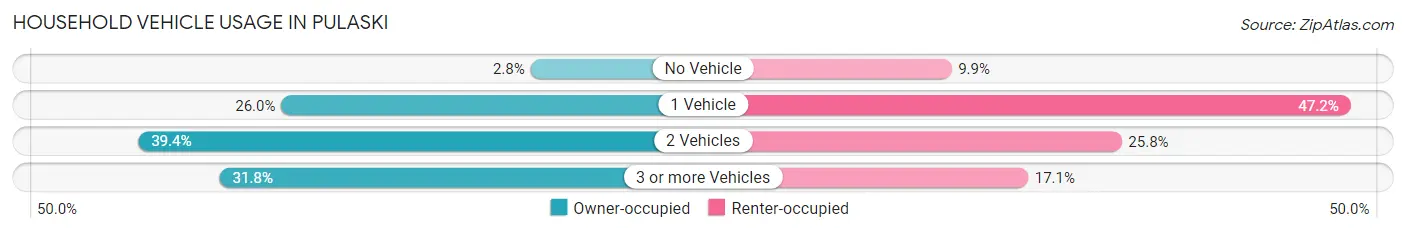
| Vehicles per Household | Owner-occupied | Renter-occupied |
| No Vehicle | 38 (2.8%) | 193 (9.9%) |
| 1 Vehicle | 357 (26.0%) | 918 (47.2%) |
| 2 Vehicles | 540 (39.4%) | 502 (25.8%) |
| 3 or more Vehicles | 436 (31.8%) | 332 (17.1%) |
| Total | 1,371 (100.0%) | 1,945 (100.0%) |
Real Estate & Mortgages in Pulaski
Real Estate and Mortgage Overview in Pulaski
| Characteristic | Without Mortgage | With Mortgage |
| Housing Units | 758 | 613 |
| Median Property Value | $122,100 | $140,500 |
| Median Household Income | $48,718 | $64 |
| Monthly Housing Costs | $404 | $0 |
| Real Estate Taxes | $918 | $0 |
Property Value by Mortgage Status in Pulaski
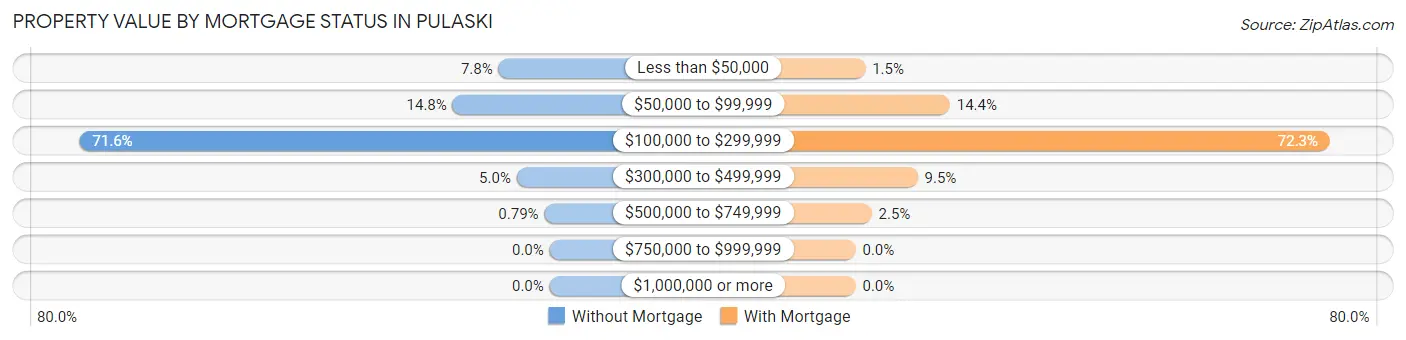
| Property Value | Without Mortgage | With Mortgage |
| Less than $50,000 | 59 (7.8%) | 9 (1.5%) |
| $50,000 to $99,999 | 112 (14.8%) | 88 (14.4%) |
| $100,000 to $299,999 | 543 (71.6%) | 443 (72.3%) |
| $300,000 to $499,999 | 38 (5.0%) | 58 (9.5%) |
| $500,000 to $749,999 | 6 (0.8%) | 15 (2.5%) |
| $750,000 to $999,999 | 0 (0.0%) | 0 (0.0%) |
| $1,000,000 or more | 0 (0.0%) | 0 (0.0%) |
| Total | 758 (100.0%) | 613 (100.0%) |
Household Income by Mortgage Status in Pulaski
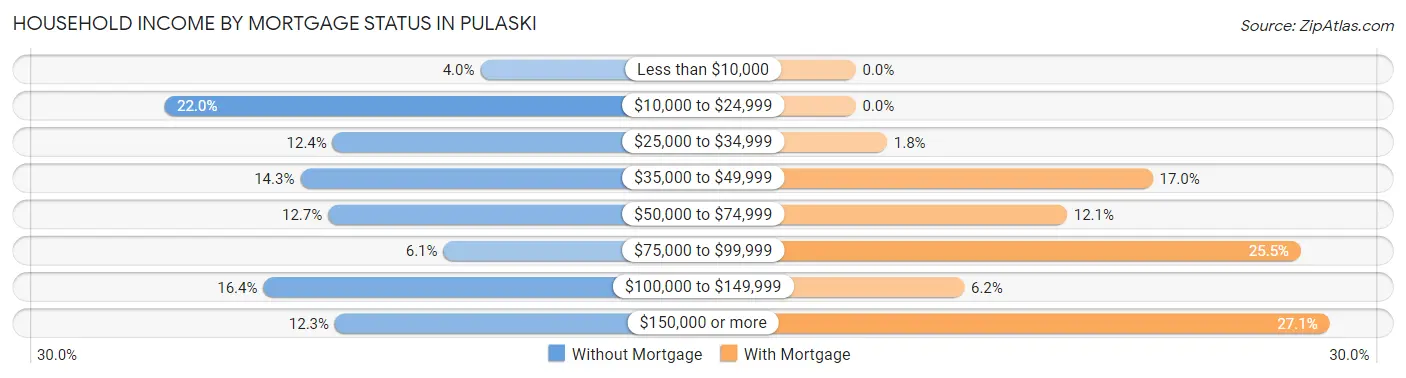
| Household Income | Without Mortgage | With Mortgage |
| Less than $10,000 | 30 (4.0%) | 0 (0.0%) |
| $10,000 to $24,999 | 167 (22.0%) | 0 (0.0%) |
| $25,000 to $34,999 | 94 (12.4%) | 11 (1.8%) |
| $35,000 to $49,999 | 108 (14.2%) | 104 (17.0%) |
| $50,000 to $74,999 | 96 (12.7%) | 74 (12.1%) |
| $75,000 to $99,999 | 46 (6.1%) | 156 (25.5%) |
| $100,000 to $149,999 | 124 (16.4%) | 38 (6.2%) |
| $150,000 or more | 93 (12.3%) | 166 (27.1%) |
| Total | 758 (100.0%) | 613 (100.0%) |
Property Value to Household Income Ratio in Pulaski
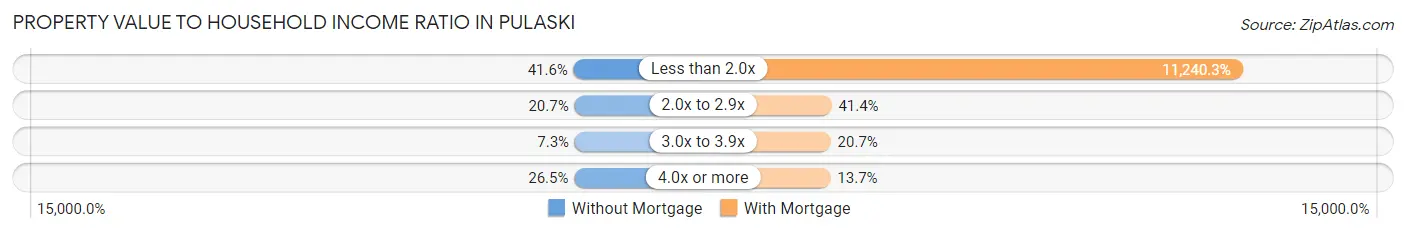
| Value-to-Income Ratio | Without Mortgage | With Mortgage |
| Less than 2.0x | 315 (41.6%) | 68,903 (11,240.3%) |
| 2.0x to 2.9x | 157 (20.7%) | 254 (41.4%) |
| 3.0x to 3.9x | 55 (7.3%) | 127 (20.7%) |
| 4.0x or more | 201 (26.5%) | 84 (13.7%) |
| Total | 758 (100.0%) | 613 (100.0%) |
Real Estate Taxes by Mortgage Status in Pulaski
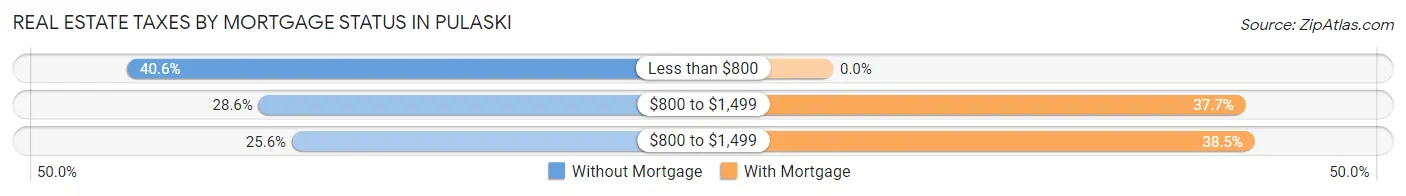
| Property Taxes | Without Mortgage | With Mortgage |
| Less than $800 | 308 (40.6%) | 0 (0.0%) |
| $800 to $1,499 | 217 (28.6%) | 231 (37.7%) |
| $800 to $1,499 | 194 (25.6%) | 236 (38.5%) |
| Total | 758 (100.0%) | 613 (100.0%) |
Health & Disability in Pulaski
Health Insurance Coverage by Age in Pulaski
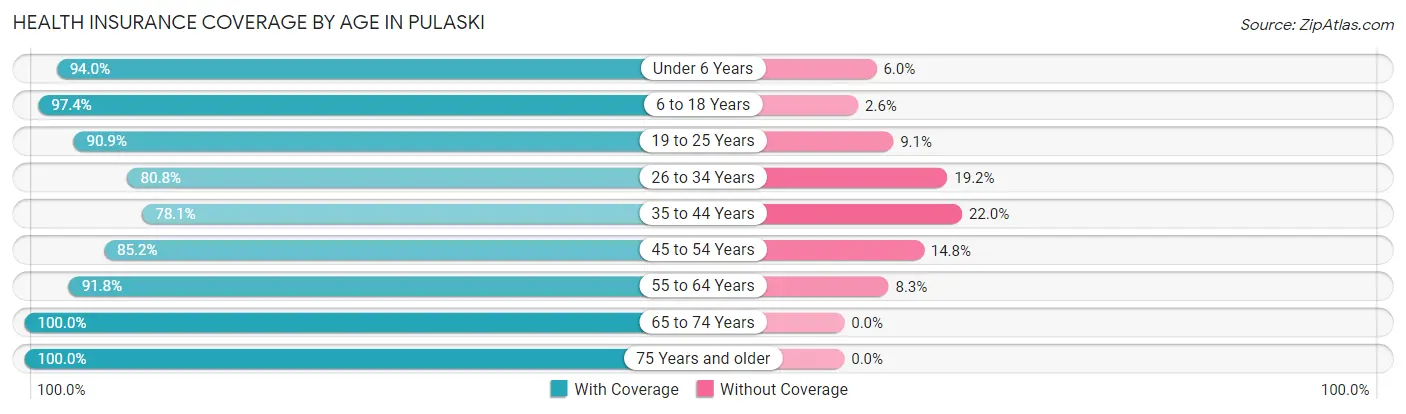
| Age Bracket | With Coverage | Without Coverage |
| Under 6 Years | 564 (94.0%) | 36 (6.0%) |
| 6 to 18 Years | 1,319 (97.4%) | 35 (2.6%) |
| 19 to 25 Years | 876 (90.9%) | 88 (9.1%) |
| 26 to 34 Years | 643 (80.8%) | 153 (19.2%) |
| 35 to 44 Years | 658 (78.0%) | 185 (22.0%) |
| 45 to 54 Years | 666 (85.2%) | 116 (14.8%) |
| 55 to 64 Years | 1,023 (91.7%) | 92 (8.3%) |
| 65 to 74 Years | 849 (100.0%) | 0 (0.0%) |
| 75 Years and older | 664 (100.0%) | 0 (0.0%) |
| Total | 7,262 (91.1%) | 705 (8.8%) |
Health Insurance Coverage by Citizenship Status in Pulaski
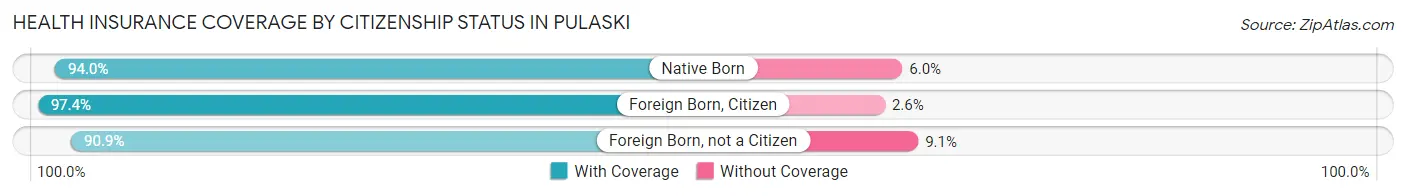
| Citizenship Status | With Coverage | Without Coverage |
| Native Born | 564 (94.0%) | 36 (6.0%) |
| Foreign Born, Citizen | 1,319 (97.4%) | 35 (2.6%) |
| Foreign Born, not a Citizen | 876 (90.9%) | 88 (9.1%) |
Health Insurance Coverage by Household Income in Pulaski
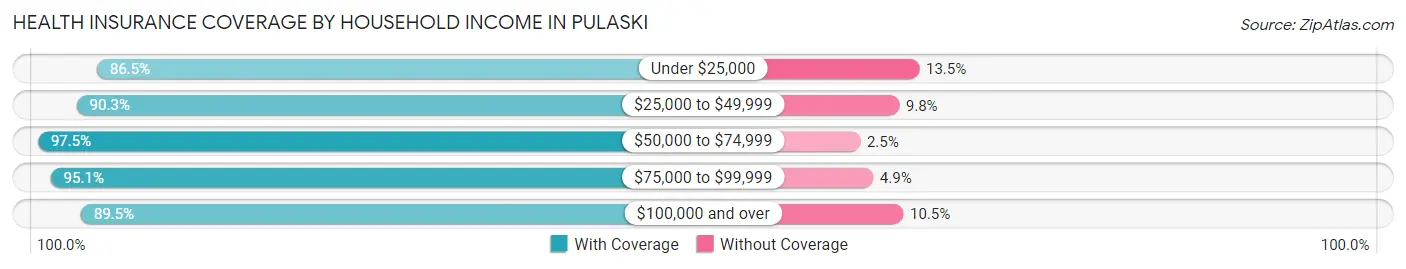
| Household Income | With Coverage | Without Coverage |
| Under $25,000 | 1,917 (86.5%) | 300 (13.5%) |
| $25,000 to $49,999 | 1,434 (90.2%) | 155 (9.8%) |
| $50,000 to $74,999 | 1,542 (97.5%) | 39 (2.5%) |
| $75,000 to $99,999 | 758 (95.1%) | 39 (4.9%) |
| $100,000 and over | 1,282 (89.5%) | 151 (10.5%) |
Public vs Private Health Insurance Coverage by Age in Pulaski
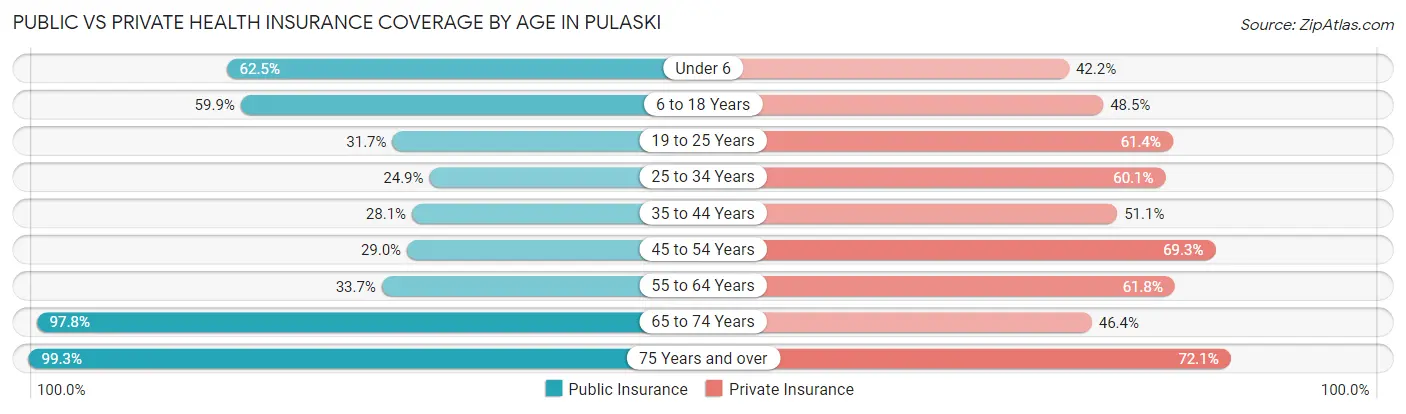
| Age Bracket | Public Insurance | Private Insurance |
| Under 6 | 375 (62.5%) | 253 (42.2%) |
| 6 to 18 Years | 811 (59.9%) | 657 (48.5%) |
| 19 to 25 Years | 306 (31.7%) | 592 (61.4%) |
| 25 to 34 Years | 198 (24.9%) | 478 (60.1%) |
| 35 to 44 Years | 237 (28.1%) | 431 (51.1%) |
| 45 to 54 Years | 227 (29.0%) | 542 (69.3%) |
| 55 to 64 Years | 376 (33.7%) | 689 (61.8%) |
| 65 to 74 Years | 830 (97.8%) | 394 (46.4%) |
| 75 Years and over | 659 (99.3%) | 479 (72.1%) |
| Total | 4,019 (50.4%) | 4,515 (56.7%) |
Disability Status by Sex by Age in Pulaski
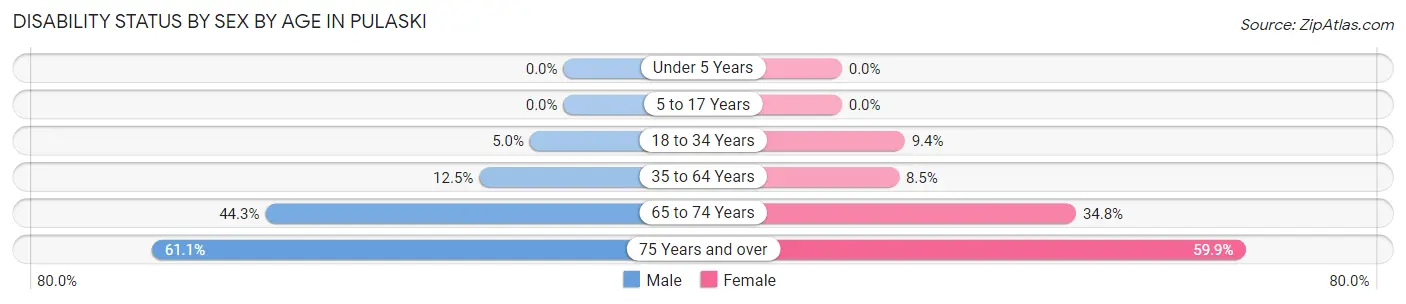
| Age Bracket | Male | Female |
| Under 5 Years | 0 (0.0%) | 0 (0.0%) |
| 5 to 17 Years | 0 (0.0%) | 0 (0.0%) |
| 18 to 34 Years | 46 (5.0%) | 100 (9.3%) |
| 35 to 64 Years | 182 (12.5%) | 109 (8.5%) |
| 65 to 74 Years | 139 (44.3%) | 186 (34.8%) |
| 75 Years and over | 110 (61.1%) | 290 (59.9%) |
Disability Class by Sex by Age in Pulaski
Disability Class: Hearing Difficulty
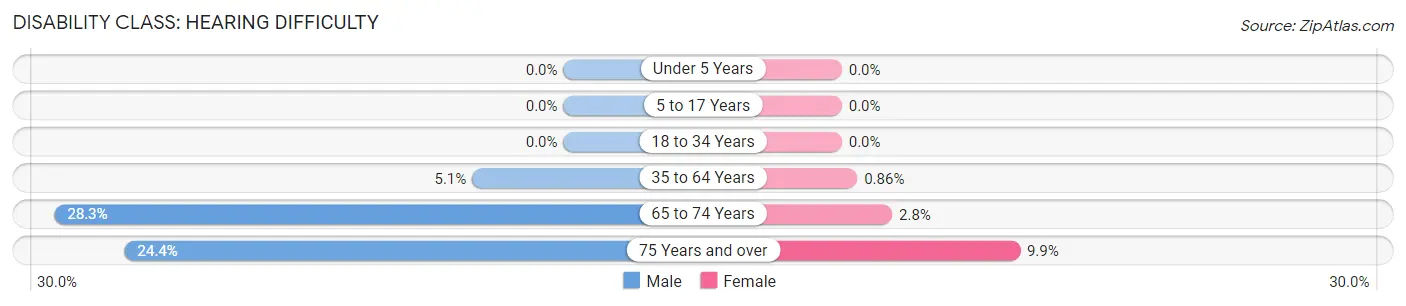
| Age Bracket | Male | Female |
| Under 5 Years | 0 (0.0%) | 0 (0.0%) |
| 5 to 17 Years | 0 (0.0%) | 0 (0.0%) |
| 18 to 34 Years | 0 (0.0%) | 0 (0.0%) |
| 35 to 64 Years | 74 (5.1%) | 11 (0.9%) |
| 65 to 74 Years | 89 (28.3%) | 15 (2.8%) |
| 75 Years and over | 44 (24.4%) | 48 (9.9%) |
Disability Class: Vision Difficulty
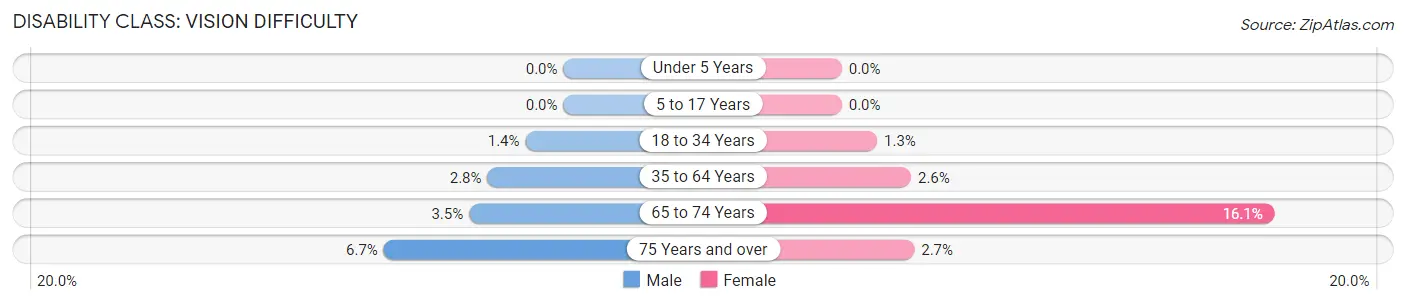
| Age Bracket | Male | Female |
| Under 5 Years | 0 (0.0%) | 0 (0.0%) |
| 5 to 17 Years | 0 (0.0%) | 0 (0.0%) |
| 18 to 34 Years | 13 (1.4%) | 14 (1.3%) |
| 35 to 64 Years | 41 (2.8%) | 33 (2.6%) |
| 65 to 74 Years | 11 (3.5%) | 86 (16.1%) |
| 75 Years and over | 12 (6.7%) | 13 (2.7%) |
Disability Class: Cognitive Difficulty
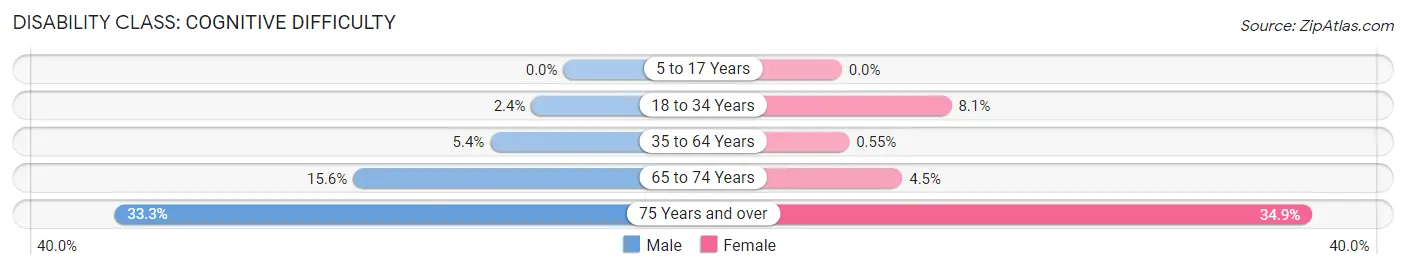
| Age Bracket | Male | Female |
| 5 to 17 Years | 0 (0.0%) | 0 (0.0%) |
| 18 to 34 Years | 22 (2.4%) | 87 (8.1%) |
| 35 to 64 Years | 79 (5.4%) | 7 (0.5%) |
| 65 to 74 Years | 49 (15.6%) | 24 (4.5%) |
| 75 Years and over | 60 (33.3%) | 169 (34.9%) |
Disability Class: Ambulatory Difficulty
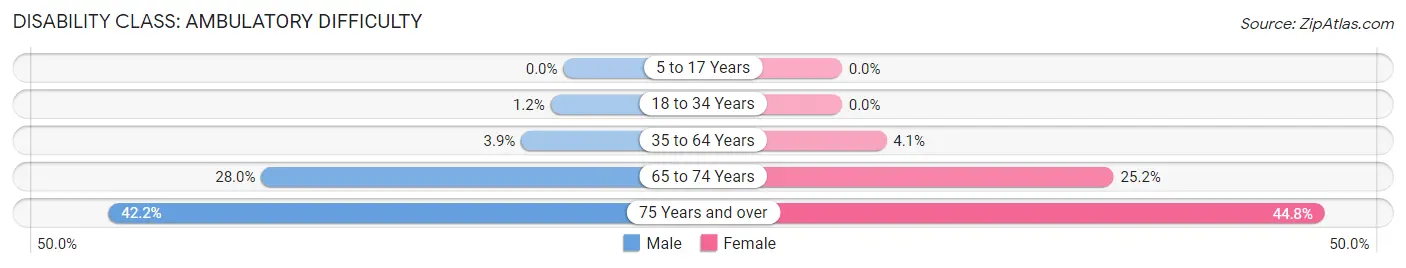
| Age Bracket | Male | Female |
| 5 to 17 Years | 0 (0.0%) | 0 (0.0%) |
| 18 to 34 Years | 11 (1.2%) | 0 (0.0%) |
| 35 to 64 Years | 57 (3.9%) | 53 (4.1%) |
| 65 to 74 Years | 88 (28.0%) | 135 (25.2%) |
| 75 Years and over | 76 (42.2%) | 217 (44.8%) |
Disability Class: Self-Care Difficulty
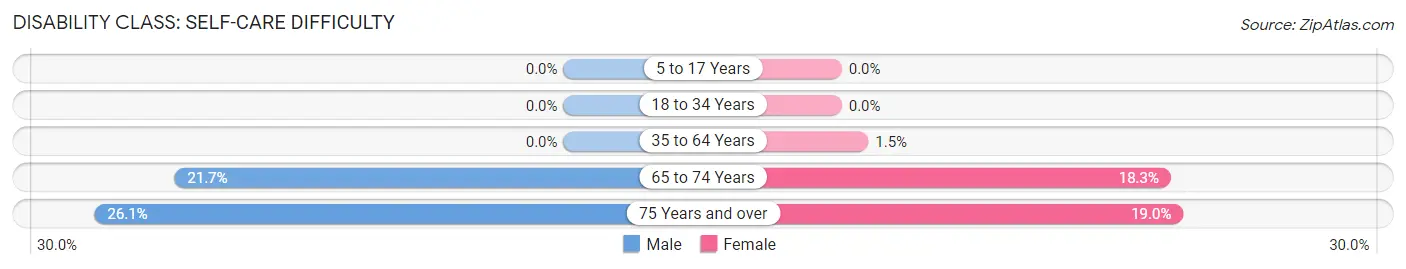
| Age Bracket | Male | Female |
| 5 to 17 Years | 0 (0.0%) | 0 (0.0%) |
| 18 to 34 Years | 0 (0.0%) | 0 (0.0%) |
| 35 to 64 Years | 0 (0.0%) | 19 (1.5%) |
| 65 to 74 Years | 68 (21.7%) | 98 (18.3%) |
| 75 Years and over | 47 (26.1%) | 92 (19.0%) |
Technology Access in Pulaski
Computing Device Access in Pulaski
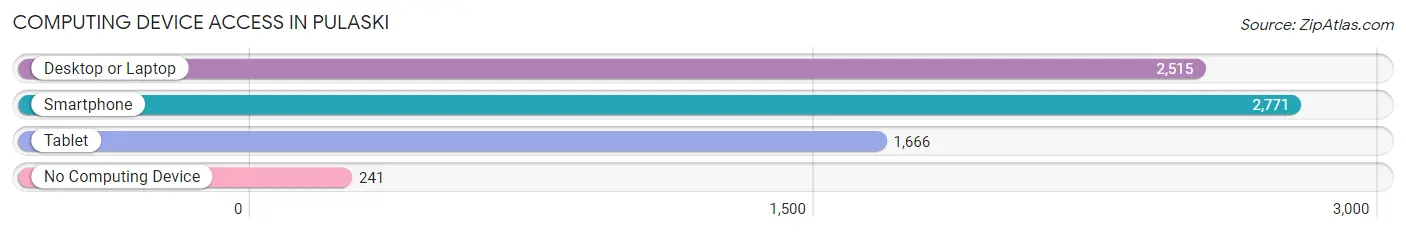
| Device Type | # Households | % Households |
| Desktop or Laptop | 2,515 | 75.8% |
| Smartphone | 2,771 | 83.6% |
| Tablet | 1,666 | 50.2% |
| No Computing Device | 241 | 7.3% |
| Total | 3,316 | 100.0% |
Internet Access in Pulaski
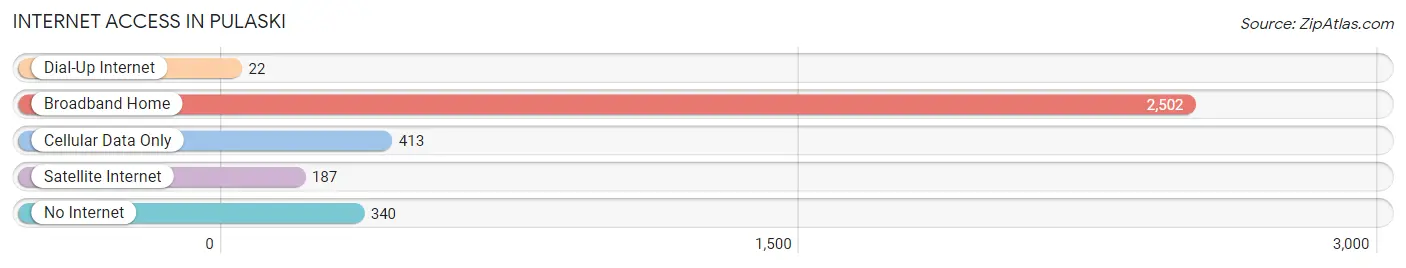
| Internet Type | # Households | % Households |
| Dial-Up Internet | 22 | 0.7% |
| Broadband Home | 2,502 | 75.4% |
| Cellular Data Only | 413 | 12.4% |
| Satellite Internet | 187 | 5.6% |
| No Internet | 340 | 10.2% |
| Total | 3,316 | 100.0% |
Pulaski Summary
Pulaski, Tennessee is a small city located in Giles County in the south-central part of the state. It is situated along the banks of the Elk River and is approximately 50 miles south of Nashville. The city has a population of approximately 8,000 people and is the county seat of Giles County.
History
Pulaski was founded in 1809 by Stephen Pulaski, a Revolutionary War veteran. The city was named after him and was originally known as “Pulaski Courthouse”. The city was incorporated in 1839 and was the site of a major Civil War battle in 1863. The Battle of Pulaski was a Confederate victory and resulted in the death of over 1,000 Union soldiers.
Geography
Pulaski is located in the Highland Rim region of Tennessee. The city is situated along the banks of the Elk River and is surrounded by rolling hills and farmland. The city is located approximately 50 miles south of Nashville and is accessible via Interstate 65.
Economy
Pulaski’s economy is largely based on agriculture and manufacturing. The city is home to several large manufacturing plants, including a General Motors plant and a Tyson Foods plant. The city is also home to several small businesses, including restaurants, retail stores, and service providers.
Demographics
As of the 2010 census, the population of Pulaski was 8,076. The racial makeup of the city was 79.3% White, 17.2% African American, 0.3% Native American, 0.7% Asian, 0.1% Pacific Islander, and 2.4% from other races. The median household income was $31,945 and the median family income was $41,945. The per capita income was $17,845.
Conclusion
Pulaski, Tennessee is a small city located in Giles County in the south-central part of the state. It was founded in 1809 and was the site of a major Civil War battle in 1863. The city’s economy is largely based on agriculture and manufacturing and the population is approximately 8,000 people. The racial makeup of the city is 79.3% White, 17.2% African American, 0.3% Native American, 0.7% Asian, 0.1% Pacific Islander, and 2.4% from other races. The median household income was $31,945 and the median family income was $41,945.
Common Questions
What is Per Capita Income in Pulaski?
Per Capita income in Pulaski is $23,826.
What is the Median Family Income in Pulaski?
Median Family Income in Pulaski is $49,800.
What is the Median Household income in Pulaski?
Median Household Income in Pulaski is $41,585.
What is Income or Wage Gap in Pulaski?
Income or Wage Gap in Pulaski is 13.0%.
Women in Pulaski earn 87.0 cents for every dollar earned by a man.
What is Inequality or Gini Index in Pulaski?
Inequality or Gini Index in Pulaski is 0.49.
What is the Total Population of Pulaski?
Total Population of Pulaski is 8,301.
What is the Total Male Population of Pulaski?
Total Male Population of Pulaski is 3,916.
What is the Total Female Population of Pulaski?
Total Female Population of Pulaski is 4,385.
What is the Ratio of Males per 100 Females in Pulaski?
There are 89.30 Males per 100 Females in Pulaski.
What is the Ratio of Females per 100 Males in Pulaski?
There are 111.98 Females per 100 Males in Pulaski.
What is the Median Population Age in Pulaski?
Median Population Age in Pulaski is 39.9 Years.
What is the Average Family Size in Pulaski
Average Family Size in Pulaski is 2.9 People.
What is the Average Household Size in Pulaski
Average Household Size in Pulaski is 2.3 People.
How Large is the Labor Force in Pulaski?
There are 3,258 People in the Labor Forcein in Pulaski.
What is the Percentage of People in the Labor Force in Pulaski?
48.8% of People are in the Labor Force in Pulaski.
What is the Unemployment Rate in Pulaski?
Unemployment Rate in Pulaski is 7.4%.