Covington, TN Map & Demographics
Covington Map
Covington Overview
$23,396
PER CAPITA INCOME
$46,201
AVG FAMILY INCOME
$44,384
AVG HOUSEHOLD INCOME
18.3%
WAGE / INCOME GAP [ % ]
81.7¢/ $1
WAGE / INCOME GAP [ $ ]
$12,880
FAMILY INCOME DEFICIT
0.41
INEQUALITY / GINI INDEX
8,644
TOTAL POPULATION
4,012
MALE POPULATION
4,632
FEMALE POPULATION
86.61
MALES / 100 FEMALES
115.45
FEMALES / 100 MALES
35.4
MEDIAN AGE
3.0
AVG FAMILY SIZE
2.4
AVG HOUSEHOLD SIZE
3,649
LABOR FORCE [ PEOPLE ]
55.1%
PERCENT IN LABOR FORCE
5.5%
UNEMPLOYMENT RATE
Covington Zip Codes
Income in Covington
Income Overview in Covington
Per Capita Income in Covington is $23,396, while median incomes of families and households are $46,201 and $44,384 respectively.
| Characteristic | Number | Measure |
| Per Capita Income | 8,644 | $23,396 |
| Median Family Income | 2,298 | $46,201 |
| Mean Family Income | 2,298 | $60,194 |
| Median Household Income | 3,499 | $44,384 |
| Mean Household Income | 3,499 | $53,917 |
| Income Deficit | 2,298 | $12,880 |
| Wage / Income Gap (%) | 8,644 | 18.32% |
| Wage / Income Gap ($) | 8,644 | 81.68¢ per $1 |
| Gini / Inequality Index | 8,644 | 0.41 |
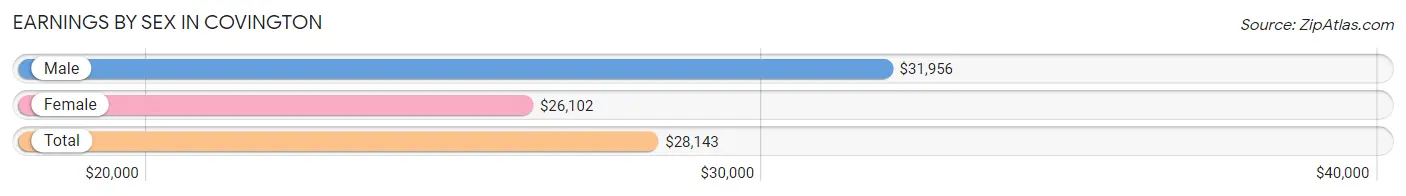
Earnings by Sex in Covington
Average Earnings in Covington are $28,143, $31,956 for men and $26,102 for women, a difference of 18.3%.
| Sex | Number | Average Earnings |
| Male | 1,897 (48.4%) | $31,956 |
| Female | 2,026 (51.6%) | $26,102 |
| Total | 3,923 (100.0%) | $28,143 |
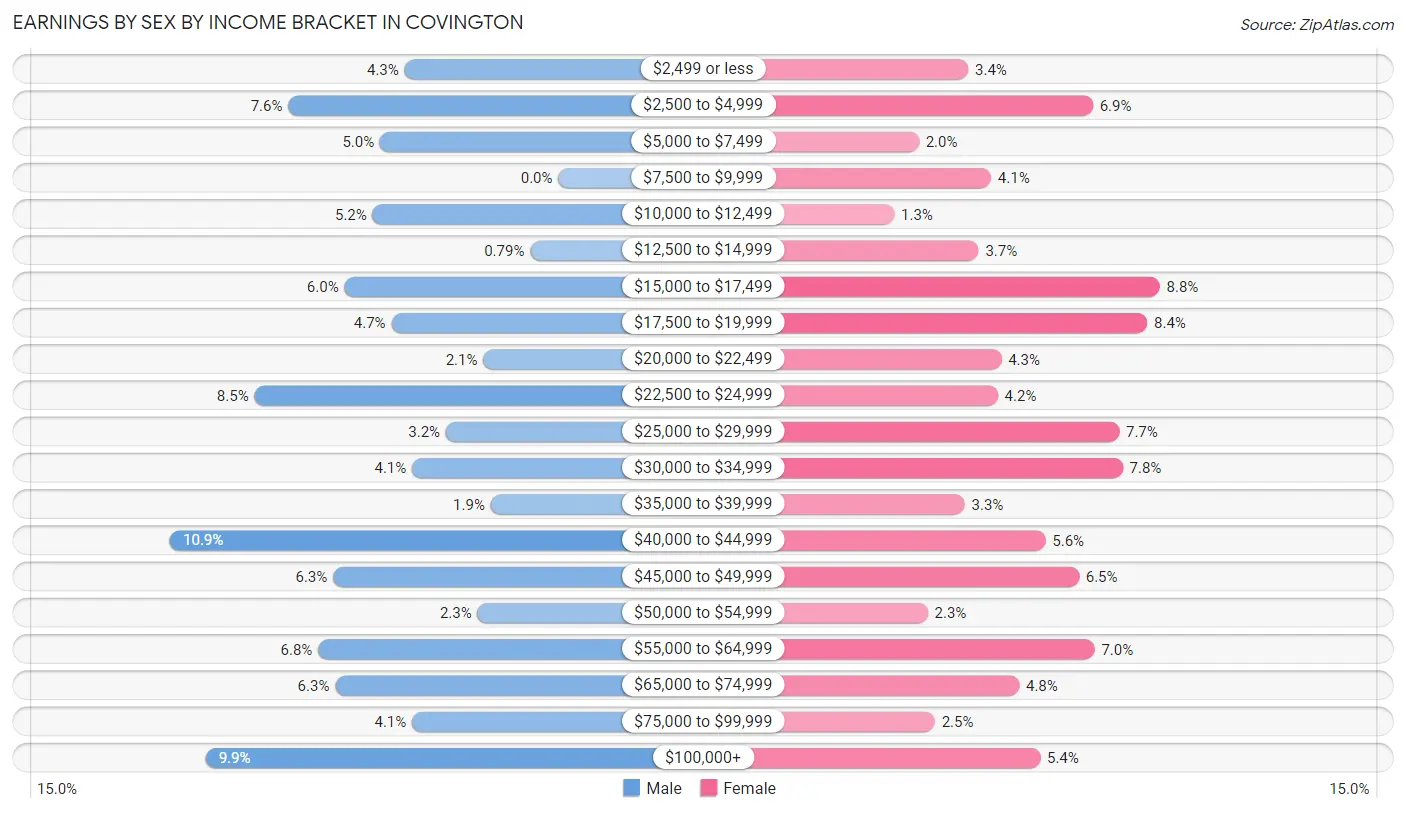
Earnings by Sex by Income Bracket in Covington
The most common earnings brackets in Covington are $40,000 to $44,999 for men (207 | 10.9%) and $15,000 to $17,499 for women (178 | 8.8%).
| Income | Male | Female |
| $2,499 or less | 82 (4.3%) | 69 (3.4%) |
| $2,500 to $4,999 | 144 (7.6%) | 140 (6.9%) |
| $5,000 to $7,499 | 95 (5.0%) | 41 (2.0%) |
| $7,500 to $9,999 | 0 (0.0%) | 82 (4.1%) |
| $10,000 to $12,499 | 99 (5.2%) | 27 (1.3%) |
| $12,500 to $14,999 | 15 (0.8%) | 75 (3.7%) |
| $15,000 to $17,499 | 114 (6.0%) | 178 (8.8%) |
| $17,500 to $19,999 | 89 (4.7%) | 171 (8.4%) |
| $20,000 to $22,499 | 40 (2.1%) | 88 (4.3%) |
| $22,500 to $24,999 | 162 (8.5%) | 86 (4.2%) |
| $25,000 to $29,999 | 60 (3.2%) | 155 (7.6%) |
| $30,000 to $34,999 | 78 (4.1%) | 157 (7.7%) |
| $35,000 to $39,999 | 36 (1.9%) | 67 (3.3%) |
| $40,000 to $44,999 | 207 (10.9%) | 113 (5.6%) |
| $45,000 to $49,999 | 120 (6.3%) | 132 (6.5%) |
| $50,000 to $54,999 | 43 (2.3%) | 46 (2.3%) |
| $55,000 to $64,999 | 128 (6.8%) | 141 (7.0%) |
| $65,000 to $74,999 | 119 (6.3%) | 98 (4.8%) |
| $75,000 to $99,999 | 78 (4.1%) | 50 (2.5%) |
| $100,000+ | 188 (9.9%) | 110 (5.4%) |
| Total | 1,897 (100.0%) | 2,026 (100.0%) |
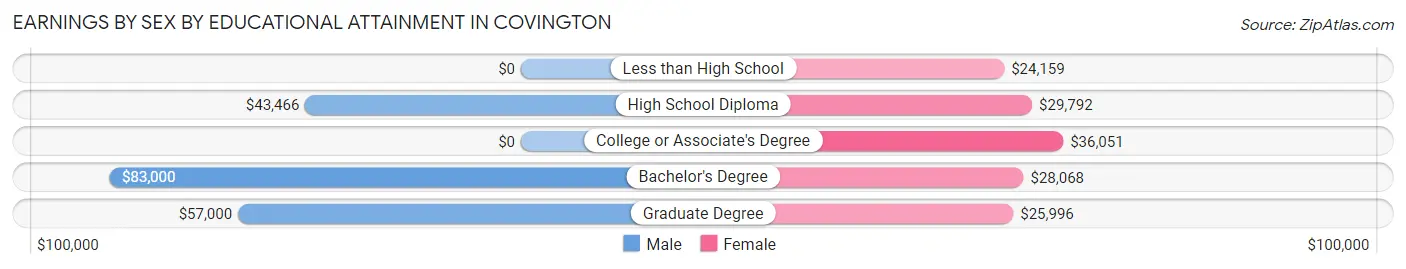
Earnings by Sex by Educational Attainment in Covington
Average earnings in Covington are $43,847 for men and $29,777 for women, a difference of 32.1%. Men with an educational attainment of bachelor's degree enjoy the highest average annual earnings of $83,000, while those with high school diploma education earn the least with $43,466. Women with an educational attainment of college or associate's degree earn the most with the average annual earnings of $36,051, while those with less than high school education have the smallest earnings of $24,159.
| Educational Attainment | Male Income | Female Income |
| Less than High School | - | - |
| High School Diploma | $43,466 | $29,792 |
| College or Associate's Degree | - | - |
| Bachelor's Degree | $83,000 | $28,068 |
| Graduate Degree | $57,000 | $25,996 |
| Total | $43,847 | $29,777 |
Family Income in Covington
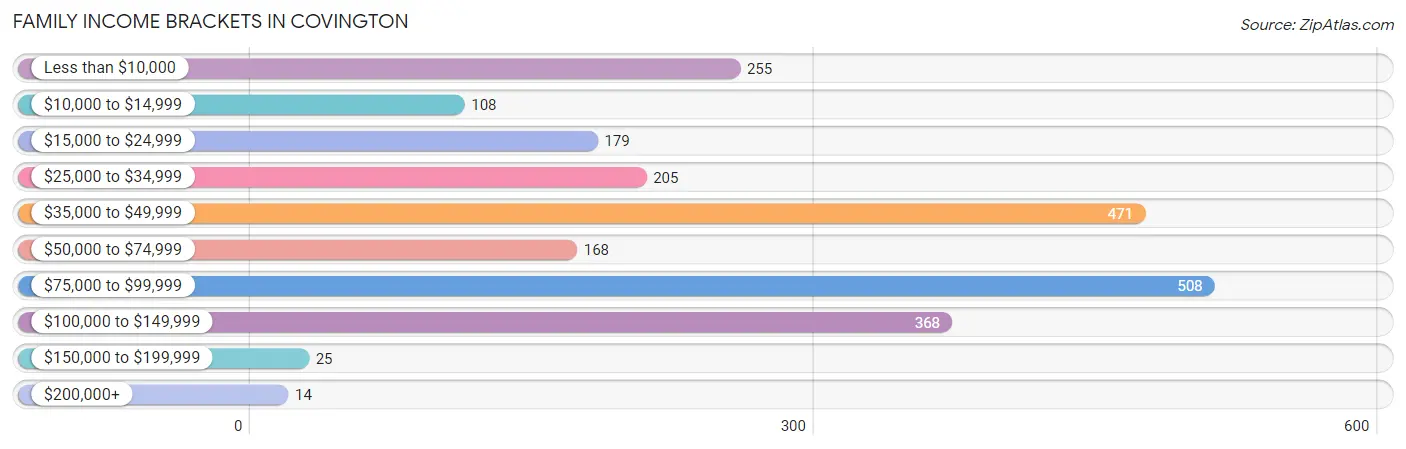
Family Income Brackets in Covington
According to the Covington family income data, there are 508 families falling into the $75,000 to $99,999 income range, which is the most common income bracket and makes up 22.1% of all families. Conversely, the $200,000+ income bracket is the least frequent group with only 14 families (0.6%) belonging to this category.
| Income Bracket | # Families | % Families |
| Less than $10,000 | 255 | 11.1% |
| $10,000 to $14,999 | 108 | 4.7% |
| $15,000 to $24,999 | 179 | 7.8% |
| $25,000 to $34,999 | 205 | 8.9% |
| $35,000 to $49,999 | 471 | 20.5% |
| $50,000 to $74,999 | 168 | 7.3% |
| $75,000 to $99,999 | 508 | 22.1% |
| $100,000 to $149,999 | 368 | 16.0% |
| $150,000 to $199,999 | 25 | 1.1% |
| $200,000+ | 14 | 0.6% |
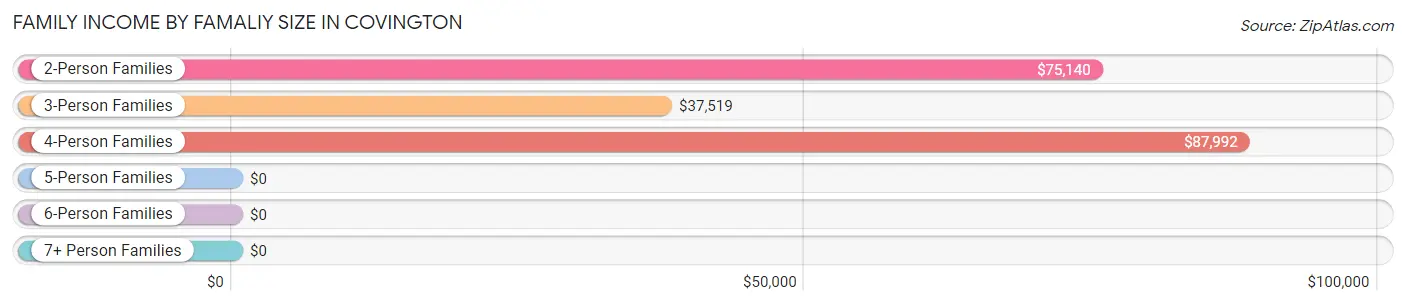
Family Income by Famaliy Size in Covington
4-person families (373 | 16.2%) account for the highest median family income in Covington with $87,992 per family, while 2-person families (1,141 | 49.6%) have the highest median income of $37,570 per family member.
| Income Bracket | # Families | Median Income |
| 2-Person Families | 1,141 (49.6%) | $75,140 |
| 3-Person Families | 645 (28.1%) | $37,519 |
| 4-Person Families | 373 (16.2%) | $87,992 |
| 5-Person Families | 122 (5.3%) | $0 |
| 6-Person Families | 17 (0.7%) | $0 |
| 7+ Person Families | 0 (0.0%) | $0 |
| Total | 2,298 (100.0%) | $46,201 |
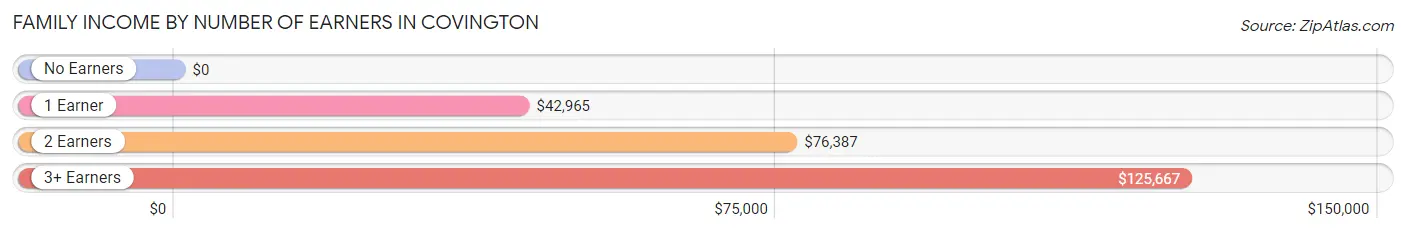
Family Income by Number of Earners in Covington
| Number of Earners | # Families | Median Income |
| No Earners | 430 (18.7%) | $0 |
| 1 Earner | 1,078 (46.9%) | $42,965 |
| 2 Earners | 678 (29.5%) | $76,387 |
| 3+ Earners | 112 (4.9%) | $125,667 |
| Total | 2,298 (100.0%) | $46,201 |
Household Income in Covington
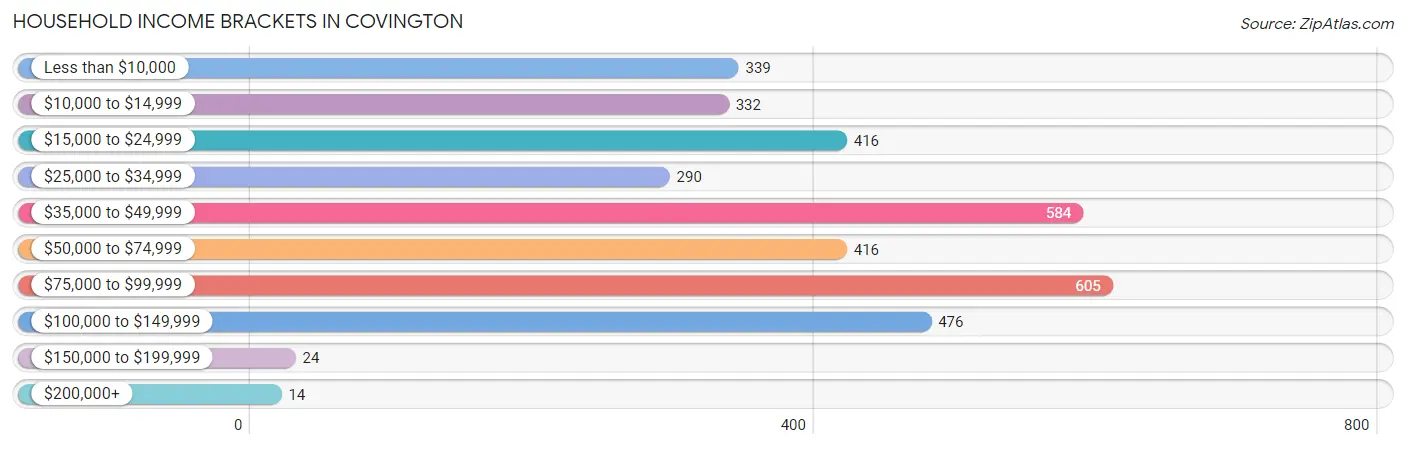
Household Income Brackets in Covington
With 605 households falling in the category, the $75,000 to $99,999 income range is the most frequent in Covington, accounting for 17.3% of all households. In contrast, only 14 households (0.4%) fall into the $200,000+ income bracket, making it the least populous group.
| Income Bracket | # Households | % Households |
| Less than $10,000 | 339 | 9.7% |
| $10,000 to $14,999 | 332 | 9.5% |
| $15,000 to $24,999 | 416 | 11.9% |
| $25,000 to $34,999 | 290 | 8.3% |
| $35,000 to $49,999 | 584 | 16.7% |
| $50,000 to $74,999 | 416 | 11.9% |
| $75,000 to $99,999 | 605 | 17.3% |
| $100,000 to $149,999 | 476 | 13.6% |
| $150,000 to $199,999 | 24 | 0.7% |
| $200,000+ | 14 | 0.4% |
Household Income by Householder Age in Covington
The median household income in Covington is $44,384, with the highest median household income of $68,171 found in the 45 to 64 years age bracket for the primary householder. A total of 1,204 households (34.4%) fall into this category. Meanwhile, the 25 to 44 years age bracket for the primary householder has the lowest median household income of $34,451, with 1,044 households (29.8%) in this group.
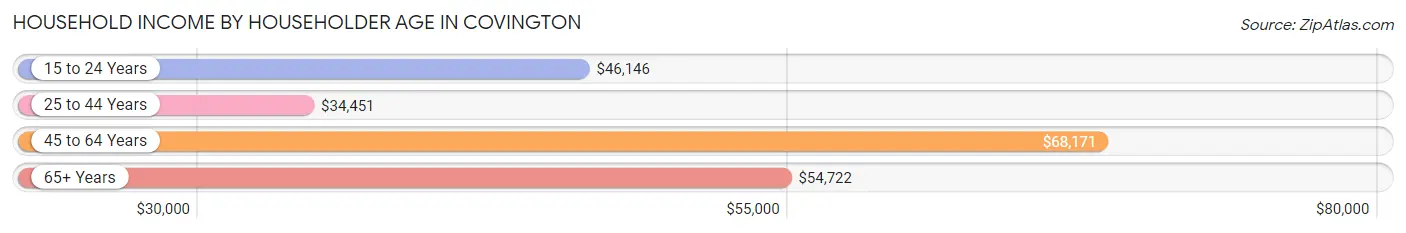
| Income Bracket | # Households | Median Income |
| 15 to 24 Years | 187 (5.3%) | $46,146 |
| 25 to 44 Years | 1,044 (29.8%) | $34,451 |
| 45 to 64 Years | 1,204 (34.4%) | $68,171 |
| 65+ Years | 1,064 (30.4%) | $54,722 |
| Total | 3,499 (100.0%) | $44,384 |
Poverty in Covington
Income Below Poverty by Sex and Age in Covington
With 19.4% poverty level for males and 26.8% for females among the residents of Covington, under 5 year old males and 6 to 11 year old females are the most vulnerable to poverty, with 233 males (96.7%) and 217 females (59.0%) in their respective age groups living below the poverty level.
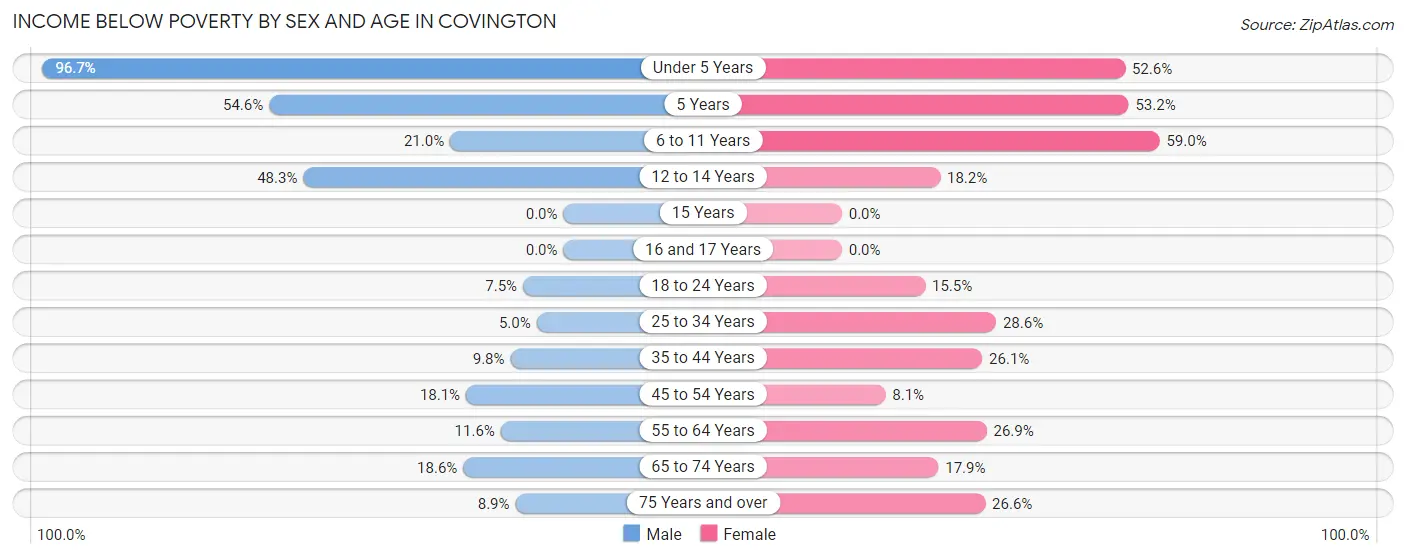
| Age Bracket | Male | Female |
| Under 5 Years | 233 (96.7%) | 195 (52.6%) |
| 5 Years | 71 (54.6%) | 58 (53.2%) |
| 6 to 11 Years | 113 (21.0%) | 217 (59.0%) |
| 12 to 14 Years | 14 (48.3%) | 27 (18.2%) |
| 15 Years | 0 (0.0%) | 0 (0.0%) |
| 16 and 17 Years | 0 (0.0%) | 0 (0.0%) |
| 18 to 24 Years | 33 (7.5%) | 53 (15.4%) |
| 25 to 34 Years | 27 (5.0%) | 182 (28.6%) |
| 35 to 44 Years | 40 (9.8%) | 87 (26.1%) |
| 45 to 54 Years | 66 (18.1%) | 45 (8.1%) |
| 55 to 64 Years | 56 (11.6%) | 151 (26.9%) |
| 65 to 74 Years | 53 (18.6%) | 84 (17.9%) |
| 75 Years and over | 23 (8.9%) | 99 (26.6%) |
| Total | 729 (19.4%) | 1,198 (26.8%) |
Income Above Poverty by Sex and Age in Covington
According to the poverty statistics in Covington, males aged 15 years and females aged 15 years are the age groups that are most secure financially, with 100.0% of males and 100.0% of females in these age groups living above the poverty line.
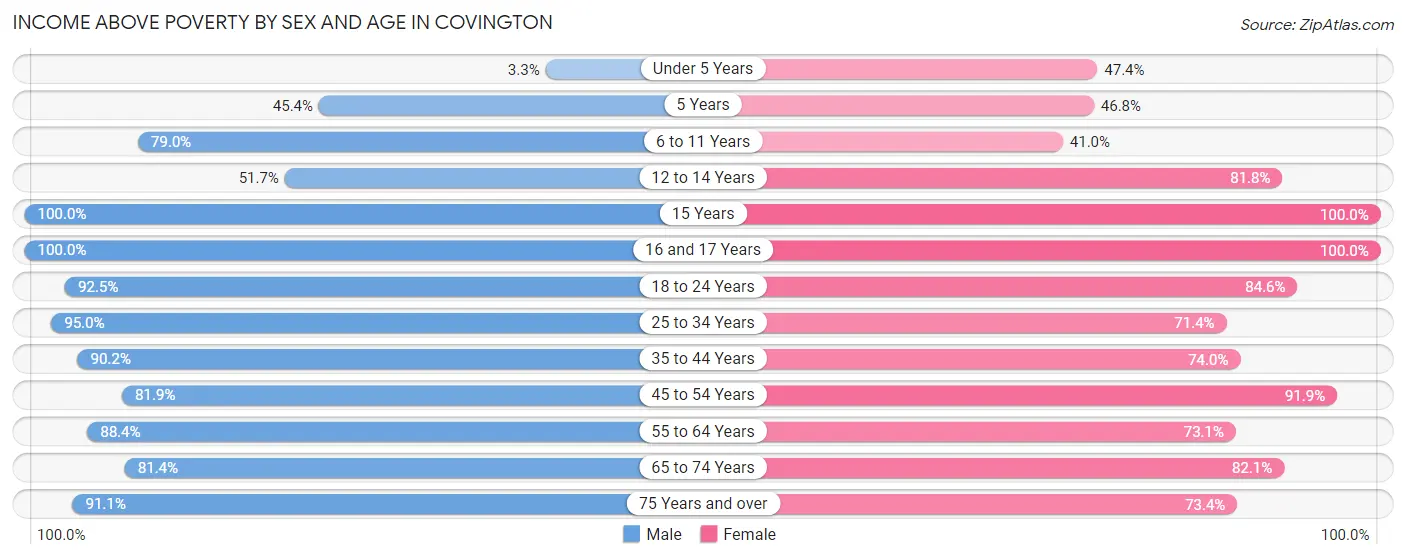
| Age Bracket | Male | Female |
| Under 5 Years | 8 (3.3%) | 176 (47.4%) |
| 5 Years | 59 (45.4%) | 51 (46.8%) |
| 6 to 11 Years | 424 (79.0%) | 151 (41.0%) |
| 12 to 14 Years | 15 (51.7%) | 121 (81.8%) |
| 15 Years | 3 (100.0%) | 85 (100.0%) |
| 16 and 17 Years | 49 (100.0%) | 125 (100.0%) |
| 18 to 24 Years | 407 (92.5%) | 290 (84.6%) |
| 25 to 34 Years | 516 (95.0%) | 454 (71.4%) |
| 35 to 44 Years | 367 (90.2%) | 247 (74.0%) |
| 45 to 54 Years | 299 (81.9%) | 512 (91.9%) |
| 55 to 64 Years | 425 (88.4%) | 411 (73.1%) |
| 65 to 74 Years | 232 (81.4%) | 385 (82.1%) |
| 75 Years and over | 235 (91.1%) | 273 (73.4%) |
| Total | 3,039 (80.6%) | 3,281 (73.3%) |
Income Below Poverty Among Married-Couple Families in Covington
The poverty statistics for married-couple families in Covington show that 5.8% or 73 of the total 1,261 families live below the poverty line. Families with 3 or 4 children have the highest poverty rate of 18.6%, comprising of 11 families. On the other hand, families with 1 or 2 children have the lowest poverty rate of 0.0%, which includes 0 families.
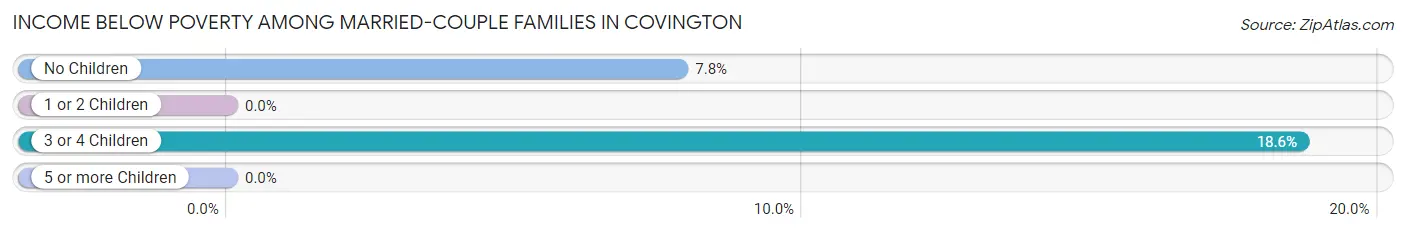
| Children | Above Poverty | Below Poverty |
| No Children | 729 (92.2%) | 62 (7.8%) |
| 1 or 2 Children | 411 (100.0%) | 0 (0.0%) |
| 3 or 4 Children | 48 (81.4%) | 11 (18.6%) |
| 5 or more Children | 0 (0.0%) | 0 (0.0%) |
| Total | 1,188 (94.2%) | 73 (5.8%) |
Income Below Poverty Among Single-Parent Households in Covington
According to the poverty data in Covington, 58.3% or 77 single-father households and 35.8% or 324 single-mother households are living below the poverty line. Among single-father households, those with 1 or 2 children have the highest poverty rate, with 53 households (81.5%) experiencing poverty. Likewise, among single-mother households, those with 3 or 4 children have the highest poverty rate, with 95 households (84.8%) falling below the poverty line.
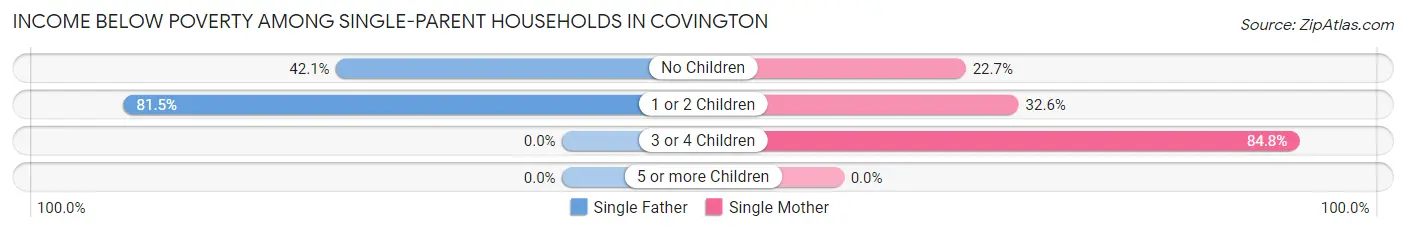
| Children | Single Father | Single Mother |
| No Children | 24 (42.1%) | 68 (22.7%) |
| 1 or 2 Children | 53 (81.5%) | 161 (32.6%) |
| 3 or 4 Children | 0 (0.0%) | 95 (84.8%) |
| 5 or more Children | 0 (0.0%) | 0 (0.0%) |
| Total | 77 (58.3%) | 324 (35.8%) |
Income Below Poverty Among Married-Couple vs Single-Parent Households in Covington
The poverty data for Covington shows that 73 of the married-couple family households (5.8%) and 401 of the single-parent households (38.7%) are living below the poverty level. Within the married-couple family households, those with 3 or 4 children have the highest poverty rate, with 11 households (18.6%) falling below the poverty line. Among the single-parent households, those with 3 or 4 children have the highest poverty rate, with 95 household (77.9%) living below poverty.
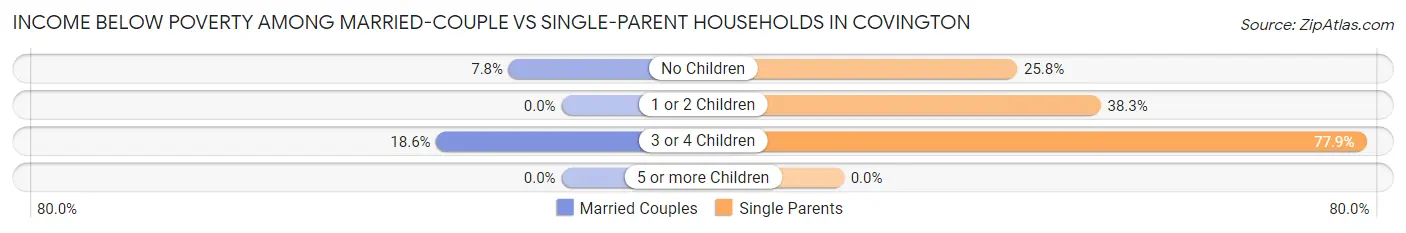
| Children | Married-Couple Families | Single-Parent Households |
| No Children | 62 (7.8%) | 92 (25.8%) |
| 1 or 2 Children | 0 (0.0%) | 214 (38.3%) |
| 3 or 4 Children | 11 (18.6%) | 95 (77.9%) |
| 5 or more Children | 0 (0.0%) | 0 (0.0%) |
| Total | 73 (5.8%) | 401 (38.7%) |
Race in Covington
The most populous races in Covington are Black / African American (4,689 | 54.2%), White / Caucasian (3,730 | 43.1%), and Two or more Races (200 | 2.3%).
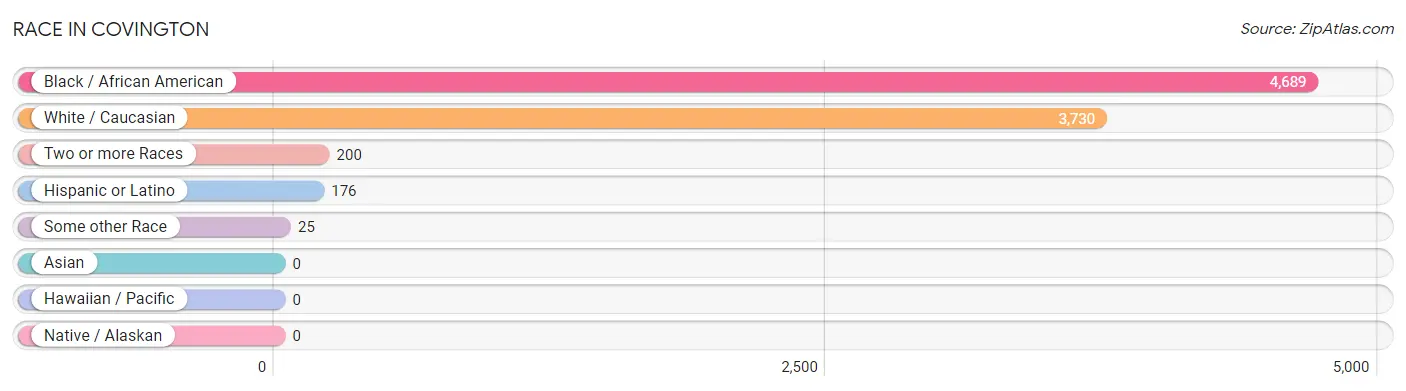
| Race | # Population | % Population |
| Asian | 0 | 0.0% |
| Black / African American | 4,689 | 54.2% |
| Hawaiian / Pacific | 0 | 0.0% |
| Hispanic or Latino | 176 | 2.0% |
| Native / Alaskan | 0 | 0.0% |
| White / Caucasian | 3,730 | 43.1% |
| Two or more Races | 200 | 2.3% |
| Some other Race | 25 | 0.3% |
| Total | 8,644 | 100.0% |
Ancestry in Covington
The most populous ancestries reported in Covington are American (1,037 | 12.0%), English (450 | 5.2%), French (351 | 4.1%), German (307 | 3.5%), and Irish (304 | 3.5%), together accounting for 28.3% of all Covington residents.
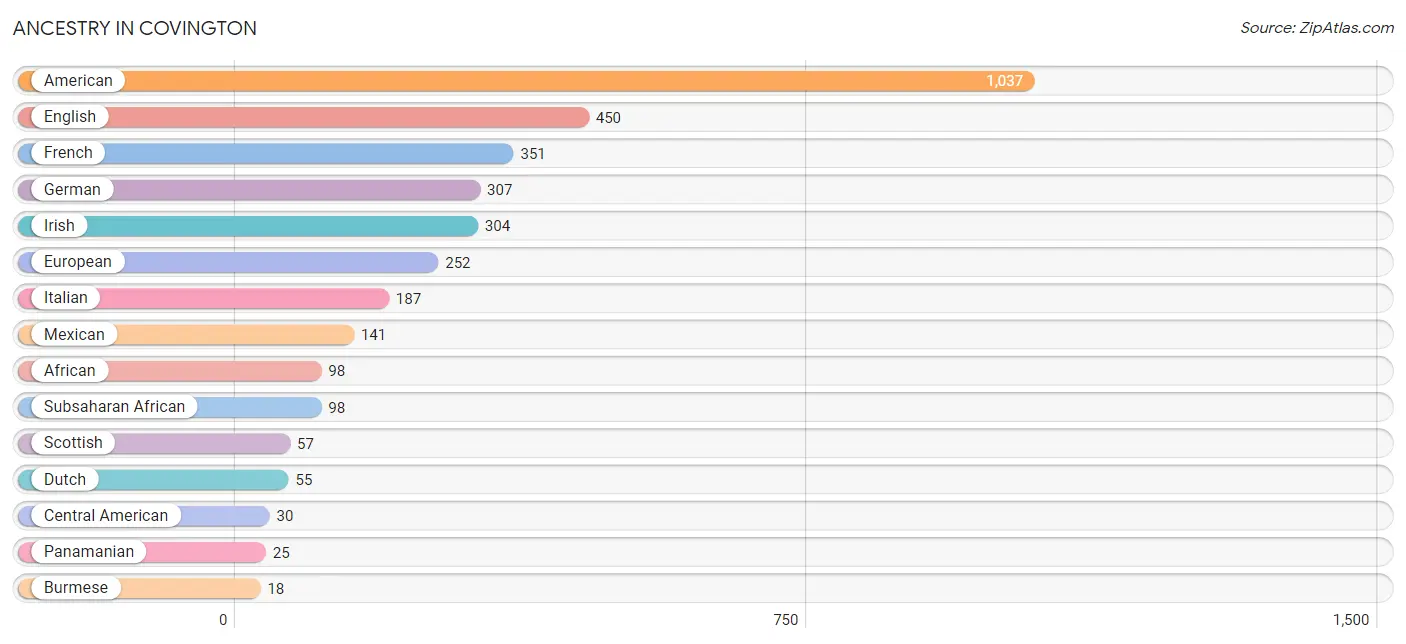
| Ancestry | # Population | % Population |
| African | 98 | 1.1% |
| American | 1,037 | 12.0% |
| Arab | 7 | 0.1% |
| Blackfeet | 5 | 0.1% |
| British | 7 | 0.1% |
| Burmese | 18 | 0.2% |
| Central American | 30 | 0.4% |
| Cherokee | 14 | 0.2% |
| Dutch | 55 | 0.6% |
| English | 450 | 5.2% |
| European | 252 | 2.9% |
| French | 351 | 4.1% |
| French Canadian | 9 | 0.1% |
| German | 307 | 3.5% |
| Honduran | 5 | 0.1% |
| Irish | 304 | 3.5% |
| Italian | 187 | 2.2% |
| Lebanese | 7 | 0.1% |
| Mexican | 141 | 1.6% |
| Panamanian | 25 | 0.3% |
| Scotch-Irish | 17 | 0.2% |
| Scottish | 57 | 0.7% |
| Subsaharan African | 98 | 1.1% |
| Welsh | 7 | 0.1% | View All 24 Rows |
Immigrants in Covington
The most numerous immigrant groups reported in Covington came from Central America (38 | 0.4%), Latin America (38 | 0.4%), Panama (25 | 0.3%), Mexico (8 | 0.1%), and Honduras (5 | 0.1%), together accounting for 1.3% of all Covington residents.
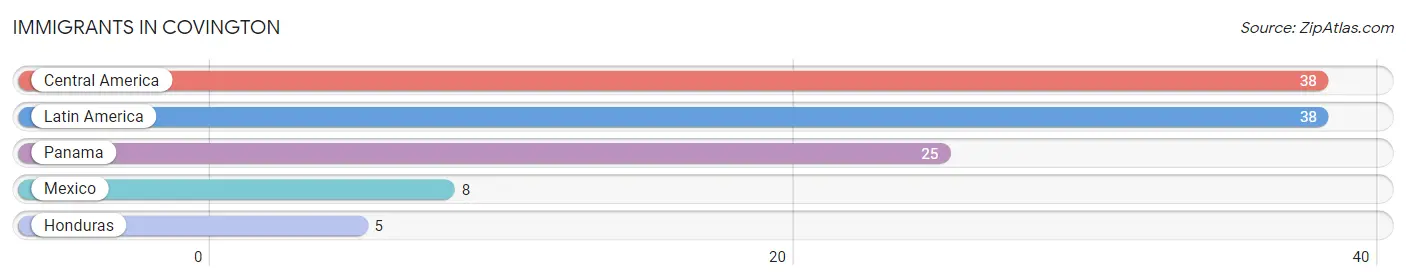
| Immigration Origin | # Population | % Population |
| Central America | 38 | 0.4% |
| Honduras | 5 | 0.1% |
| Latin America | 38 | 0.4% |
| Mexico | 8 | 0.1% |
| Panama | 25 | 0.3% | View All 5 Rows |
Sex and Age in Covington
Sex and Age in Covington
The most populous age groups in Covington are 5 to 9 Years (419 | 10.4%) for men and 50 to 54 Years (431 | 9.3%) for women.
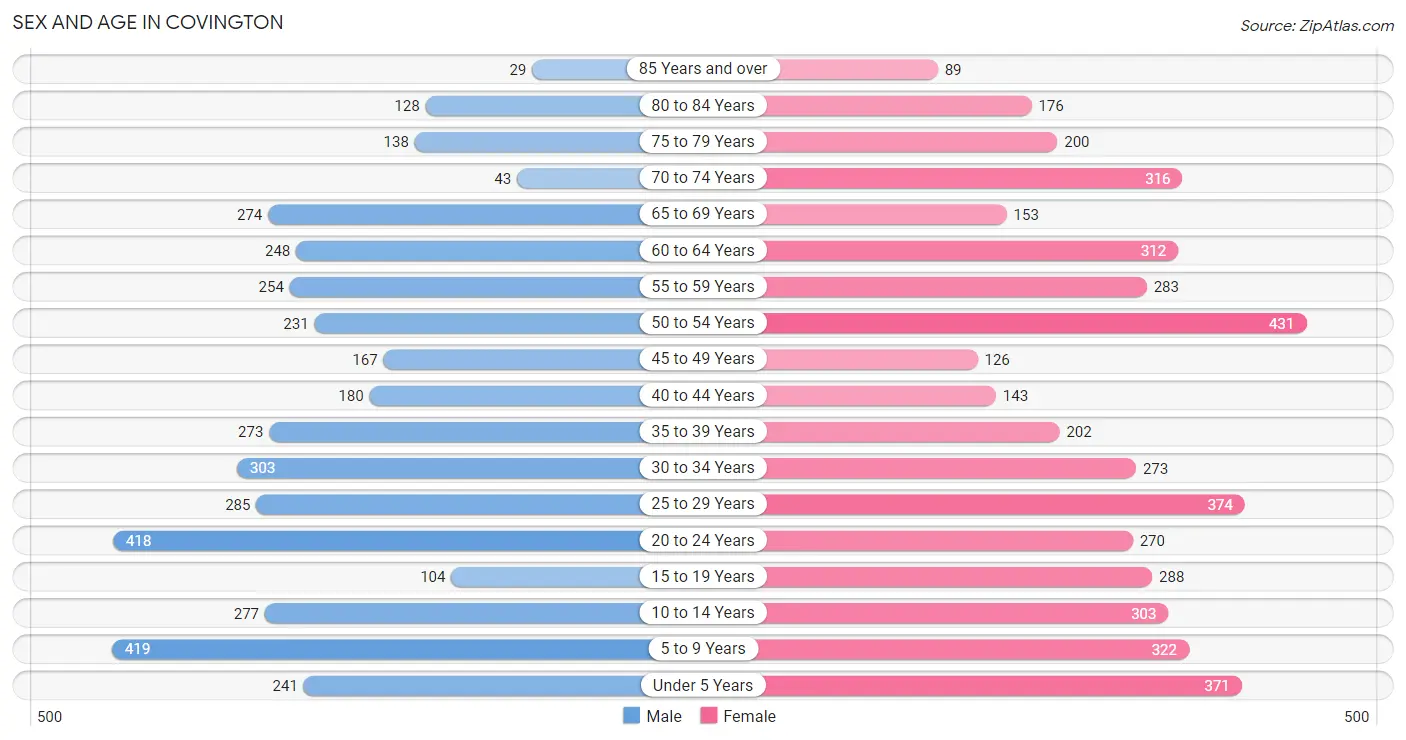
| Age Bracket | Male | Female |
| Under 5 Years | 241 (6.0%) | 371 (8.0%) |
| 5 to 9 Years | 419 (10.4%) | 322 (7.0%) |
| 10 to 14 Years | 277 (6.9%) | 303 (6.5%) |
| 15 to 19 Years | 104 (2.6%) | 288 (6.2%) |
| 20 to 24 Years | 418 (10.4%) | 270 (5.8%) |
| 25 to 29 Years | 285 (7.1%) | 374 (8.1%) |
| 30 to 34 Years | 303 (7.5%) | 273 (5.9%) |
| 35 to 39 Years | 273 (6.8%) | 202 (4.4%) |
| 40 to 44 Years | 180 (4.5%) | 143 (3.1%) |
| 45 to 49 Years | 167 (4.2%) | 126 (2.7%) |
| 50 to 54 Years | 231 (5.8%) | 431 (9.3%) |
| 55 to 59 Years | 254 (6.3%) | 283 (6.1%) |
| 60 to 64 Years | 248 (6.2%) | 312 (6.7%) |
| 65 to 69 Years | 274 (6.8%) | 153 (3.3%) |
| 70 to 74 Years | 43 (1.1%) | 316 (6.8%) |
| 75 to 79 Years | 138 (3.4%) | 200 (4.3%) |
| 80 to 84 Years | 128 (3.2%) | 176 (3.8%) |
| 85 Years and over | 29 (0.7%) | 89 (1.9%) |
| Total | 4,012 (100.0%) | 4,632 (100.0%) |
Families and Households in Covington
Median Family Size in Covington
The median family size in Covington is 2.96 persons per family, with single female/mother families (905 | 39.4%) accounting for the largest median family size of 3.16 persons per family. On the other hand, single male/father families (132 | 5.7%) represent the smallest median family size with 2.41 persons per family.
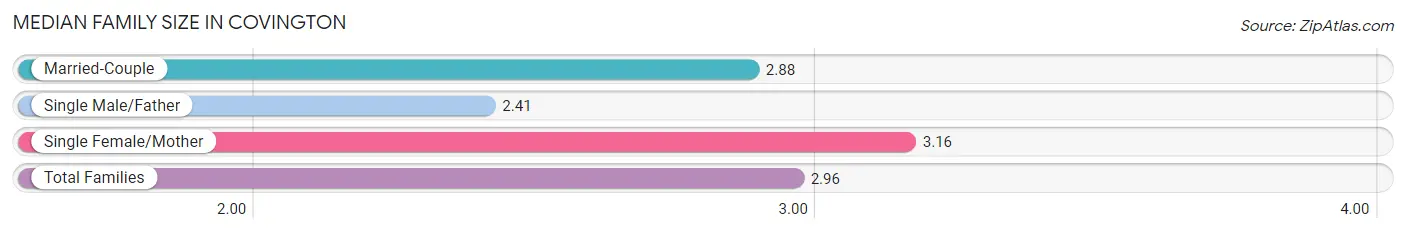
| Family Type | # Families | Family Size |
| Married-Couple | 1,261 (54.9%) | 2.88 |
| Single Male/Father | 132 (5.7%) | 2.41 |
| Single Female/Mother | 905 (39.4%) | 3.16 |
| Total Families | 2,298 (100.0%) | 2.96 |
Median Household Size in Covington
The median household size in Covington is 2.36 persons per household, with single male/father households (132 | 3.8%) accounting for the largest median household size of 3.2 persons per household. non-family households (1,201 | 34.3%) represent the smallest median household size with 1.09 persons per household.
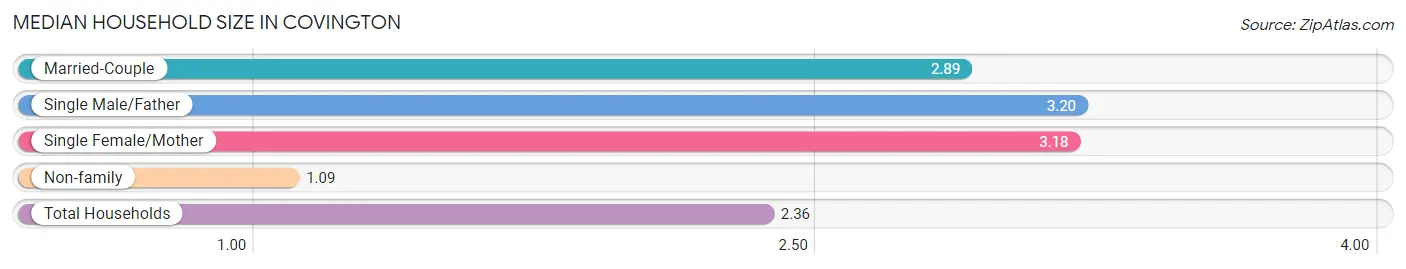
| Household Type | # Households | Household Size |
| Married-Couple | 1,261 (36.0%) | 2.89 |
| Single Male/Father | 132 (3.8%) | 3.20 |
| Single Female/Mother | 905 (25.9%) | 3.18 |
| Non-family | 1,201 (34.3%) | 1.09 |
| Total Households | 3,499 (100.0%) | 2.36 |
Household Size by Marriage Status in Covington
Out of a total of 3,499 households in Covington, 2,298 (65.7%) are family households, while 1,201 (34.3%) are nonfamily households. The most numerous type of family households are 2-person households, comprising 1,097, and the most common type of nonfamily households are 1-person households, comprising 1,110.
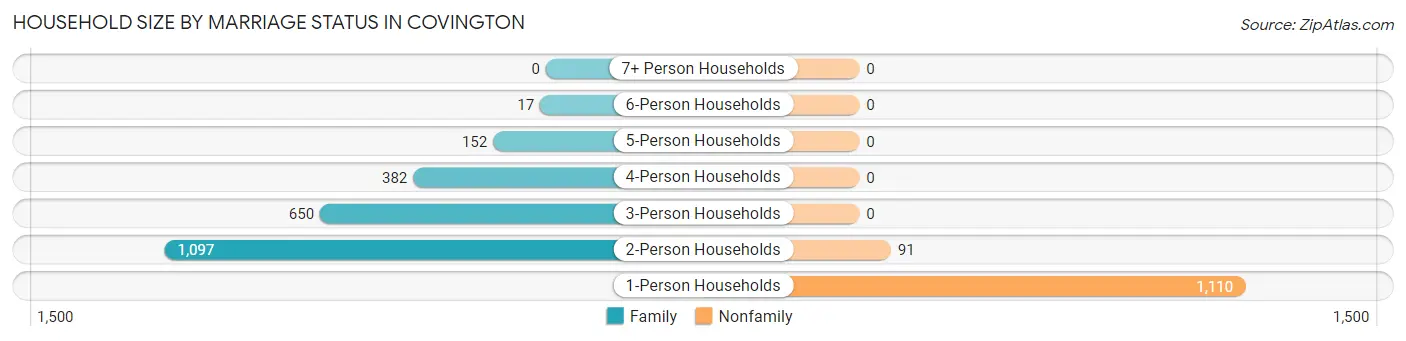
| Household Size | Family Households | Nonfamily Households |
| 1-Person Households | - | 1,110 (31.7%) |
| 2-Person Households | 1,097 (31.4%) | 91 (2.6%) |
| 3-Person Households | 650 (18.6%) | 0 (0.0%) |
| 4-Person Households | 382 (10.9%) | 0 (0.0%) |
| 5-Person Households | 152 (4.3%) | 0 (0.0%) |
| 6-Person Households | 17 (0.5%) | 0 (0.0%) |
| 7+ Person Households | 0 (0.0%) | 0 (0.0%) |
| Total | 2,298 (65.7%) | 1,201 (34.3%) |
Female Fertility in Covington
Fertility by Age in Covington
Average fertility rate in Covington is 133.0 births per 1,000 women. Women in the age bracket of 20 to 34 years have the highest fertility rate with 206.0 births per 1,000 women. Women in the age bracket of 20 to 34 years acount for 84.8% of all women with births.
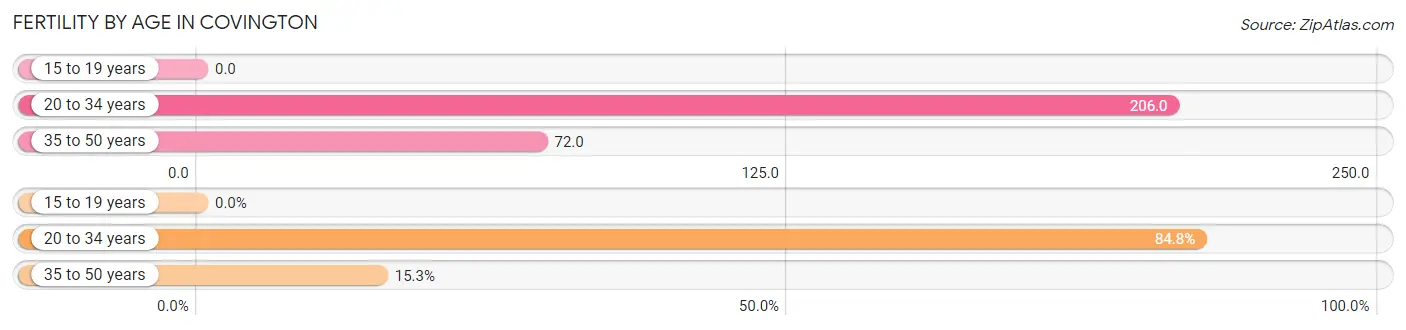
| Age Bracket | Women with Births | Births / 1,000 Women |
| 15 to 19 years | 0 (0.0%) | 0.0 |
| 20 to 34 years | 189 (84.8%) | 206.0 |
| 35 to 50 years | 34 (15.2%) | 72.0 |
| Total | 223 (100.0%) | 133.0 |
Fertility by Age by Marriage Status in Covington
54.3% of women with births (223) in Covington are married. The highest percentage of unmarried women with births falls into 20 to 34 years age bracket with 48.1% of them unmarried at the time of birth, while the lowest percentage of unmarried women with births belong to 35 to 50 years age bracket with 32.4% of them unmarried.
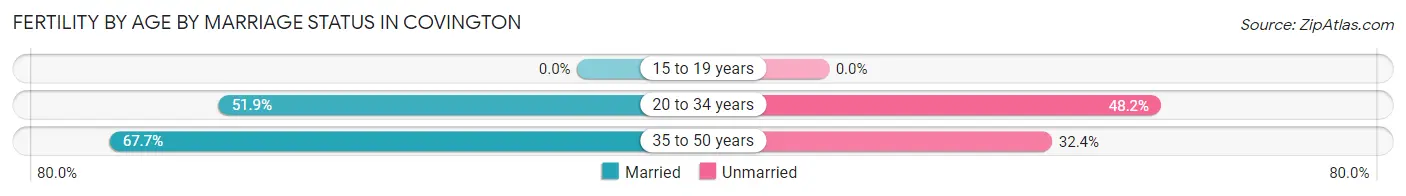
| Age Bracket | Married | Unmarried |
| 15 to 19 years | 0 (0.0%) | 0 (0.0%) |
| 20 to 34 years | 98 (51.8%) | 91 (48.1%) |
| 35 to 50 years | 23 (67.6%) | 11 (32.4%) |
| Total | 121 (54.3%) | 102 (45.7%) |
Fertility by Education in Covington
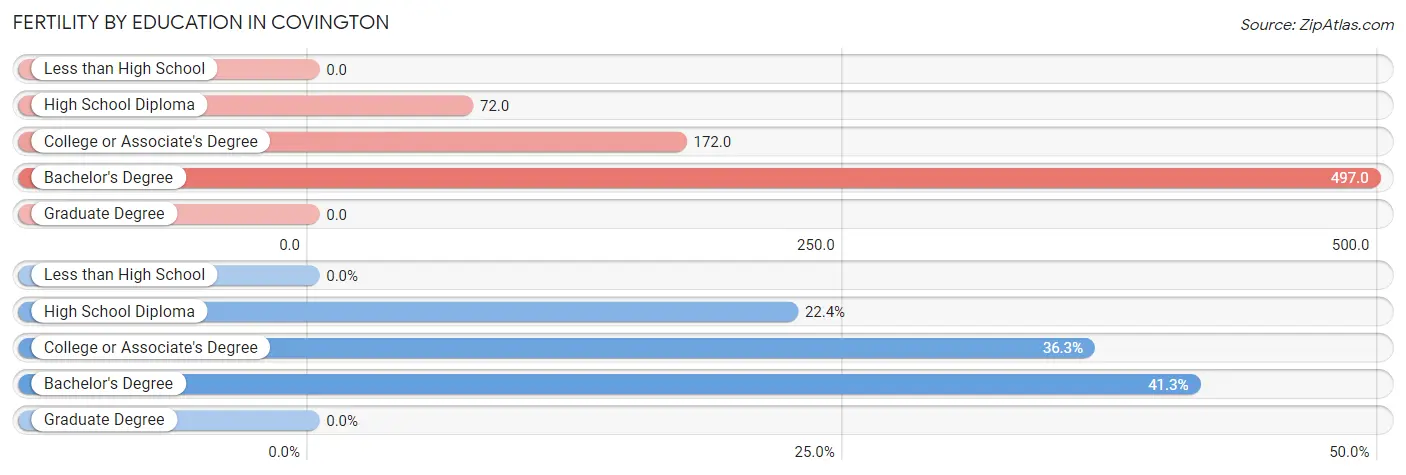
| Educational Attainment | Women with Births | Births / 1,000 Women |
| Less than High School | 0 (0.0%) | 0.0 |
| High School Diploma | 50 (22.4%) | 72.0 |
| College or Associate's Degree | 81 (36.3%) | 172.0 |
| Bachelor's Degree | 92 (41.3%) | 497.0 |
| Graduate Degree | 0 (0.0%) | 0.0 |
| Total | 223 (100.0%) | 133.0 |
Fertility by Education by Marriage Status in Covington
45.7% of women with births in Covington are unmarried. Women with the educational attainment of bachelor's degree are most likely to be married with 100.0% of them married at childbirth, while women with the educational attainment of college or associate's degree are least likely to be married with 100.0% of them unmarried at childbirth.
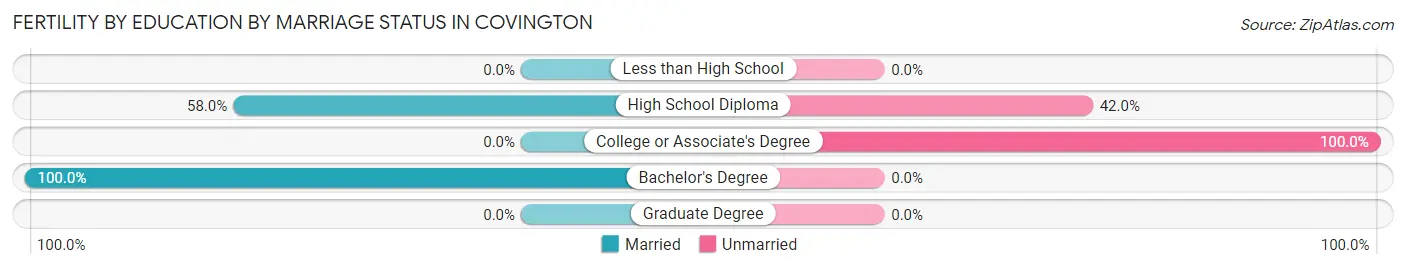
| Educational Attainment | Married | Unmarried |
| Less than High School | 0 (0.0%) | 0 (0.0%) |
| High School Diploma | 29 (58.0%) | 21 (42.0%) |
| College or Associate's Degree | 0 (0.0%) | 81 (100.0%) |
| Bachelor's Degree | 92 (100.0%) | 0 (0.0%) |
| Graduate Degree | 0 (0.0%) | 0 (0.0%) |
| Total | 121 (54.3%) | 102 (45.7%) |
Employment Characteristics in Covington
Employment by Class of Employer in Covington
Among the 3,382 employed individuals in Covington, private company employees (2,212 | 65.4%), state government employees (487 | 14.4%), and local government employees (232 | 6.9%) make up the most common classes of employment.
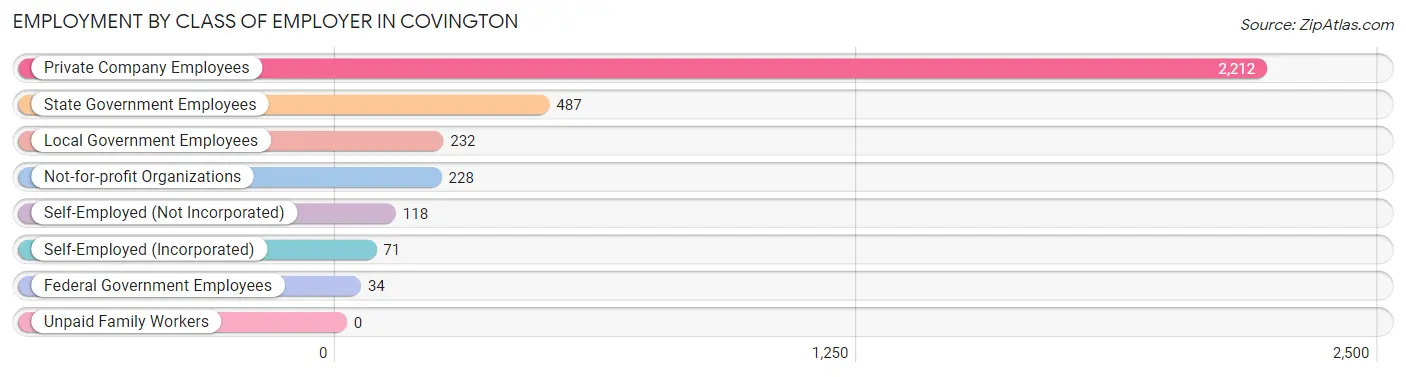
| Employer Class | # Employees | % Employees |
| Private Company Employees | 2,212 | 65.4% |
| Self-Employed (Incorporated) | 71 | 2.1% |
| Self-Employed (Not Incorporated) | 118 | 3.5% |
| Not-for-profit Organizations | 228 | 6.7% |
| Local Government Employees | 232 | 6.9% |
| State Government Employees | 487 | 14.4% |
| Federal Government Employees | 34 | 1.0% |
| Unpaid Family Workers | 0 | 0.0% |
| Total | 3,382 | 100.0% |
Employment Status by Age in Covington
According to the labor force statistics for Covington, out of the total population over 16 years of age (6,623), 55.1% or 3,649 individuals are in the labor force, with 5.5% or 201 of them unemployed. The age group with the highest labor force participation rate is 20 to 24 years, with 81.3% or 559 individuals in the labor force. Within the labor force, the 20 to 24 years age range has the highest percentage of unemployed individuals, with 10.4% or 58 of them being unemployed.
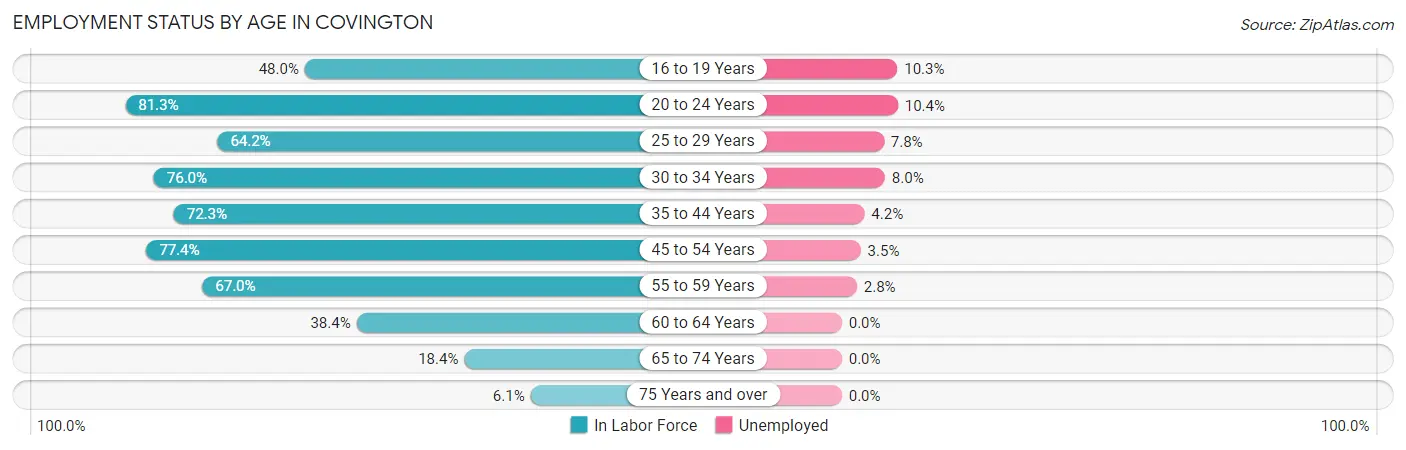
| Age Bracket | In Labor Force | Unemployed |
| 16 to 19 Years | 146 (48.0%) | 15 (10.3%) |
| 20 to 24 Years | 559 (81.3%) | 58 (10.4%) |
| 25 to 29 Years | 423 (64.2%) | 33 (7.8%) |
| 30 to 34 Years | 438 (76.0%) | 35 (8.0%) |
| 35 to 44 Years | 577 (72.3%) | 24 (4.2%) |
| 45 to 54 Years | 739 (77.4%) | 26 (3.5%) |
| 55 to 59 Years | 360 (67.0%) | 10 (2.8%) |
| 60 to 64 Years | 215 (38.4%) | 0 (0.0%) |
| 65 to 74 Years | 145 (18.4%) | 0 (0.0%) |
| 75 Years and over | 46 (6.1%) | 0 (0.0%) |
| Total | 3,649 (55.1%) | 201 (5.5%) |
Employment Status by Educational Attainment in Covington
According to labor force statistics for Covington, 67.4% of individuals (2,753) out of the total population between 25 and 64 years of age (4,085) are in the labor force, with 4.7% or 129 of them being unemployed. The group with the highest labor force participation rate are those with the educational attainment of college / associate degree, with 83.7% or 1,115 individuals in the labor force. Within the labor force, individuals with less than high school education have the highest percentage of unemployment, with 23.7% or 41 of them being unemployed.
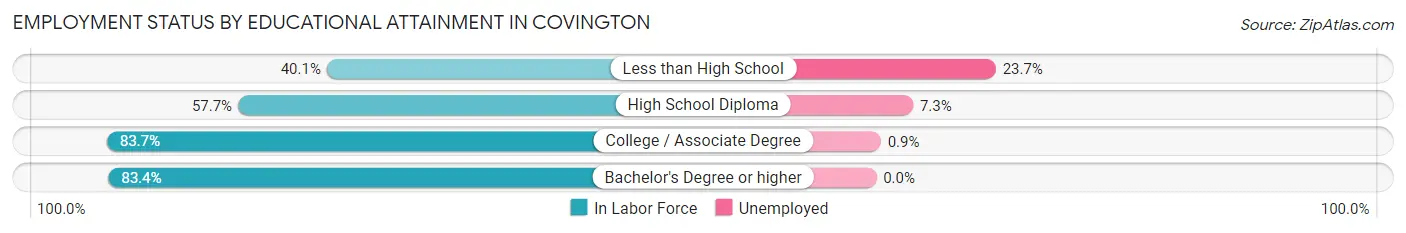
| Educational Attainment | In Labor Force | Unemployed |
| Less than High School | 173 (40.1%) | 102 (23.7%) |
| High School Diploma | 1,062 (57.7%) | 134 (7.3%) |
| College / Associate Degree | 1,115 (83.7%) | 12 (0.9%) |
| Bachelor's Degree or higher | 402 (83.4%) | 0 (0.0%) |
| Total | 2,753 (67.4%) | 192 (4.7%) |
Employment Occupations by Sex in Covington
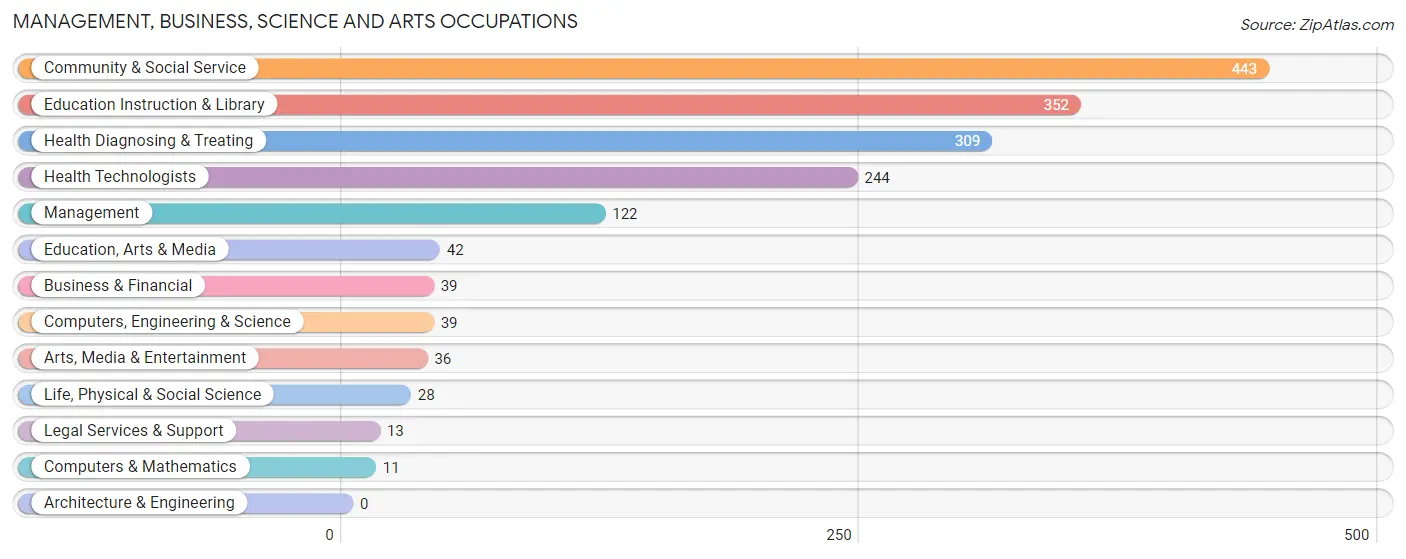
Management, Business, Science and Arts Occupations
The most common Management, Business, Science and Arts occupations in Covington are Community & Social Service (443 | 12.9%), Education Instruction & Library (352 | 10.2%), Health Diagnosing & Treating (309 | 9.0%), Health Technologists (244 | 7.1%), and Management (122 | 3.5%).
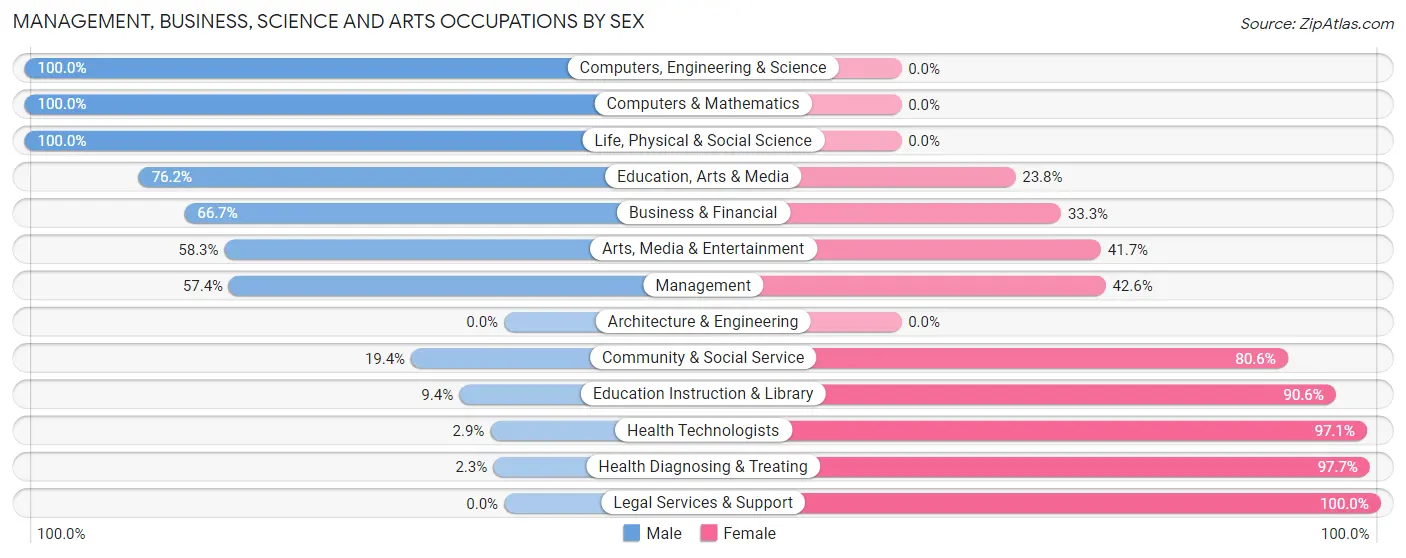
Management, Business, Science and Arts Occupations by Sex
Within the Management, Business, Science and Arts occupations in Covington, the most male-oriented occupations are Computers, Engineering & Science (100.0%), Computers & Mathematics (100.0%), and Life, Physical & Social Science (100.0%), while the most female-oriented occupations are Legal Services & Support (100.0%), Health Diagnosing & Treating (97.7%), and Health Technologists (97.1%).
| Occupation | Male | Female |
| Management | 70 (57.4%) | 52 (42.6%) |
| Business & Financial | 26 (66.7%) | 13 (33.3%) |
| Computers, Engineering & Science | 39 (100.0%) | 0 (0.0%) |
| Computers & Mathematics | 11 (100.0%) | 0 (0.0%) |
| Architecture & Engineering | 0 (0.0%) | 0 (0.0%) |
| Life, Physical & Social Science | 28 (100.0%) | 0 (0.0%) |
| Community & Social Service | 86 (19.4%) | 357 (80.6%) |
| Education, Arts & Media | 32 (76.2%) | 10 (23.8%) |
| Legal Services & Support | 0 (0.0%) | 13 (100.0%) |
| Education Instruction & Library | 33 (9.4%) | 319 (90.6%) |
| Arts, Media & Entertainment | 21 (58.3%) | 15 (41.7%) |
| Health Diagnosing & Treating | 7 (2.3%) | 302 (97.7%) |
| Health Technologists | 7 (2.9%) | 237 (97.1%) |
| Total (Category) | 228 (23.9%) | 724 (76.0%) |
| Total (Overall) | 1,624 (47.1%) | 1,823 (52.9%) |
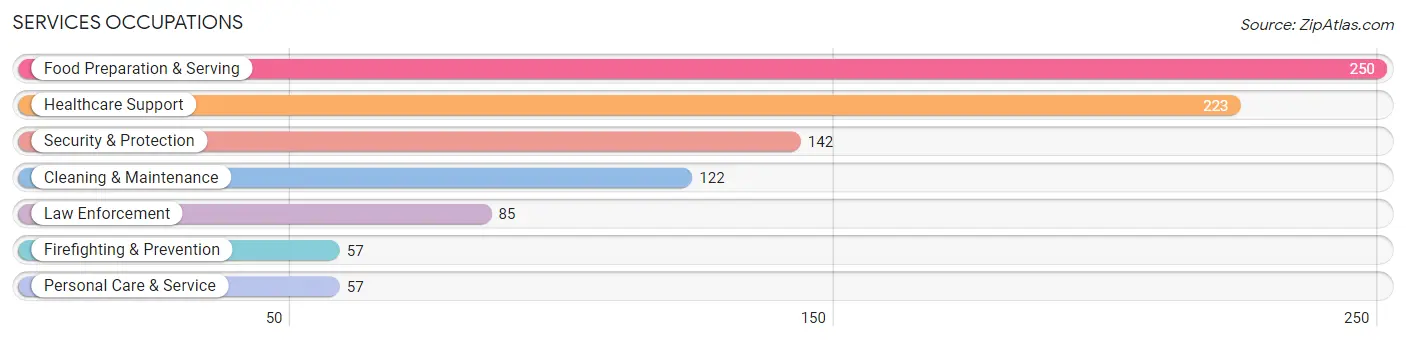
Services Occupations
The most common Services occupations in Covington are Food Preparation & Serving (250 | 7.2%), Healthcare Support (223 | 6.5%), Security & Protection (142 | 4.1%), Cleaning & Maintenance (122 | 3.5%), and Law Enforcement (85 | 2.5%).
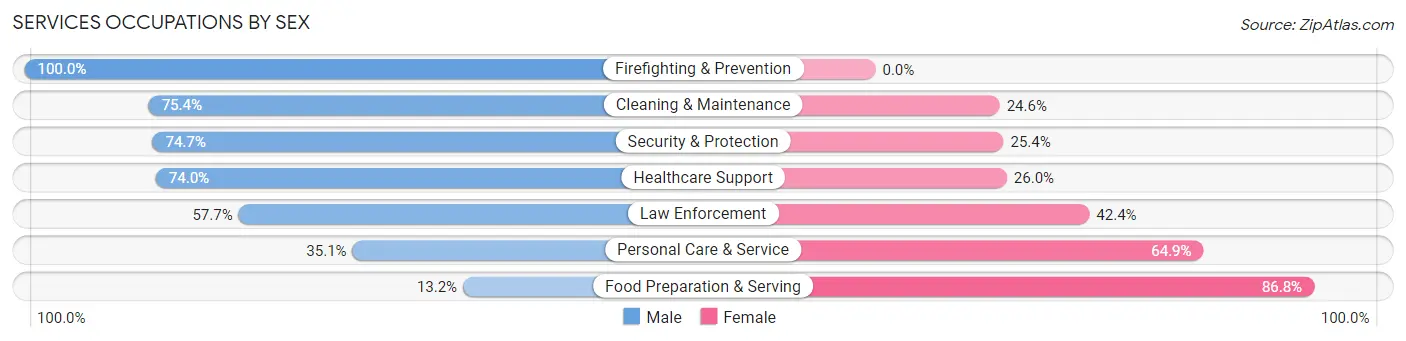
Services Occupations by Sex
Within the Services occupations in Covington, the most male-oriented occupations are Firefighting & Prevention (100.0%), Cleaning & Maintenance (75.4%), and Security & Protection (74.7%), while the most female-oriented occupations are Food Preparation & Serving (86.8%), Personal Care & Service (64.9%), and Law Enforcement (42.3%).
| Occupation | Male | Female |
| Healthcare Support | 165 (74.0%) | 58 (26.0%) |
| Security & Protection | 106 (74.7%) | 36 (25.4%) |
| Firefighting & Prevention | 57 (100.0%) | 0 (0.0%) |
| Law Enforcement | 49 (57.7%) | 36 (42.3%) |
| Food Preparation & Serving | 33 (13.2%) | 217 (86.8%) |
| Cleaning & Maintenance | 92 (75.4%) | 30 (24.6%) |
| Personal Care & Service | 20 (35.1%) | 37 (64.9%) |
| Total (Category) | 416 (52.4%) | 378 (47.6%) |
| Total (Overall) | 1,624 (47.1%) | 1,823 (52.9%) |
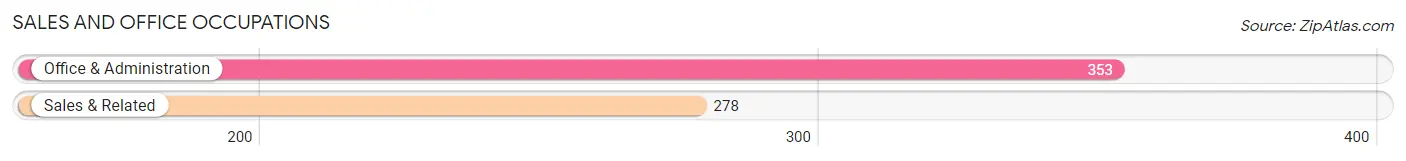
Sales and Office Occupations
The most common Sales and Office occupations in Covington are Office & Administration (353 | 10.2%), and Sales & Related (278 | 8.1%).
Sales and Office Occupations by Sex
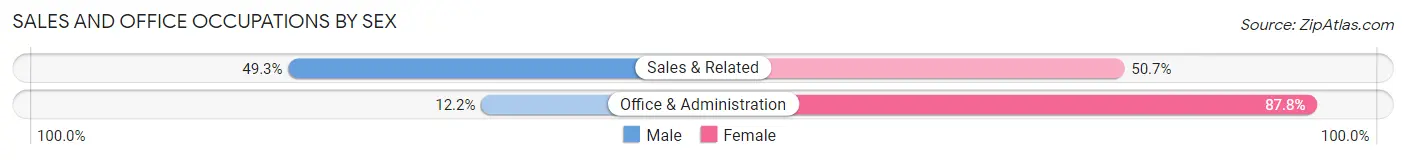
| Occupation | Male | Female |
| Sales & Related | 137 (49.3%) | 141 (50.7%) |
| Office & Administration | 43 (12.2%) | 310 (87.8%) |
| Total (Category) | 180 (28.5%) | 451 (71.5%) |
| Total (Overall) | 1,624 (47.1%) | 1,823 (52.9%) |
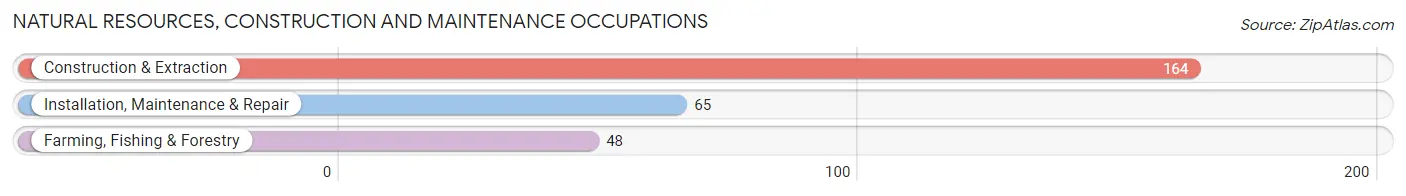
Natural Resources, Construction and Maintenance Occupations
The most common Natural Resources, Construction and Maintenance occupations in Covington are Construction & Extraction (164 | 4.8%), Installation, Maintenance & Repair (65 | 1.9%), and Farming, Fishing & Forestry (48 | 1.4%).
Natural Resources, Construction and Maintenance Occupations by Sex
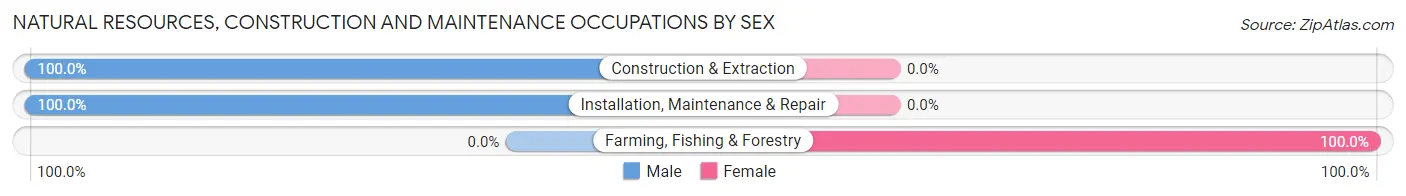
| Occupation | Male | Female |
| Farming, Fishing & Forestry | 0 (0.0%) | 48 (100.0%) |
| Construction & Extraction | 164 (100.0%) | 0 (0.0%) |
| Installation, Maintenance & Repair | 65 (100.0%) | 0 (0.0%) |
| Total (Category) | 229 (82.7%) | 48 (17.3%) |
| Total (Overall) | 1,624 (47.1%) | 1,823 (52.9%) |
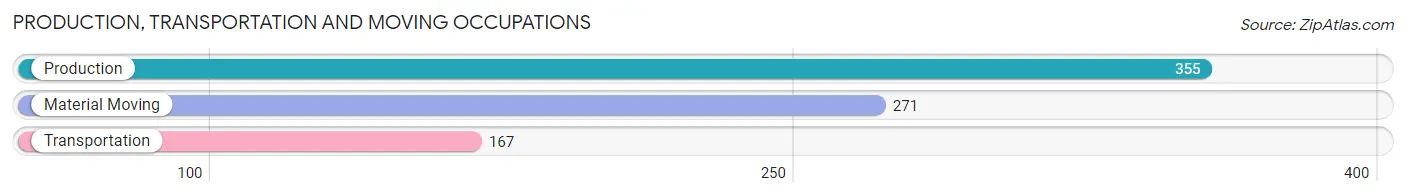
Production, Transportation and Moving Occupations
The most common Production, Transportation and Moving occupations in Covington are Production (355 | 10.3%), Material Moving (271 | 7.9%), and Transportation (167 | 4.8%).
Production, Transportation and Moving Occupations by Sex
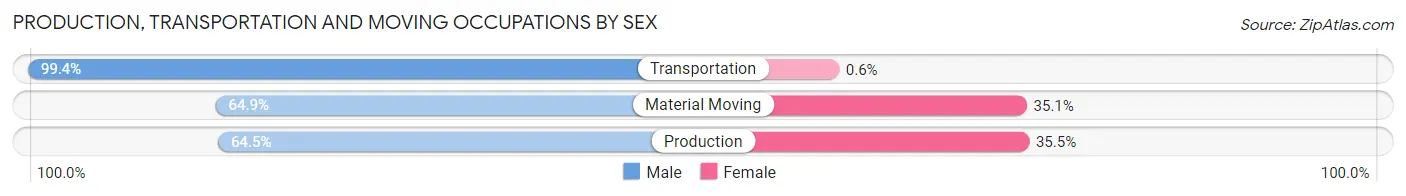
| Occupation | Male | Female |
| Production | 229 (64.5%) | 126 (35.5%) |
| Transportation | 166 (99.4%) | 1 (0.6%) |
| Material Moving | 176 (64.9%) | 95 (35.1%) |
| Total (Category) | 571 (72.0%) | 222 (28.0%) |
| Total (Overall) | 1,624 (47.1%) | 1,823 (52.9%) |
Employment Industries by Sex in Covington
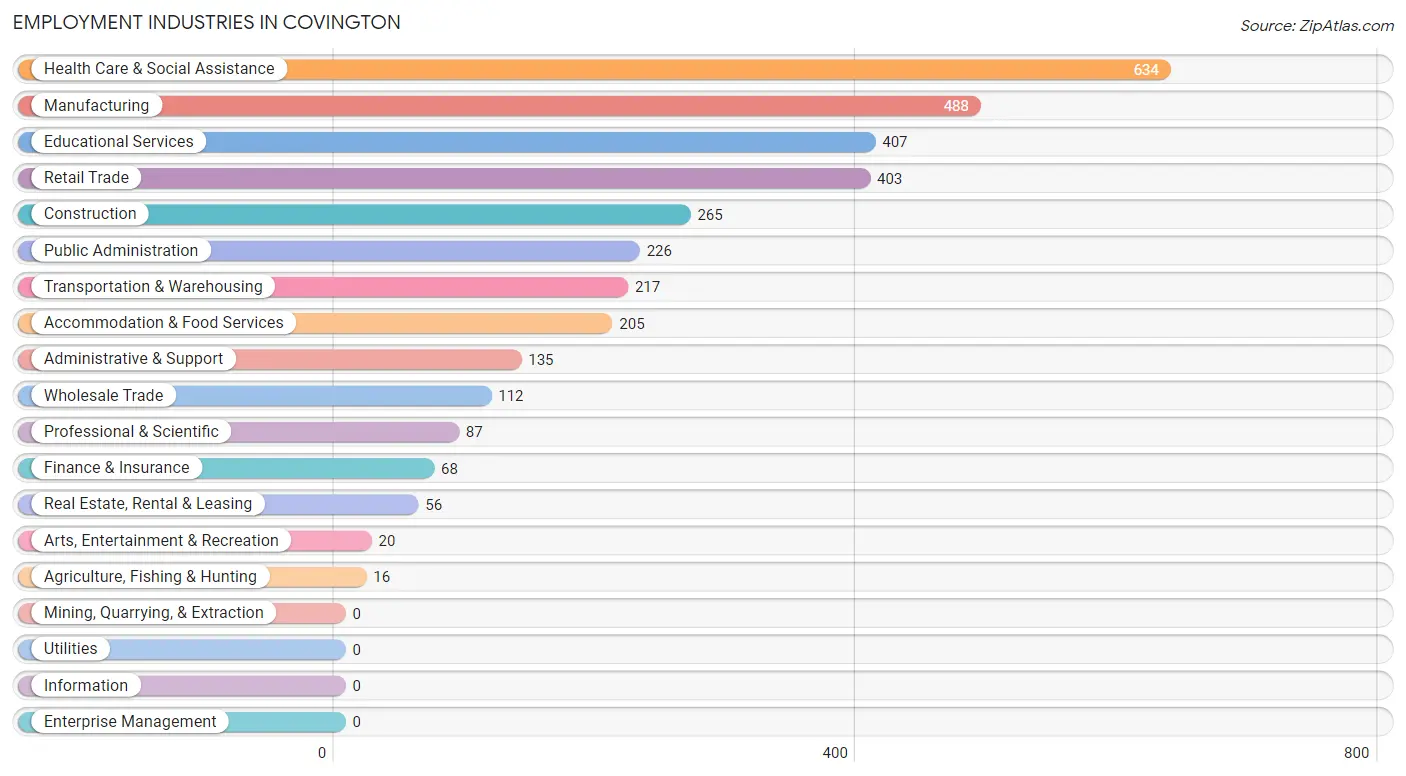
Employment Industries in Covington
The major employment industries in Covington include Health Care & Social Assistance (634 | 18.4%), Manufacturing (488 | 14.2%), Educational Services (407 | 11.8%), Retail Trade (403 | 11.7%), and Construction (265 | 7.7%).
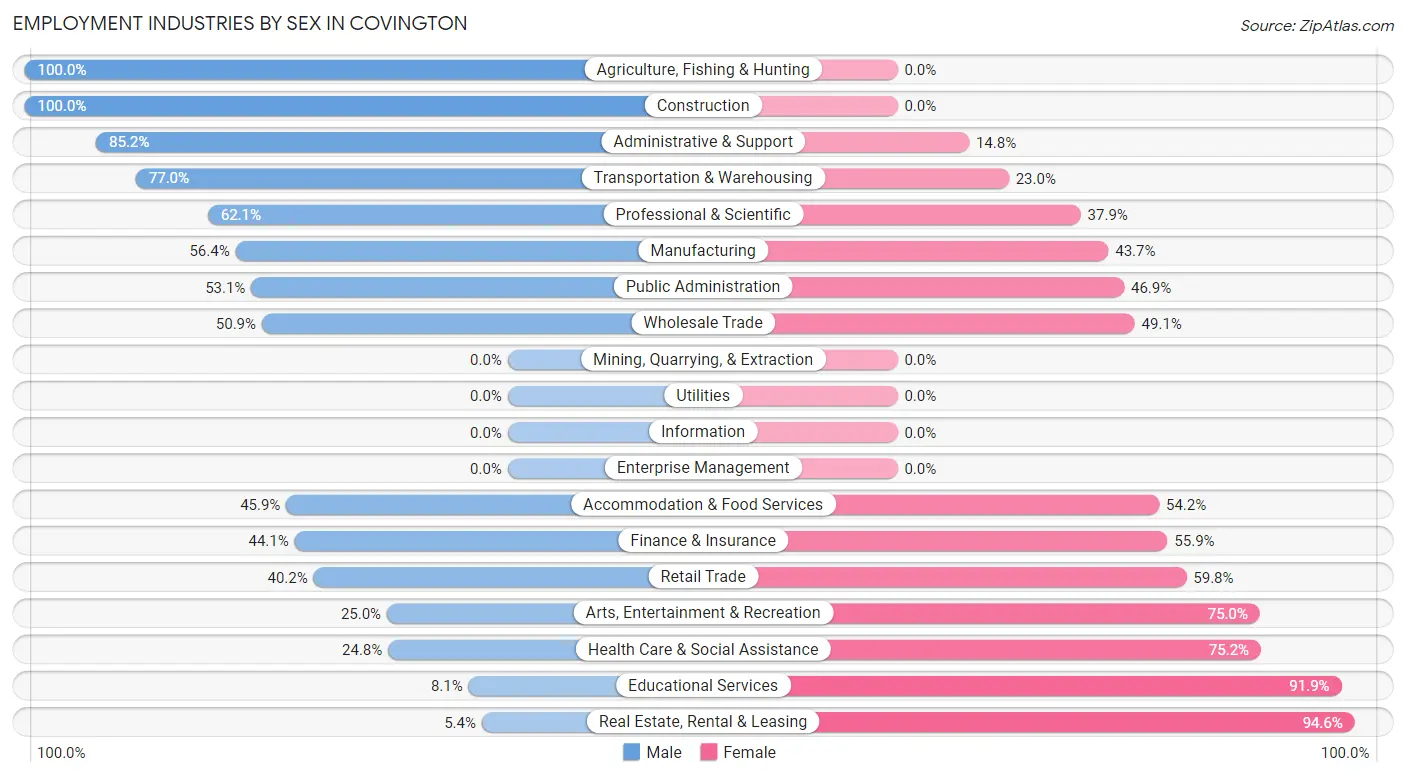
Employment Industries by Sex in Covington
The Covington industries that see more men than women are Agriculture, Fishing & Hunting (100.0%), Construction (100.0%), and Administrative & Support (85.2%), whereas the industries that tend to have a higher number of women are Real Estate, Rental & Leasing (94.6%), Educational Services (91.9%), and Health Care & Social Assistance (75.2%).
| Industry | Male | Female |
| Agriculture, Fishing & Hunting | 16 (100.0%) | 0 (0.0%) |
| Mining, Quarrying, & Extraction | 0 (0.0%) | 0 (0.0%) |
| Construction | 265 (100.0%) | 0 (0.0%) |
| Manufacturing | 275 (56.4%) | 213 (43.6%) |
| Wholesale Trade | 57 (50.9%) | 55 (49.1%) |
| Retail Trade | 162 (40.2%) | 241 (59.8%) |
| Transportation & Warehousing | 167 (77.0%) | 50 (23.0%) |
| Utilities | 0 (0.0%) | 0 (0.0%) |
| Information | 0 (0.0%) | 0 (0.0%) |
| Finance & Insurance | 30 (44.1%) | 38 (55.9%) |
| Real Estate, Rental & Leasing | 3 (5.4%) | 53 (94.6%) |
| Professional & Scientific | 54 (62.1%) | 33 (37.9%) |
| Enterprise Management | 0 (0.0%) | 0 (0.0%) |
| Administrative & Support | 115 (85.2%) | 20 (14.8%) |
| Educational Services | 33 (8.1%) | 374 (91.9%) |
| Health Care & Social Assistance | 157 (24.8%) | 477 (75.2%) |
| Arts, Entertainment & Recreation | 5 (25.0%) | 15 (75.0%) |
| Accommodation & Food Services | 94 (45.9%) | 111 (54.1%) |
| Public Administration | 120 (53.1%) | 106 (46.9%) |
| Total | 1,624 (47.1%) | 1,823 (52.9%) |
Education in Covington
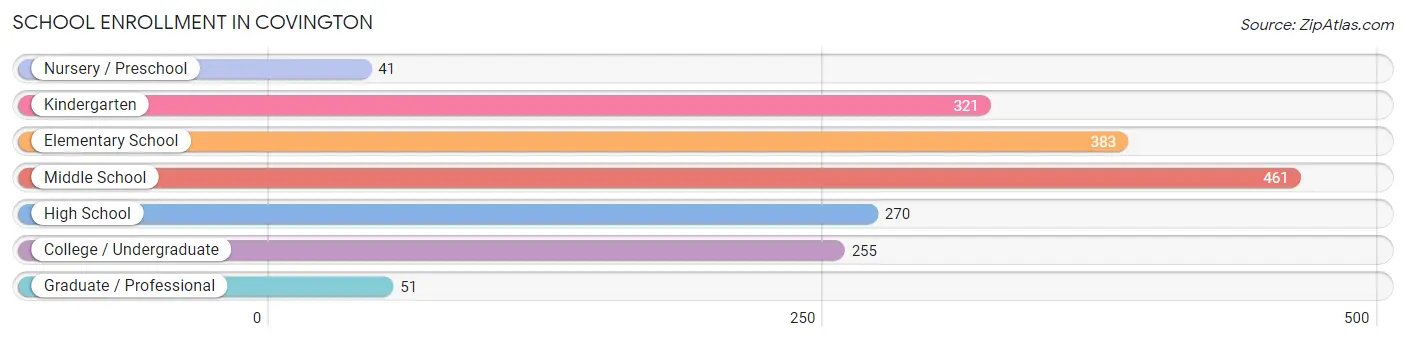
School Enrollment in Covington
The most common levels of schooling among the 1,782 students in Covington are middle school (461 | 25.9%), elementary school (383 | 21.5%), and kindergarten (321 | 18.0%).
| School Level | # Students | % Students |
| Nursery / Preschool | 41 | 2.3% |
| Kindergarten | 321 | 18.0% |
| Elementary School | 383 | 21.5% |
| Middle School | 461 | 25.9% |
| High School | 270 | 15.1% |
| College / Undergraduate | 255 | 14.3% |
| Graduate / Professional | 51 | 2.9% |
| Total | 1,782 | 100.0% |
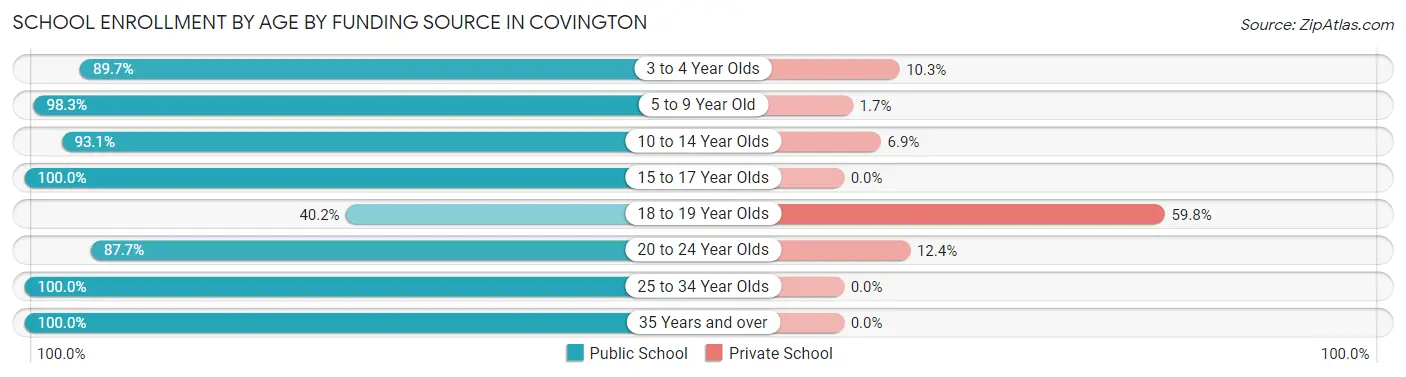
School Enrollment by Age by Funding Source in Covington
Out of a total of 1,782 students who are enrolled in schools in Covington, 105 (5.9%) attend a private institution, while the remaining 1,677 (94.1%) are enrolled in public schools. The age group of 18 to 19 year olds has the highest likelihood of being enrolled in private schools, with 49 (59.8% in the age bracket) enrolled. Conversely, the age group of 15 to 17 year olds has the lowest likelihood of being enrolled in a private school, with 262 (100.0% in the age bracket) attending a public institution.
| Age Bracket | Public School | Private School |
| 3 to 4 Year Olds | 52 (89.7%) | 6 (10.3%) |
| 5 to 9 Year Old | 647 (98.3%) | 11 (1.7%) |
| 10 to 14 Year Olds | 406 (93.1%) | 30 (6.9%) |
| 15 to 17 Year Olds | 262 (100.0%) | 0 (0.0%) |
| 18 to 19 Year Olds | 33 (40.2%) | 49 (59.8%) |
| 20 to 24 Year Olds | 71 (87.6%) | 10 (12.3%) |
| 25 to 34 Year Olds | 143 (100.0%) | 0 (0.0%) |
| 35 Years and over | 62 (100.0%) | 0 (0.0%) |
| Total | 1,677 (94.1%) | 105 (5.9%) |
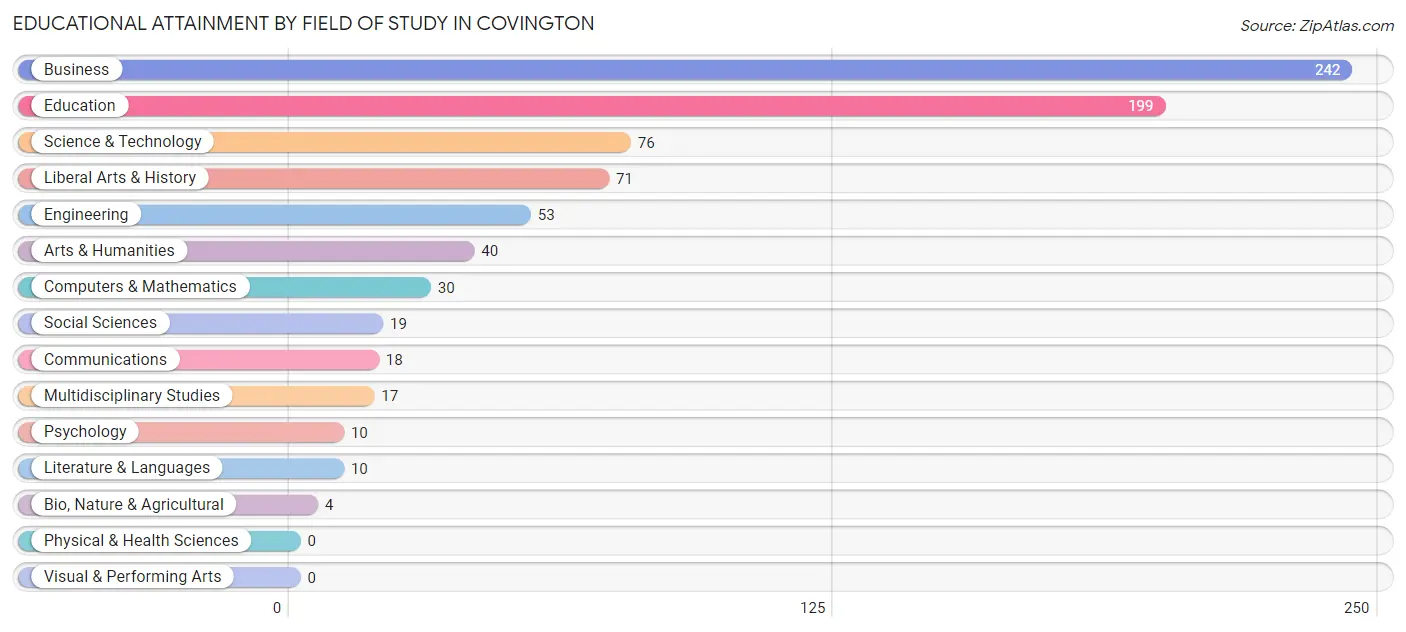
Educational Attainment by Field of Study in Covington
Business (242 | 30.7%), education (199 | 25.2%), science & technology (76 | 9.6%), liberal arts & history (71 | 9.0%), and engineering (53 | 6.7%) are the most common fields of study among 789 individuals in Covington who have obtained a bachelor's degree or higher.
| Field of Study | # Graduates | % Graduates |
| Computers & Mathematics | 30 | 3.8% |
| Bio, Nature & Agricultural | 4 | 0.5% |
| Physical & Health Sciences | 0 | 0.0% |
| Psychology | 10 | 1.3% |
| Social Sciences | 19 | 2.4% |
| Engineering | 53 | 6.7% |
| Multidisciplinary Studies | 17 | 2.1% |
| Science & Technology | 76 | 9.6% |
| Business | 242 | 30.7% |
| Education | 199 | 25.2% |
| Literature & Languages | 10 | 1.3% |
| Liberal Arts & History | 71 | 9.0% |
| Visual & Performing Arts | 0 | 0.0% |
| Communications | 18 | 2.3% |
| Arts & Humanities | 40 | 5.1% |
| Total | 789 | 100.0% |
Transportation & Commute in Covington
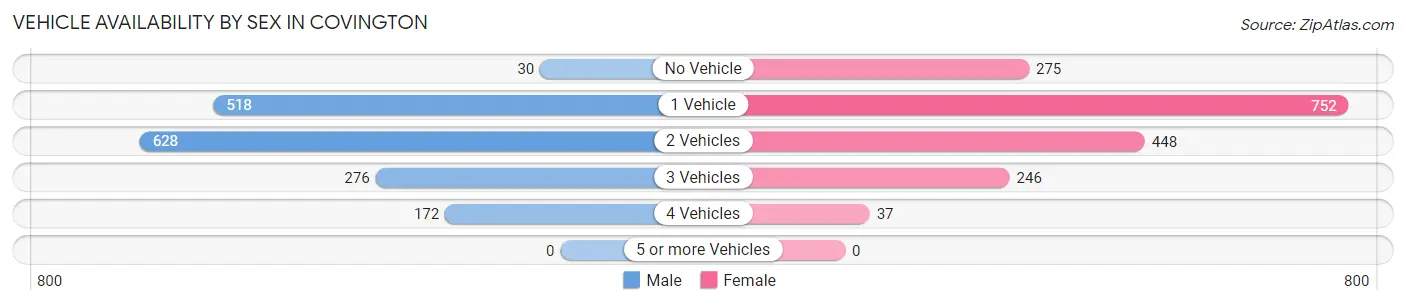
Vehicle Availability by Sex in Covington
The most prevalent vehicle ownership categories in Covington are males with 2 vehicles (628, accounting for 38.7%) and females with 2 vehicles (448, making up 35.7%).
| Vehicles Available | Male | Female |
| No Vehicle | 30 (1.8%) | 275 (15.6%) |
| 1 Vehicle | 518 (31.9%) | 752 (42.8%) |
| 2 Vehicles | 628 (38.7%) | 448 (25.5%) |
| 3 Vehicles | 276 (17.0%) | 246 (14.0%) |
| 4 Vehicles | 172 (10.6%) | 37 (2.1%) |
| 5 or more Vehicles | 0 (0.0%) | 0 (0.0%) |
| Total | 1,624 (100.0%) | 1,758 (100.0%) |
Commute Time in Covington
The most frequently occuring commute durations in Covington are 5 to 9 minutes (825 commuters, 25.9%), 10 to 14 minutes (412 commuters, 13.0%), and 30 to 34 minutes (409 commuters, 12.9%).
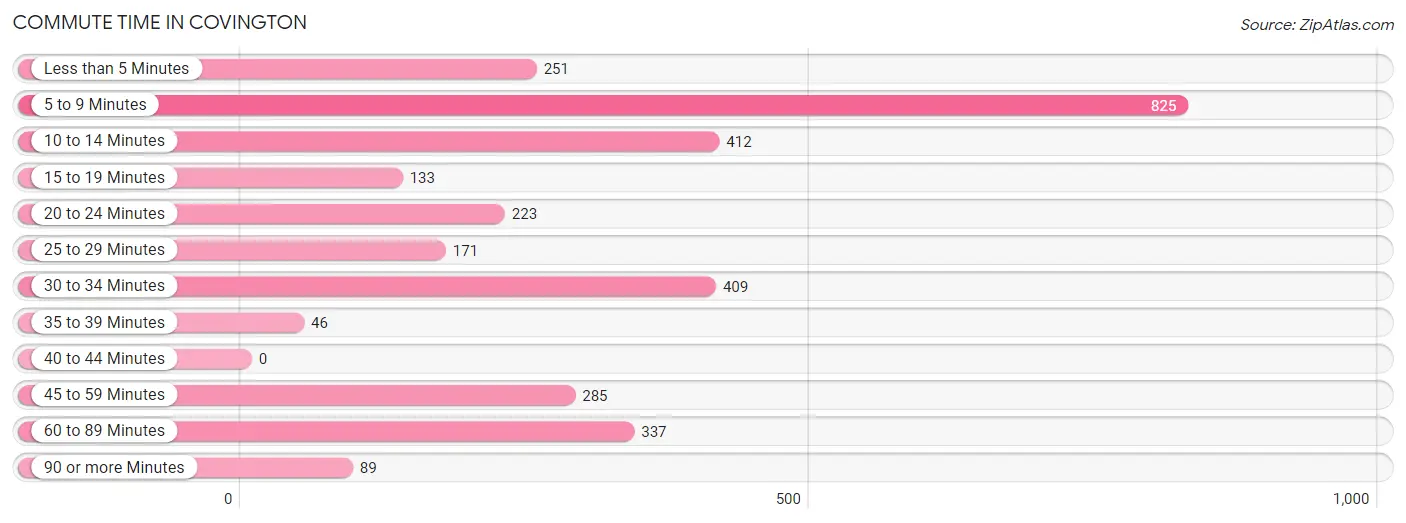
| Commute Time | # Commuters | % Commuters |
| Less than 5 Minutes | 251 | 7.9% |
| 5 to 9 Minutes | 825 | 25.9% |
| 10 to 14 Minutes | 412 | 13.0% |
| 15 to 19 Minutes | 133 | 4.2% |
| 20 to 24 Minutes | 223 | 7.0% |
| 25 to 29 Minutes | 171 | 5.4% |
| 30 to 34 Minutes | 409 | 12.9% |
| 35 to 39 Minutes | 46 | 1.5% |
| 40 to 44 Minutes | 0 | 0.0% |
| 45 to 59 Minutes | 285 | 9.0% |
| 60 to 89 Minutes | 337 | 10.6% |
| 90 or more Minutes | 89 | 2.8% |
Commute Time by Sex in Covington
The most common commute times in Covington are 5 to 9 minutes (411 commuters, 25.9%) for males and 5 to 9 minutes (414 commuters, 25.9%) for females.
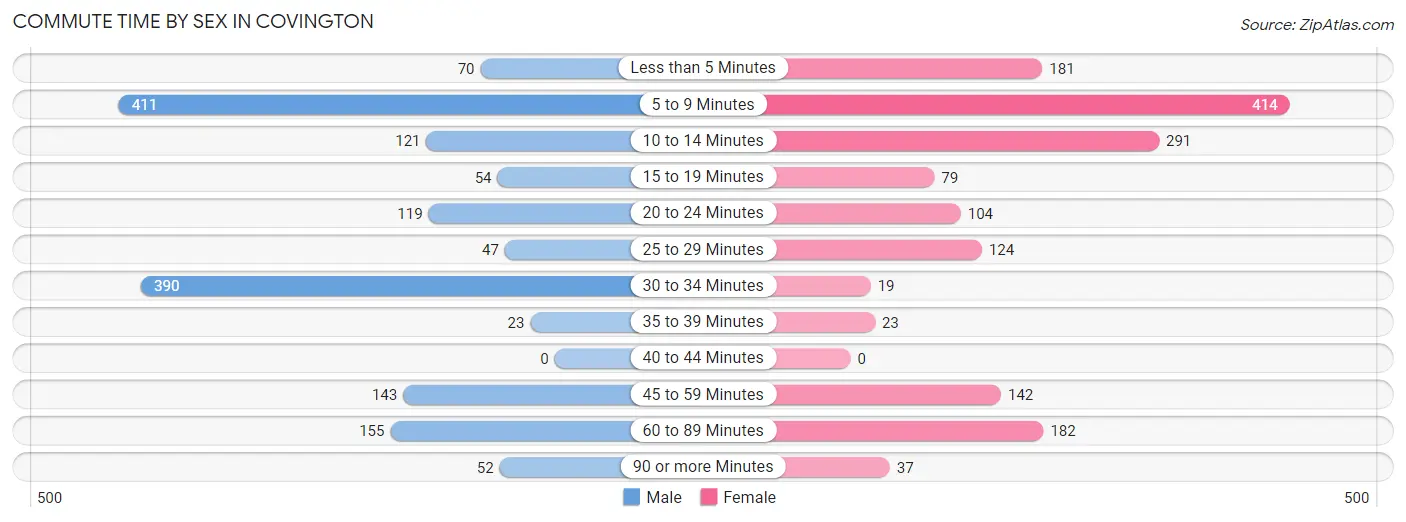
| Commute Time | Male | Female |
| Less than 5 Minutes | 70 (4.4%) | 181 (11.3%) |
| 5 to 9 Minutes | 411 (25.9%) | 414 (25.9%) |
| 10 to 14 Minutes | 121 (7.6%) | 291 (18.2%) |
| 15 to 19 Minutes | 54 (3.4%) | 79 (5.0%) |
| 20 to 24 Minutes | 119 (7.5%) | 104 (6.5%) |
| 25 to 29 Minutes | 47 (3.0%) | 124 (7.8%) |
| 30 to 34 Minutes | 390 (24.6%) | 19 (1.2%) |
| 35 to 39 Minutes | 23 (1.5%) | 23 (1.4%) |
| 40 to 44 Minutes | 0 (0.0%) | 0 (0.0%) |
| 45 to 59 Minutes | 143 (9.0%) | 142 (8.9%) |
| 60 to 89 Minutes | 155 (9.8%) | 182 (11.4%) |
| 90 or more Minutes | 52 (3.3%) | 37 (2.3%) |
Time of Departure to Work by Sex in Covington
The most frequent times of departure to work in Covington are 7:00 AM to 7:29 AM (356, 22.5%) for males and 7:30 AM to 7:59 AM (379, 23.7%) for females.
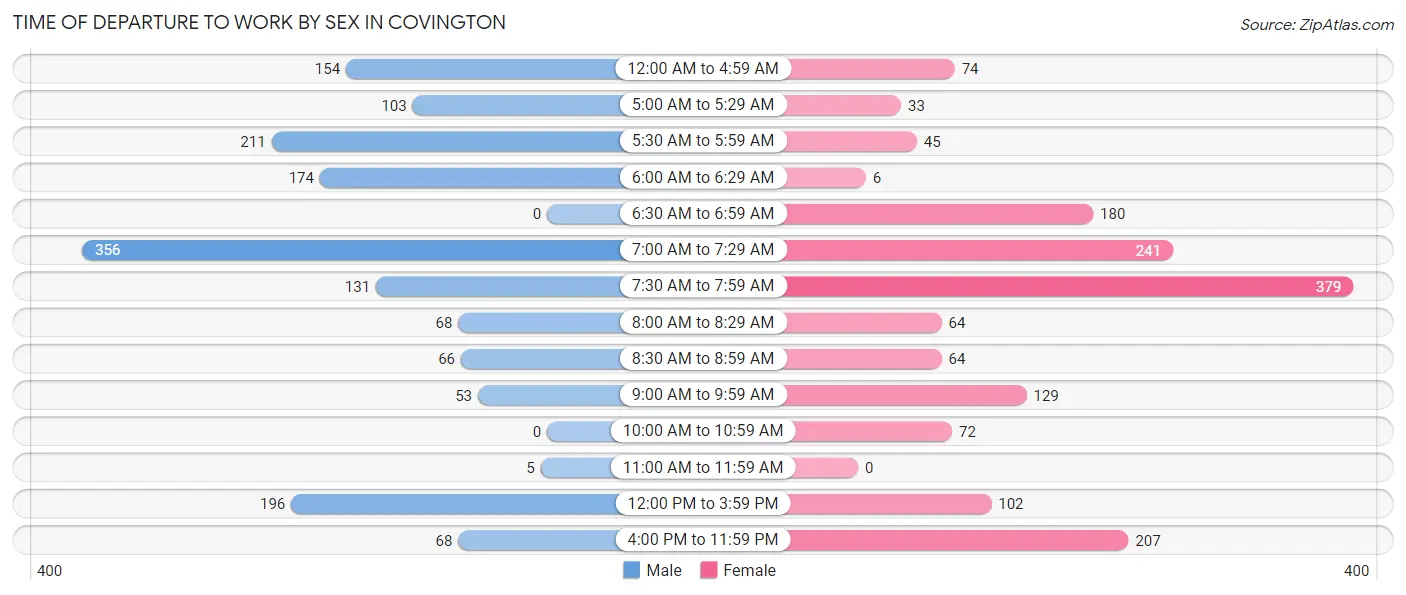
| Time of Departure | Male | Female |
| 12:00 AM to 4:59 AM | 154 (9.7%) | 74 (4.6%) |
| 5:00 AM to 5:29 AM | 103 (6.5%) | 33 (2.1%) |
| 5:30 AM to 5:59 AM | 211 (13.3%) | 45 (2.8%) |
| 6:00 AM to 6:29 AM | 174 (11.0%) | 6 (0.4%) |
| 6:30 AM to 6:59 AM | 0 (0.0%) | 180 (11.3%) |
| 7:00 AM to 7:29 AM | 356 (22.5%) | 241 (15.1%) |
| 7:30 AM to 7:59 AM | 131 (8.3%) | 379 (23.7%) |
| 8:00 AM to 8:29 AM | 68 (4.3%) | 64 (4.0%) |
| 8:30 AM to 8:59 AM | 66 (4.2%) | 64 (4.0%) |
| 9:00 AM to 9:59 AM | 53 (3.3%) | 129 (8.1%) |
| 10:00 AM to 10:59 AM | 0 (0.0%) | 72 (4.5%) |
| 11:00 AM to 11:59 AM | 5 (0.3%) | 0 (0.0%) |
| 12:00 PM to 3:59 PM | 196 (12.4%) | 102 (6.4%) |
| 4:00 PM to 11:59 PM | 68 (4.3%) | 207 (13.0%) |
| Total | 1,585 (100.0%) | 1,596 (100.0%) |
Housing Occupancy in Covington
Occupancy by Ownership in Covington
Of the total 3,499 dwellings in Covington, owner-occupied units account for 1,715 (49.0%), while renter-occupied units make up 1,784 (51.0%).
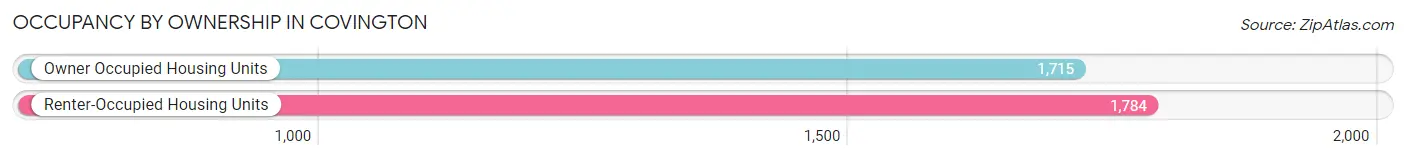
| Occupancy | # Housing Units | % Housing Units |
| Owner Occupied Housing Units | 1,715 | 49.0% |
| Renter-Occupied Housing Units | 1,784 | 51.0% |
| Total Occupied Housing Units | 3,499 | 100.0% |
Occupancy by Household Size in Covington
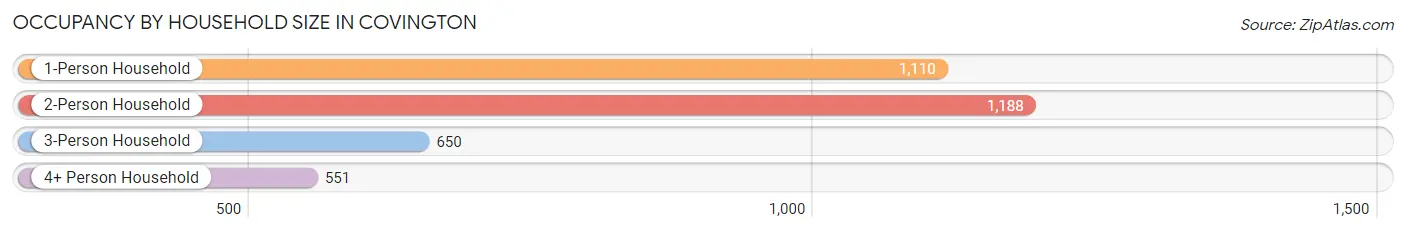
| Household Size | # Housing Units | % Housing Units |
| 1-Person Household | 1,110 | 31.7% |
| 2-Person Household | 1,188 | 34.0% |
| 3-Person Household | 650 | 18.6% |
| 4+ Person Household | 551 | 15.8% |
| Total Housing Units | 3,499 | 100.0% |
Occupancy by Ownership by Household Size in Covington
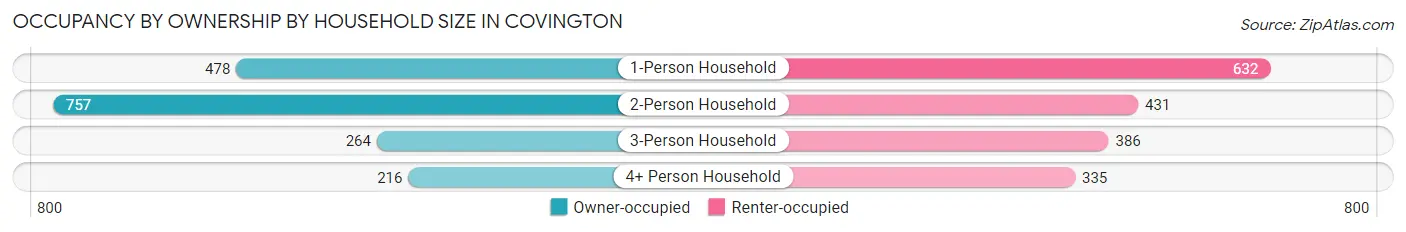
| Household Size | Owner-occupied | Renter-occupied |
| 1-Person Household | 478 (43.1%) | 632 (56.9%) |
| 2-Person Household | 757 (63.7%) | 431 (36.3%) |
| 3-Person Household | 264 (40.6%) | 386 (59.4%) |
| 4+ Person Household | 216 (39.2%) | 335 (60.8%) |
| Total Housing Units | 1,715 (49.0%) | 1,784 (51.0%) |
Occupancy by Educational Attainment in Covington
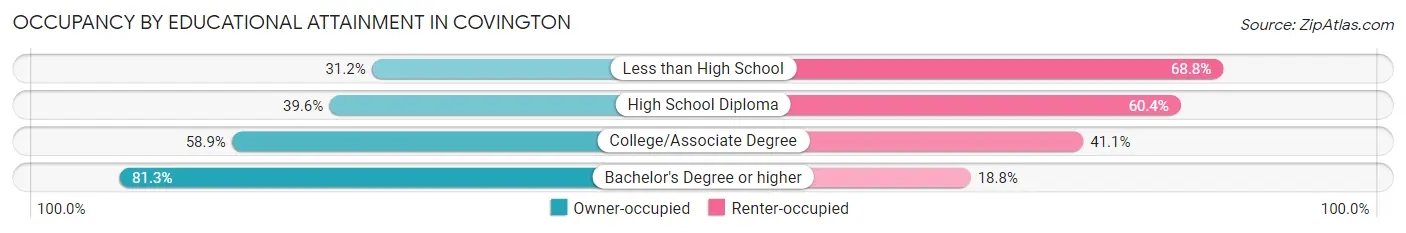
| Household Size | Owner-occupied | Renter-occupied |
| Less than High School | 182 (31.2%) | 401 (68.8%) |
| High School Diploma | 535 (39.6%) | 815 (60.4%) |
| College/Associate Degree | 725 (58.9%) | 505 (41.1%) |
| Bachelor's Degree or higher | 273 (81.2%) | 63 (18.8%) |
Occupancy by Age of Householder in Covington
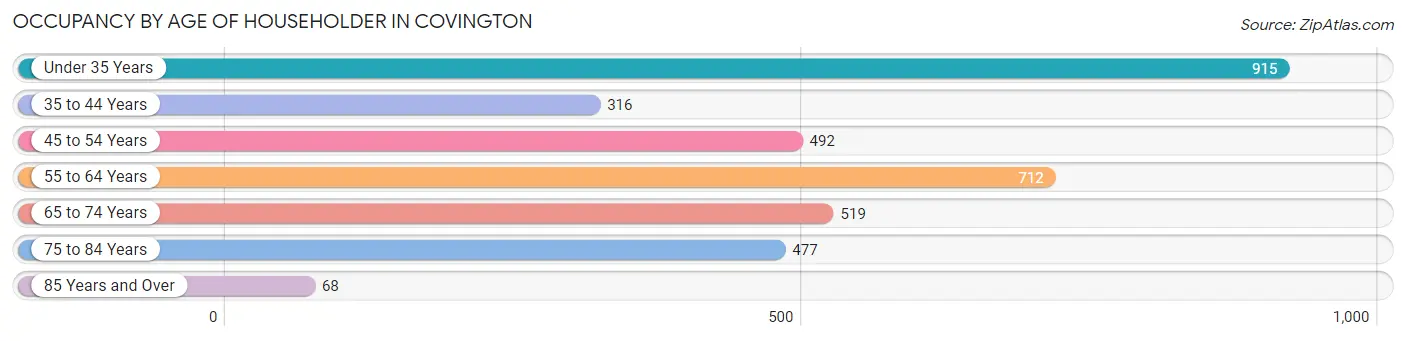
| Age Bracket | # Households | % Households |
| Under 35 Years | 915 | 26.2% |
| 35 to 44 Years | 316 | 9.0% |
| 45 to 54 Years | 492 | 14.1% |
| 55 to 64 Years | 712 | 20.3% |
| 65 to 74 Years | 519 | 14.8% |
| 75 to 84 Years | 477 | 13.6% |
| 85 Years and Over | 68 | 1.9% |
| Total | 3,499 | 100.0% |
Housing Finances in Covington
Median Income by Occupancy in Covington
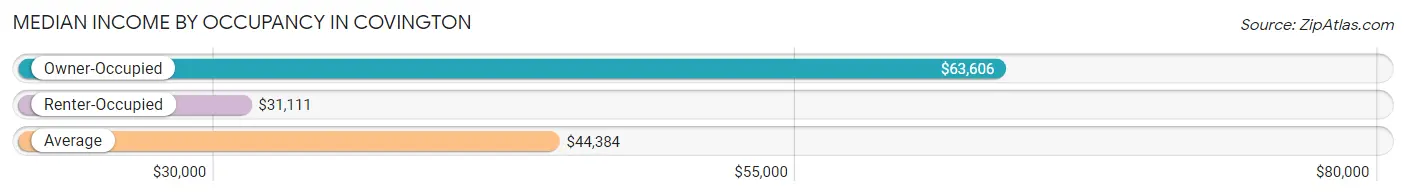
| Occupancy Type | # Households | Median Income |
| Owner-Occupied | 1,715 (49.0%) | $63,606 |
| Renter-Occupied | 1,784 (51.0%) | $31,111 |
| Average | 3,499 (100.0%) | $44,384 |
Occupancy by Householder Income Bracket in Covington
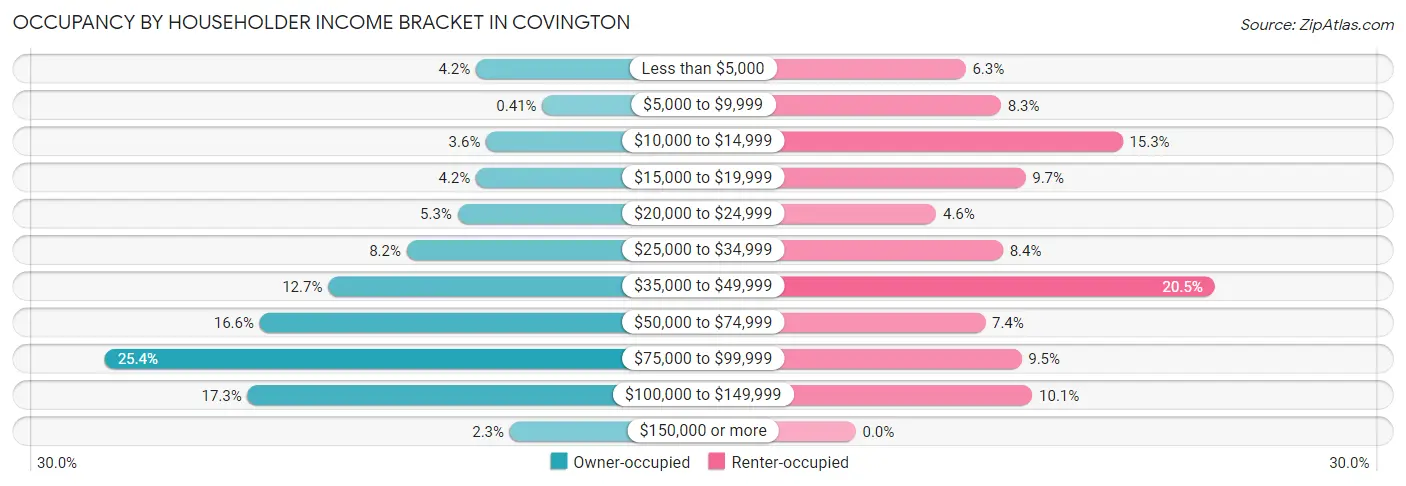
| Income Bracket | Owner-occupied | Renter-occupied |
| Less than $5,000 | 72 (4.2%) | 112 (6.3%) |
| $5,000 to $9,999 | 7 (0.4%) | 148 (8.3%) |
| $10,000 to $14,999 | 62 (3.6%) | 272 (15.2%) |
| $15,000 to $19,999 | 72 (4.2%) | 173 (9.7%) |
| $20,000 to $24,999 | 90 (5.2%) | 82 (4.6%) |
| $25,000 to $34,999 | 140 (8.2%) | 150 (8.4%) |
| $35,000 to $49,999 | 217 (12.7%) | 366 (20.5%) |
| $50,000 to $74,999 | 284 (16.6%) | 132 (7.4%) |
| $75,000 to $99,999 | 436 (25.4%) | 169 (9.5%) |
| $100,000 to $149,999 | 296 (17.3%) | 180 (10.1%) |
| $150,000 or more | 39 (2.3%) | 0 (0.0%) |
| Total | 1,715 (100.0%) | 1,784 (100.0%) |
Monthly Housing Cost Tiers in Covington
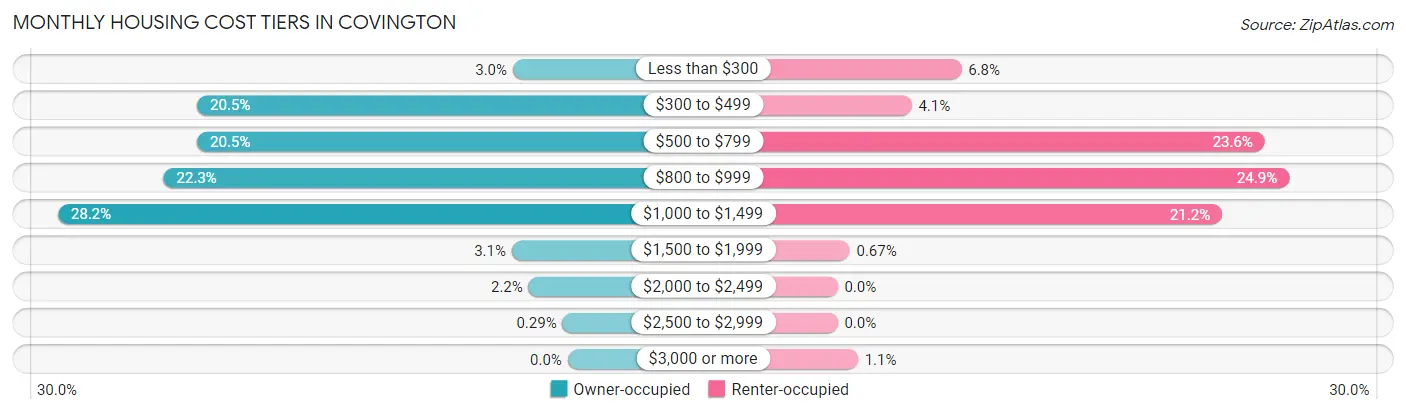
| Monthly Cost | Owner-occupied | Renter-occupied |
| Less than $300 | 52 (3.0%) | 122 (6.8%) |
| $300 to $499 | 351 (20.5%) | 73 (4.1%) |
| $500 to $799 | 351 (20.5%) | 421 (23.6%) |
| $800 to $999 | 383 (22.3%) | 445 (24.9%) |
| $1,000 to $1,499 | 483 (28.2%) | 379 (21.2%) |
| $1,500 to $1,999 | 53 (3.1%) | 12 (0.7%) |
| $2,000 to $2,499 | 37 (2.2%) | 0 (0.0%) |
| $2,500 to $2,999 | 5 (0.3%) | 0 (0.0%) |
| $3,000 or more | 0 (0.0%) | 20 (1.1%) |
| Total | 1,715 (100.0%) | 1,784 (100.0%) |
Physical Housing Characteristics in Covington
Housing Structures in Covington
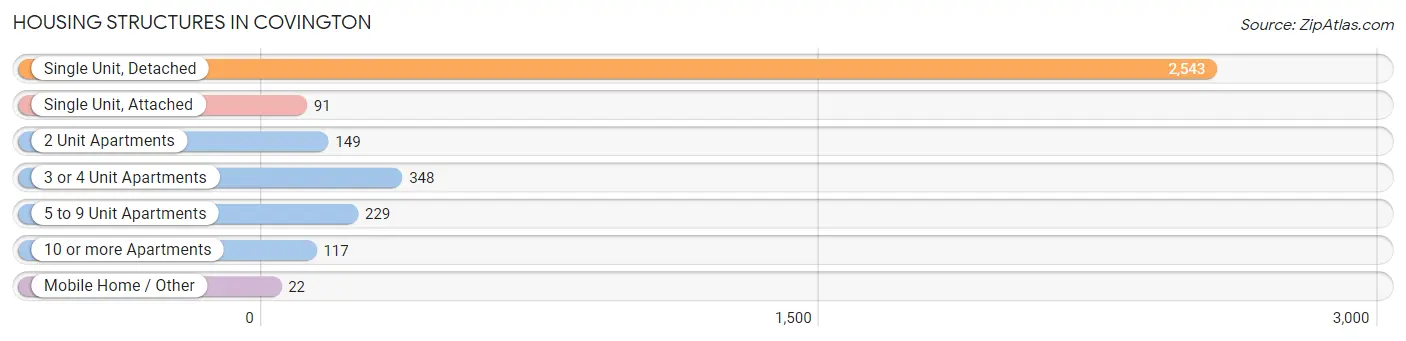
| Structure Type | # Housing Units | % Housing Units |
| Single Unit, Detached | 2,543 | 72.7% |
| Single Unit, Attached | 91 | 2.6% |
| 2 Unit Apartments | 149 | 4.3% |
| 3 or 4 Unit Apartments | 348 | 10.0% |
| 5 to 9 Unit Apartments | 229 | 6.5% |
| 10 or more Apartments | 117 | 3.3% |
| Mobile Home / Other | 22 | 0.6% |
| Total | 3,499 | 100.0% |
Housing Structures by Occupancy in Covington
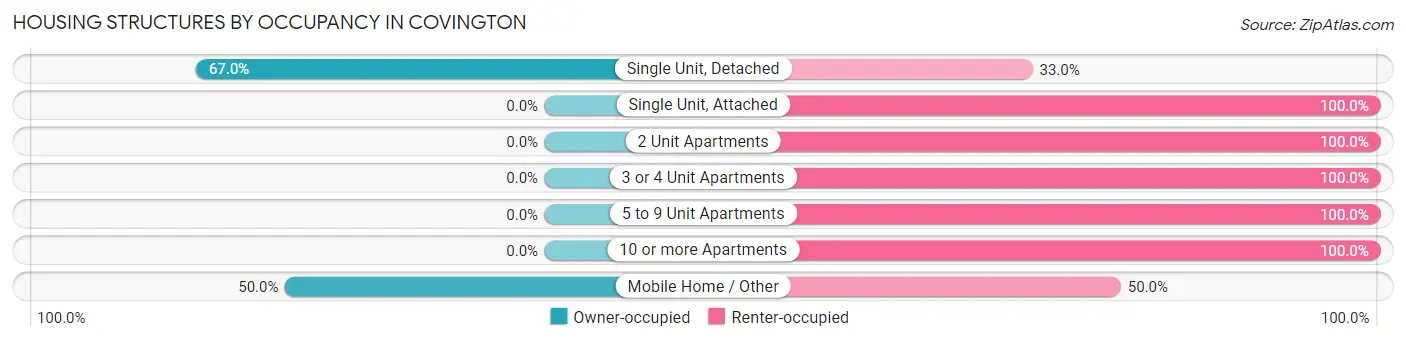
| Structure Type | Owner-occupied | Renter-occupied |
| Single Unit, Detached | 1,704 (67.0%) | 839 (33.0%) |
| Single Unit, Attached | 0 (0.0%) | 91 (100.0%) |
| 2 Unit Apartments | 0 (0.0%) | 149 (100.0%) |
| 3 or 4 Unit Apartments | 0 (0.0%) | 348 (100.0%) |
| 5 to 9 Unit Apartments | 0 (0.0%) | 229 (100.0%) |
| 10 or more Apartments | 0 (0.0%) | 117 (100.0%) |
| Mobile Home / Other | 11 (50.0%) | 11 (50.0%) |
| Total | 1,715 (49.0%) | 1,784 (51.0%) |
Housing Structures by Number of Rooms in Covington
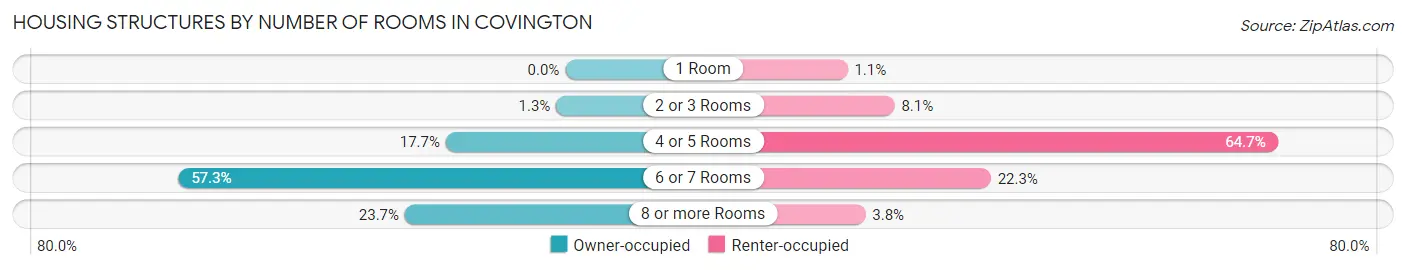
| Number of Rooms | Owner-occupied | Renter-occupied |
| 1 Room | 0 (0.0%) | 20 (1.1%) |
| 2 or 3 Rooms | 23 (1.3%) | 144 (8.1%) |
| 4 or 5 Rooms | 303 (17.7%) | 1,155 (64.7%) |
| 6 or 7 Rooms | 982 (57.3%) | 398 (22.3%) |
| 8 or more Rooms | 407 (23.7%) | 67 (3.8%) |
| Total | 1,715 (100.0%) | 1,784 (100.0%) |
Housing Structure by Heating Type in Covington
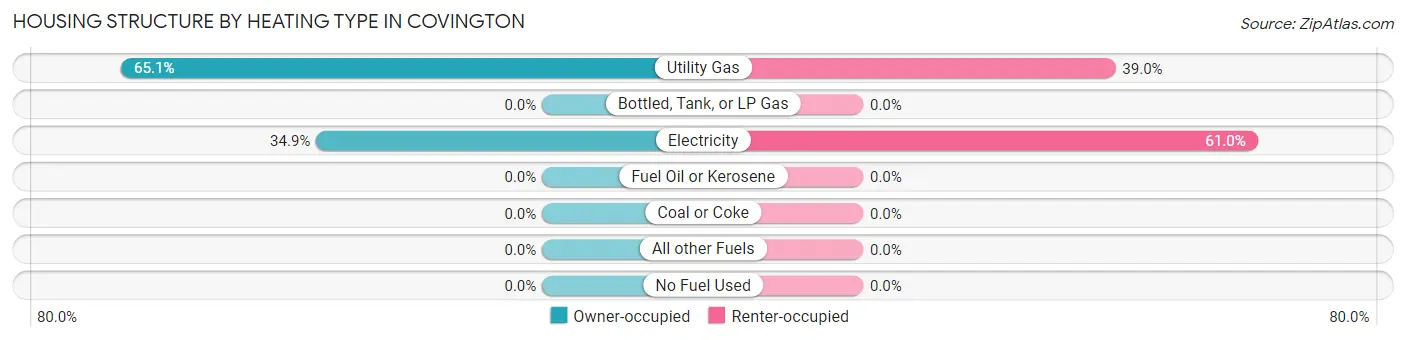
| Heating Type | Owner-occupied | Renter-occupied |
| Utility Gas | 1,116 (65.1%) | 696 (39.0%) |
| Bottled, Tank, or LP Gas | 0 (0.0%) | 0 (0.0%) |
| Electricity | 599 (34.9%) | 1,088 (61.0%) |
| Fuel Oil or Kerosene | 0 (0.0%) | 0 (0.0%) |
| Coal or Coke | 0 (0.0%) | 0 (0.0%) |
| All other Fuels | 0 (0.0%) | 0 (0.0%) |
| No Fuel Used | 0 (0.0%) | 0 (0.0%) |
| Total | 1,715 (100.0%) | 1,784 (100.0%) |
Household Vehicle Usage in Covington
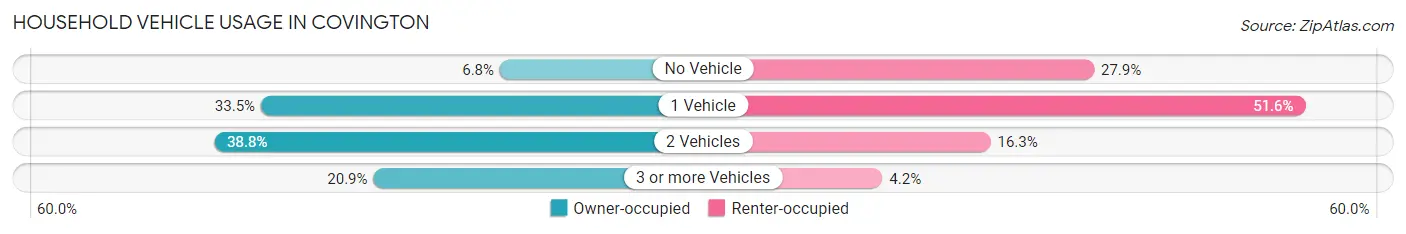
| Vehicles per Household | Owner-occupied | Renter-occupied |
| No Vehicle | 116 (6.8%) | 498 (27.9%) |
| 1 Vehicle | 575 (33.5%) | 920 (51.6%) |
| 2 Vehicles | 665 (38.8%) | 291 (16.3%) |
| 3 or more Vehicles | 359 (20.9%) | 75 (4.2%) |
| Total | 1,715 (100.0%) | 1,784 (100.0%) |
Real Estate & Mortgages in Covington
Real Estate and Mortgage Overview in Covington
| Characteristic | Without Mortgage | With Mortgage |
| Housing Units | 729 | 986 |
| Median Property Value | $215,600 | $136,900 |
| Median Household Income | $57,650 | $13 |
| Monthly Housing Costs | $489 | $0 |
| Real Estate Taxes | $1,297 | $15 |
Property Value by Mortgage Status in Covington
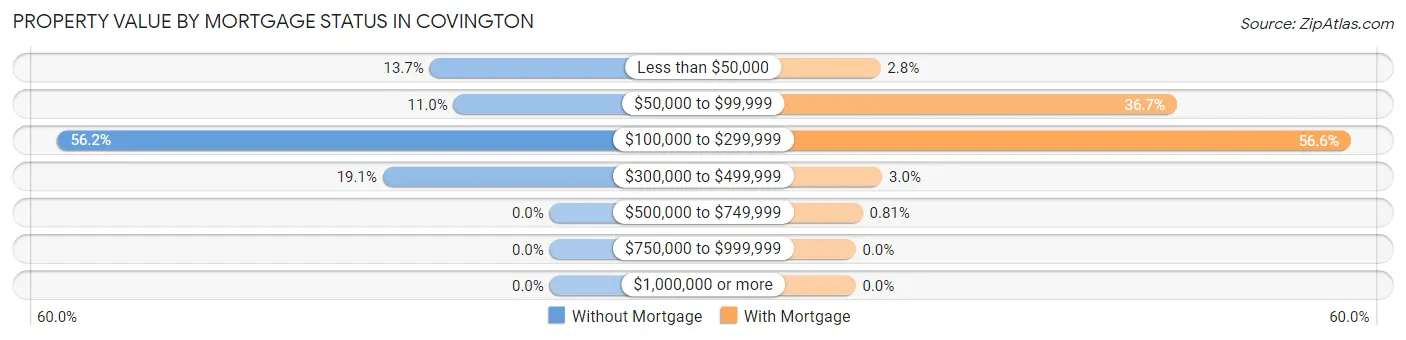
| Property Value | Without Mortgage | With Mortgage |
| Less than $50,000 | 100 (13.7%) | 28 (2.8%) |
| $50,000 to $99,999 | 80 (11.0%) | 362 (36.7%) |
| $100,000 to $299,999 | 410 (56.2%) | 558 (56.6%) |
| $300,000 to $499,999 | 139 (19.1%) | 30 (3.0%) |
| $500,000 to $749,999 | 0 (0.0%) | 8 (0.8%) |
| $750,000 to $999,999 | 0 (0.0%) | 0 (0.0%) |
| $1,000,000 or more | 0 (0.0%) | 0 (0.0%) |
| Total | 729 (100.0%) | 986 (100.0%) |
Household Income by Mortgage Status in Covington
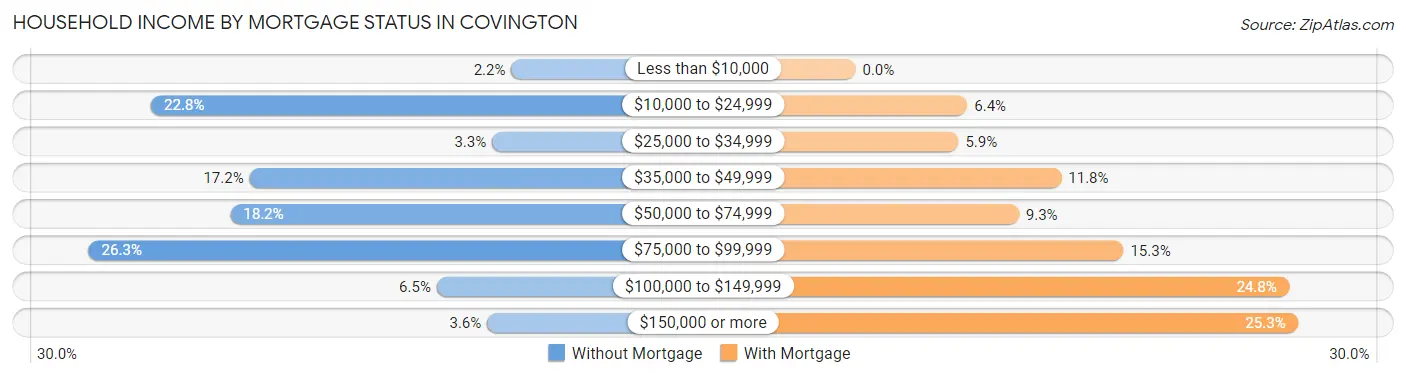
| Household Income | Without Mortgage | With Mortgage |
| Less than $10,000 | 16 (2.2%) | 0 (0.0%) |
| $10,000 to $24,999 | 166 (22.8%) | 63 (6.4%) |
| $25,000 to $34,999 | 24 (3.3%) | 58 (5.9%) |
| $35,000 to $49,999 | 125 (17.2%) | 116 (11.8%) |
| $50,000 to $74,999 | 133 (18.2%) | 92 (9.3%) |
| $75,000 to $99,999 | 192 (26.3%) | 151 (15.3%) |
| $100,000 to $149,999 | 47 (6.5%) | 244 (24.7%) |
| $150,000 or more | 26 (3.6%) | 249 (25.3%) |
| Total | 729 (100.0%) | 986 (100.0%) |
Property Value to Household Income Ratio in Covington
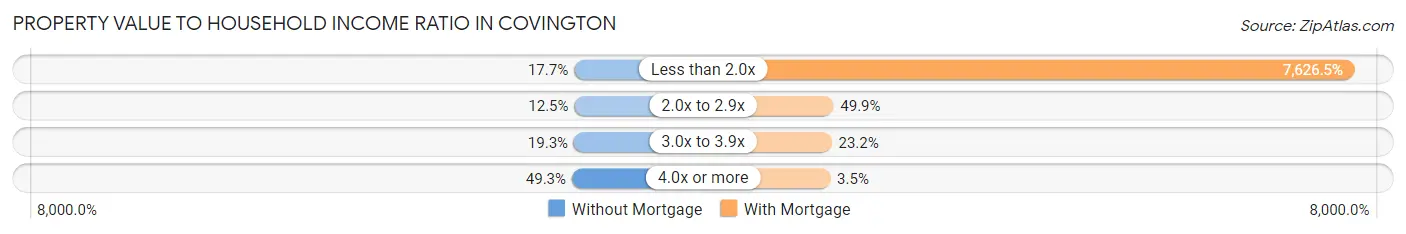
| Value-to-Income Ratio | Without Mortgage | With Mortgage |
| Less than 2.0x | 129 (17.7%) | 75,197 (7,626.5%) |
| 2.0x to 2.9x | 91 (12.5%) | 492 (49.9%) |
| 3.0x to 3.9x | 141 (19.3%) | 229 (23.2%) |
| 4.0x or more | 359 (49.2%) | 34 (3.5%) |
| Total | 729 (100.0%) | 986 (100.0%) |
Real Estate Taxes by Mortgage Status in Covington
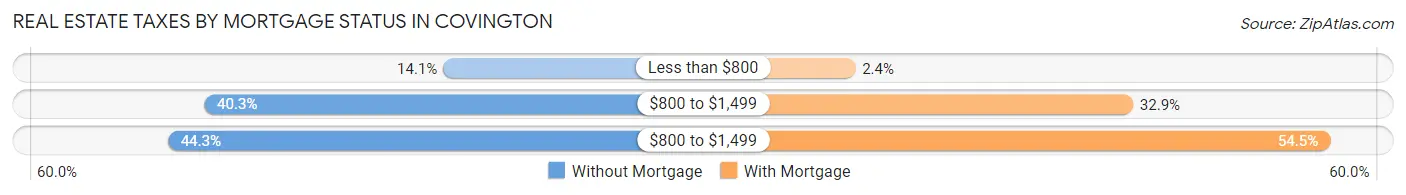
| Property Taxes | Without Mortgage | With Mortgage |
| Less than $800 | 103 (14.1%) | 24 (2.4%) |
| $800 to $1,499 | 294 (40.3%) | 324 (32.9%) |
| $800 to $1,499 | 323 (44.3%) | 537 (54.5%) |
| Total | 729 (100.0%) | 986 (100.0%) |
Health & Disability in Covington
Health Insurance Coverage by Age in Covington
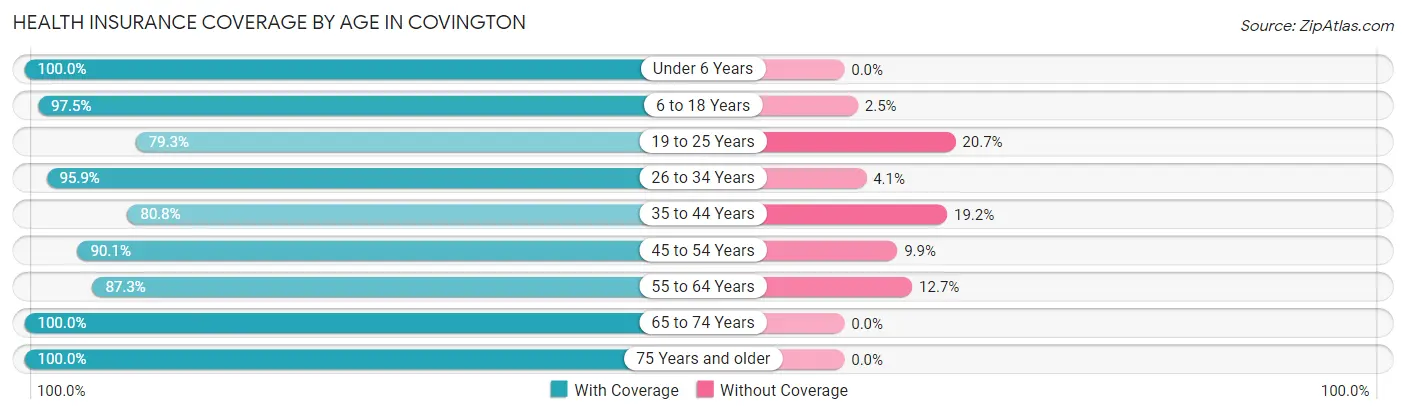
| Age Bracket | With Coverage | Without Coverage |
| Under 6 Years | 851 (100.0%) | 0 (0.0%) |
| 6 to 18 Years | 1,385 (97.5%) | 36 (2.5%) |
| 19 to 25 Years | 620 (79.3%) | 162 (20.7%) |
| 26 to 34 Years | 1,058 (95.9%) | 45 (4.1%) |
| 35 to 44 Years | 599 (80.8%) | 142 (19.2%) |
| 45 to 54 Years | 831 (90.1%) | 91 (9.9%) |
| 55 to 64 Years | 911 (87.3%) | 132 (12.7%) |
| 65 to 74 Years | 754 (100.0%) | 0 (0.0%) |
| 75 Years and older | 630 (100.0%) | 0 (0.0%) |
| Total | 7,639 (92.6%) | 608 (7.4%) |
Health Insurance Coverage by Citizenship Status in Covington
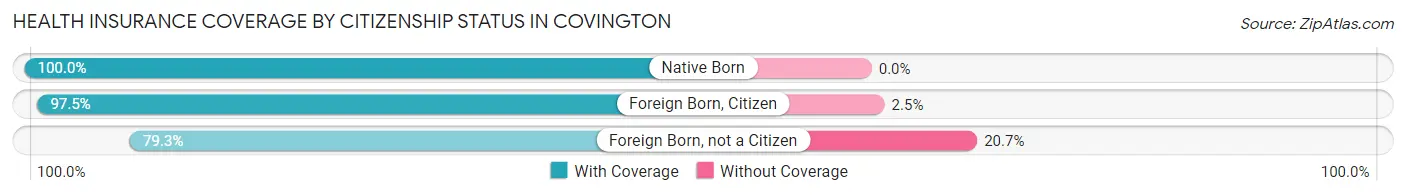
| Citizenship Status | With Coverage | Without Coverage |
| Native Born | 851 (100.0%) | 0 (0.0%) |
| Foreign Born, Citizen | 1,385 (97.5%) | 36 (2.5%) |
| Foreign Born, not a Citizen | 620 (79.3%) | 162 (20.7%) |
Health Insurance Coverage by Household Income in Covington
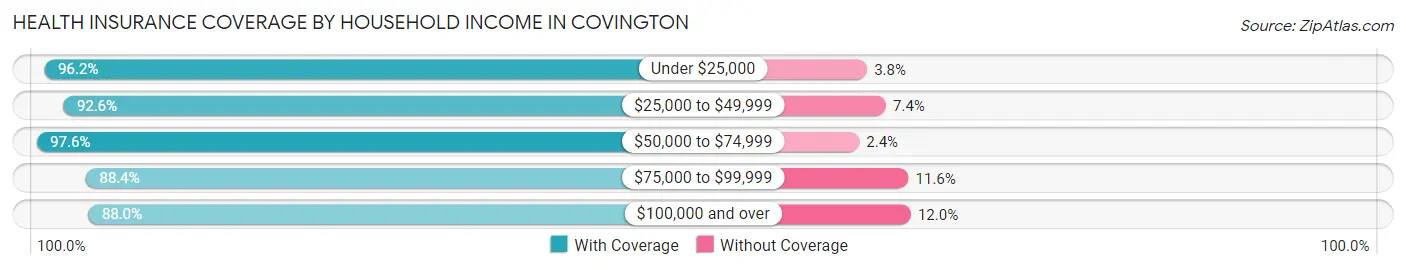
| Household Income | With Coverage | Without Coverage |
| Under $25,000 | 2,159 (96.2%) | 86 (3.8%) |
| $25,000 to $49,999 | 2,065 (92.6%) | 164 (7.4%) |
| $50,000 to $74,999 | 909 (97.6%) | 22 (2.4%) |
| $75,000 to $99,999 | 1,168 (88.4%) | 153 (11.6%) |
| $100,000 and over | 1,338 (88.0%) | 183 (12.0%) |
Public vs Private Health Insurance Coverage by Age in Covington
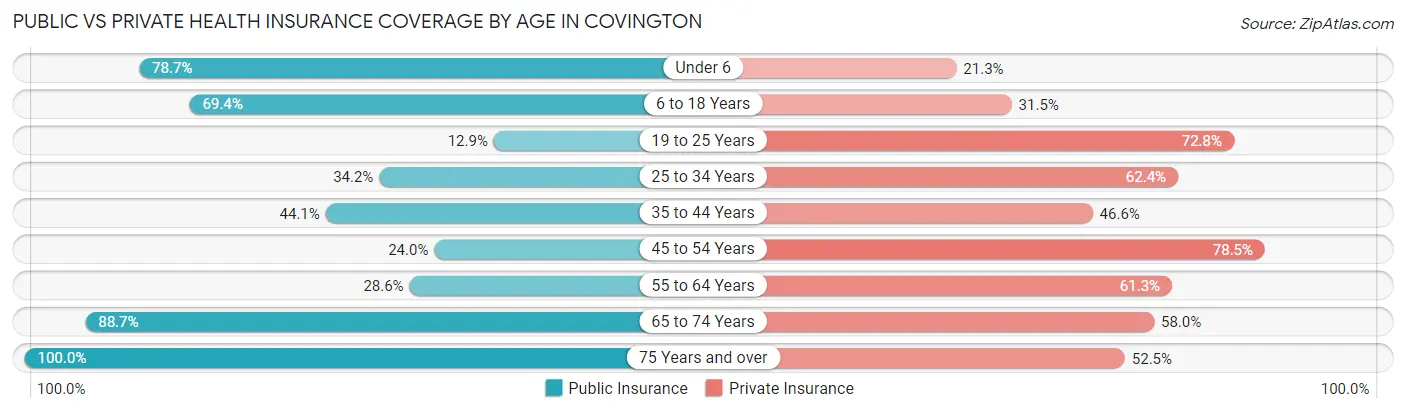
| Age Bracket | Public Insurance | Private Insurance |
| Under 6 | 670 (78.7%) | 181 (21.3%) |
| 6 to 18 Years | 986 (69.4%) | 448 (31.5%) |
| 19 to 25 Years | 101 (12.9%) | 569 (72.8%) |
| 25 to 34 Years | 377 (34.2%) | 688 (62.4%) |
| 35 to 44 Years | 327 (44.1%) | 345 (46.6%) |
| 45 to 54 Years | 221 (24.0%) | 724 (78.5%) |
| 55 to 64 Years | 298 (28.6%) | 639 (61.3%) |
| 65 to 74 Years | 669 (88.7%) | 437 (58.0%) |
| 75 Years and over | 630 (100.0%) | 331 (52.5%) |
| Total | 4,279 (51.9%) | 4,362 (52.9%) |
Disability Status by Sex by Age in Covington
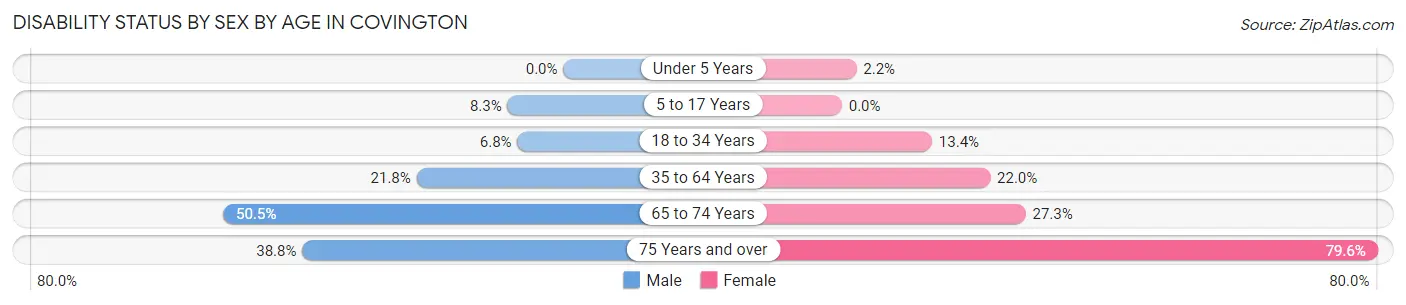
| Age Bracket | Male | Female |
| Under 5 Years | 0 (0.0%) | 8 (2.2%) |
| 5 to 17 Years | 62 (8.3%) | 0 (0.0%) |
| 18 to 34 Years | 67 (6.8%) | 131 (13.4%) |
| 35 to 64 Years | 273 (21.8%) | 320 (22.0%) |
| 65 to 74 Years | 144 (50.5%) | 128 (27.3%) |
| 75 Years and over | 100 (38.8%) | 296 (79.6%) |
Disability Class by Sex by Age in Covington
Disability Class: Hearing Difficulty
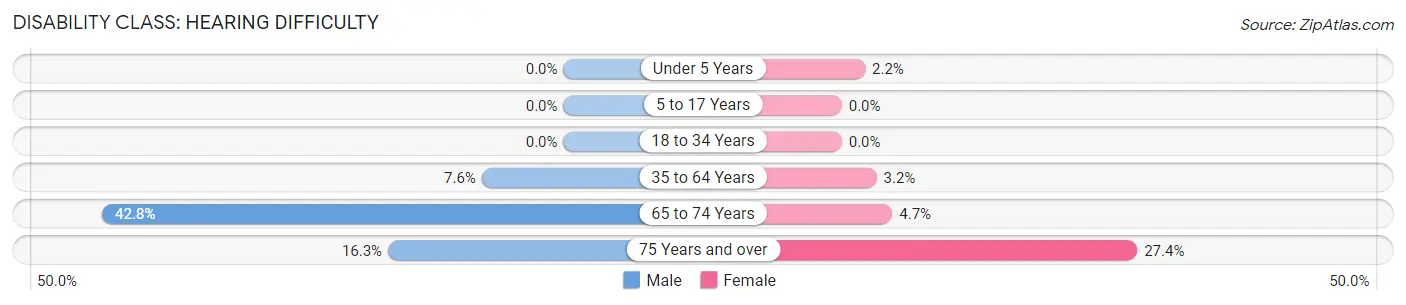
| Age Bracket | Male | Female |
| Under 5 Years | 0 (0.0%) | 8 (2.2%) |
| 5 to 17 Years | 0 (0.0%) | 0 (0.0%) |
| 18 to 34 Years | 0 (0.0%) | 0 (0.0%) |
| 35 to 64 Years | 95 (7.6%) | 47 (3.2%) |
| 65 to 74 Years | 122 (42.8%) | 22 (4.7%) |
| 75 Years and over | 42 (16.3%) | 102 (27.4%) |
Disability Class: Vision Difficulty
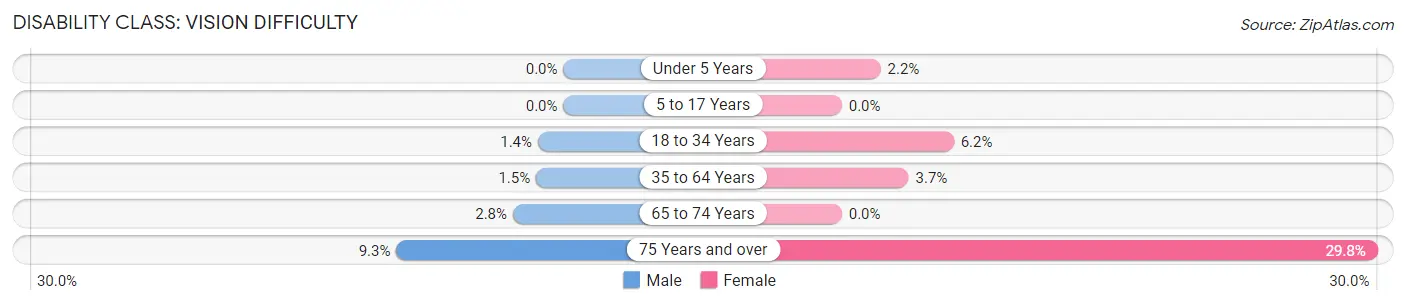
| Age Bracket | Male | Female |
| Under 5 Years | 0 (0.0%) | 8 (2.2%) |
| 5 to 17 Years | 0 (0.0%) | 0 (0.0%) |
| 18 to 34 Years | 14 (1.4%) | 61 (6.2%) |
| 35 to 64 Years | 19 (1.5%) | 54 (3.7%) |
| 65 to 74 Years | 8 (2.8%) | 0 (0.0%) |
| 75 Years and over | 24 (9.3%) | 111 (29.8%) |
Disability Class: Cognitive Difficulty
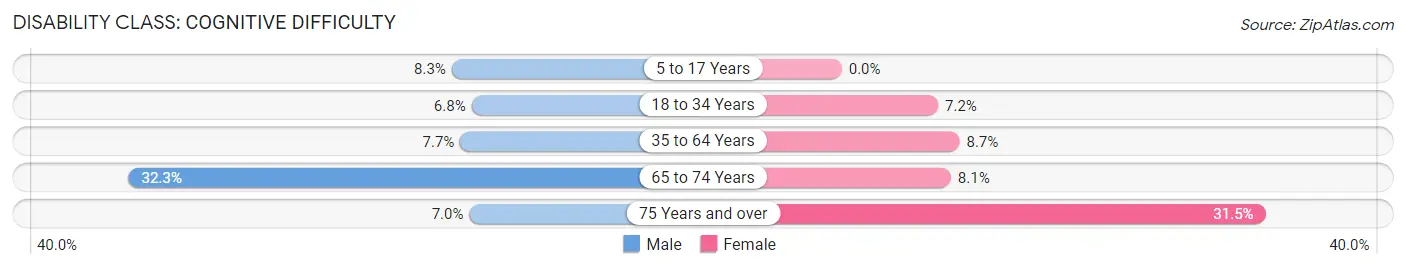
| Age Bracket | Male | Female |
| 5 to 17 Years | 62 (8.3%) | 0 (0.0%) |
| 18 to 34 Years | 67 (6.8%) | 70 (7.1%) |
| 35 to 64 Years | 96 (7.7%) | 127 (8.7%) |
| 65 to 74 Years | 92 (32.3%) | 38 (8.1%) |
| 75 Years and over | 18 (7.0%) | 117 (31.5%) |
Disability Class: Ambulatory Difficulty
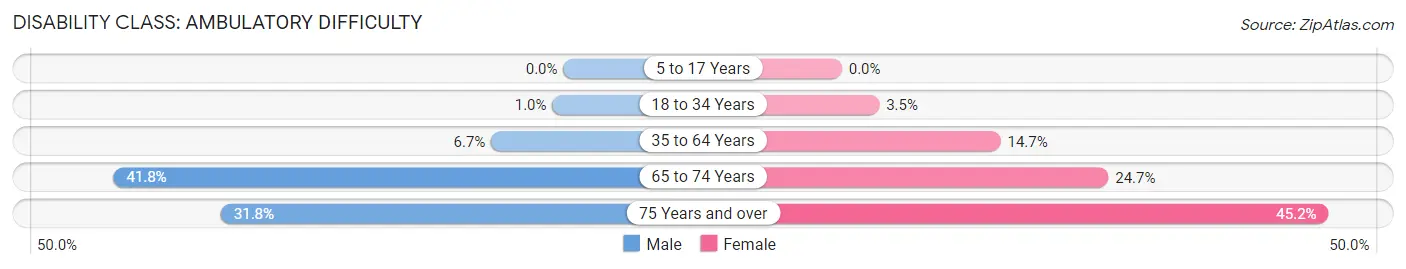
| Age Bracket | Male | Female |
| 5 to 17 Years | 0 (0.0%) | 0 (0.0%) |
| 18 to 34 Years | 10 (1.0%) | 34 (3.5%) |
| 35 to 64 Years | 84 (6.7%) | 214 (14.7%) |
| 65 to 74 Years | 119 (41.7%) | 116 (24.7%) |
| 75 Years and over | 82 (31.8%) | 168 (45.2%) |
Disability Class: Self-Care Difficulty
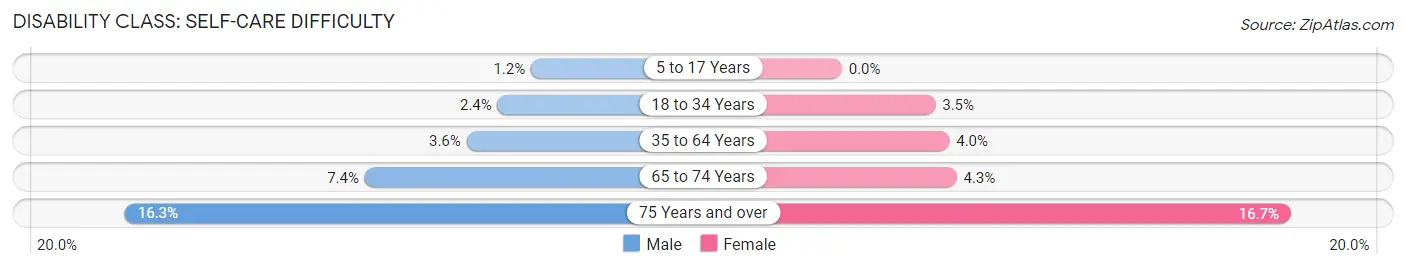
| Age Bracket | Male | Female |
| 5 to 17 Years | 9 (1.2%) | 0 (0.0%) |
| 18 to 34 Years | 24 (2.4%) | 34 (3.5%) |
| 35 to 64 Years | 45 (3.6%) | 58 (4.0%) |
| 65 to 74 Years | 21 (7.4%) | 20 (4.3%) |
| 75 Years and over | 42 (16.3%) | 62 (16.7%) |
Technology Access in Covington
Computing Device Access in Covington
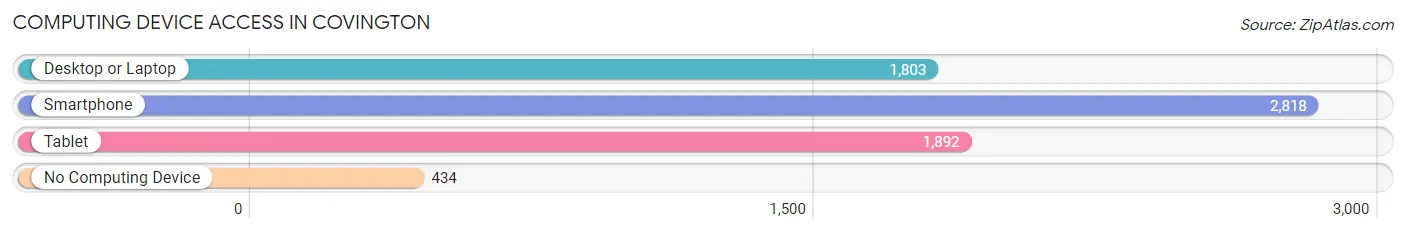
| Device Type | # Households | % Households |
| Desktop or Laptop | 1,803 | 51.5% |
| Smartphone | 2,818 | 80.5% |
| Tablet | 1,892 | 54.1% |
| No Computing Device | 434 | 12.4% |
| Total | 3,499 | 100.0% |
Internet Access in Covington
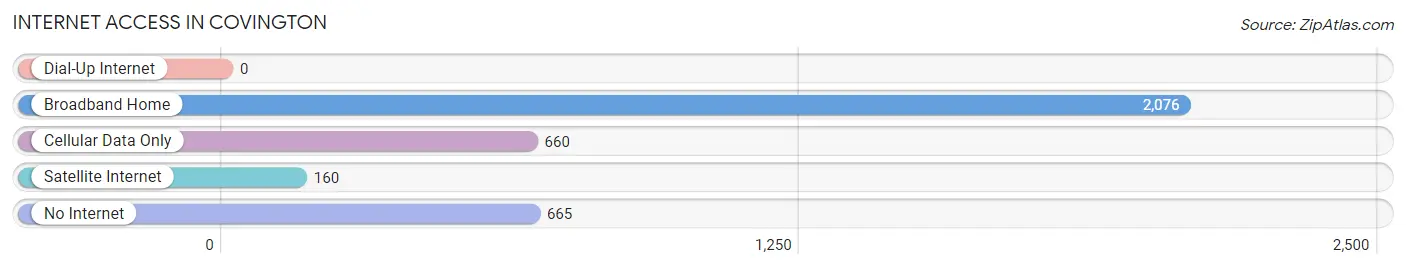
| Internet Type | # Households | % Households |
| Dial-Up Internet | 0 | 0.0% |
| Broadband Home | 2,076 | 59.3% |
| Cellular Data Only | 660 | 18.9% |
| Satellite Internet | 160 | 4.6% |
| No Internet | 665 | 19.0% |
| Total | 3,499 | 100.0% |
Covington Summary
Covington, Tennessee is a small city located in Tipton County, in the western part of the state. It is situated about 30 miles northeast of Memphis and is part of the Memphis metropolitan area. The city has a population of about 10,000 people and is the county seat of Tipton County.
History
Covington was founded in 1824 and was named after General Leonard Covington, a hero of the War of 1812. The city was originally a small farming community, but it began to grow in the late 19th century when the railroad was built through the area. The railroad brought new industry and jobs to the area, and the population began to grow.
In the early 20th century, Covington became a center for the cotton industry. The city was home to several cotton mills, and the industry provided jobs for many of the city’s residents. The city also became a center for the timber industry, and several sawmills were built in the area.
In the late 20th century, Covington began to experience a decline in its economy. Many of the cotton mills and sawmills closed, and the population began to decline. However, in recent years, the city has seen a resurgence in its economy. Several new businesses have opened in the area, and the population has begun to grow again.
Geography
Covington is located in the western part of Tennessee, in Tipton County. The city is situated about 30 miles northeast of Memphis and is part of the Memphis metropolitan area. The city is located on the banks of the Wolf River, and the city is surrounded by rolling hills and farmland.
The climate in Covington is humid subtropical, with hot, humid summers and mild winters. The average annual temperature is around 64 degrees Fahrenheit, and the average annual precipitation is around 45 inches.
Economy
Covington’s economy is largely based on manufacturing and agriculture. The city is home to several manufacturing plants, including a paper mill, a plastics plant, and a furniture factory. The city is also home to several agricultural businesses, including a dairy farm and a poultry farm.
The city is also home to several retail businesses, including several restaurants, a grocery store, and several clothing stores. The city is also home to several medical facilities, including a hospital and several clinics.
Demographics
As of the 2010 census, Covington had a population of 10,039 people. The racial makeup of the city was 79.3% White, 17.2% African American, 0.4% Native American, 0.7% Asian, 0.1% Pacific Islander, and 2.3% from other races. Hispanic or Latino of any race were 2.7% of the population.
The median household income in Covington was $37,945, and the median family income was $45,938. The per capita income was $20,845. About 17.2% of the population was below the poverty line.
Covington is a small city with a rich history and a diverse economy. The city has experienced a resurgence in recent years, and the population is growing again. The city is home to several manufacturing and agricultural businesses, as well as several retail businesses. The city is also home to several medical facilities, and the median household income is above the state average.
Common Questions
What is Per Capita Income in Covington?
Per Capita income in Covington is $23,396.
What is the Median Family Income in Covington?
Median Family Income in Covington is $46,201.
What is the Median Household income in Covington?
Median Household Income in Covington is $44,384.
What is Income or Wage Gap in Covington?
Income or Wage Gap in Covington is 18.3%.
Women in Covington earn 81.7 cents for every dollar earned by a man.
What is Family Income Deficit in Covington?
Family Income Deficit in Covington is $12,880.
Families that are below poverty line in Covington earn $12,880 less on average than the poverty threshold level.
What is Inequality or Gini Index in Covington?
Inequality or Gini Index in Covington is 0.41.
What is the Total Population of Covington?
Total Population of Covington is 8,644.
What is the Total Male Population of Covington?
Total Male Population of Covington is 4,012.
What is the Total Female Population of Covington?
Total Female Population of Covington is 4,632.
What is the Ratio of Males per 100 Females in Covington?
There are 86.61 Males per 100 Females in Covington.
What is the Ratio of Females per 100 Males in Covington?
There are 115.45 Females per 100 Males in Covington.
What is the Median Population Age in Covington?
Median Population Age in Covington is 35.4 Years.
What is the Average Family Size in Covington
Average Family Size in Covington is 3.0 People.
What is the Average Household Size in Covington
Average Household Size in Covington is 2.4 People.
How Large is the Labor Force in Covington?
There are 3,649 People in the Labor Forcein in Covington.
What is the Percentage of People in the Labor Force in Covington?
55.1% of People are in the Labor Force in Covington.
What is the Unemployment Rate in Covington?
Unemployment Rate in Covington is 5.5%.