Mount Pleasant, TN Map & Demographics
Mount Pleasant Map
Mount Pleasant Overview
$29,685
PER CAPITA INCOME
$70,938
AVG FAMILY INCOME
$47,988
AVG HOUSEHOLD INCOME
7.6%
WAGE / INCOME GAP [ % ]
92.4¢/ $1
WAGE / INCOME GAP [ $ ]
0.53
INEQUALITY / GINI INDEX
4,781
TOTAL POPULATION
2,176
MALE POPULATION
2,605
FEMALE POPULATION
83.53
MALES / 100 FEMALES
119.72
FEMALES / 100 MALES
43.5
MEDIAN AGE
3.1
AVG FAMILY SIZE
2.4
AVG HOUSEHOLD SIZE
2,148
LABOR FORCE [ PEOPLE ]
54.3%
PERCENT IN LABOR FORCE
4.0%
UNEMPLOYMENT RATE
Mount Pleasant Zip Codes
Mount Pleasant Area Codes
Income in Mount Pleasant
Income Overview in Mount Pleasant
Per Capita Income in Mount Pleasant is $29,685, while median incomes of families and households are $70,938 and $47,988 respectively.
| Characteristic | Number | Measure |
| Per Capita Income | 4,781 | $29,685 |
| Median Family Income | 1,146 | $70,938 |
| Mean Family Income | 1,146 | $92,865 |
| Median Household Income | 1,999 | $47,988 |
| Mean Household Income | 1,999 | $66,943 |
| Income Deficit | 1,146 | $0 |
| Wage / Income Gap (%) | 4,781 | 7.58% |
| Wage / Income Gap ($) | 4,781 | 92.42¢ per $1 |
| Gini / Inequality Index | 4,781 | 0.53 |
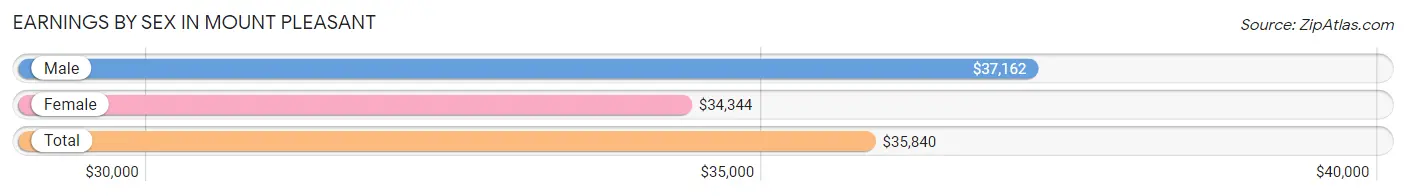
Earnings by Sex in Mount Pleasant
Average Earnings in Mount Pleasant are $35,840, $37,162 for men and $34,344 for women, a difference of 7.6%.
| Sex | Number | Average Earnings |
| Male | 1,052 (47.7%) | $37,162 |
| Female | 1,155 (52.3%) | $34,344 |
| Total | 2,207 (100.0%) | $35,840 |
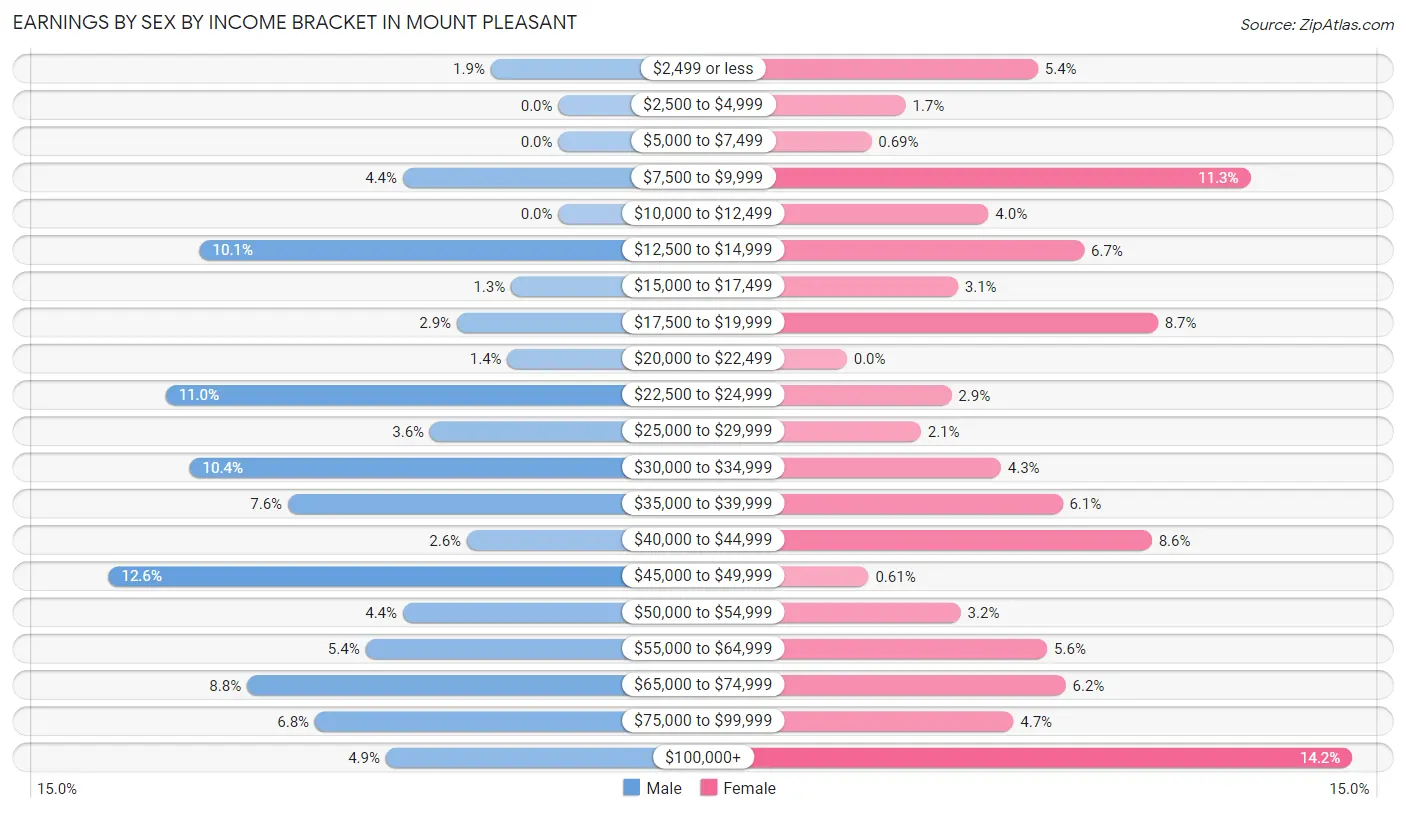
Earnings by Sex by Income Bracket in Mount Pleasant
The most common earnings brackets in Mount Pleasant are $45,000 to $49,999 for men (133 | 12.6%) and $100,000+ for women (164 | 14.2%).
| Income | Male | Female |
| $2,499 or less | 20 (1.9%) | 62 (5.4%) |
| $2,500 to $4,999 | 0 (0.0%) | 19 (1.7%) |
| $5,000 to $7,499 | 0 (0.0%) | 8 (0.7%) |
| $7,500 to $9,999 | 46 (4.4%) | 131 (11.3%) |
| $10,000 to $12,499 | 0 (0.0%) | 46 (4.0%) |
| $12,500 to $14,999 | 106 (10.1%) | 77 (6.7%) |
| $15,000 to $17,499 | 14 (1.3%) | 36 (3.1%) |
| $17,500 to $19,999 | 30 (2.9%) | 101 (8.7%) |
| $20,000 to $22,499 | 15 (1.4%) | 0 (0.0%) |
| $22,500 to $24,999 | 116 (11.0%) | 34 (2.9%) |
| $25,000 to $29,999 | 38 (3.6%) | 24 (2.1%) |
| $30,000 to $34,999 | 109 (10.4%) | 50 (4.3%) |
| $35,000 to $39,999 | 80 (7.6%) | 70 (6.1%) |
| $40,000 to $44,999 | 27 (2.6%) | 99 (8.6%) |
| $45,000 to $49,999 | 133 (12.6%) | 7 (0.6%) |
| $50,000 to $54,999 | 46 (4.4%) | 37 (3.2%) |
| $55,000 to $64,999 | 57 (5.4%) | 65 (5.6%) |
| $65,000 to $74,999 | 92 (8.7%) | 71 (6.1%) |
| $75,000 to $99,999 | 72 (6.8%) | 54 (4.7%) |
| $100,000+ | 51 (4.9%) | 164 (14.2%) |
| Total | 1,052 (100.0%) | 1,155 (100.0%) |
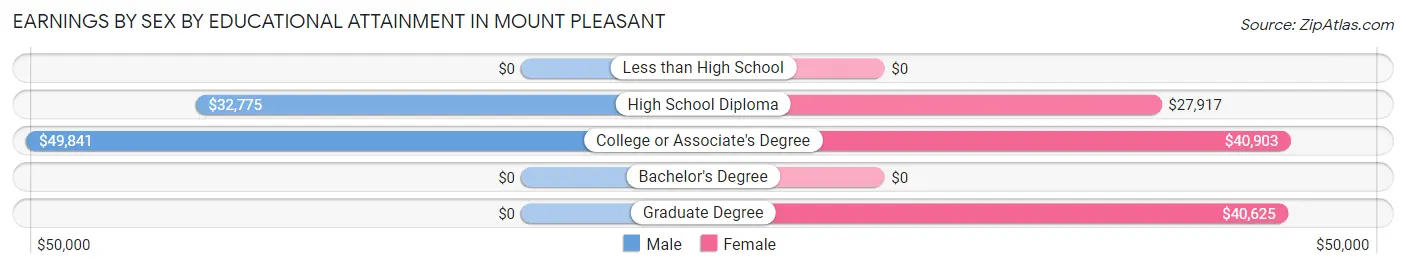
Earnings by Sex by Educational Attainment in Mount Pleasant
Average earnings in Mount Pleasant are $43,672 for men and $40,016 for women, a difference of 8.4%. Men with an educational attainment of college or associate's degree enjoy the highest average annual earnings of $49,841, while those with high school diploma education earn the least with $32,775. Women with an educational attainment of college or associate's degree earn the most with the average annual earnings of $40,903, while those with high school diploma education have the smallest earnings of $27,917.
| Educational Attainment | Male Income | Female Income |
| Less than High School | - | - |
| High School Diploma | $32,775 | $27,917 |
| College or Associate's Degree | $49,841 | $40,903 |
| Bachelor's Degree | - | - |
| Graduate Degree | - | - |
| Total | $43,672 | $40,016 |
Family Income in Mount Pleasant
Family Income Brackets in Mount Pleasant
According to the Mount Pleasant family income data, there are 206 families falling into the $100,000 to $149,999 income range, which is the most common income bracket and makes up 18.0% of all families. Conversely, the $25,000 to $34,999 income bracket is the least frequent group with only 21 families (1.8%) belonging to this category.
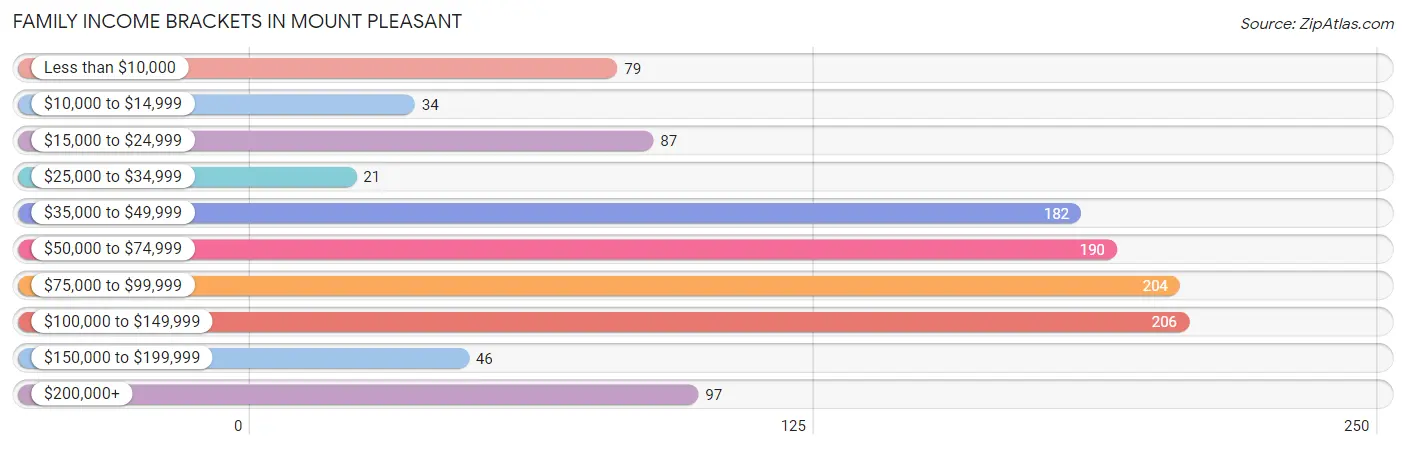
| Income Bracket | # Families | % Families |
| Less than $10,000 | 79 | 6.9% |
| $10,000 to $14,999 | 34 | 3.0% |
| $15,000 to $24,999 | 87 | 7.6% |
| $25,000 to $34,999 | 21 | 1.8% |
| $35,000 to $49,999 | 182 | 15.9% |
| $50,000 to $74,999 | 190 | 16.6% |
| $75,000 to $99,999 | 204 | 17.8% |
| $100,000 to $149,999 | 206 | 18.0% |
| $150,000 to $199,999 | 46 | 4.0% |
| $200,000+ | 97 | 8.5% |
Family Income by Famaliy Size in Mount Pleasant
5-person families (60 | 5.2%) account for the highest median family income in Mount Pleasant with $117,656 per family, while 2-person families (536 | 46.8%) have the highest median income of $31,595 per family member.
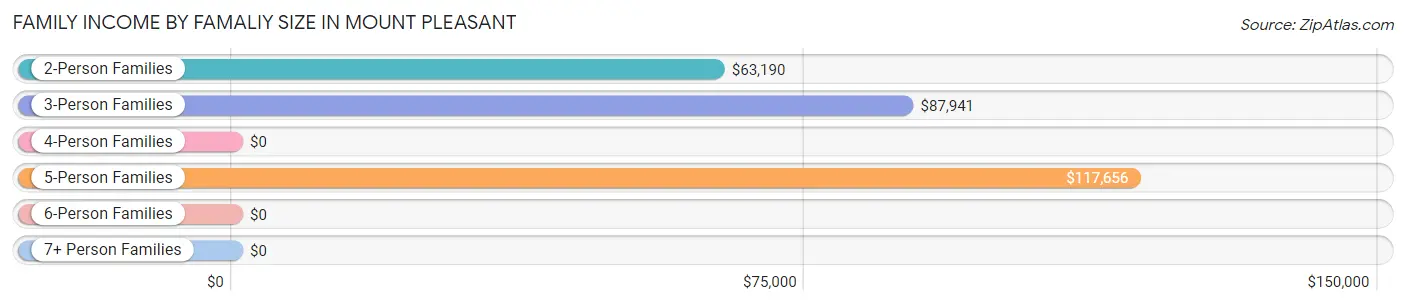
| Income Bracket | # Families | Median Income |
| 2-Person Families | 536 (46.8%) | $63,190 |
| 3-Person Families | 344 (30.0%) | $87,941 |
| 4-Person Families | 178 (15.5%) | $0 |
| 5-Person Families | 60 (5.2%) | $117,656 |
| 6-Person Families | 11 (1.0%) | $0 |
| 7+ Person Families | 17 (1.5%) | $0 |
| Total | 1,146 (100.0%) | $70,938 |
Family Income by Number of Earners in Mount Pleasant
The median family income in Mount Pleasant is $70,938, with families comprising 3+ earners (107) having the highest median family income of $119,258, while families with no earners (193) have the lowest median family income of $20,754, accounting for 9.3% and 16.8% of families, respectively.
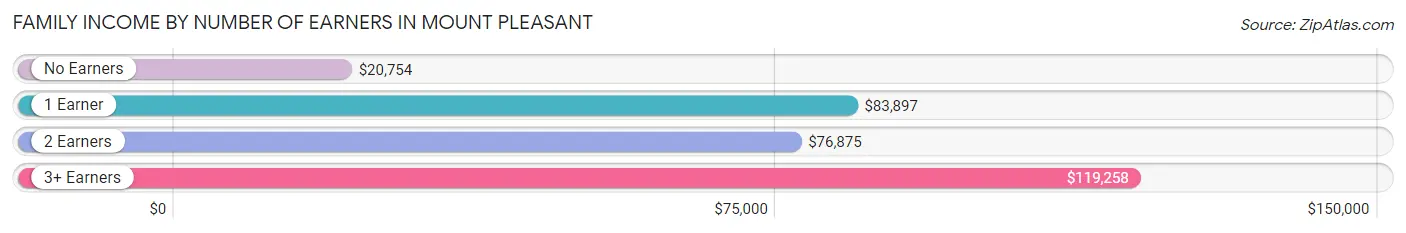
| Number of Earners | # Families | Median Income |
| No Earners | 193 (16.8%) | $20,754 |
| 1 Earner | 462 (40.3%) | $83,897 |
| 2 Earners | 384 (33.5%) | $76,875 |
| 3+ Earners | 107 (9.3%) | $119,258 |
| Total | 1,146 (100.0%) | $70,938 |
Household Income in Mount Pleasant
Household Income Brackets in Mount Pleasant
With 304 households falling in the category, the $35,000 to $49,999 income range is the most frequent in Mount Pleasant, accounting for 15.2% of all households. In contrast, only 80 households (4.0%) fall into the $150,000 to $199,999 income bracket, making it the least populous group.
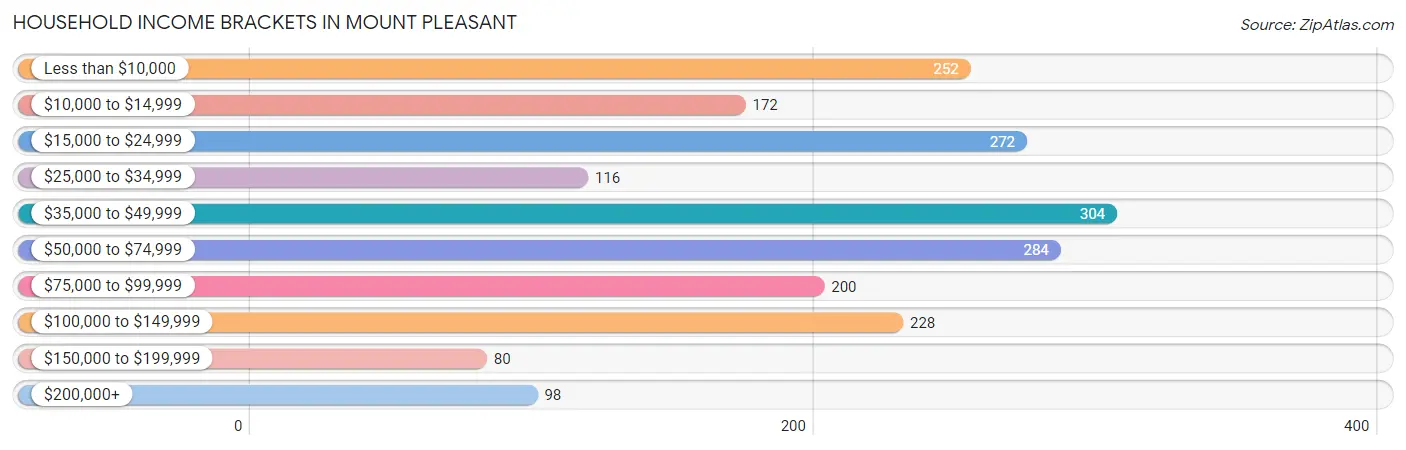
| Income Bracket | # Households | % Households |
| Less than $10,000 | 252 | 12.6% |
| $10,000 to $14,999 | 172 | 8.6% |
| $15,000 to $24,999 | 272 | 13.6% |
| $25,000 to $34,999 | 116 | 5.8% |
| $35,000 to $49,999 | 304 | 15.2% |
| $50,000 to $74,999 | 284 | 14.2% |
| $75,000 to $99,999 | 200 | 10.0% |
| $100,000 to $149,999 | 228 | 11.4% |
| $150,000 to $199,999 | 80 | 4.0% |
| $200,000+ | 98 | 4.9% |
Household Income by Householder Age in Mount Pleasant
The median household income in Mount Pleasant is $47,988, with the highest median household income of $64,688 found in the 25 to 44 years age bracket for the primary householder. A total of 577 households (28.9%) fall into this category. Meanwhile, the 15 to 24 years age bracket for the primary householder has the lowest median household income of $0, with 105 households (5.2%) in this group.
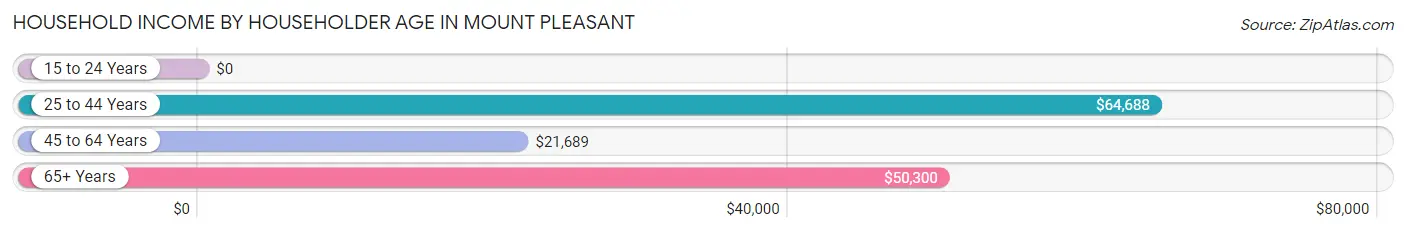
| Income Bracket | # Households | Median Income |
| 15 to 24 Years | 105 (5.2%) | $0 |
| 25 to 44 Years | 577 (28.9%) | $64,688 |
| 45 to 64 Years | 861 (43.1%) | $21,689 |
| 65+ Years | 456 (22.8%) | $50,300 |
| Total | 1,999 (100.0%) | $47,988 |
Poverty in Mount Pleasant
Income Below Poverty by Sex and Age in Mount Pleasant
With 20.5% poverty level for males and 29.5% for females among the residents of Mount Pleasant, 5 year old males and 6 to 11 year old females are the most vulnerable to poverty, with 25 males (100.0%) and 151 females (79.1%) in their respective age groups living below the poverty level.
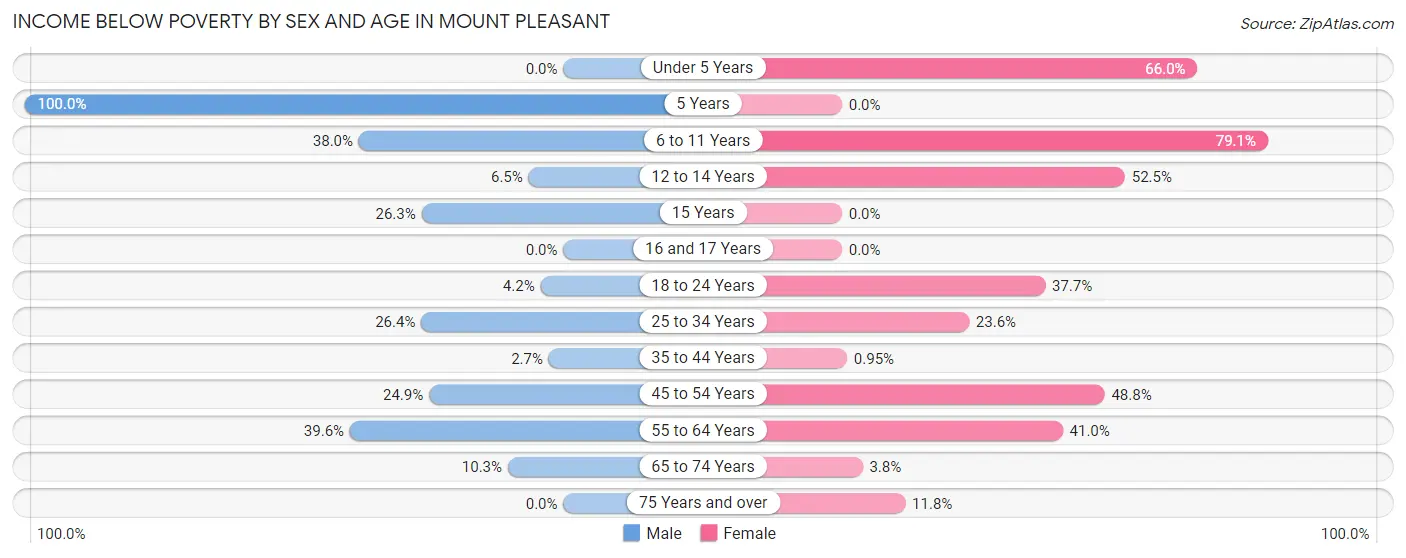
| Age Bracket | Male | Female |
| Under 5 Years | 0 (0.0%) | 33 (66.0%) |
| 5 Years | 25 (100.0%) | 0 (0.0%) |
| 6 to 11 Years | 41 (38.0%) | 151 (79.1%) |
| 12 to 14 Years | 10 (6.5%) | 52 (52.5%) |
| 15 Years | 10 (26.3%) | 0 (0.0%) |
| 16 and 17 Years | 0 (0.0%) | 0 (0.0%) |
| 18 to 24 Years | 5 (4.2%) | 103 (37.7%) |
| 25 to 34 Years | 67 (26.4%) | 71 (23.6%) |
| 35 to 44 Years | 4 (2.7%) | 4 (0.9%) |
| 45 to 54 Years | 86 (24.9%) | 138 (48.8%) |
| 55 to 64 Years | 168 (39.6%) | 182 (41.0%) |
| 65 to 74 Years | 24 (10.3%) | 10 (3.8%) |
| 75 Years and over | 0 (0.0%) | 16 (11.8%) |
| Total | 440 (20.5%) | 760 (29.5%) |
Income Above Poverty by Sex and Age in Mount Pleasant
According to the poverty statistics in Mount Pleasant, males aged under 5 years and females aged 15 years are the age groups that are most secure financially, with 100.0% of males and 100.0% of females in these age groups living above the poverty line.
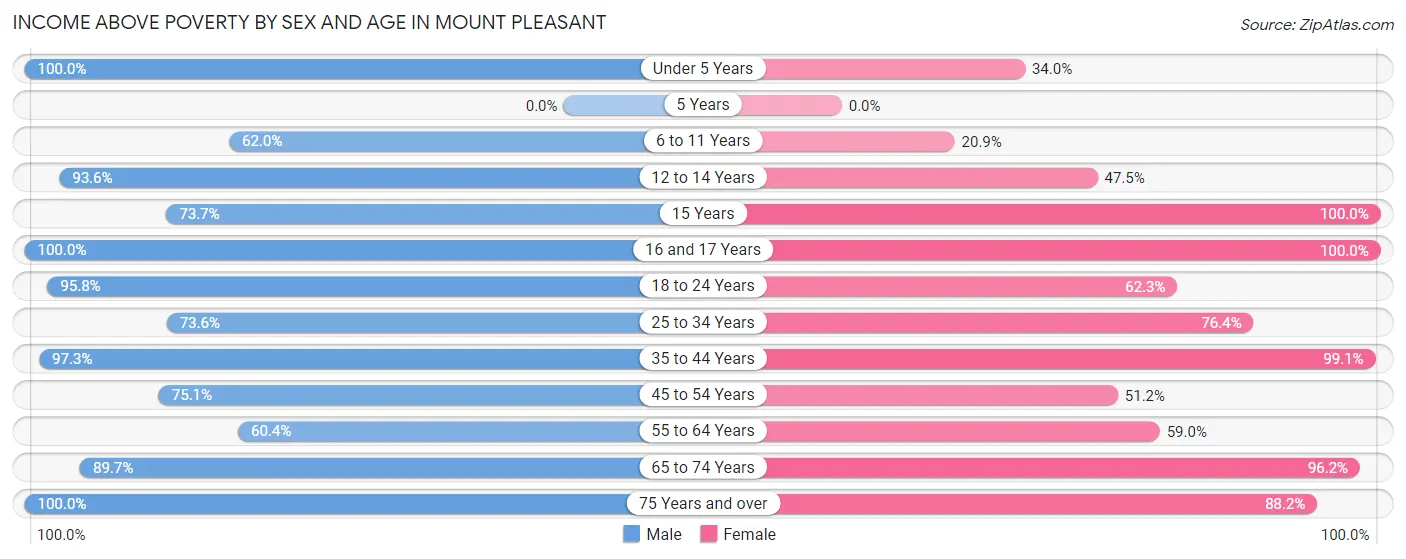
| Age Bracket | Male | Female |
| Under 5 Years | 97 (100.0%) | 17 (34.0%) |
| 5 Years | 0 (0.0%) | 0 (0.0%) |
| 6 to 11 Years | 67 (62.0%) | 40 (20.9%) |
| 12 to 14 Years | 145 (93.5%) | 47 (47.5%) |
| 15 Years | 28 (73.7%) | 62 (100.0%) |
| 16 and 17 Years | 126 (100.0%) | 53 (100.0%) |
| 18 to 24 Years | 113 (95.8%) | 170 (62.3%) |
| 25 to 34 Years | 187 (73.6%) | 230 (76.4%) |
| 35 to 44 Years | 144 (97.3%) | 417 (99.1%) |
| 45 to 54 Years | 259 (75.1%) | 145 (51.2%) |
| 55 to 64 Years | 256 (60.4%) | 262 (59.0%) |
| 65 to 74 Years | 209 (89.7%) | 251 (96.2%) |
| 75 Years and over | 80 (100.0%) | 120 (88.2%) |
| Total | 1,711 (79.5%) | 1,814 (70.5%) |
Income Below Poverty Among Married-Couple Families in Mount Pleasant
The poverty statistics for married-couple families in Mount Pleasant show that 4.9% or 33 of the total 673 families live below the poverty line. Families with 1 or 2 children have the highest poverty rate of 13.8%, comprising of 33 families. On the other hand, families with no children have the lowest poverty rate of 0.0%, which includes 0 families.
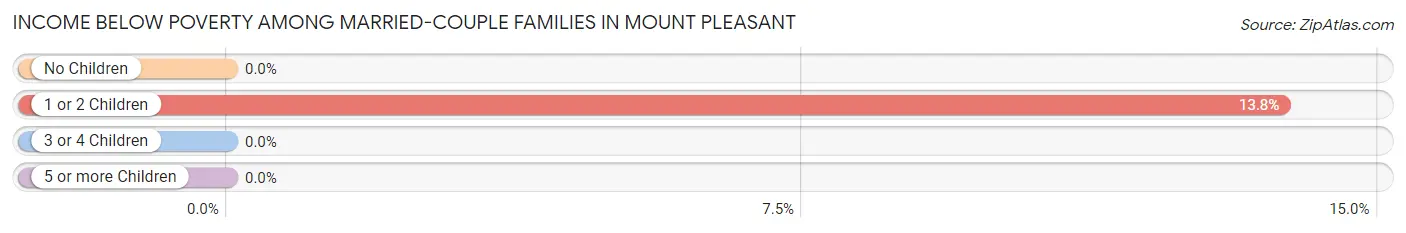
| Children | Above Poverty | Below Poverty |
| No Children | 402 (100.0%) | 0 (0.0%) |
| 1 or 2 Children | 207 (86.3%) | 33 (13.8%) |
| 3 or 4 Children | 20 (100.0%) | 0 (0.0%) |
| 5 or more Children | 11 (100.0%) | 0 (0.0%) |
| Total | 640 (95.1%) | 33 (4.9%) |
Income Below Poverty Among Single-Parent Households in Mount Pleasant
According to the poverty data in Mount Pleasant, 59.6% or 53 single-father households and 29.7% or 114 single-mother households are living below the poverty line. Among single-father households, those with 1 or 2 children have the highest poverty rate, with 16 households (100.0%) experiencing poverty. Likewise, among single-mother households, those with 3 or 4 children have the highest poverty rate, with 58 households (100.0%) falling below the poverty line.
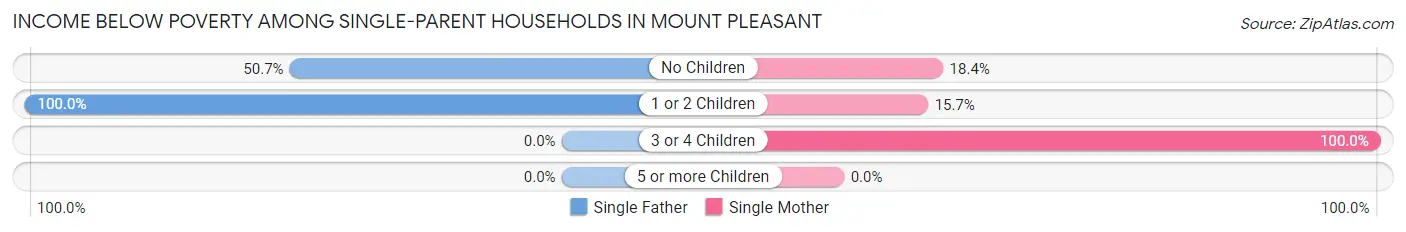
| Children | Single Father | Single Mother |
| No Children | 37 (50.7%) | 33 (18.4%) |
| 1 or 2 Children | 16 (100.0%) | 23 (15.7%) |
| 3 or 4 Children | 0 (0.0%) | 58 (100.0%) |
| 5 or more Children | 0 (0.0%) | 0 (0.0%) |
| Total | 53 (59.6%) | 114 (29.7%) |
Income Below Poverty Among Married-Couple vs Single-Parent Households in Mount Pleasant
The poverty data for Mount Pleasant shows that 33 of the married-couple family households (4.9%) and 167 of the single-parent households (35.3%) are living below the poverty level. Within the married-couple family households, those with 1 or 2 children have the highest poverty rate, with 33 households (13.8%) falling below the poverty line. Among the single-parent households, those with 3 or 4 children have the highest poverty rate, with 58 household (100.0%) living below poverty.
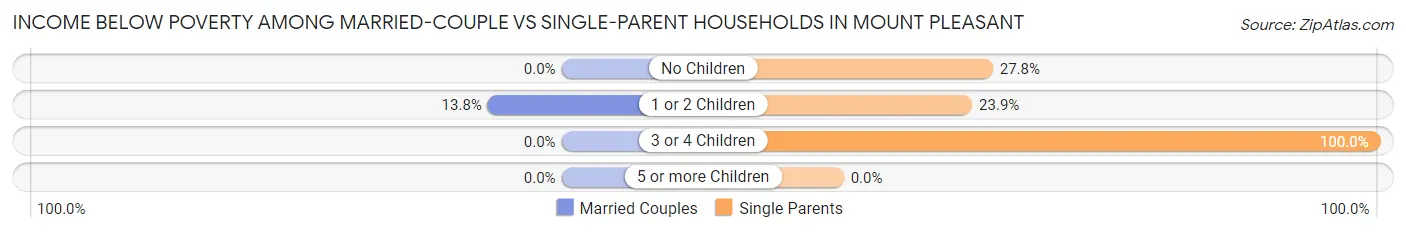
| Children | Married-Couple Families | Single-Parent Households |
| No Children | 0 (0.0%) | 70 (27.8%) |
| 1 or 2 Children | 33 (13.8%) | 39 (23.9%) |
| 3 or 4 Children | 0 (0.0%) | 58 (100.0%) |
| 5 or more Children | 0 (0.0%) | 0 (0.0%) |
| Total | 33 (4.9%) | 167 (35.3%) |
Race in Mount Pleasant
The most populous races in Mount Pleasant are White / Caucasian (3,230 | 67.6%), Black / African American (1,110 | 23.2%), and Two or more Races (414 | 8.7%).
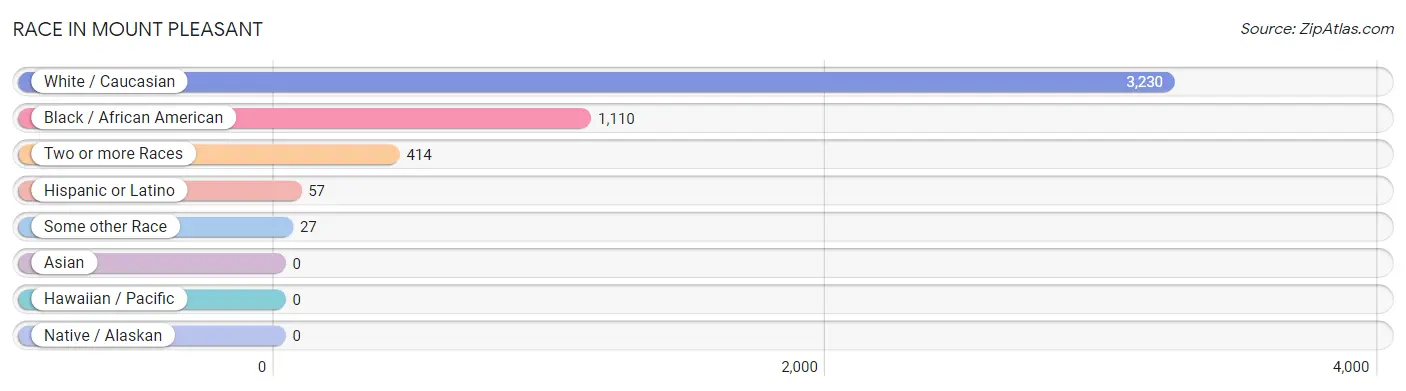
| Race | # Population | % Population |
| Asian | 0 | 0.0% |
| Black / African American | 1,110 | 23.2% |
| Hawaiian / Pacific | 0 | 0.0% |
| Hispanic or Latino | 57 | 1.2% |
| Native / Alaskan | 0 | 0.0% |
| White / Caucasian | 3,230 | 67.6% |
| Two or more Races | 414 | 8.7% |
| Some other Race | 27 | 0.6% |
| Total | 4,781 | 100.0% |
Ancestry in Mount Pleasant
The most populous ancestries reported in Mount Pleasant are American (638 | 13.3%), Irish (394 | 8.2%), English (381 | 8.0%), German (323 | 6.8%), and African (305 | 6.4%), together accounting for 42.7% of all Mount Pleasant residents.
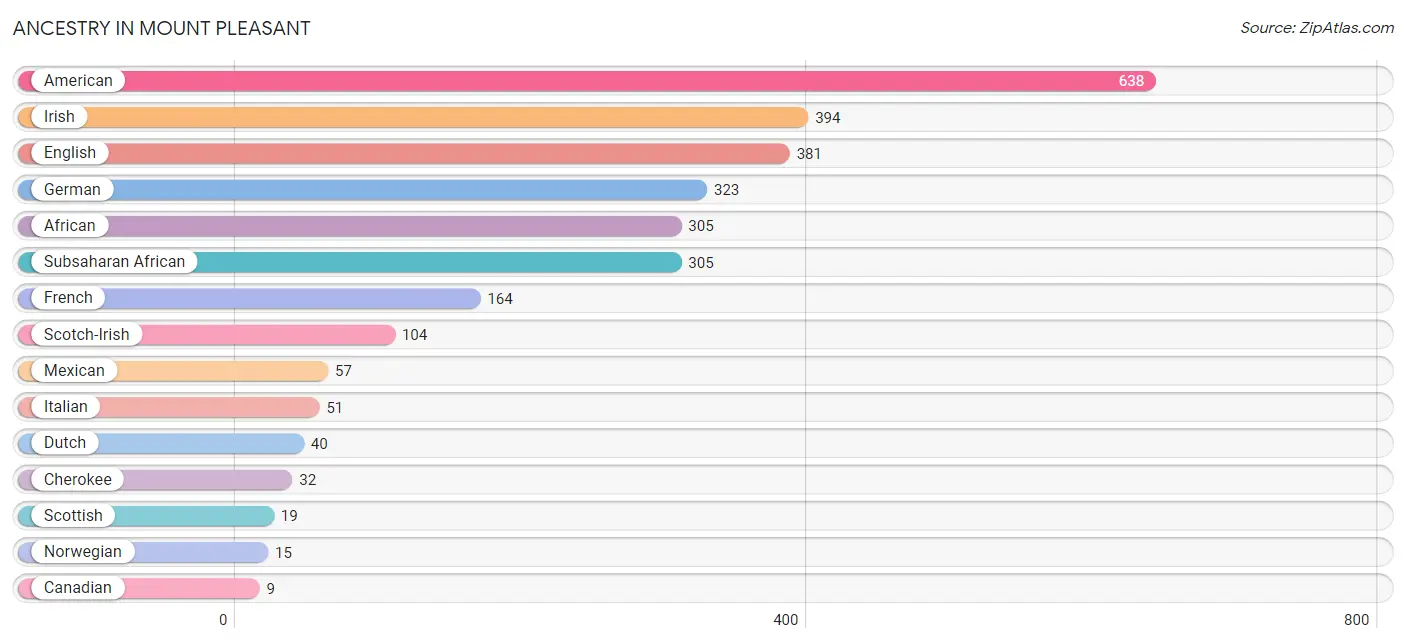
| Ancestry | # Population | % Population |
| African | 305 | 6.4% |
| American | 638 | 13.3% |
| Canadian | 9 | 0.2% |
| Cherokee | 32 | 0.7% |
| Dutch | 40 | 0.8% |
| English | 381 | 8.0% |
| French | 164 | 3.4% |
| German | 323 | 6.8% |
| Irish | 394 | 8.2% |
| Italian | 51 | 1.1% |
| Mexican | 57 | 1.2% |
| Norwegian | 15 | 0.3% |
| Russian | 9 | 0.2% |
| Scotch-Irish | 104 | 2.2% |
| Scottish | 19 | 0.4% |
| Subsaharan African | 305 | 6.4% | View All 16 Rows |
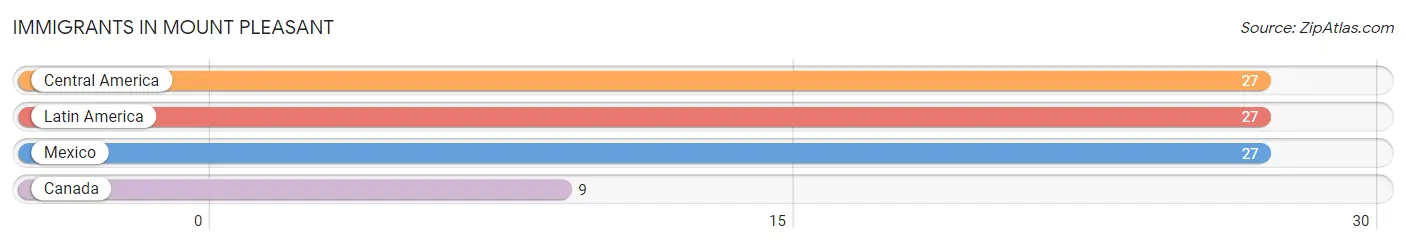
Immigrants in Mount Pleasant
The most numerous immigrant groups reported in Mount Pleasant came from Central America (27 | 0.6%), Latin America (27 | 0.6%), Mexico (27 | 0.6%), and Canada (9 | 0.2%), together accounting for 1.9% of all Mount Pleasant residents.
| Immigration Origin | # Population | % Population |
| Canada | 9 | 0.2% |
| Central America | 27 | 0.6% |
| Latin America | 27 | 0.6% |
| Mexico | 27 | 0.6% | View All 4 Rows |
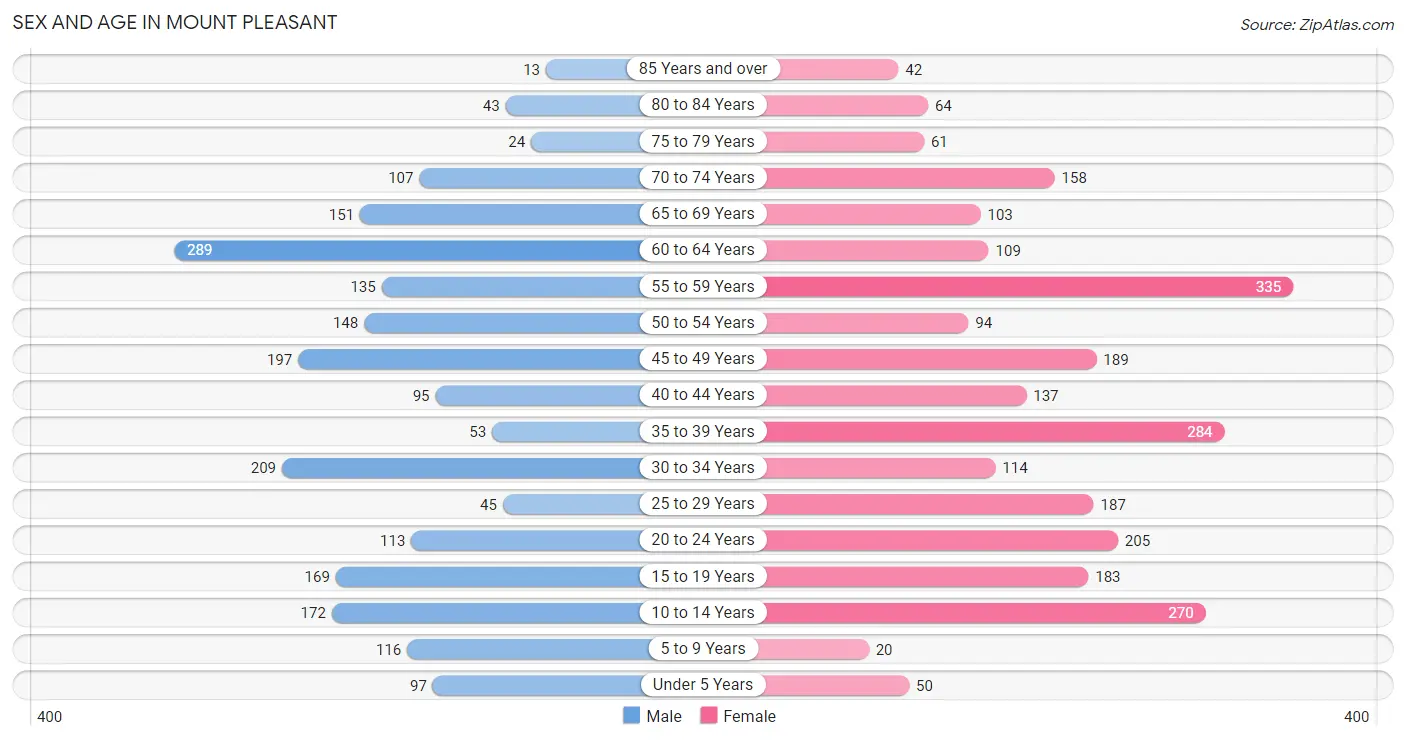
Sex and Age in Mount Pleasant
Sex and Age in Mount Pleasant
The most populous age groups in Mount Pleasant are 60 to 64 Years (289 | 13.3%) for men and 55 to 59 Years (335 | 12.9%) for women.
| Age Bracket | Male | Female |
| Under 5 Years | 97 (4.5%) | 50 (1.9%) |
| 5 to 9 Years | 116 (5.3%) | 20 (0.8%) |
| 10 to 14 Years | 172 (7.9%) | 270 (10.4%) |
| 15 to 19 Years | 169 (7.8%) | 183 (7.0%) |
| 20 to 24 Years | 113 (5.2%) | 205 (7.9%) |
| 25 to 29 Years | 45 (2.1%) | 187 (7.2%) |
| 30 to 34 Years | 209 (9.6%) | 114 (4.4%) |
| 35 to 39 Years | 53 (2.4%) | 284 (10.9%) |
| 40 to 44 Years | 95 (4.4%) | 137 (5.3%) |
| 45 to 49 Years | 197 (9.0%) | 189 (7.3%) |
| 50 to 54 Years | 148 (6.8%) | 94 (3.6%) |
| 55 to 59 Years | 135 (6.2%) | 335 (12.9%) |
| 60 to 64 Years | 289 (13.3%) | 109 (4.2%) |
| 65 to 69 Years | 151 (6.9%) | 103 (4.0%) |
| 70 to 74 Years | 107 (4.9%) | 158 (6.1%) |
| 75 to 79 Years | 24 (1.1%) | 61 (2.3%) |
| 80 to 84 Years | 43 (2.0%) | 64 (2.5%) |
| 85 Years and over | 13 (0.6%) | 42 (1.6%) |
| Total | 2,176 (100.0%) | 2,605 (100.0%) |
Families and Households in Mount Pleasant
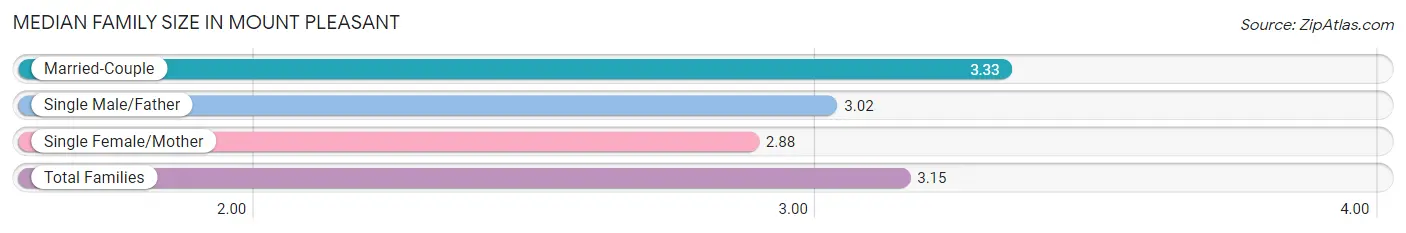
Median Family Size in Mount Pleasant
The median family size in Mount Pleasant is 3.15 persons per family, with married-couple families (673 | 58.7%) accounting for the largest median family size of 3.33 persons per family. On the other hand, single female/mother families (384 | 33.5%) represent the smallest median family size with 2.88 persons per family.
| Family Type | # Families | Family Size |
| Married-Couple | 673 (58.7%) | 3.33 |
| Single Male/Father | 89 (7.8%) | 3.02 |
| Single Female/Mother | 384 (33.5%) | 2.88 |
| Total Families | 1,146 (100.0%) | 3.15 |
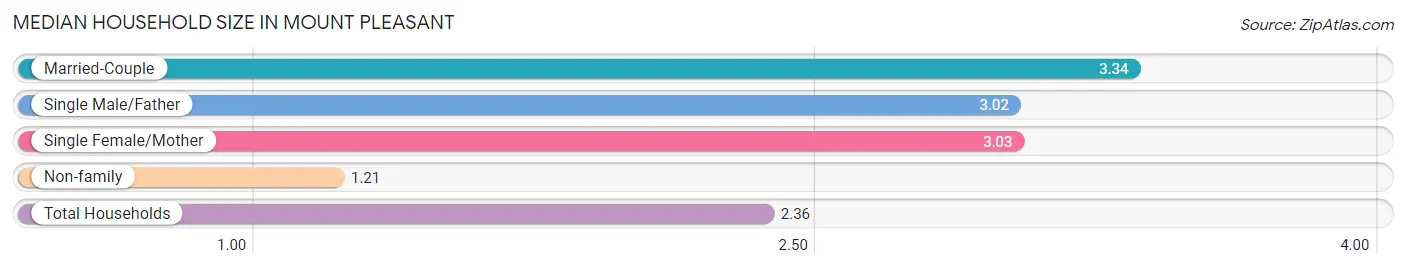
Median Household Size in Mount Pleasant
The median household size in Mount Pleasant is 2.36 persons per household, with married-couple households (673 | 33.7%) accounting for the largest median household size of 3.34 persons per household. non-family households (853 | 42.7%) represent the smallest median household size with 1.21 persons per household.
| Household Type | # Households | Household Size |
| Married-Couple | 673 (33.7%) | 3.34 |
| Single Male/Father | 89 (4.4%) | 3.02 |
| Single Female/Mother | 384 (19.2%) | 3.03 |
| Non-family | 853 (42.7%) | 1.21 |
| Total Households | 1,999 (100.0%) | 2.36 |
Household Size by Marriage Status in Mount Pleasant
Out of a total of 1,999 households in Mount Pleasant, 1,146 (57.3%) are family households, while 853 (42.7%) are nonfamily households. The most numerous type of family households are 2-person households, comprising 516, and the most common type of nonfamily households are 1-person households, comprising 714.
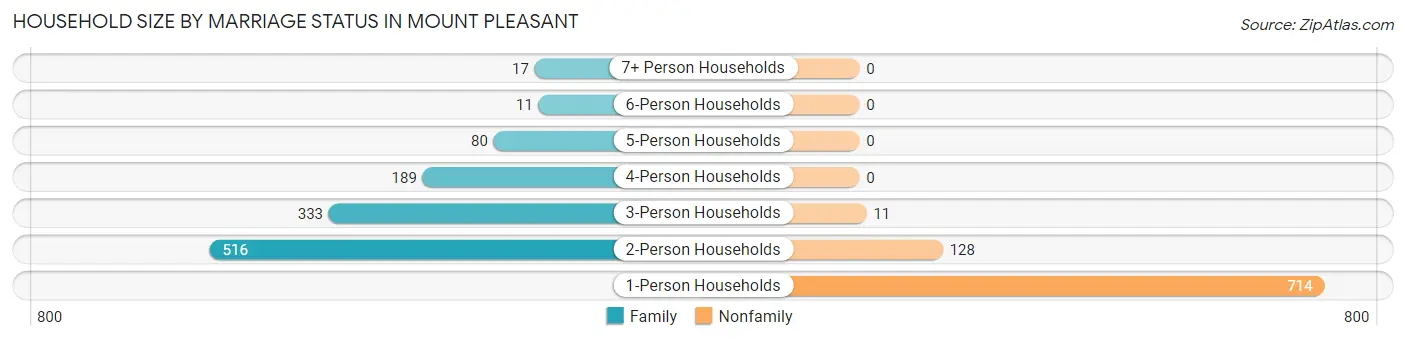
| Household Size | Family Households | Nonfamily Households |
| 1-Person Households | - | 714 (35.7%) |
| 2-Person Households | 516 (25.8%) | 128 (6.4%) |
| 3-Person Households | 333 (16.7%) | 11 (0.5%) |
| 4-Person Households | 189 (9.5%) | 0 (0.0%) |
| 5-Person Households | 80 (4.0%) | 0 (0.0%) |
| 6-Person Households | 11 (0.5%) | 0 (0.0%) |
| 7+ Person Households | 17 (0.9%) | 0 (0.0%) |
| Total | 1,146 (57.3%) | 853 (42.7%) |
Female Fertility in Mount Pleasant
Fertility by Age in Mount Pleasant
Average fertility rate in Mount Pleasant is 13.0 births per 1,000 women. Women in the age bracket of 20 to 34 years have the highest fertility rate with 34.0 births per 1,000 women. Women in the age bracket of 20 to 34 years acount for 100.0% of all women with births.
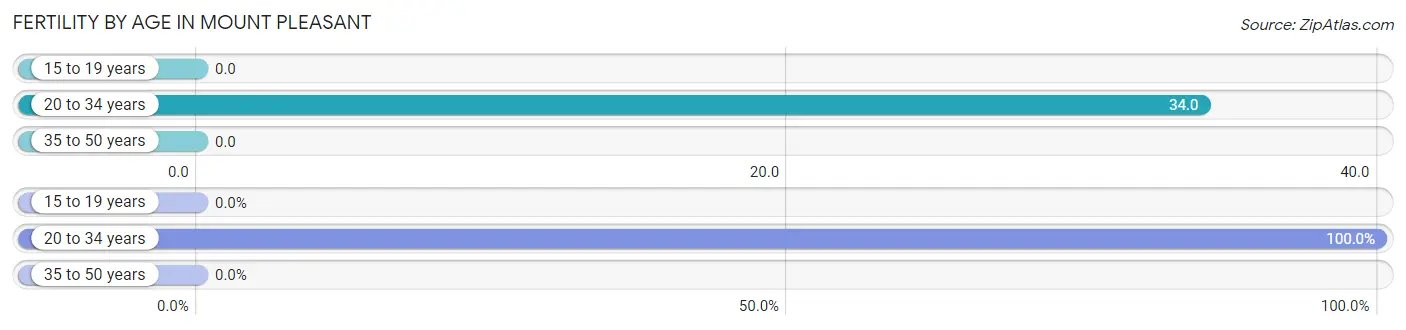
| Age Bracket | Women with Births | Births / 1,000 Women |
| 15 to 19 years | 0 (0.0%) | 0.0 |
| 20 to 34 years | 17 (100.0%) | 34.0 |
| 35 to 50 years | 0 (0.0%) | 0.0 |
| Total | 17 (100.0%) | 13.0 |
Fertility by Age by Marriage Status in Mount Pleasant
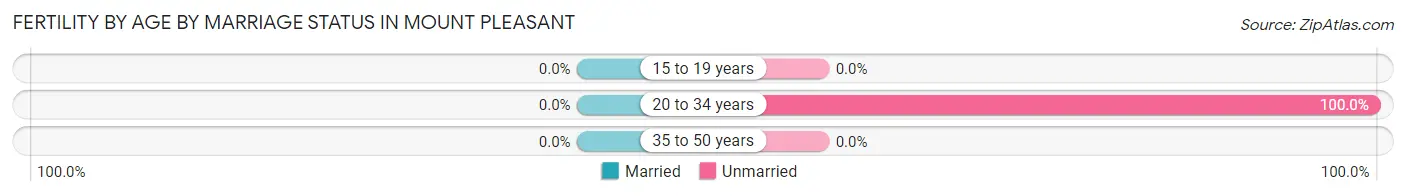
| Age Bracket | Married | Unmarried |
| 15 to 19 years | 0 (0.0%) | 0 (0.0%) |
| 20 to 34 years | 0 (0.0%) | 17 (100.0%) |
| 35 to 50 years | 0 (0.0%) | 0 (0.0%) |
| Total | 0 (0.0%) | 17 (100.0%) |
Fertility by Education in Mount Pleasant
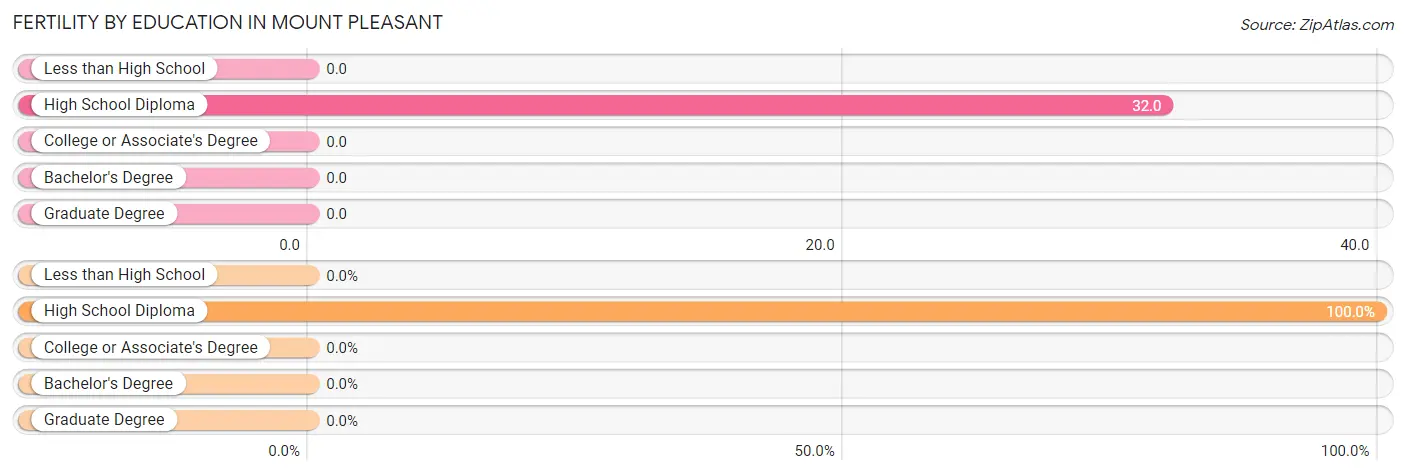
| Educational Attainment | Women with Births | Births / 1,000 Women |
| Less than High School | 0 (0.0%) | 0.0 |
| High School Diploma | 17 (100.0%) | 32.0 |
| College or Associate's Degree | 0 (0.0%) | 0.0 |
| Bachelor's Degree | 0 (0.0%) | 0.0 |
| Graduate Degree | 0 (0.0%) | 0.0 |
| Total | 17 (100.0%) | 13.0 |
Fertility by Education by Marriage Status in Mount Pleasant
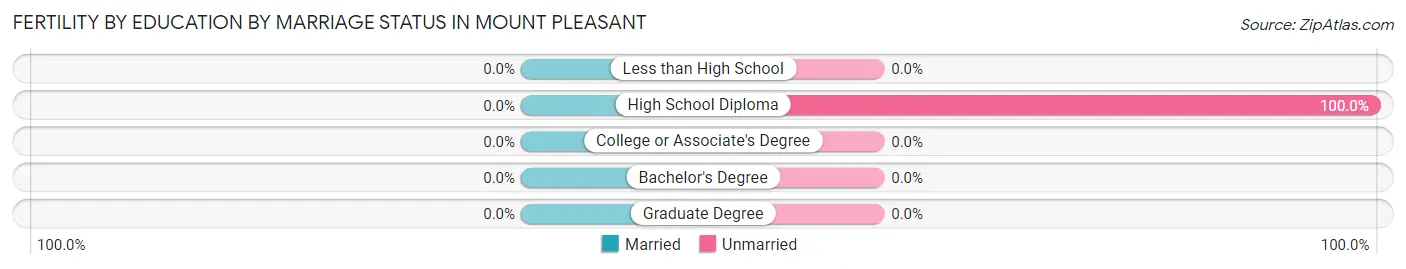
| Educational Attainment | Married | Unmarried |
| Less than High School | 0 (0.0%) | 0 (0.0%) |
| High School Diploma | 0 (0.0%) | 17 (100.0%) |
| College or Associate's Degree | 0 (0.0%) | 0 (0.0%) |
| Bachelor's Degree | 0 (0.0%) | 0 (0.0%) |
| Graduate Degree | 0 (0.0%) | 0 (0.0%) |
| Total | 0 (0.0%) | 17 (100.0%) |
Employment Characteristics in Mount Pleasant
Employment by Class of Employer in Mount Pleasant
Among the 1,972 employed individuals in Mount Pleasant, private company employees (1,370 | 69.5%), self-employed (not incorporated) (252 | 12.8%), and not-for-profit organizations (166 | 8.4%) make up the most common classes of employment.
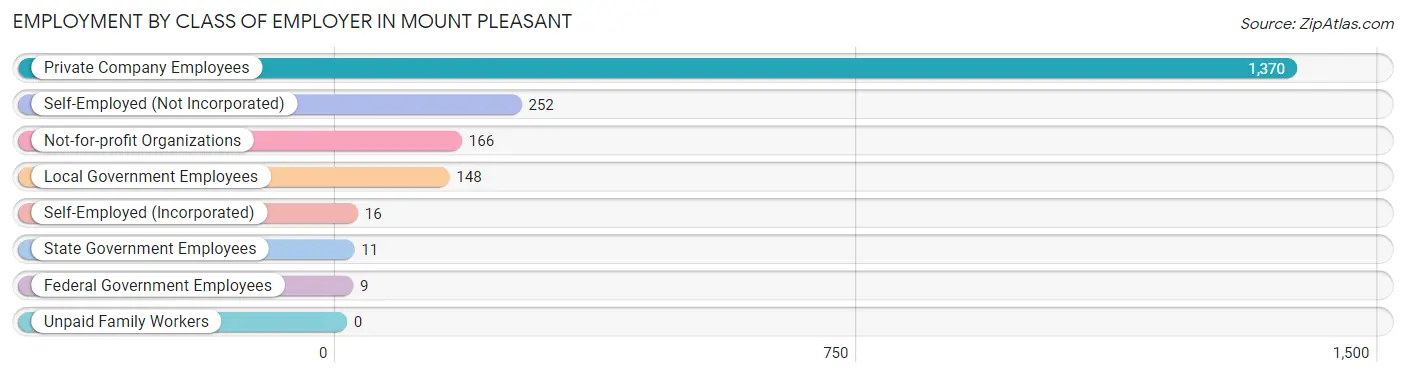
| Employer Class | # Employees | % Employees |
| Private Company Employees | 1,370 | 69.5% |
| Self-Employed (Incorporated) | 16 | 0.8% |
| Self-Employed (Not Incorporated) | 252 | 12.8% |
| Not-for-profit Organizations | 166 | 8.4% |
| Local Government Employees | 148 | 7.5% |
| State Government Employees | 11 | 0.6% |
| Federal Government Employees | 9 | 0.5% |
| Unpaid Family Workers | 0 | 0.0% |
| Total | 1,972 | 100.0% |
Employment Status by Age in Mount Pleasant
According to the labor force statistics for Mount Pleasant, out of the total population over 16 years of age (3,956), 54.3% or 2,148 individuals are in the labor force, with 4.0% or 86 of them unemployed. The age group with the highest labor force participation rate is 30 to 34 years, with 91.6% or 296 individuals in the labor force. Within the labor force, the 75 years and over age range has the highest percentage of unemployed individuals, with 100.0% or 33 of them being unemployed.
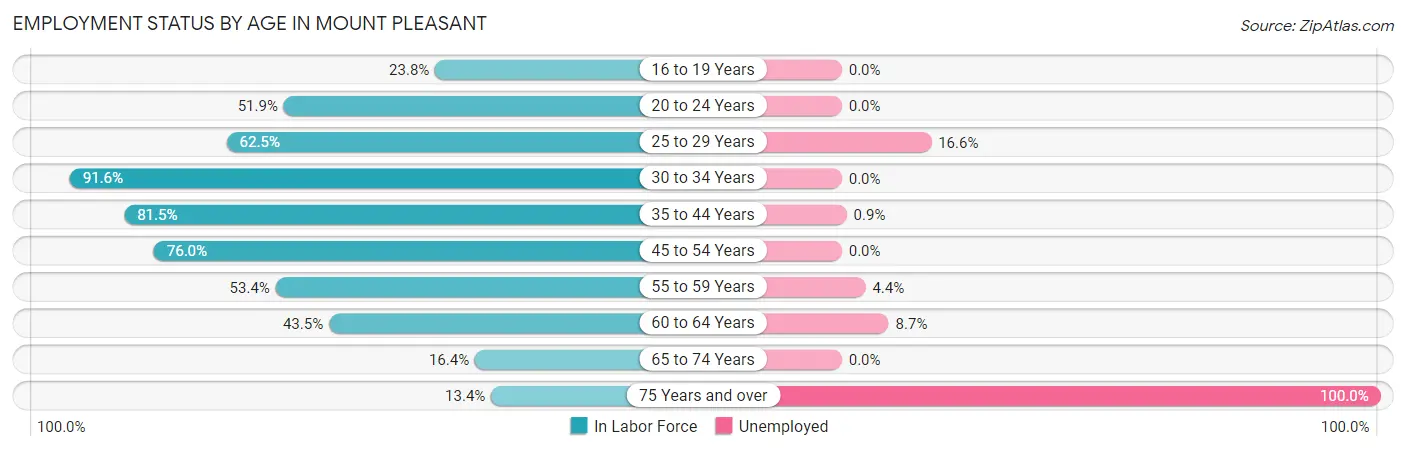
| Age Bracket | In Labor Force | Unemployed |
| 16 to 19 Years | 60 (23.8%) | 0 (0.0%) |
| 20 to 24 Years | 165 (51.9%) | 0 (0.0%) |
| 25 to 29 Years | 145 (62.5%) | 24 (16.6%) |
| 30 to 34 Years | 296 (91.6%) | 0 (0.0%) |
| 35 to 44 Years | 464 (81.5%) | 4 (0.9%) |
| 45 to 54 Years | 477 (76.0%) | 0 (0.0%) |
| 55 to 59 Years | 251 (53.4%) | 11 (4.4%) |
| 60 to 64 Years | 173 (43.5%) | 15 (8.7%) |
| 65 to 74 Years | 85 (16.4%) | 0 (0.0%) |
| 75 Years and over | 33 (13.4%) | 33 (100.0%) |
| Total | 2,148 (54.3%) | 86 (4.0%) |
Employment Status by Educational Attainment in Mount Pleasant
According to labor force statistics for Mount Pleasant, 68.9% of individuals (1,805) out of the total population between 25 and 64 years of age (2,620) are in the labor force, with 3.0% or 54 of them being unemployed. The group with the highest labor force participation rate are those with the educational attainment of bachelor's degree or higher, with 90.1% or 311 individuals in the labor force. Within the labor force, individuals with high school diploma education have the highest percentage of unemployment, with 4.0% or 39 of them being unemployed.
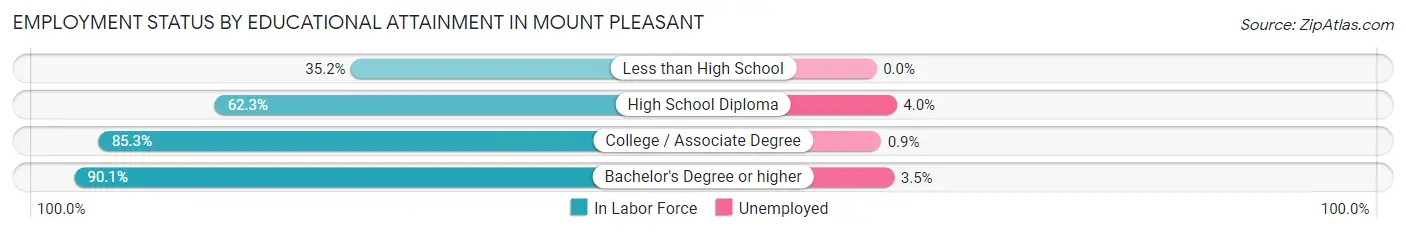
| Educational Attainment | In Labor Force | Unemployed |
| Less than High School | 63 (35.2%) | 0 (0.0%) |
| High School Diploma | 966 (62.3%) | 62 (4.0%) |
| College / Associate Degree | 466 (85.3%) | 5 (0.9%) |
| Bachelor's Degree or higher | 311 (90.1%) | 12 (3.5%) |
| Total | 1,805 (68.9%) | 79 (3.0%) |
Employment Occupations by Sex in Mount Pleasant
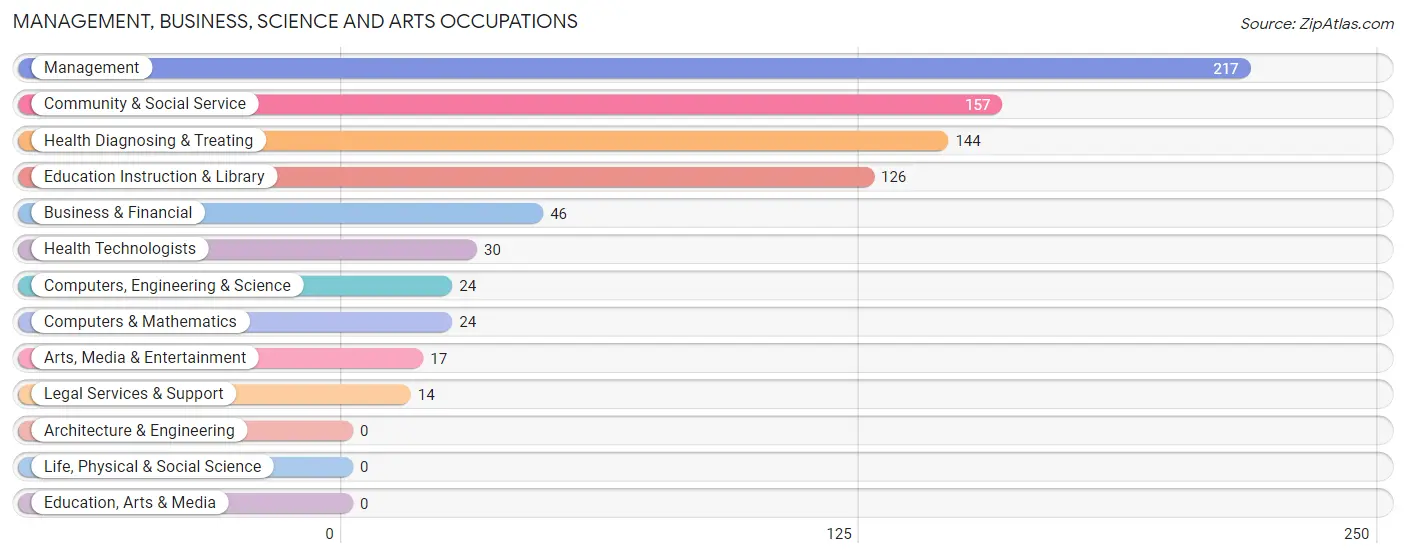
Management, Business, Science and Arts Occupations
The most common Management, Business, Science and Arts occupations in Mount Pleasant are Management (217 | 10.5%), Community & Social Service (157 | 7.6%), Health Diagnosing & Treating (144 | 7.0%), Education Instruction & Library (126 | 6.1%), and Business & Financial (46 | 2.2%).
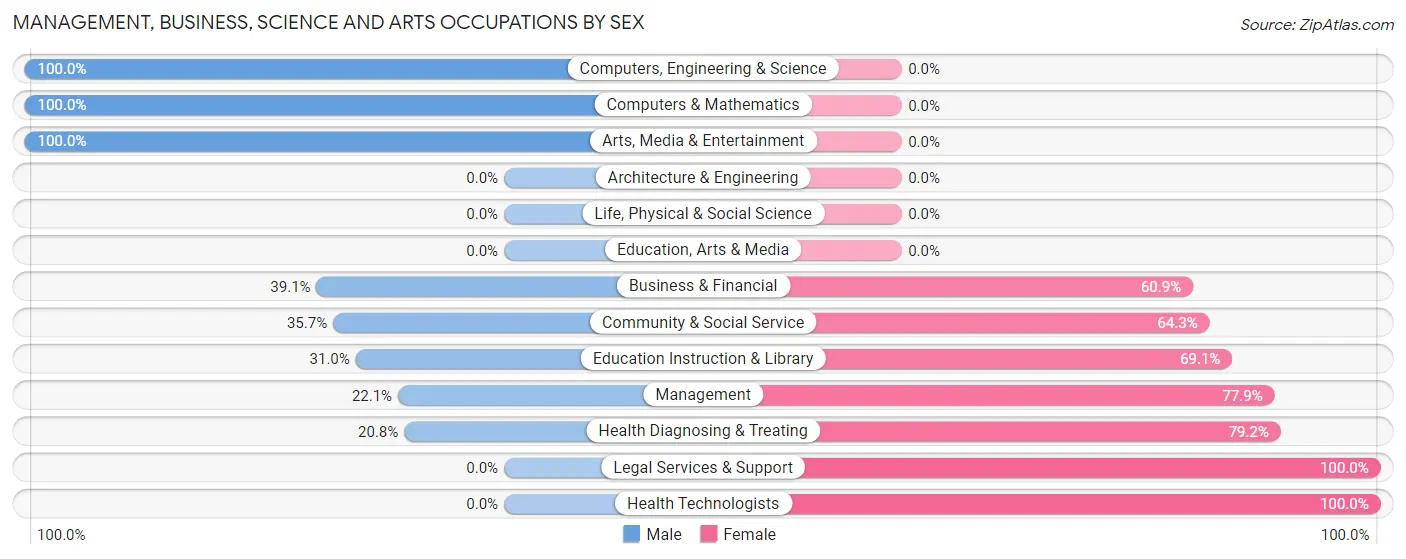
Management, Business, Science and Arts Occupations by Sex
Within the Management, Business, Science and Arts occupations in Mount Pleasant, the most male-oriented occupations are Computers, Engineering & Science (100.0%), Computers & Mathematics (100.0%), and Arts, Media & Entertainment (100.0%), while the most female-oriented occupations are Legal Services & Support (100.0%), Health Technologists (100.0%), and Health Diagnosing & Treating (79.2%).
| Occupation | Male | Female |
| Management | 48 (22.1%) | 169 (77.9%) |
| Business & Financial | 18 (39.1%) | 28 (60.9%) |
| Computers, Engineering & Science | 24 (100.0%) | 0 (0.0%) |
| Computers & Mathematics | 24 (100.0%) | 0 (0.0%) |
| Architecture & Engineering | 0 (0.0%) | 0 (0.0%) |
| Life, Physical & Social Science | 0 (0.0%) | 0 (0.0%) |
| Community & Social Service | 56 (35.7%) | 101 (64.3%) |
| Education, Arts & Media | 0 (0.0%) | 0 (0.0%) |
| Legal Services & Support | 0 (0.0%) | 14 (100.0%) |
| Education Instruction & Library | 39 (30.9%) | 87 (69.1%) |
| Arts, Media & Entertainment | 17 (100.0%) | 0 (0.0%) |
| Health Diagnosing & Treating | 30 (20.8%) | 114 (79.2%) |
| Health Technologists | 0 (0.0%) | 30 (100.0%) |
| Total (Category) | 176 (29.9%) | 412 (70.1%) |
| Total (Overall) | 1,032 (50.0%) | 1,030 (49.9%) |
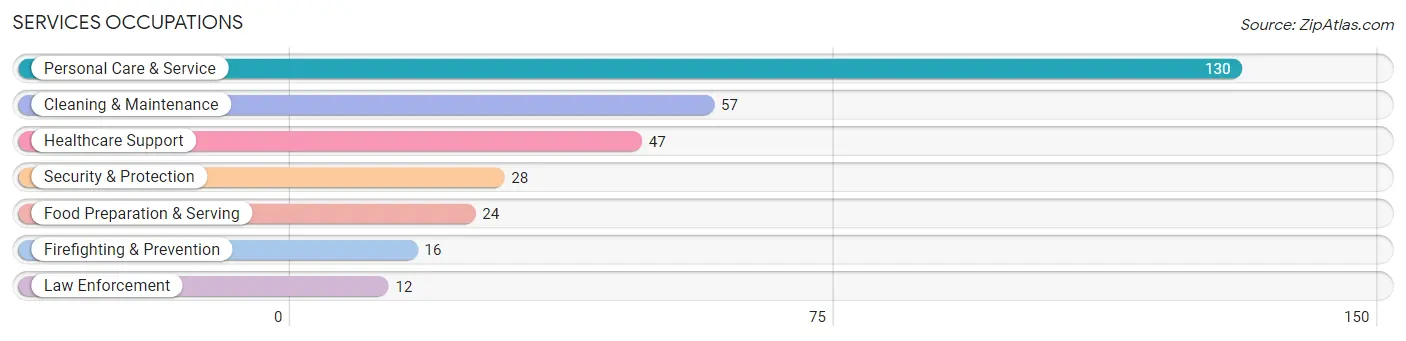
Services Occupations
The most common Services occupations in Mount Pleasant are Personal Care & Service (130 | 6.3%), Cleaning & Maintenance (57 | 2.8%), Healthcare Support (47 | 2.3%), Security & Protection (28 | 1.4%), and Food Preparation & Serving (24 | 1.2%).
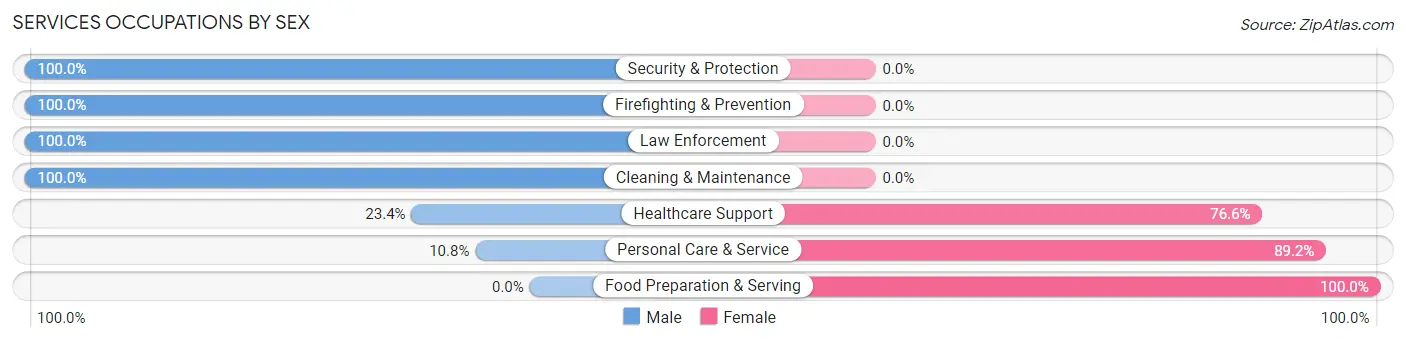
Services Occupations by Sex
Within the Services occupations in Mount Pleasant, the most male-oriented occupations are Security & Protection (100.0%), Firefighting & Prevention (100.0%), and Law Enforcement (100.0%), while the most female-oriented occupations are Food Preparation & Serving (100.0%), Personal Care & Service (89.2%), and Healthcare Support (76.6%).
| Occupation | Male | Female |
| Healthcare Support | 11 (23.4%) | 36 (76.6%) |
| Security & Protection | 28 (100.0%) | 0 (0.0%) |
| Firefighting & Prevention | 16 (100.0%) | 0 (0.0%) |
| Law Enforcement | 12 (100.0%) | 0 (0.0%) |
| Food Preparation & Serving | 0 (0.0%) | 24 (100.0%) |
| Cleaning & Maintenance | 57 (100.0%) | 0 (0.0%) |
| Personal Care & Service | 14 (10.8%) | 116 (89.2%) |
| Total (Category) | 110 (38.5%) | 176 (61.5%) |
| Total (Overall) | 1,032 (50.0%) | 1,030 (49.9%) |
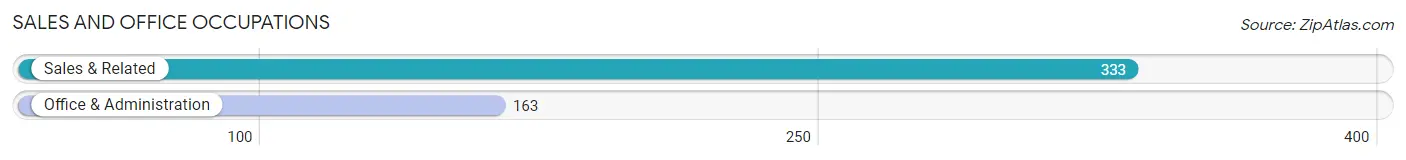
Sales and Office Occupations
The most common Sales and Office occupations in Mount Pleasant are Sales & Related (333 | 16.2%), and Office & Administration (163 | 7.9%).
Sales and Office Occupations by Sex
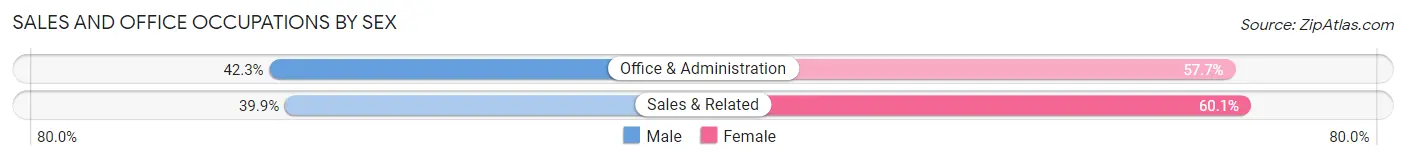
| Occupation | Male | Female |
| Sales & Related | 133 (39.9%) | 200 (60.1%) |
| Office & Administration | 69 (42.3%) | 94 (57.7%) |
| Total (Category) | 202 (40.7%) | 294 (59.3%) |
| Total (Overall) | 1,032 (50.0%) | 1,030 (49.9%) |
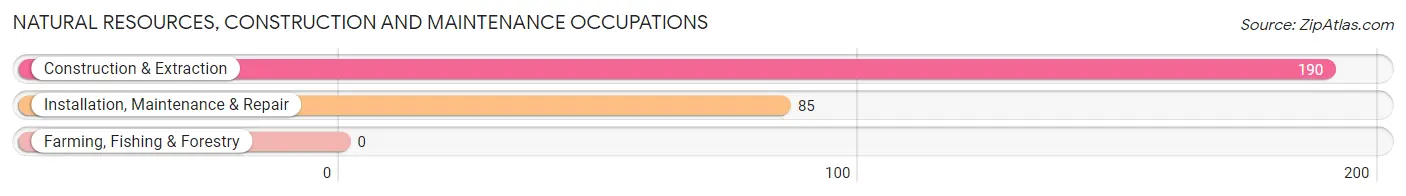
Natural Resources, Construction and Maintenance Occupations
The most common Natural Resources, Construction and Maintenance occupations in Mount Pleasant are Construction & Extraction (190 | 9.2%), and Installation, Maintenance & Repair (85 | 4.1%).
Natural Resources, Construction and Maintenance Occupations by Sex
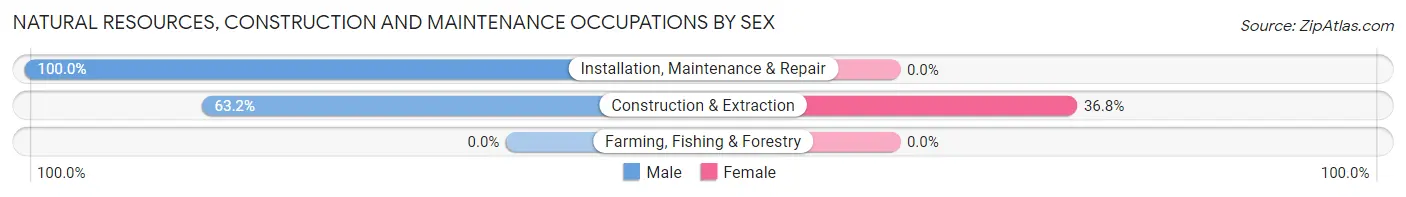
| Occupation | Male | Female |
| Farming, Fishing & Forestry | 0 (0.0%) | 0 (0.0%) |
| Construction & Extraction | 120 (63.2%) | 70 (36.8%) |
| Installation, Maintenance & Repair | 85 (100.0%) | 0 (0.0%) |
| Total (Category) | 205 (74.6%) | 70 (25.5%) |
| Total (Overall) | 1,032 (50.0%) | 1,030 (49.9%) |
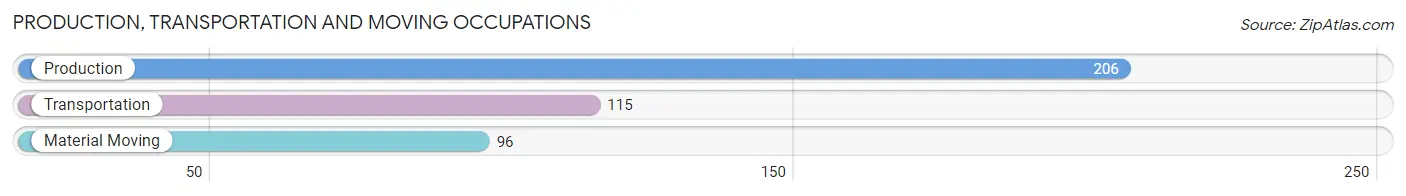
Production, Transportation and Moving Occupations
The most common Production, Transportation and Moving occupations in Mount Pleasant are Production (206 | 10.0%), Transportation (115 | 5.6%), and Material Moving (96 | 4.7%).
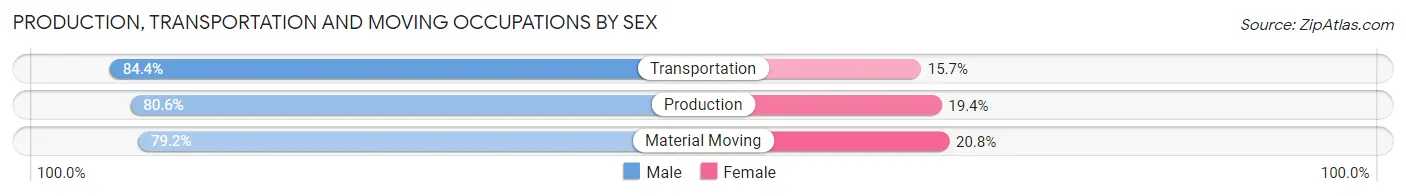
Production, Transportation and Moving Occupations by Sex
| Occupation | Male | Female |
| Production | 166 (80.6%) | 40 (19.4%) |
| Transportation | 97 (84.4%) | 18 (15.7%) |
| Material Moving | 76 (79.2%) | 20 (20.8%) |
| Total (Category) | 339 (81.3%) | 78 (18.7%) |
| Total (Overall) | 1,032 (50.0%) | 1,030 (49.9%) |
Employment Industries by Sex in Mount Pleasant
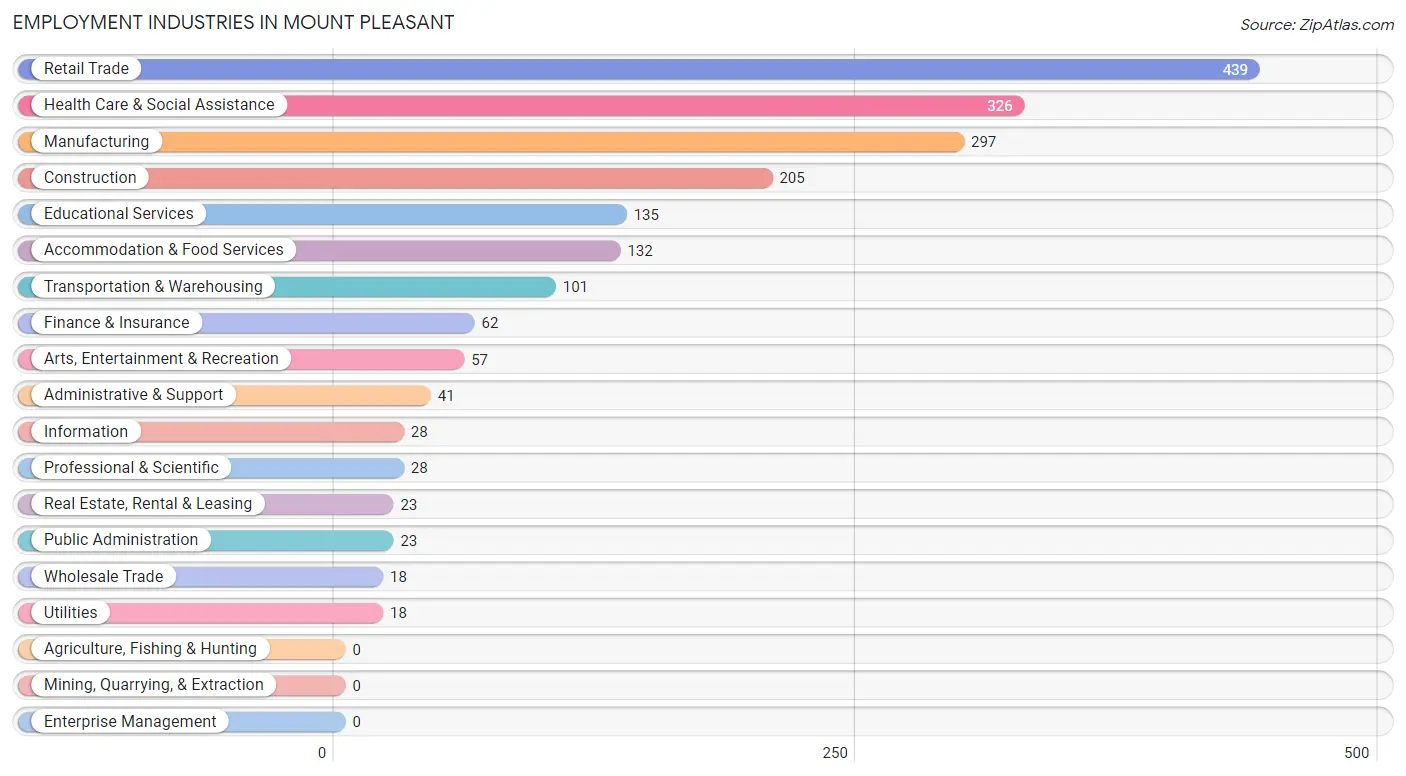
Employment Industries in Mount Pleasant
The major employment industries in Mount Pleasant include Retail Trade (439 | 21.3%), Health Care & Social Assistance (326 | 15.8%), Manufacturing (297 | 14.4%), Construction (205 | 9.9%), and Educational Services (135 | 6.6%).
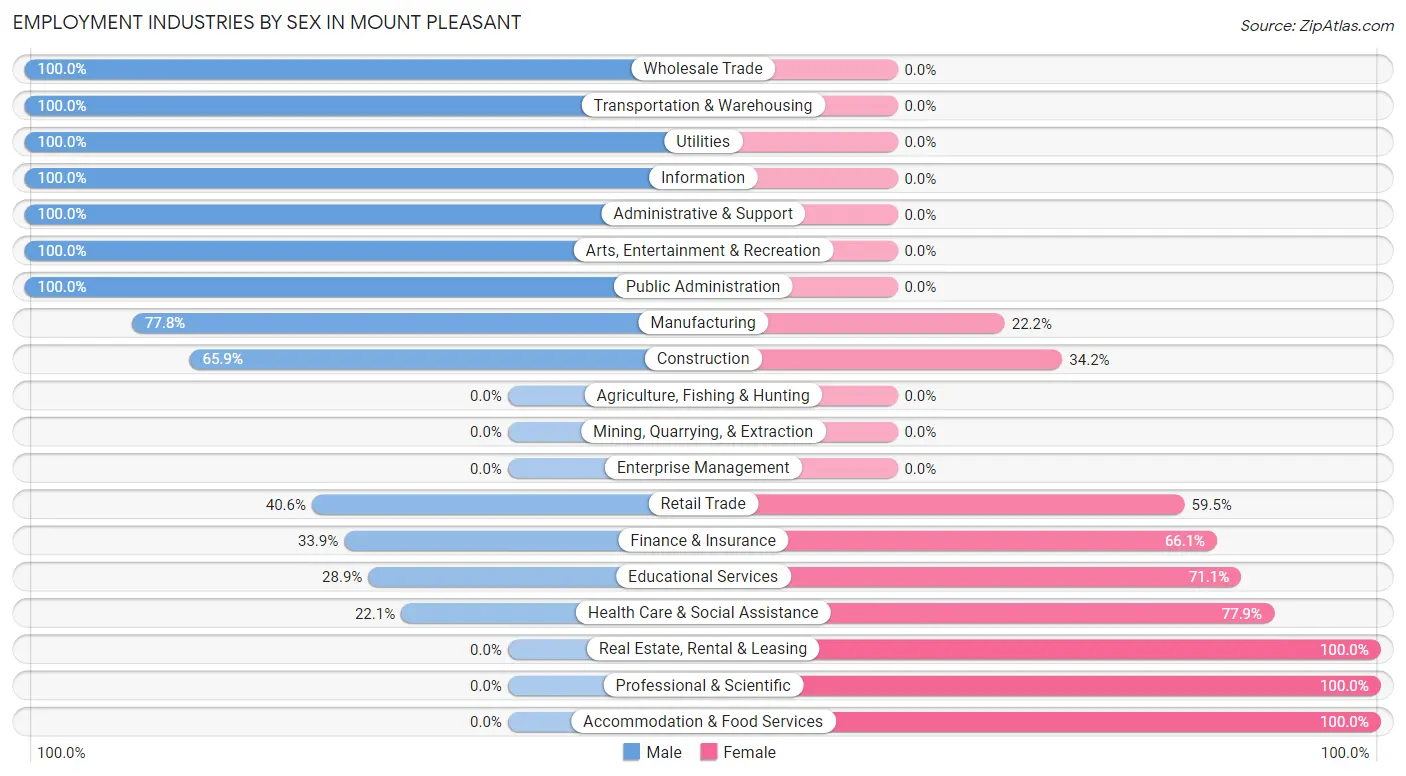
Employment Industries by Sex in Mount Pleasant
The Mount Pleasant industries that see more men than women are Wholesale Trade (100.0%), Transportation & Warehousing (100.0%), and Utilities (100.0%), whereas the industries that tend to have a higher number of women are Real Estate, Rental & Leasing (100.0%), Professional & Scientific (100.0%), and Accommodation & Food Services (100.0%).
| Industry | Male | Female |
| Agriculture, Fishing & Hunting | 0 (0.0%) | 0 (0.0%) |
| Mining, Quarrying, & Extraction | 0 (0.0%) | 0 (0.0%) |
| Construction | 135 (65.8%) | 70 (34.2%) |
| Manufacturing | 231 (77.8%) | 66 (22.2%) |
| Wholesale Trade | 18 (100.0%) | 0 (0.0%) |
| Retail Trade | 178 (40.6%) | 261 (59.5%) |
| Transportation & Warehousing | 101 (100.0%) | 0 (0.0%) |
| Utilities | 18 (100.0%) | 0 (0.0%) |
| Information | 28 (100.0%) | 0 (0.0%) |
| Finance & Insurance | 21 (33.9%) | 41 (66.1%) |
| Real Estate, Rental & Leasing | 0 (0.0%) | 23 (100.0%) |
| Professional & Scientific | 0 (0.0%) | 28 (100.0%) |
| Enterprise Management | 0 (0.0%) | 0 (0.0%) |
| Administrative & Support | 41 (100.0%) | 0 (0.0%) |
| Educational Services | 39 (28.9%) | 96 (71.1%) |
| Health Care & Social Assistance | 72 (22.1%) | 254 (77.9%) |
| Arts, Entertainment & Recreation | 57 (100.0%) | 0 (0.0%) |
| Accommodation & Food Services | 0 (0.0%) | 132 (100.0%) |
| Public Administration | 23 (100.0%) | 0 (0.0%) |
| Total | 1,032 (50.0%) | 1,030 (49.9%) |
Education in Mount Pleasant
School Enrollment in Mount Pleasant
The most common levels of schooling among the 1,124 students in Mount Pleasant are middle school (429 | 38.2%), high school (314 | 27.9%), and college / undergraduate (149 | 13.3%).
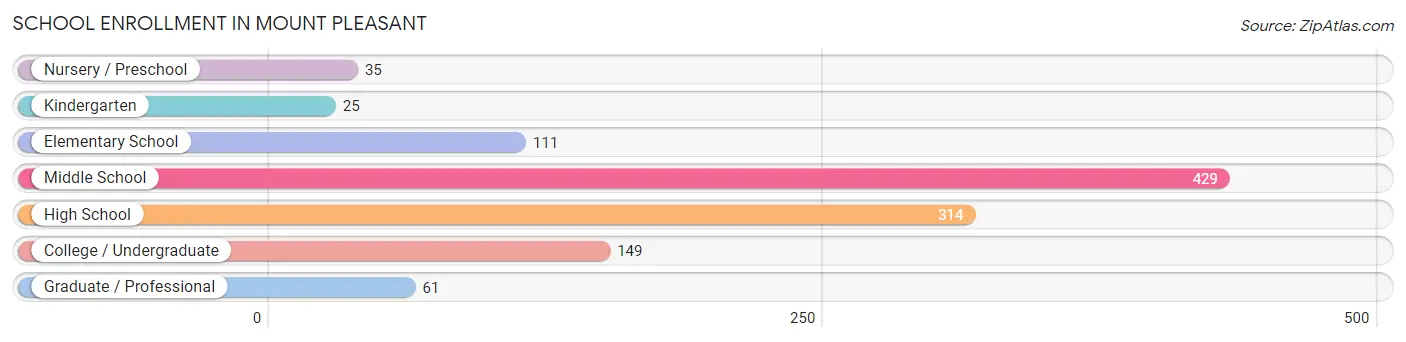
| School Level | # Students | % Students |
| Nursery / Preschool | 35 | 3.1% |
| Kindergarten | 25 | 2.2% |
| Elementary School | 111 | 9.9% |
| Middle School | 429 | 38.2% |
| High School | 314 | 27.9% |
| College / Undergraduate | 149 | 13.3% |
| Graduate / Professional | 61 | 5.4% |
| Total | 1,124 | 100.0% |
School Enrollment by Age by Funding Source in Mount Pleasant
Out of a total of 1,124 students who are enrolled in schools in Mount Pleasant, 83 (7.4%) attend a private institution, while the remaining 1,041 (92.6%) are enrolled in public schools. The age group of 20 to 24 year olds has the highest likelihood of being enrolled in private schools, with 72 (76.6% in the age bracket) enrolled. Conversely, the age group of 3 to 4 year olds has the lowest likelihood of being enrolled in a private school, with 35 (100.0% in the age bracket) attending a public institution.
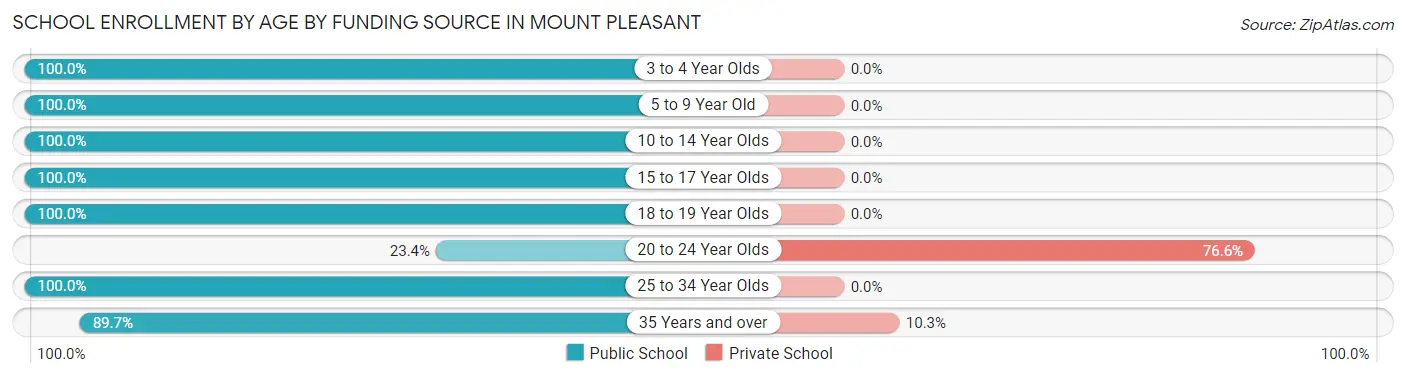
| Age Bracket | Public School | Private School |
| 3 to 4 Year Olds | 35 (100.0%) | 0 (0.0%) |
| 5 to 9 Year Old | 136 (100.0%) | 0 (0.0%) |
| 10 to 14 Year Olds | 432 (100.0%) | 0 (0.0%) |
| 15 to 17 Year Olds | 279 (100.0%) | 0 (0.0%) |
| 18 to 19 Year Olds | 21 (100.0%) | 0 (0.0%) |
| 20 to 24 Year Olds | 22 (23.4%) | 72 (76.6%) |
| 25 to 34 Year Olds | 20 (100.0%) | 0 (0.0%) |
| 35 Years and over | 96 (89.7%) | 11 (10.3%) |
| Total | 1,041 (92.6%) | 83 (7.4%) |
Educational Attainment by Field of Study in Mount Pleasant
Business (104 | 20.3%), education (92 | 17.9%), science & technology (82 | 16.0%), communications (61 | 11.9%), and computers & mathematics (60 | 11.7%) are the most common fields of study among 513 individuals in Mount Pleasant who have obtained a bachelor's degree or higher.
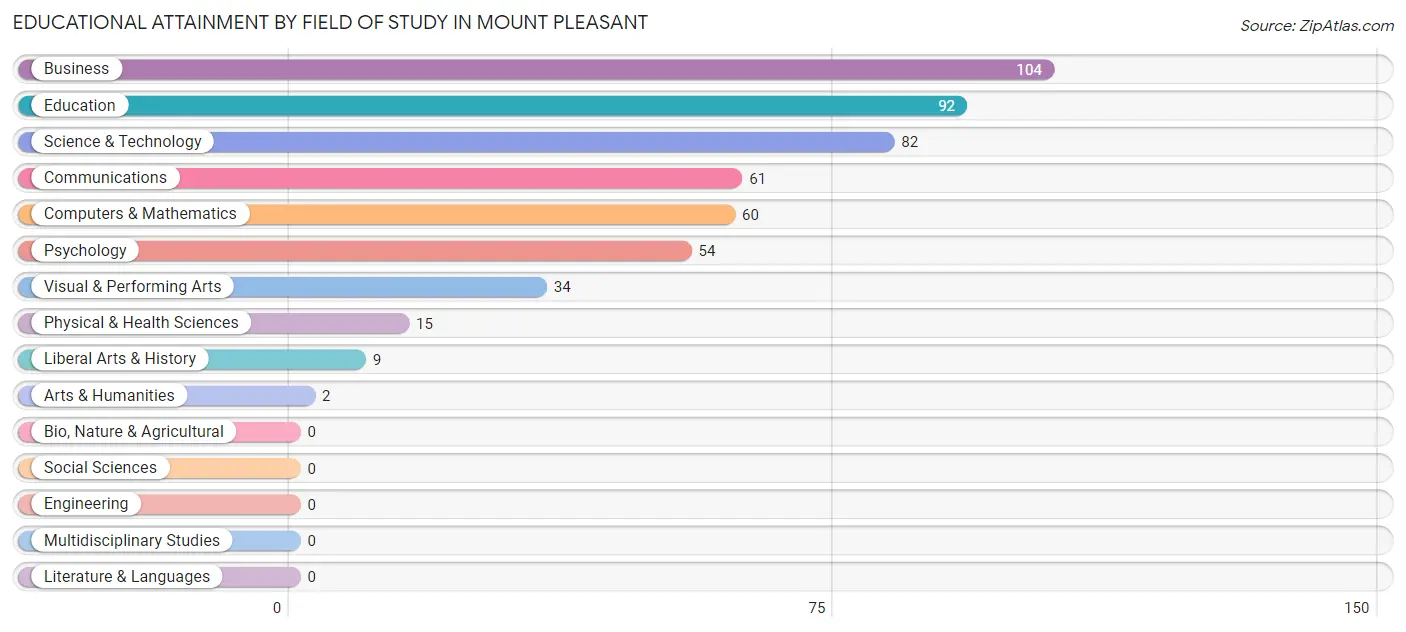
| Field of Study | # Graduates | % Graduates |
| Computers & Mathematics | 60 | 11.7% |
| Bio, Nature & Agricultural | 0 | 0.0% |
| Physical & Health Sciences | 15 | 2.9% |
| Psychology | 54 | 10.5% |
| Social Sciences | 0 | 0.0% |
| Engineering | 0 | 0.0% |
| Multidisciplinary Studies | 0 | 0.0% |
| Science & Technology | 82 | 16.0% |
| Business | 104 | 20.3% |
| Education | 92 | 17.9% |
| Literature & Languages | 0 | 0.0% |
| Liberal Arts & History | 9 | 1.8% |
| Visual & Performing Arts | 34 | 6.6% |
| Communications | 61 | 11.9% |
| Arts & Humanities | 2 | 0.4% |
| Total | 513 | 100.0% |
Transportation & Commute in Mount Pleasant
Vehicle Availability by Sex in Mount Pleasant
The most prevalent vehicle ownership categories in Mount Pleasant are males with 2 vehicles (320, accounting for 34.0%) and females with 2 vehicles (567, making up 31.1%).
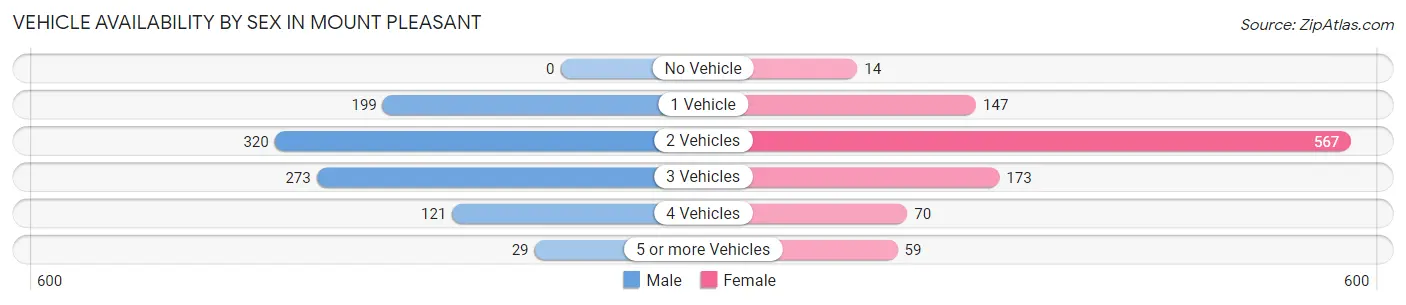
| Vehicles Available | Male | Female |
| No Vehicle | 0 (0.0%) | 14 (1.4%) |
| 1 Vehicle | 199 (21.1%) | 147 (14.3%) |
| 2 Vehicles | 320 (34.0%) | 567 (55.0%) |
| 3 Vehicles | 273 (29.0%) | 173 (16.8%) |
| 4 Vehicles | 121 (12.9%) | 70 (6.8%) |
| 5 or more Vehicles | 29 (3.1%) | 59 (5.7%) |
| Total | 942 (100.0%) | 1,030 (100.0%) |
Commute Time in Mount Pleasant
The most frequently occuring commute durations in Mount Pleasant are 15 to 19 minutes (466 commuters, 25.2%), 20 to 24 minutes (260 commuters, 14.0%), and 45 to 59 minutes (244 commuters, 13.2%).
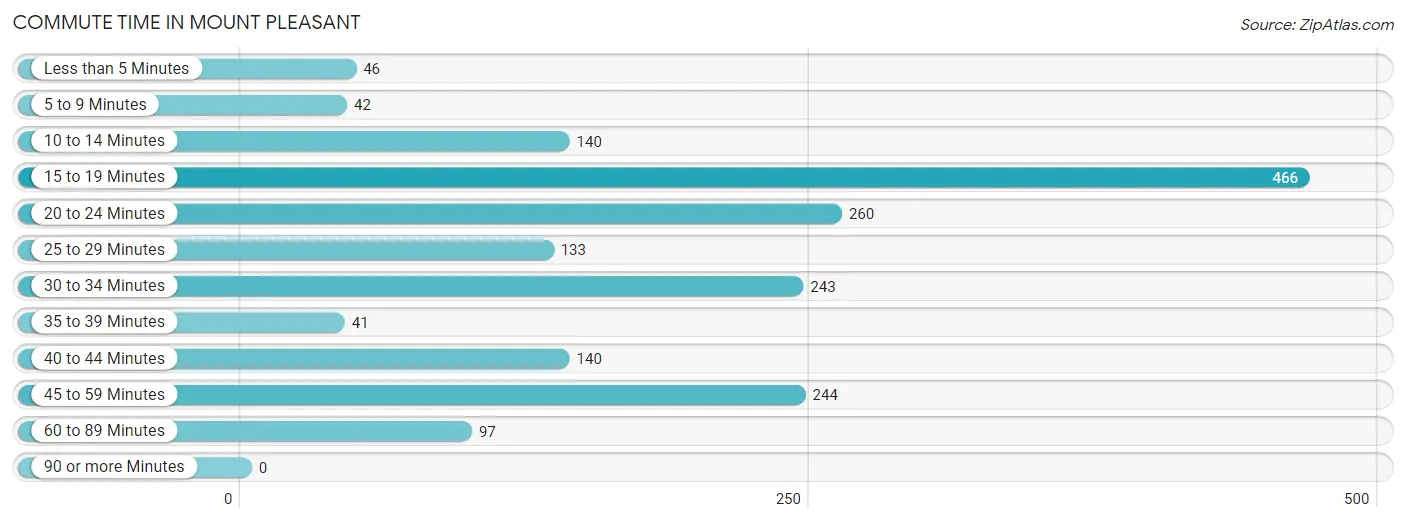
| Commute Time | # Commuters | % Commuters |
| Less than 5 Minutes | 46 | 2.5% |
| 5 to 9 Minutes | 42 | 2.3% |
| 10 to 14 Minutes | 140 | 7.6% |
| 15 to 19 Minutes | 466 | 25.2% |
| 20 to 24 Minutes | 260 | 14.0% |
| 25 to 29 Minutes | 133 | 7.2% |
| 30 to 34 Minutes | 243 | 13.1% |
| 35 to 39 Minutes | 41 | 2.2% |
| 40 to 44 Minutes | 140 | 7.6% |
| 45 to 59 Minutes | 244 | 13.2% |
| 60 to 89 Minutes | 97 | 5.2% |
| 90 or more Minutes | 0 | 0.0% |
Commute Time by Sex in Mount Pleasant
The most common commute times in Mount Pleasant are 15 to 19 minutes (228 commuters, 25.3%) for males and 15 to 19 minutes (238 commuters, 25.0%) for females.
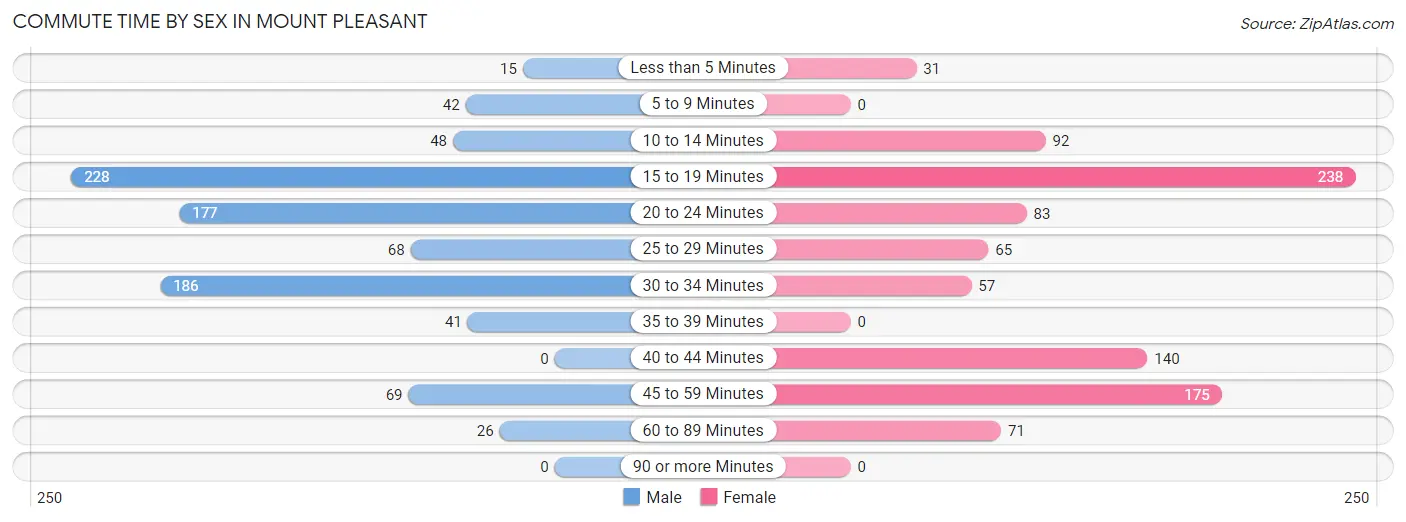
| Commute Time | Male | Female |
| Less than 5 Minutes | 15 (1.7%) | 31 (3.3%) |
| 5 to 9 Minutes | 42 (4.7%) | 0 (0.0%) |
| 10 to 14 Minutes | 48 (5.3%) | 92 (9.7%) |
| 15 to 19 Minutes | 228 (25.3%) | 238 (25.0%) |
| 20 to 24 Minutes | 177 (19.7%) | 83 (8.7%) |
| 25 to 29 Minutes | 68 (7.6%) | 65 (6.8%) |
| 30 to 34 Minutes | 186 (20.7%) | 57 (6.0%) |
| 35 to 39 Minutes | 41 (4.6%) | 0 (0.0%) |
| 40 to 44 Minutes | 0 (0.0%) | 140 (14.7%) |
| 45 to 59 Minutes | 69 (7.7%) | 175 (18.4%) |
| 60 to 89 Minutes | 26 (2.9%) | 71 (7.5%) |
| 90 or more Minutes | 0 (0.0%) | 0 (0.0%) |
Time of Departure to Work by Sex in Mount Pleasant
The most frequent times of departure to work in Mount Pleasant are 6:30 AM to 6:59 AM (166, 18.4%) for males and 7:00 AM to 7:29 AM (179, 18.8%) for females.
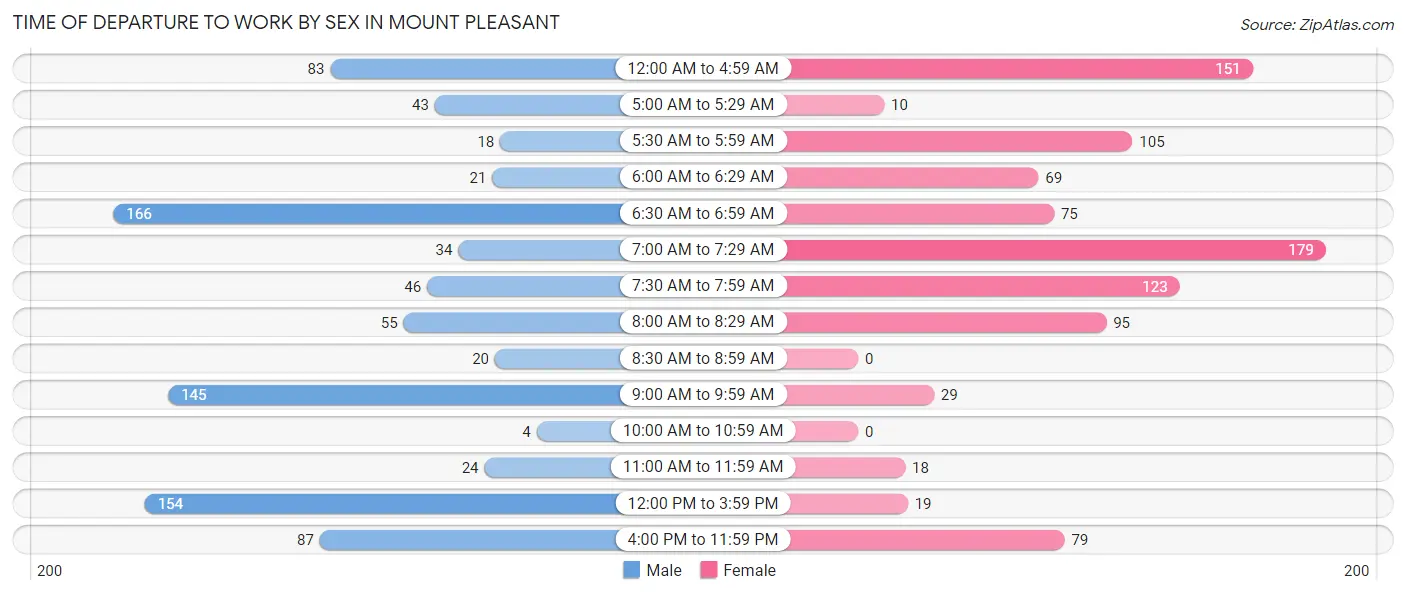
| Time of Departure | Male | Female |
| 12:00 AM to 4:59 AM | 83 (9.2%) | 151 (15.9%) |
| 5:00 AM to 5:29 AM | 43 (4.8%) | 10 (1.1%) |
| 5:30 AM to 5:59 AM | 18 (2.0%) | 105 (11.0%) |
| 6:00 AM to 6:29 AM | 21 (2.3%) | 69 (7.2%) |
| 6:30 AM to 6:59 AM | 166 (18.4%) | 75 (7.9%) |
| 7:00 AM to 7:29 AM | 34 (3.8%) | 179 (18.8%) |
| 7:30 AM to 7:59 AM | 46 (5.1%) | 123 (12.9%) |
| 8:00 AM to 8:29 AM | 55 (6.1%) | 95 (10.0%) |
| 8:30 AM to 8:59 AM | 20 (2.2%) | 0 (0.0%) |
| 9:00 AM to 9:59 AM | 145 (16.1%) | 29 (3.0%) |
| 10:00 AM to 10:59 AM | 4 (0.4%) | 0 (0.0%) |
| 11:00 AM to 11:59 AM | 24 (2.7%) | 18 (1.9%) |
| 12:00 PM to 3:59 PM | 154 (17.1%) | 19 (2.0%) |
| 4:00 PM to 11:59 PM | 87 (9.7%) | 79 (8.3%) |
| Total | 900 (100.0%) | 952 (100.0%) |
Housing Occupancy in Mount Pleasant
Occupancy by Ownership in Mount Pleasant
Of the total 1,999 dwellings in Mount Pleasant, owner-occupied units account for 1,230 (61.5%), while renter-occupied units make up 769 (38.5%).
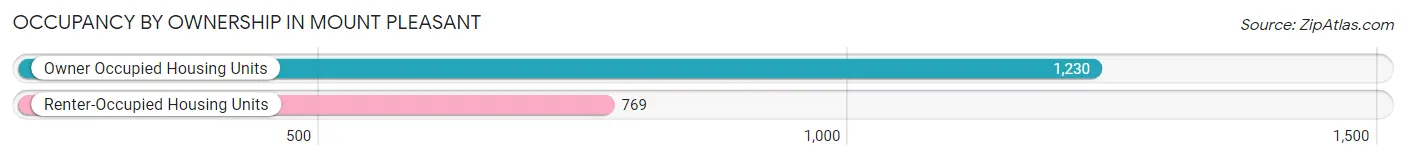
| Occupancy | # Housing Units | % Housing Units |
| Owner Occupied Housing Units | 1,230 | 61.5% |
| Renter-Occupied Housing Units | 769 | 38.5% |
| Total Occupied Housing Units | 1,999 | 100.0% |
Occupancy by Household Size in Mount Pleasant
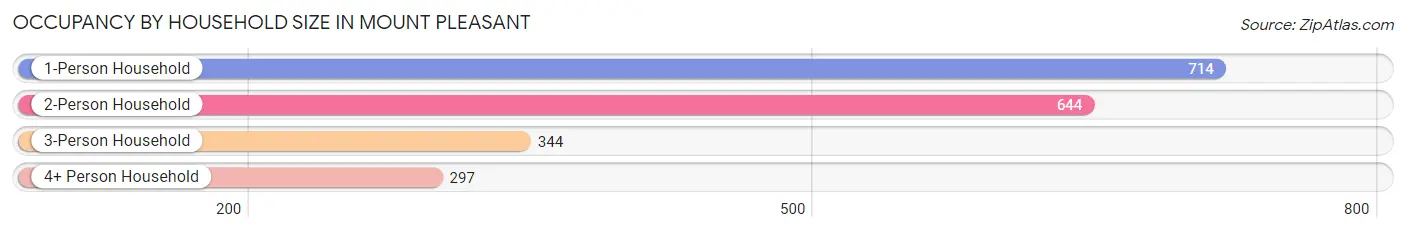
| Household Size | # Housing Units | % Housing Units |
| 1-Person Household | 714 | 35.7% |
| 2-Person Household | 644 | 32.2% |
| 3-Person Household | 344 | 17.2% |
| 4+ Person Household | 297 | 14.9% |
| Total Housing Units | 1,999 | 100.0% |
Occupancy by Ownership by Household Size in Mount Pleasant
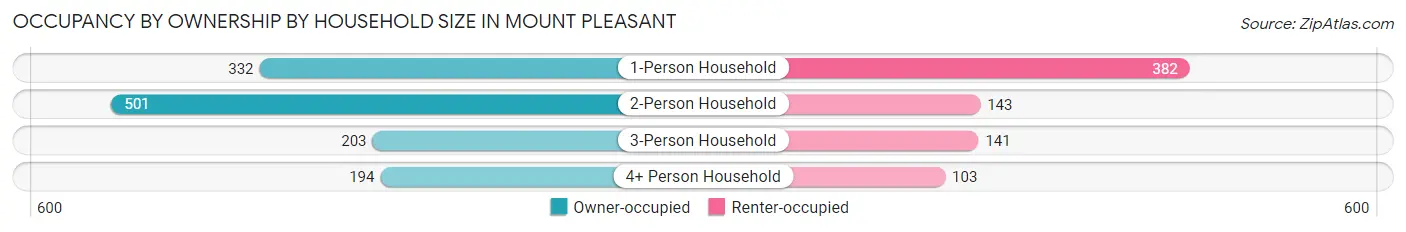
| Household Size | Owner-occupied | Renter-occupied |
| 1-Person Household | 332 (46.5%) | 382 (53.5%) |
| 2-Person Household | 501 (77.8%) | 143 (22.2%) |
| 3-Person Household | 203 (59.0%) | 141 (41.0%) |
| 4+ Person Household | 194 (65.3%) | 103 (34.7%) |
| Total Housing Units | 1,230 (61.5%) | 769 (38.5%) |
Occupancy by Educational Attainment in Mount Pleasant
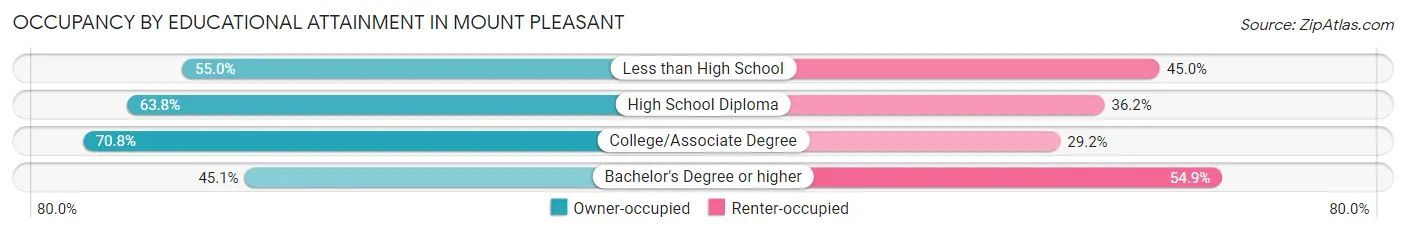
| Household Size | Owner-occupied | Renter-occupied |
| Less than High School | 99 (55.0%) | 81 (45.0%) |
| High School Diploma | 634 (63.8%) | 360 (36.2%) |
| College/Associate Degree | 344 (70.8%) | 142 (29.2%) |
| Bachelor's Degree or higher | 153 (45.1%) | 186 (54.9%) |
Occupancy by Age of Householder in Mount Pleasant
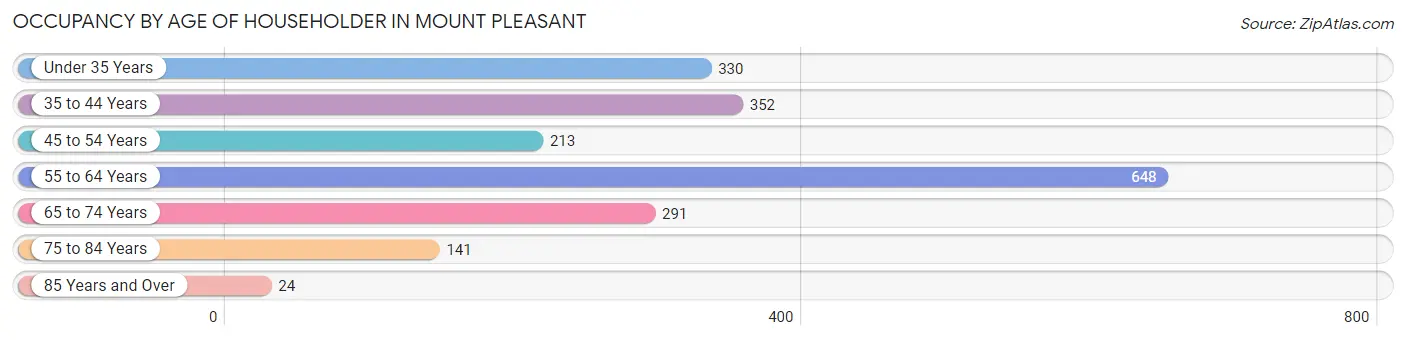
| Age Bracket | # Households | % Households |
| Under 35 Years | 330 | 16.5% |
| 35 to 44 Years | 352 | 17.6% |
| 45 to 54 Years | 213 | 10.7% |
| 55 to 64 Years | 648 | 32.4% |
| 65 to 74 Years | 291 | 14.6% |
| 75 to 84 Years | 141 | 7.0% |
| 85 Years and Over | 24 | 1.2% |
| Total | 1,999 | 100.0% |
Housing Finances in Mount Pleasant
Median Income by Occupancy in Mount Pleasant
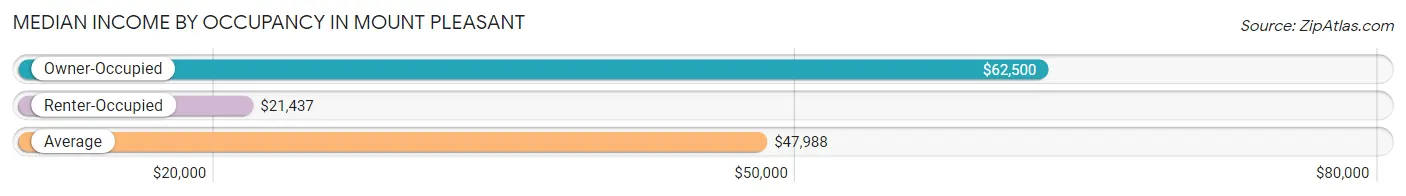
| Occupancy Type | # Households | Median Income |
| Owner-Occupied | 1,230 (61.5%) | $62,500 |
| Renter-Occupied | 769 (38.5%) | $21,437 |
| Average | 1,999 (100.0%) | $47,988 |
Occupancy by Householder Income Bracket in Mount Pleasant
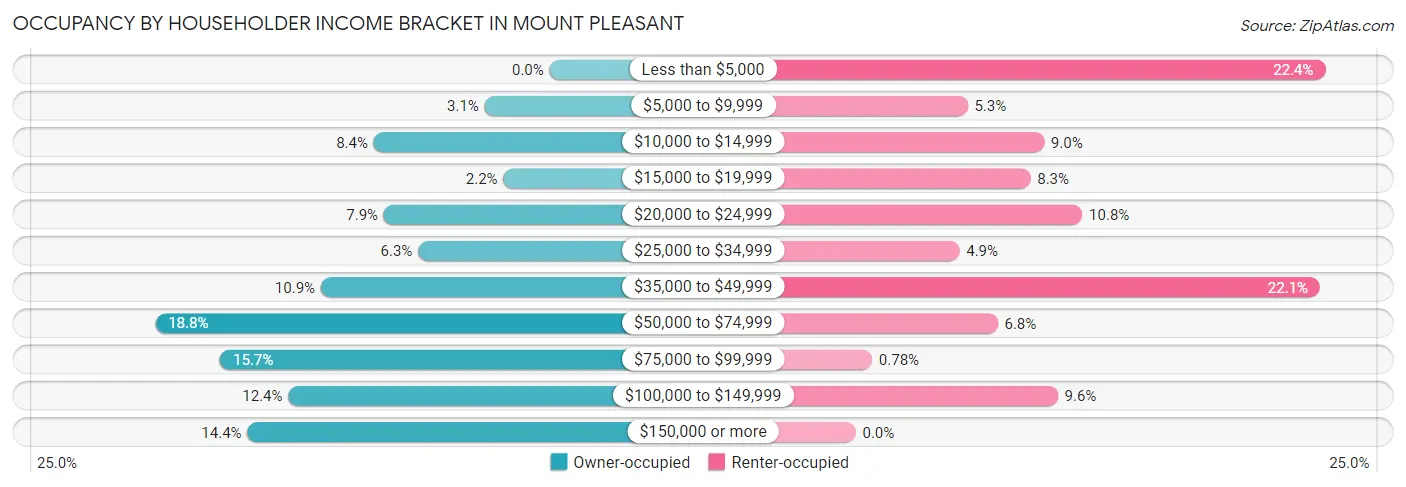
| Income Bracket | Owner-occupied | Renter-occupied |
| Less than $5,000 | 0 (0.0%) | 172 (22.4%) |
| $5,000 to $9,999 | 38 (3.1%) | 41 (5.3%) |
| $10,000 to $14,999 | 103 (8.4%) | 69 (9.0%) |
| $15,000 to $19,999 | 27 (2.2%) | 64 (8.3%) |
| $20,000 to $24,999 | 97 (7.9%) | 83 (10.8%) |
| $25,000 to $34,999 | 77 (6.3%) | 38 (4.9%) |
| $35,000 to $49,999 | 134 (10.9%) | 170 (22.1%) |
| $50,000 to $74,999 | 231 (18.8%) | 52 (6.8%) |
| $75,000 to $99,999 | 193 (15.7%) | 6 (0.8%) |
| $100,000 to $149,999 | 153 (12.4%) | 74 (9.6%) |
| $150,000 or more | 177 (14.4%) | 0 (0.0%) |
| Total | 1,230 (100.0%) | 769 (100.0%) |
Monthly Housing Cost Tiers in Mount Pleasant
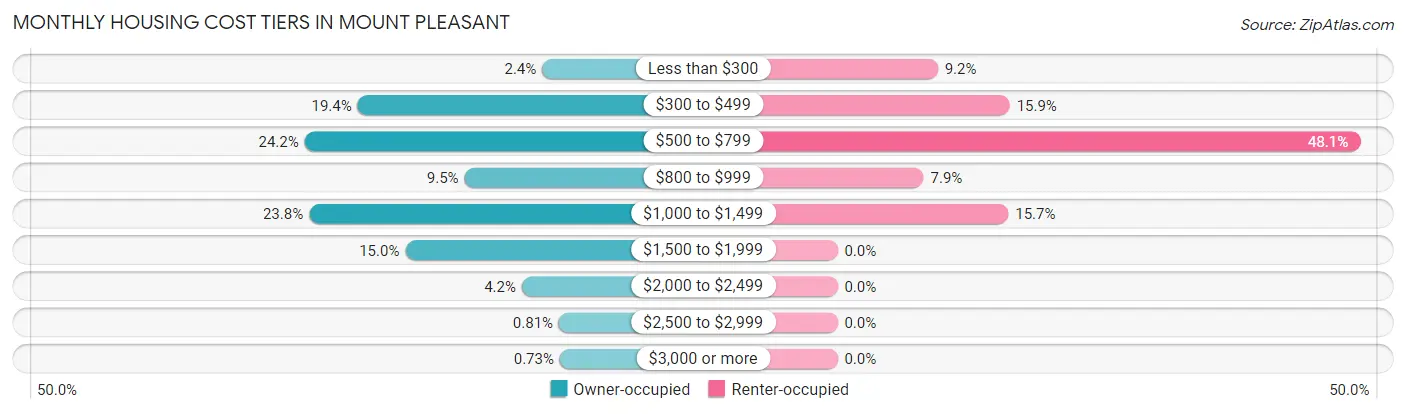
| Monthly Cost | Owner-occupied | Renter-occupied |
| Less than $300 | 29 (2.4%) | 71 (9.2%) |
| $300 to $499 | 238 (19.4%) | 122 (15.9%) |
| $500 to $799 | 298 (24.2%) | 370 (48.1%) |
| $800 to $999 | 117 (9.5%) | 61 (7.9%) |
| $1,000 to $1,499 | 293 (23.8%) | 121 (15.7%) |
| $1,500 to $1,999 | 184 (15.0%) | 0 (0.0%) |
| $2,000 to $2,499 | 52 (4.2%) | 0 (0.0%) |
| $2,500 to $2,999 | 10 (0.8%) | 0 (0.0%) |
| $3,000 or more | 9 (0.7%) | 0 (0.0%) |
| Total | 1,230 (100.0%) | 769 (100.0%) |
Physical Housing Characteristics in Mount Pleasant
Housing Structures in Mount Pleasant
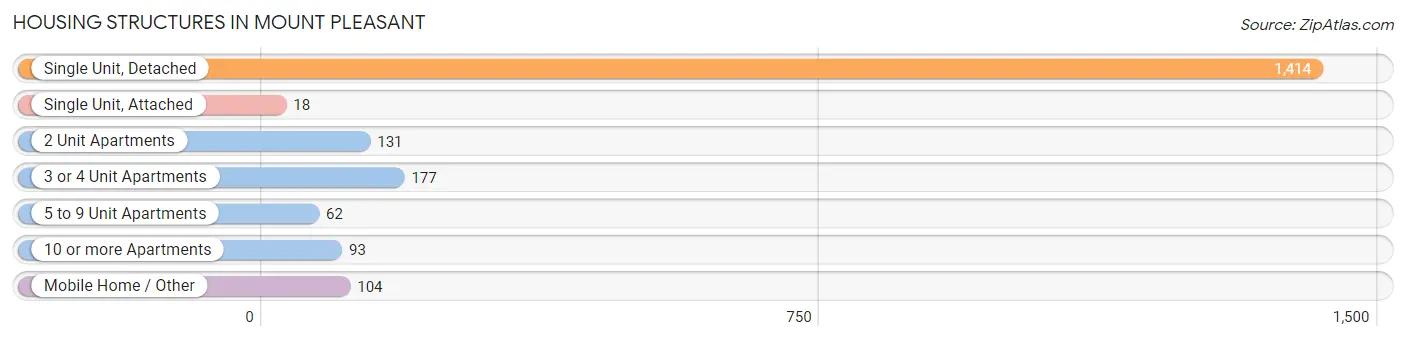
| Structure Type | # Housing Units | % Housing Units |
| Single Unit, Detached | 1,414 | 70.7% |
| Single Unit, Attached | 18 | 0.9% |
| 2 Unit Apartments | 131 | 6.6% |
| 3 or 4 Unit Apartments | 177 | 8.8% |
| 5 to 9 Unit Apartments | 62 | 3.1% |
| 10 or more Apartments | 93 | 4.6% |
| Mobile Home / Other | 104 | 5.2% |
| Total | 1,999 | 100.0% |
Housing Structures by Occupancy in Mount Pleasant
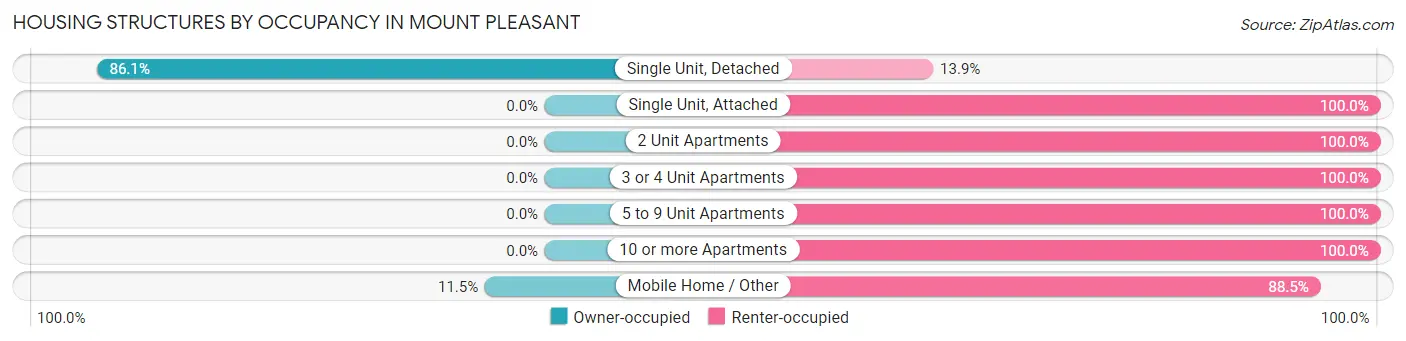
| Structure Type | Owner-occupied | Renter-occupied |
| Single Unit, Detached | 1,218 (86.1%) | 196 (13.9%) |
| Single Unit, Attached | 0 (0.0%) | 18 (100.0%) |
| 2 Unit Apartments | 0 (0.0%) | 131 (100.0%) |
| 3 or 4 Unit Apartments | 0 (0.0%) | 177 (100.0%) |
| 5 to 9 Unit Apartments | 0 (0.0%) | 62 (100.0%) |
| 10 or more Apartments | 0 (0.0%) | 93 (100.0%) |
| Mobile Home / Other | 12 (11.5%) | 92 (88.5%) |
| Total | 1,230 (61.5%) | 769 (38.5%) |
Housing Structures by Number of Rooms in Mount Pleasant
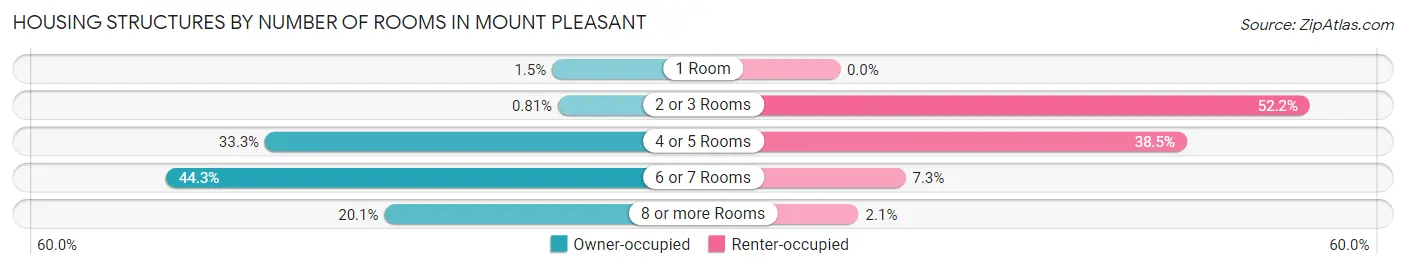
| Number of Rooms | Owner-occupied | Renter-occupied |
| 1 Room | 18 (1.5%) | 0 (0.0%) |
| 2 or 3 Rooms | 10 (0.8%) | 401 (52.1%) |
| 4 or 5 Rooms | 410 (33.3%) | 296 (38.5%) |
| 6 or 7 Rooms | 545 (44.3%) | 56 (7.3%) |
| 8 or more Rooms | 247 (20.1%) | 16 (2.1%) |
| Total | 1,230 (100.0%) | 769 (100.0%) |
Housing Structure by Heating Type in Mount Pleasant
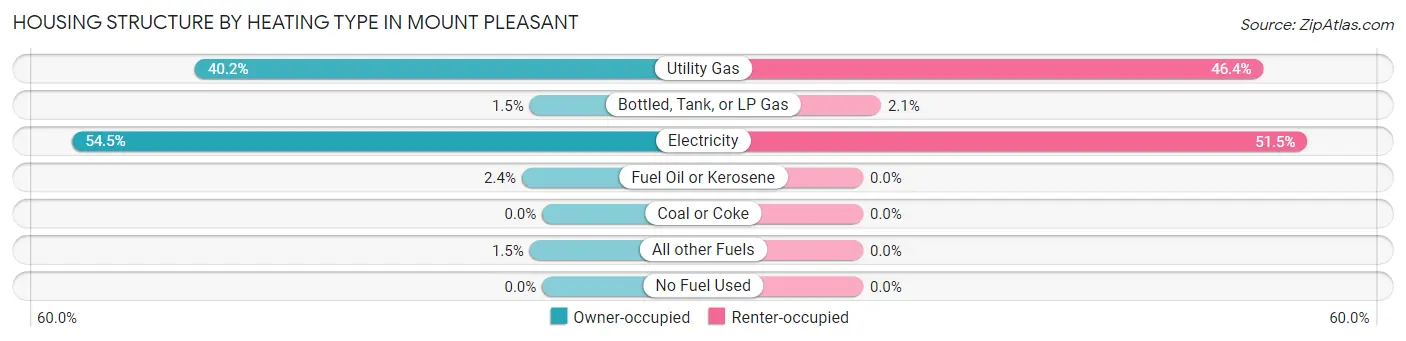
| Heating Type | Owner-occupied | Renter-occupied |
| Utility Gas | 495 (40.2%) | 357 (46.4%) |
| Bottled, Tank, or LP Gas | 18 (1.5%) | 16 (2.1%) |
| Electricity | 670 (54.5%) | 396 (51.5%) |
| Fuel Oil or Kerosene | 29 (2.4%) | 0 (0.0%) |
| Coal or Coke | 0 (0.0%) | 0 (0.0%) |
| All other Fuels | 18 (1.5%) | 0 (0.0%) |
| No Fuel Used | 0 (0.0%) | 0 (0.0%) |
| Total | 1,230 (100.0%) | 769 (100.0%) |
Household Vehicle Usage in Mount Pleasant
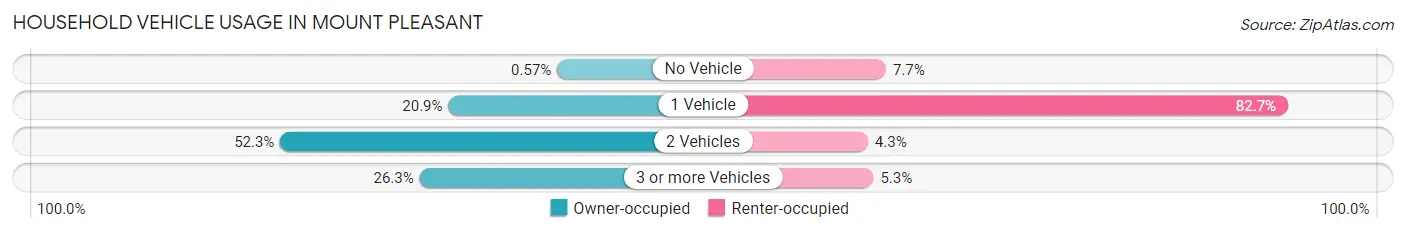
| Vehicles per Household | Owner-occupied | Renter-occupied |
| No Vehicle | 7 (0.6%) | 59 (7.7%) |
| 1 Vehicle | 257 (20.9%) | 636 (82.7%) |
| 2 Vehicles | 643 (52.3%) | 33 (4.3%) |
| 3 or more Vehicles | 323 (26.3%) | 41 (5.3%) |
| Total | 1,230 (100.0%) | 769 (100.0%) |
Real Estate & Mortgages in Mount Pleasant
Real Estate and Mortgage Overview in Mount Pleasant
| Characteristic | Without Mortgage | With Mortgage |
| Housing Units | 512 | 718 |
| Median Property Value | $186,900 | $218,500 |
| Median Household Income | $76,250 | $67 |
| Monthly Housing Costs | $491 | $9 |
| Real Estate Taxes | $1,116 | $37 |
Property Value by Mortgage Status in Mount Pleasant
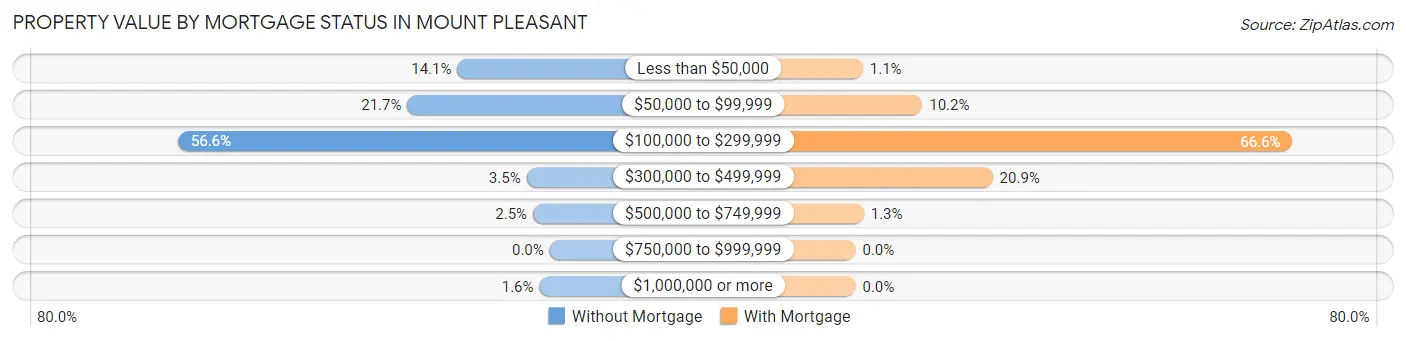
| Property Value | Without Mortgage | With Mortgage |
| Less than $50,000 | 72 (14.1%) | 8 (1.1%) |
| $50,000 to $99,999 | 111 (21.7%) | 73 (10.2%) |
| $100,000 to $299,999 | 290 (56.6%) | 478 (66.6%) |
| $300,000 to $499,999 | 18 (3.5%) | 150 (20.9%) |
| $500,000 to $749,999 | 13 (2.5%) | 9 (1.3%) |
| $750,000 to $999,999 | 0 (0.0%) | 0 (0.0%) |
| $1,000,000 or more | 8 (1.6%) | 0 (0.0%) |
| Total | 512 (100.0%) | 718 (100.0%) |
Household Income by Mortgage Status in Mount Pleasant
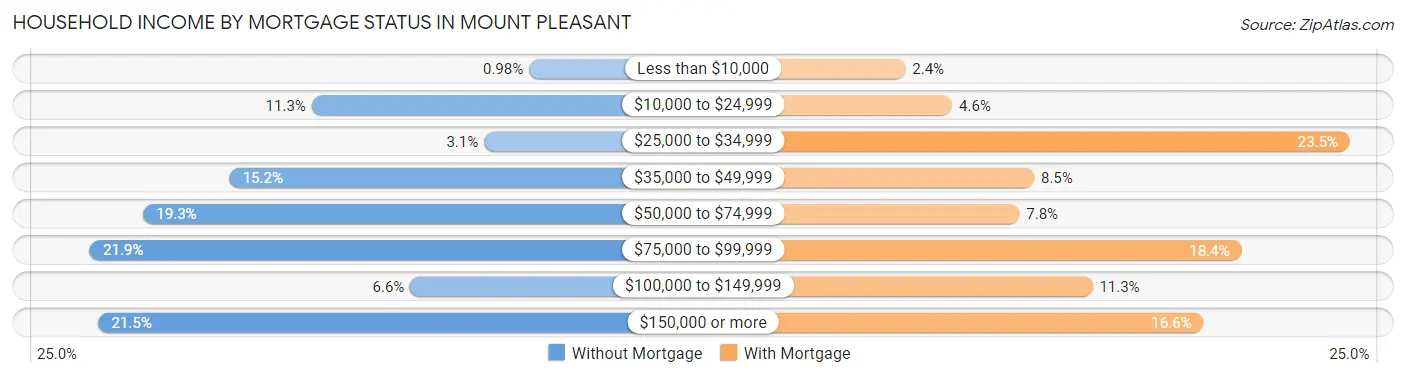
| Household Income | Without Mortgage | With Mortgage |
| Less than $10,000 | 5 (1.0%) | 17 (2.4%) |
| $10,000 to $24,999 | 58 (11.3%) | 33 (4.6%) |
| $25,000 to $34,999 | 16 (3.1%) | 169 (23.5%) |
| $35,000 to $49,999 | 78 (15.2%) | 61 (8.5%) |
| $50,000 to $74,999 | 99 (19.3%) | 56 (7.8%) |
| $75,000 to $99,999 | 112 (21.9%) | 132 (18.4%) |
| $100,000 to $149,999 | 34 (6.6%) | 81 (11.3%) |
| $150,000 or more | 110 (21.5%) | 119 (16.6%) |
| Total | 512 (100.0%) | 718 (100.0%) |
Property Value to Household Income Ratio in Mount Pleasant
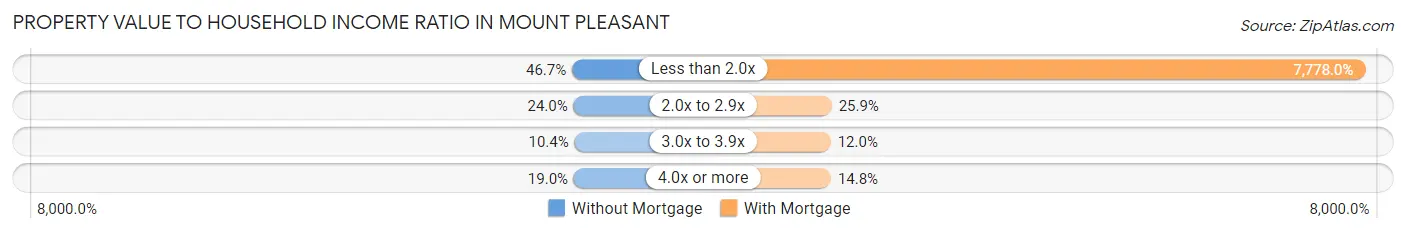
| Value-to-Income Ratio | Without Mortgage | With Mortgage |
| Less than 2.0x | 239 (46.7%) | 55,846 (7,778.0%) |
| 2.0x to 2.9x | 123 (24.0%) | 186 (25.9%) |
| 3.0x to 3.9x | 53 (10.3%) | 86 (12.0%) |
| 4.0x or more | 97 (19.0%) | 106 (14.8%) |
| Total | 512 (100.0%) | 718 (100.0%) |
Real Estate Taxes by Mortgage Status in Mount Pleasant
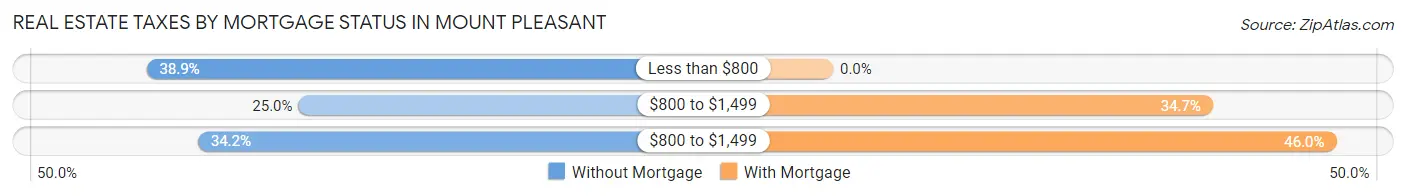
| Property Taxes | Without Mortgage | With Mortgage |
| Less than $800 | 199 (38.9%) | 0 (0.0%) |
| $800 to $1,499 | 128 (25.0%) | 249 (34.7%) |
| $800 to $1,499 | 175 (34.2%) | 330 (46.0%) |
| Total | 512 (100.0%) | 718 (100.0%) |
Health & Disability in Mount Pleasant
Health Insurance Coverage by Age in Mount Pleasant
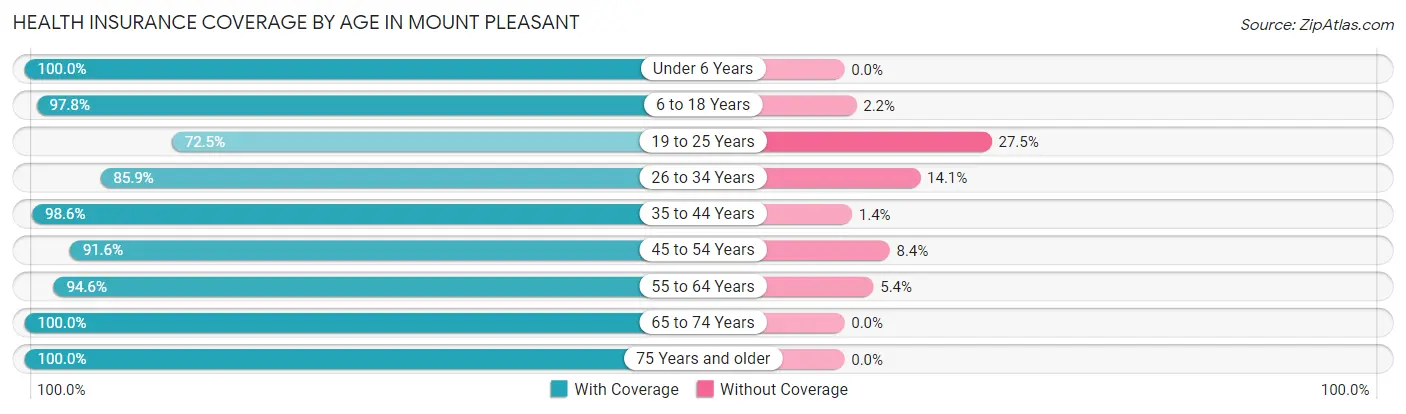
| Age Bracket | With Coverage | Without Coverage |
| Under 6 Years | 172 (100.0%) | 0 (0.0%) |
| 6 to 18 Years | 834 (97.8%) | 19 (2.2%) |
| 19 to 25 Years | 317 (72.5%) | 120 (27.5%) |
| 26 to 34 Years | 419 (85.9%) | 69 (14.1%) |
| 35 to 44 Years | 561 (98.6%) | 8 (1.4%) |
| 45 to 54 Years | 575 (91.6%) | 53 (8.4%) |
| 55 to 64 Years | 821 (94.6%) | 47 (5.4%) |
| 65 to 74 Years | 494 (100.0%) | 0 (0.0%) |
| 75 Years and older | 216 (100.0%) | 0 (0.0%) |
| Total | 4,409 (93.3%) | 316 (6.7%) |
Health Insurance Coverage by Citizenship Status in Mount Pleasant
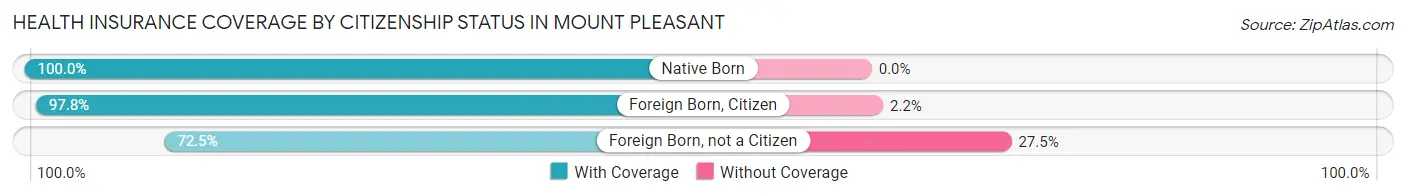
| Citizenship Status | With Coverage | Without Coverage |
| Native Born | 172 (100.0%) | 0 (0.0%) |
| Foreign Born, Citizen | 834 (97.8%) | 19 (2.2%) |
| Foreign Born, not a Citizen | 317 (72.5%) | 120 (27.5%) |
Health Insurance Coverage by Household Income in Mount Pleasant
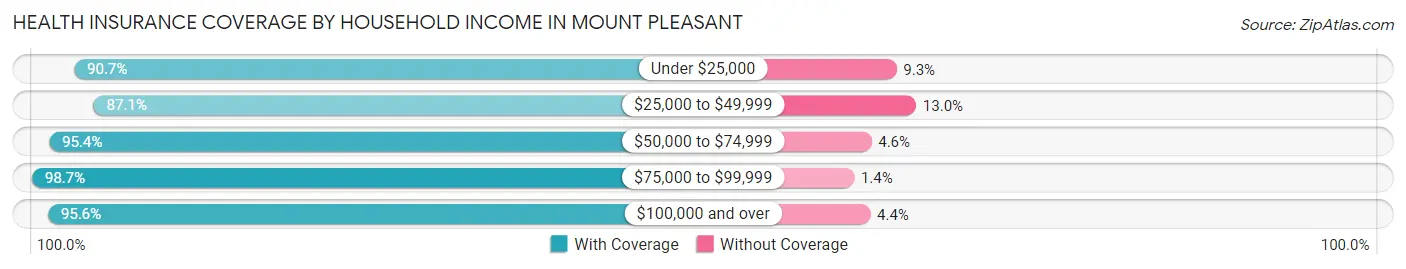
| Household Income | With Coverage | Without Coverage |
| Under $25,000 | 1,105 (90.7%) | 113 (9.3%) |
| $25,000 to $49,999 | 679 (87.1%) | 101 (13.0%) |
| $50,000 to $74,999 | 727 (95.4%) | 35 (4.6%) |
| $75,000 to $99,999 | 586 (98.7%) | 8 (1.3%) |
| $100,000 and over | 1,295 (95.6%) | 59 (4.4%) |
Public vs Private Health Insurance Coverage by Age in Mount Pleasant
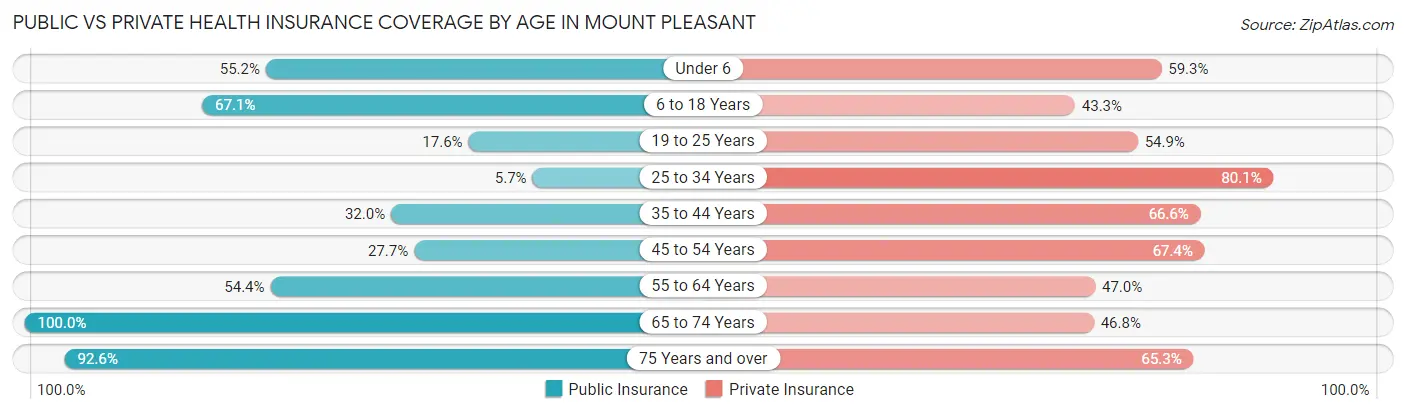
| Age Bracket | Public Insurance | Private Insurance |
| Under 6 | 95 (55.2%) | 102 (59.3%) |
| 6 to 18 Years | 572 (67.1%) | 369 (43.3%) |
| 19 to 25 Years | 77 (17.6%) | 240 (54.9%) |
| 25 to 34 Years | 28 (5.7%) | 391 (80.1%) |
| 35 to 44 Years | 182 (32.0%) | 379 (66.6%) |
| 45 to 54 Years | 174 (27.7%) | 423 (67.4%) |
| 55 to 64 Years | 472 (54.4%) | 408 (47.0%) |
| 65 to 74 Years | 494 (100.0%) | 231 (46.8%) |
| 75 Years and over | 200 (92.6%) | 141 (65.3%) |
| Total | 2,294 (48.5%) | 2,684 (56.8%) |
Disability Status by Sex by Age in Mount Pleasant
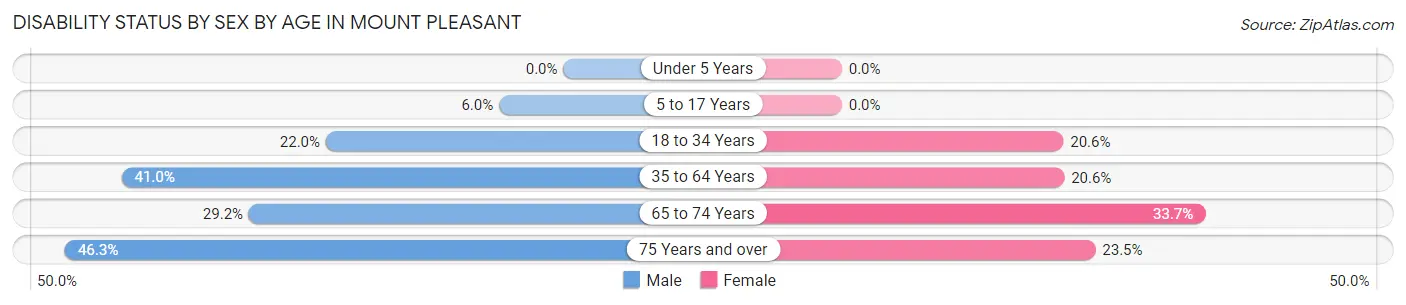
| Age Bracket | Male | Female |
| Under 5 Years | 0 (0.0%) | 0 (0.0%) |
| 5 to 17 Years | 27 (6.0%) | 0 (0.0%) |
| 18 to 34 Years | 82 (22.0%) | 118 (20.6%) |
| 35 to 64 Years | 376 (41.0%) | 237 (20.6%) |
| 65 to 74 Years | 68 (29.2%) | 88 (33.7%) |
| 75 Years and over | 37 (46.3%) | 32 (23.5%) |
Disability Class by Sex by Age in Mount Pleasant
Disability Class: Hearing Difficulty
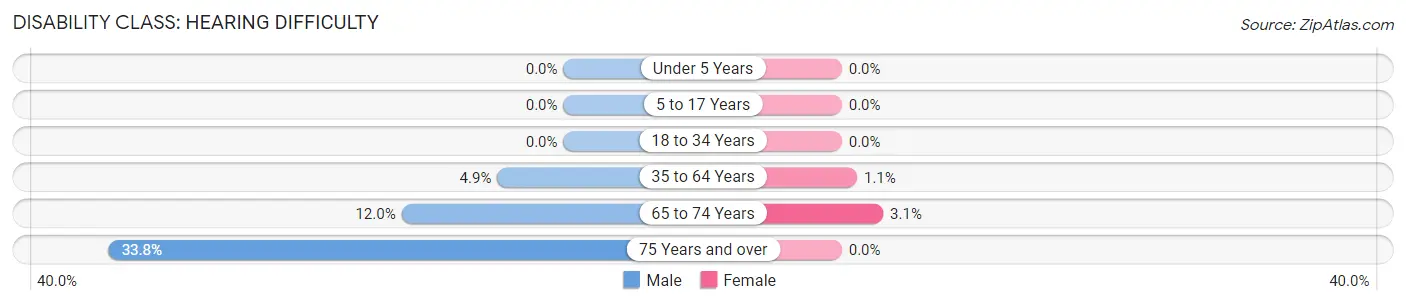
| Age Bracket | Male | Female |
| Under 5 Years | 0 (0.0%) | 0 (0.0%) |
| 5 to 17 Years | 0 (0.0%) | 0 (0.0%) |
| 18 to 34 Years | 0 (0.0%) | 0 (0.0%) |
| 35 to 64 Years | 45 (4.9%) | 13 (1.1%) |
| 65 to 74 Years | 28 (12.0%) | 8 (3.1%) |
| 75 Years and over | 27 (33.8%) | 0 (0.0%) |
Disability Class: Vision Difficulty
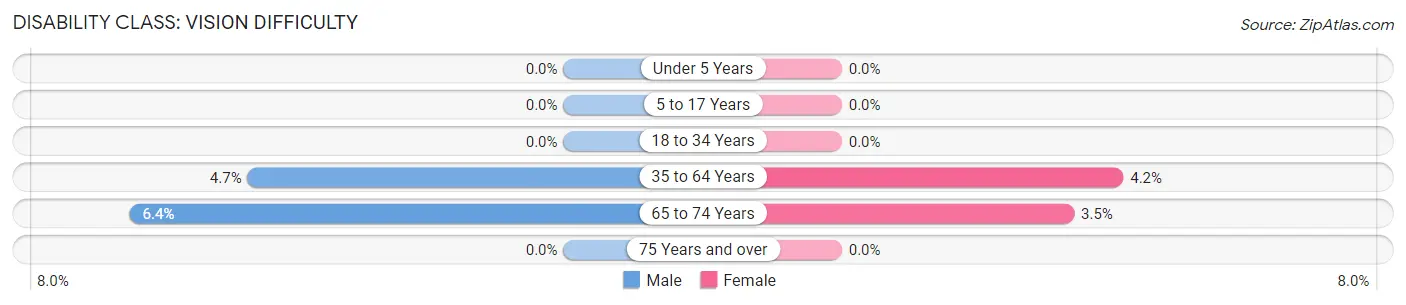
| Age Bracket | Male | Female |
| Under 5 Years | 0 (0.0%) | 0 (0.0%) |
| 5 to 17 Years | 0 (0.0%) | 0 (0.0%) |
| 18 to 34 Years | 0 (0.0%) | 0 (0.0%) |
| 35 to 64 Years | 43 (4.7%) | 48 (4.2%) |
| 65 to 74 Years | 15 (6.4%) | 9 (3.5%) |
| 75 Years and over | 0 (0.0%) | 0 (0.0%) |
Disability Class: Cognitive Difficulty
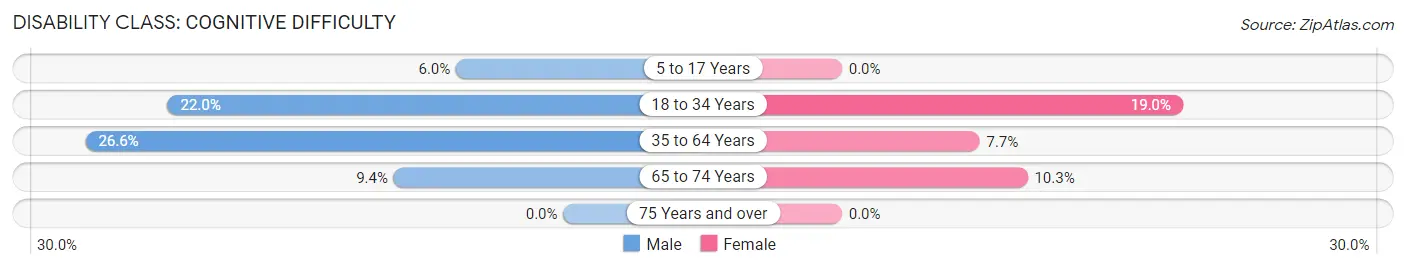
| Age Bracket | Male | Female |
| 5 to 17 Years | 27 (6.0%) | 0 (0.0%) |
| 18 to 34 Years | 82 (22.0%) | 109 (19.0%) |
| 35 to 64 Years | 244 (26.6%) | 88 (7.7%) |
| 65 to 74 Years | 22 (9.4%) | 27 (10.3%) |
| 75 Years and over | 0 (0.0%) | 0 (0.0%) |
Disability Class: Ambulatory Difficulty
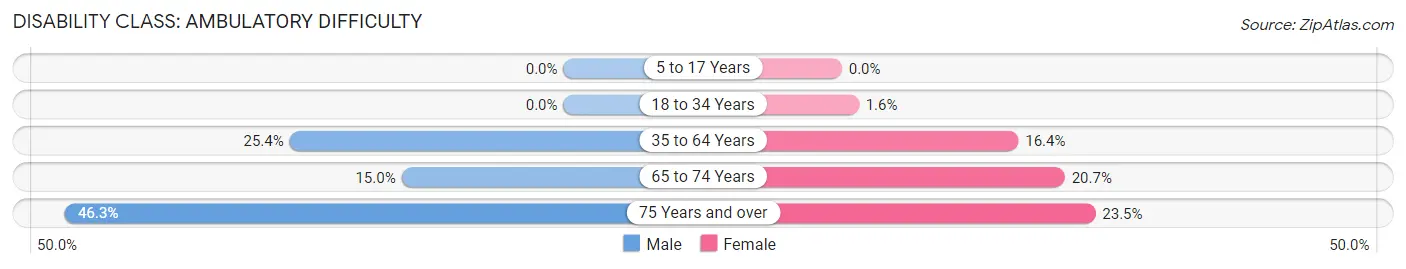
| Age Bracket | Male | Female |
| 5 to 17 Years | 0 (0.0%) | 0 (0.0%) |
| 18 to 34 Years | 0 (0.0%) | 9 (1.6%) |
| 35 to 64 Years | 233 (25.4%) | 188 (16.4%) |
| 65 to 74 Years | 35 (15.0%) | 54 (20.7%) |
| 75 Years and over | 37 (46.3%) | 32 (23.5%) |
Disability Class: Self-Care Difficulty
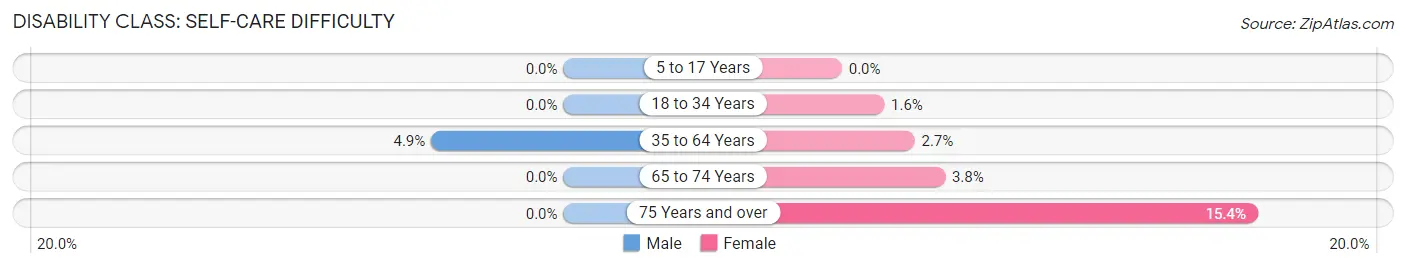
| Age Bracket | Male | Female |
| 5 to 17 Years | 0 (0.0%) | 0 (0.0%) |
| 18 to 34 Years | 0 (0.0%) | 9 (1.6%) |
| 35 to 64 Years | 45 (4.9%) | 31 (2.7%) |
| 65 to 74 Years | 0 (0.0%) | 10 (3.8%) |
| 75 Years and over | 0 (0.0%) | 21 (15.4%) |
Technology Access in Mount Pleasant
Computing Device Access in Mount Pleasant
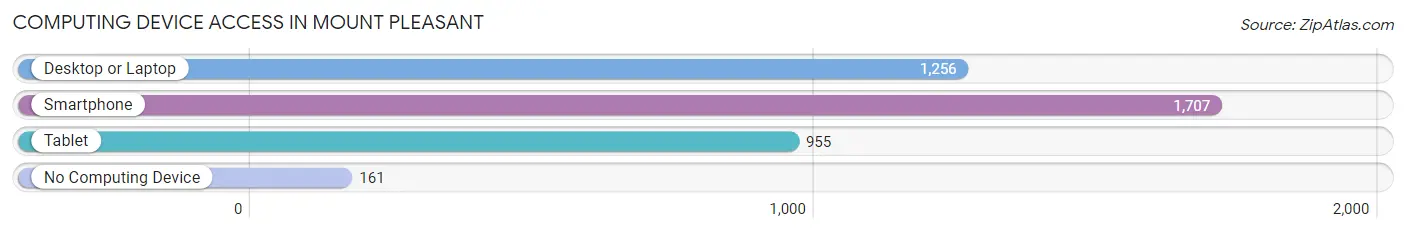
| Device Type | # Households | % Households |
| Desktop or Laptop | 1,256 | 62.8% |
| Smartphone | 1,707 | 85.4% |
| Tablet | 955 | 47.8% |
| No Computing Device | 161 | 8.1% |
| Total | 1,999 | 100.0% |
Internet Access in Mount Pleasant
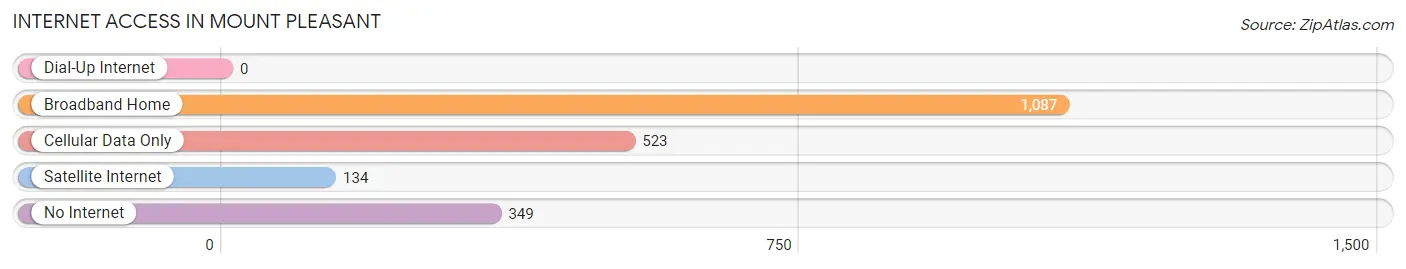
| Internet Type | # Households | % Households |
| Dial-Up Internet | 0 | 0.0% |
| Broadband Home | 1,087 | 54.4% |
| Cellular Data Only | 523 | 26.2% |
| Satellite Internet | 134 | 6.7% |
| No Internet | 349 | 17.5% |
| Total | 1,999 | 100.0% |
Mount Pleasant Summary
Introduction
Mount Pleasant is a small town located in Maury County, Tennessee. It is situated in the middle of the state, about an hour south of Nashville. The town has a population of approximately 8,000 people and is known for its rural charm and friendly atmosphere. The town is home to a variety of businesses, including a few small manufacturing companies, a few restaurants, and a few retail stores. The town is also home to a few churches, a library, and a few schools.
History
Mount Pleasant was founded in 1820 by a group of settlers from North Carolina. The town was named after the nearby mountain, which was named after the nearby creek. The town was originally a farming community, but it soon became a center for manufacturing and industry. In the late 1800s, the town was home to several factories, including a cotton mill, a shoe factory, and a furniture factory.
In the early 1900s, the town began to experience a period of growth and prosperity. The town was home to several banks, a movie theater, and a variety of stores. The town also had a thriving business district, which included a variety of shops and restaurants.
In the mid-1900s, the town began to experience a period of decline. Many of the factories and businesses closed, and the population began to decline. In the late 1900s, the town began to experience a period of revitalization. The town was home to several new businesses, including a few restaurants and retail stores.
Geography
Mount Pleasant is located in the middle of Maury County, Tennessee. The town is situated in the foothills of the Appalachian Mountains, and is surrounded by rolling hills and forests. The town is located near the Duck River, which is a popular destination for fishing and canoeing. The town is also located near several state parks, including Henry Horton State Park and Natchez Trace State Park.
Economy
The economy of Mount Pleasant is largely based on agriculture and manufacturing. The town is home to several small manufacturing companies, including a few furniture factories and a few clothing factories. The town is also home to a few restaurants and retail stores. The town is also home to a few banks and a few schools.
Demographics
As of the 2010 census, the population of Mount Pleasant was 8,000 people. The town is predominantly white, with a small African American population. The median household income in the town is $37,000, and the median home value is $125,000. The town has a low unemployment rate, and the majority of the population is employed in the manufacturing and agricultural industries.
Conclusion
Mount Pleasant is a small town located in Maury County, Tennessee. The town has a population of approximately 8,000 people and is known for its rural charm and friendly atmosphere. The town is home to a variety of businesses, including a few small manufacturing companies, a few restaurants, and a few retail stores. The town is also home to a few churches, a library, and a few schools. The economy of Mount Pleasant is largely based on agriculture and manufacturing, and the town has a low unemployment rate. The town is predominantly white, with a small African American population.
Common Questions
What is Per Capita Income in Mount Pleasant?
Per Capita income in Mount Pleasant is $29,685.
What is the Median Family Income in Mount Pleasant?
Median Family Income in Mount Pleasant is $70,938.
What is the Median Household income in Mount Pleasant?
Median Household Income in Mount Pleasant is $47,988.
What is Income or Wage Gap in Mount Pleasant?
Income or Wage Gap in Mount Pleasant is 7.6%.
Women in Mount Pleasant earn 92.4 cents for every dollar earned by a man.
What is Inequality or Gini Index in Mount Pleasant?
Inequality or Gini Index in Mount Pleasant is 0.53.
What is the Total Population of Mount Pleasant?
Total Population of Mount Pleasant is 4,781.
What is the Total Male Population of Mount Pleasant?
Total Male Population of Mount Pleasant is 2,176.
What is the Total Female Population of Mount Pleasant?
Total Female Population of Mount Pleasant is 2,605.
What is the Ratio of Males per 100 Females in Mount Pleasant?
There are 83.53 Males per 100 Females in Mount Pleasant.
What is the Ratio of Females per 100 Males in Mount Pleasant?
There are 119.72 Females per 100 Males in Mount Pleasant.
What is the Median Population Age in Mount Pleasant?
Median Population Age in Mount Pleasant is 43.5 Years.
What is the Average Family Size in Mount Pleasant
Average Family Size in Mount Pleasant is 3.1 People.
What is the Average Household Size in Mount Pleasant
Average Household Size in Mount Pleasant is 2.4 People.
How Large is the Labor Force in Mount Pleasant?
There are 2,148 People in the Labor Forcein in Mount Pleasant.
What is the Percentage of People in the Labor Force in Mount Pleasant?
54.3% of People are in the Labor Force in Mount Pleasant.
What is the Unemployment Rate in Mount Pleasant?
Unemployment Rate in Mount Pleasant is 4.0%.