Waynesboro, TN Map & Demographics
Waynesboro Map
Waynesboro Overview
$22,703
PER CAPITA INCOME
$53,657
AVG FAMILY INCOME
$27,031
AVG HOUSEHOLD INCOME
2.3%
WAGE / INCOME GAP [ % ]
97.7¢/ $1
WAGE / INCOME GAP [ $ ]
0.56
INEQUALITY / GINI INDEX
2,379
TOTAL POPULATION
1,122
MALE POPULATION
1,257
FEMALE POPULATION
89.26
MALES / 100 FEMALES
112.03
FEMALES / 100 MALES
43.5
MEDIAN AGE
3.0
AVG FAMILY SIZE
2.3
AVG HOUSEHOLD SIZE
803
LABOR FORCE [ PEOPLE ]
41.4%
PERCENT IN LABOR FORCE
7.8%
UNEMPLOYMENT RATE
Waynesboro Zip Codes
Waynesboro Area Codes
Income in Waynesboro
Income Overview in Waynesboro
Per Capita Income in Waynesboro is $22,703, while median incomes of families and households are $53,657 and $27,031 respectively.
| Characteristic | Number | Measure |
| Per Capita Income | 2,379 | $22,703 |
| Median Family Income | 514 | $53,657 |
| Mean Family Income | 514 | $74,915 |
| Median Household Income | 881 | $27,031 |
| Mean Household Income | 881 | $52,067 |
| Income Deficit | 514 | $0 |
| Wage / Income Gap (%) | 2,379 | 2.30% |
| Wage / Income Gap ($) | 2,379 | 97.70¢ per $1 |
| Gini / Inequality Index | 2,379 | 0.56 |
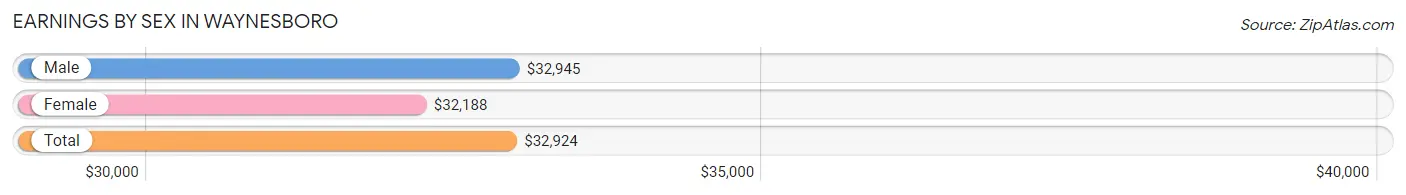
Earnings by Sex in Waynesboro
Average Earnings in Waynesboro are $32,924, $32,945 for men and $32,188 for women, a difference of 2.3%.
| Sex | Number | Average Earnings |
| Male | 481 (56.9%) | $32,945 |
| Female | 365 (43.1%) | $32,188 |
| Total | 846 (100.0%) | $32,924 |
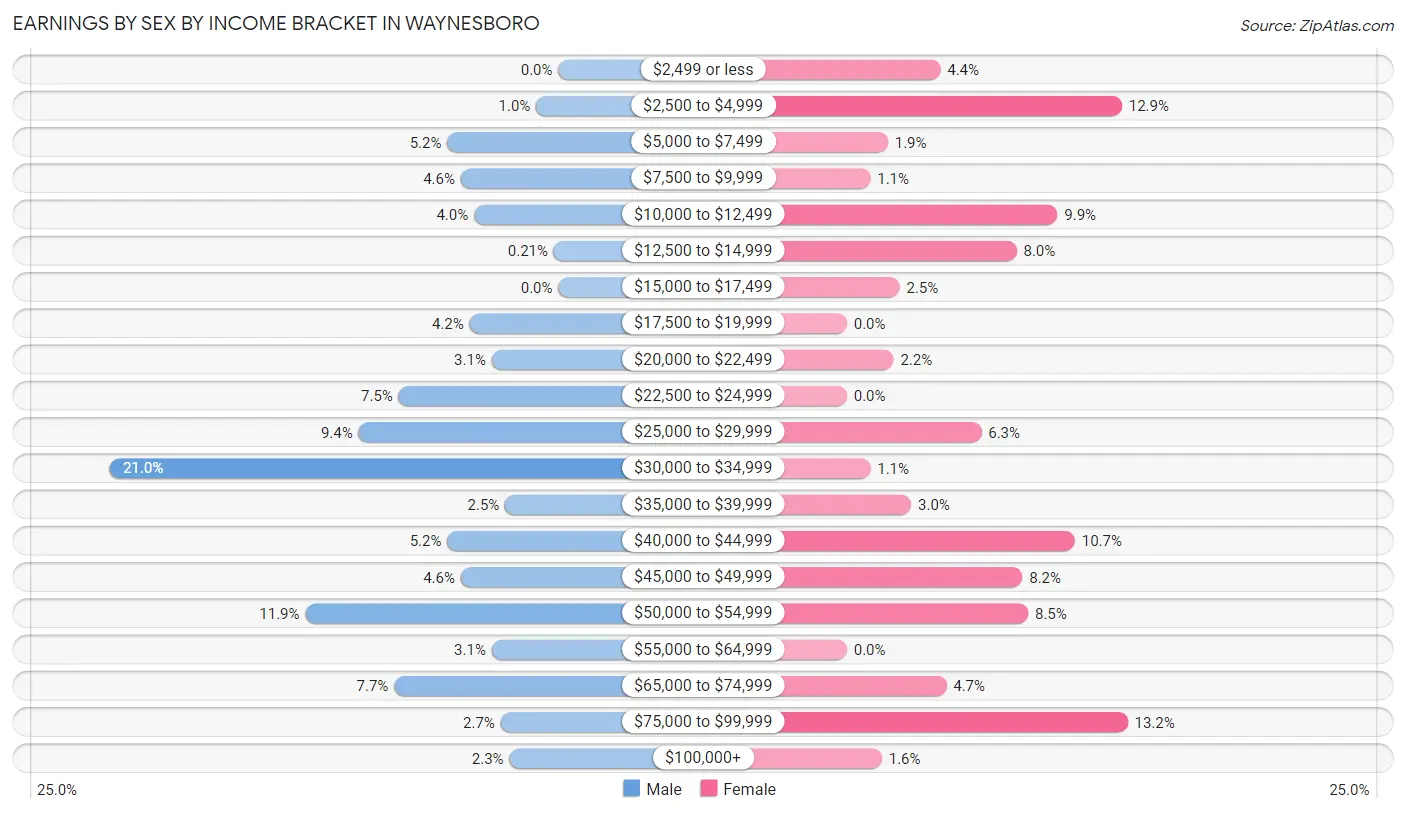
Earnings by Sex by Income Bracket in Waynesboro
The most common earnings brackets in Waynesboro are $30,000 to $34,999 for men (101 | 21.0%) and $75,000 to $99,999 for women (48 | 13.2%).
| Income | Male | Female |
| $2,499 or less | 0 (0.0%) | 16 (4.4%) |
| $2,500 to $4,999 | 5 (1.0%) | 47 (12.9%) |
| $5,000 to $7,499 | 25 (5.2%) | 7 (1.9%) |
| $7,500 to $9,999 | 22 (4.6%) | 4 (1.1%) |
| $10,000 to $12,499 | 19 (4.0%) | 36 (9.9%) |
| $12,500 to $14,999 | 1 (0.2%) | 29 (8.0%) |
| $15,000 to $17,499 | 0 (0.0%) | 9 (2.5%) |
| $17,500 to $19,999 | 20 (4.2%) | 0 (0.0%) |
| $20,000 to $22,499 | 15 (3.1%) | 8 (2.2%) |
| $22,500 to $24,999 | 36 (7.5%) | 0 (0.0%) |
| $25,000 to $29,999 | 45 (9.4%) | 23 (6.3%) |
| $30,000 to $34,999 | 101 (21.0%) | 4 (1.1%) |
| $35,000 to $39,999 | 12 (2.5%) | 11 (3.0%) |
| $40,000 to $44,999 | 25 (5.2%) | 39 (10.7%) |
| $45,000 to $49,999 | 22 (4.6%) | 30 (8.2%) |
| $50,000 to $54,999 | 57 (11.8%) | 31 (8.5%) |
| $55,000 to $64,999 | 15 (3.1%) | 0 (0.0%) |
| $65,000 to $74,999 | 37 (7.7%) | 17 (4.7%) |
| $75,000 to $99,999 | 13 (2.7%) | 48 (13.2%) |
| $100,000+ | 11 (2.3%) | 6 (1.6%) |
| Total | 481 (100.0%) | 365 (100.0%) |
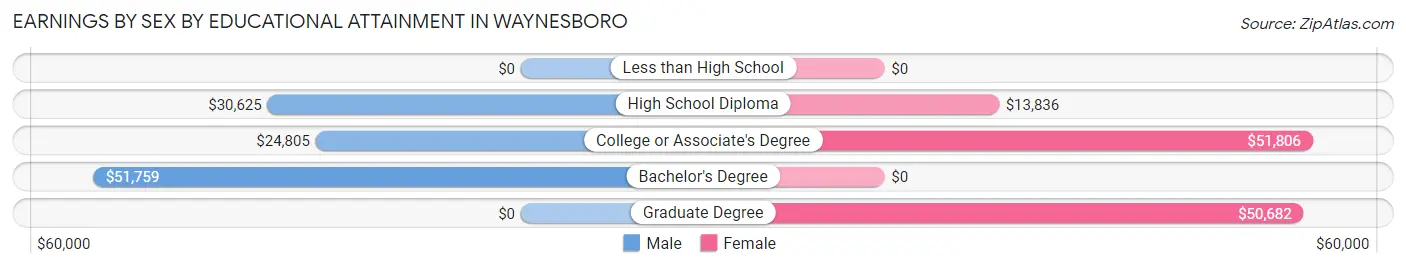
Earnings by Sex by Educational Attainment in Waynesboro
Average earnings in Waynesboro are $38,906 for men and $39,063 for women, a difference of 0.4%. Men with an educational attainment of bachelor's degree enjoy the highest average annual earnings of $51,759, while those with college or associate's degree education earn the least with $24,805. Women with an educational attainment of college or associate's degree earn the most with the average annual earnings of $51,806, while those with high school diploma education have the smallest earnings of $13,836.
| Educational Attainment | Male Income | Female Income |
| Less than High School | - | - |
| High School Diploma | $30,625 | $13,836 |
| College or Associate's Degree | $24,805 | $51,806 |
| Bachelor's Degree | $51,759 | $0 |
| Graduate Degree | - | - |
| Total | $38,906 | $39,063 |
Family Income in Waynesboro
Family Income Brackets in Waynesboro
According to the Waynesboro family income data, there are 109 families falling into the $50,000 to $74,999 income range, which is the most common income bracket and makes up 21.2% of all families.
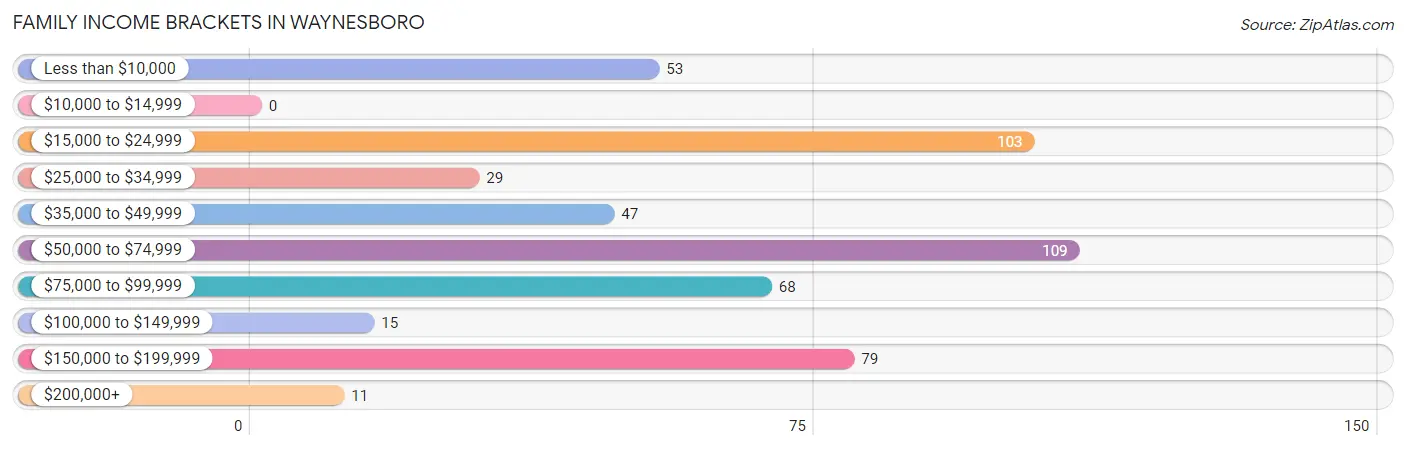
| Income Bracket | # Families | % Families |
| Less than $10,000 | 53 | 10.3% |
| $10,000 to $14,999 | 0 | 0.0% |
| $15,000 to $24,999 | 103 | 20.0% |
| $25,000 to $34,999 | 29 | 5.6% |
| $35,000 to $49,999 | 47 | 9.1% |
| $50,000 to $74,999 | 109 | 21.2% |
| $75,000 to $99,999 | 68 | 13.2% |
| $100,000 to $149,999 | 15 | 2.9% |
| $150,000 to $199,999 | 79 | 15.4% |
| $200,000+ | 11 | 2.1% |
Family Income by Famaliy Size in Waynesboro
3-person families (156 | 30.3%) account for the highest median family income in Waynesboro with $53,704 per family, while 2-person families (250 | 48.6%) have the highest median income of $18,125 per family member.
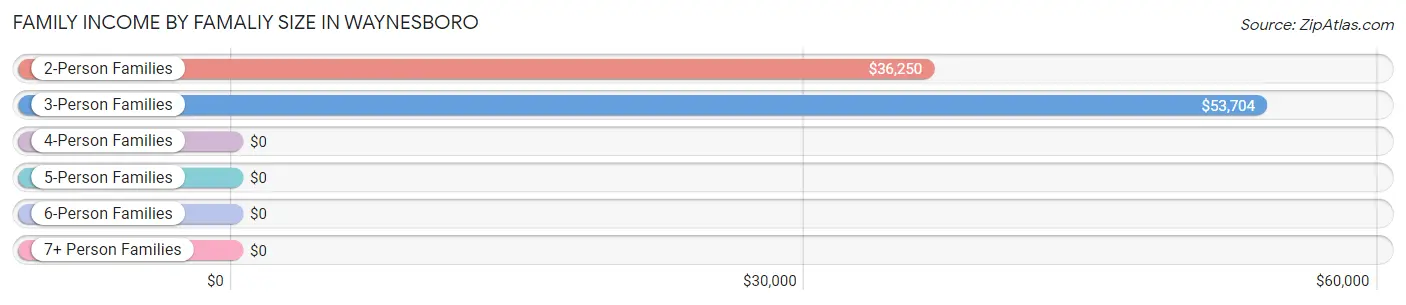
| Income Bracket | # Families | Median Income |
| 2-Person Families | 250 (48.6%) | $36,250 |
| 3-Person Families | 156 (30.3%) | $53,704 |
| 4-Person Families | 92 (17.9%) | $0 |
| 5-Person Families | 8 (1.6%) | $0 |
| 6-Person Families | 1 (0.2%) | $0 |
| 7+ Person Families | 7 (1.4%) | $0 |
| Total | 514 (100.0%) | $53,657 |
Family Income by Number of Earners in Waynesboro
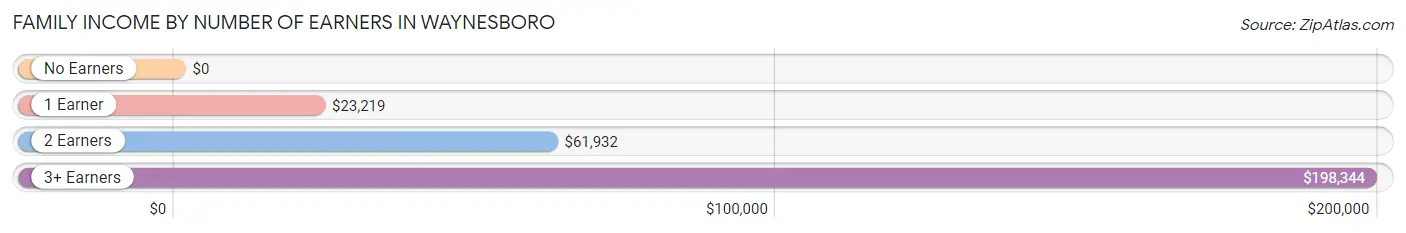
| Number of Earners | # Families | Median Income |
| No Earners | 130 (25.3%) | $0 |
| 1 Earner | 159 (30.9%) | $23,219 |
| 2 Earners | 172 (33.5%) | $61,932 |
| 3+ Earners | 53 (10.3%) | $198,344 |
| Total | 514 (100.0%) | $53,657 |
Household Income in Waynesboro
Household Income Brackets in Waynesboro
With 181 households falling in the category, the less than $10,000 income range is the most frequent in Waynesboro, accounting for 20.5% of all households. In contrast, only 11 households (1.3%) fall into the $200,000+ income bracket, making it the least populous group.
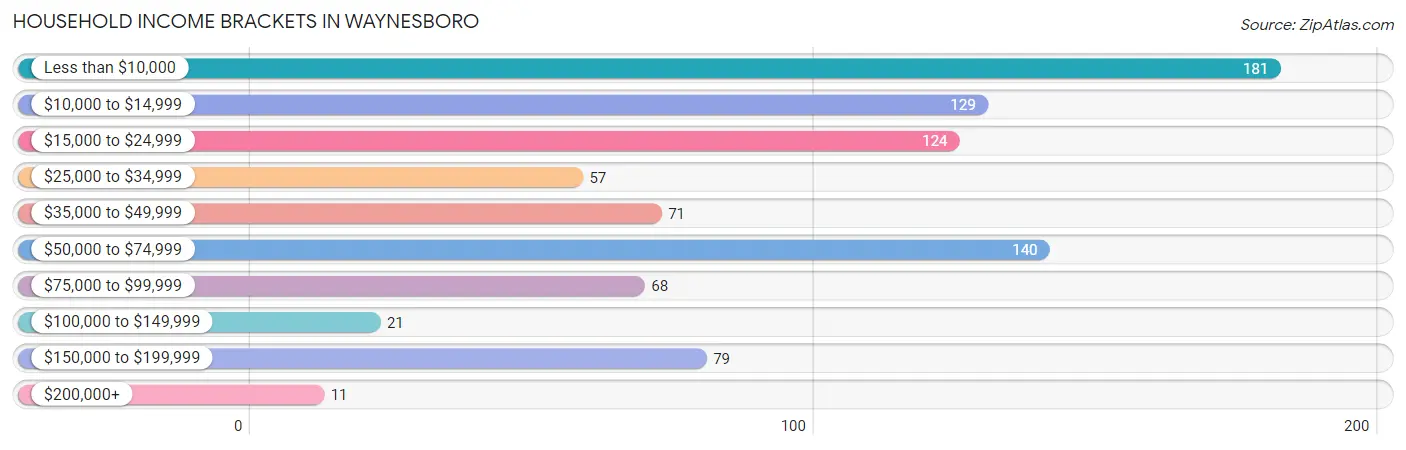
| Income Bracket | # Households | % Households |
| Less than $10,000 | 181 | 20.5% |
| $10,000 to $14,999 | 129 | 14.6% |
| $15,000 to $24,999 | 124 | 14.1% |
| $25,000 to $34,999 | 57 | 6.5% |
| $35,000 to $49,999 | 71 | 8.1% |
| $50,000 to $74,999 | 140 | 15.9% |
| $75,000 to $99,999 | 68 | 7.7% |
| $100,000 to $149,999 | 21 | 2.4% |
| $150,000 to $199,999 | 79 | 9.0% |
| $200,000+ | 11 | 1.2% |
Household Income by Householder Age in Waynesboro
The median household income in Waynesboro is $27,031, with the highest median household income of $48,553 found in the 25 to 44 years age bracket for the primary householder. A total of 280 households (31.8%) fall into this category. Meanwhile, the 15 to 24 years age bracket for the primary householder has the lowest median household income of $0, with 36 households (4.1%) in this group.
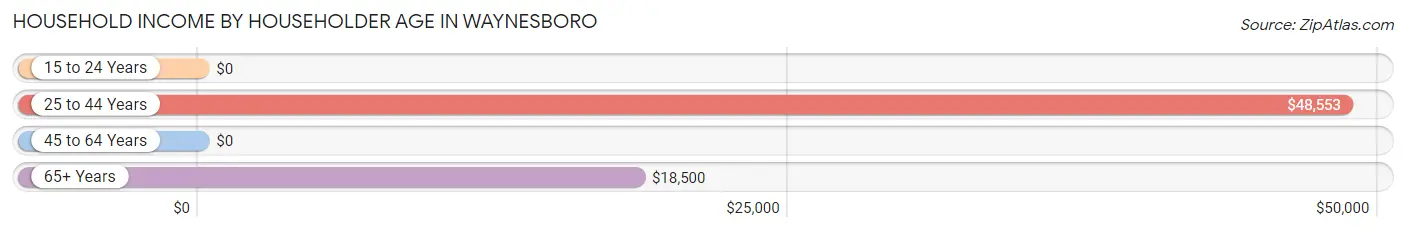
| Income Bracket | # Households | Median Income |
| 15 to 24 Years | 36 (4.1%) | $0 |
| 25 to 44 Years | 280 (31.8%) | $48,553 |
| 45 to 64 Years | 231 (26.2%) | $0 |
| 65+ Years | 334 (37.9%) | $18,500 |
| Total | 881 (100.0%) | $27,031 |
Poverty in Waynesboro
Income Below Poverty by Sex and Age in Waynesboro
With 30.7% poverty level for males and 43.3% for females among the residents of Waynesboro, 15 year old males and 5 year old females are the most vulnerable to poverty, with 4 males (100.0%) and 8 females (100.0%) in their respective age groups living below the poverty level.
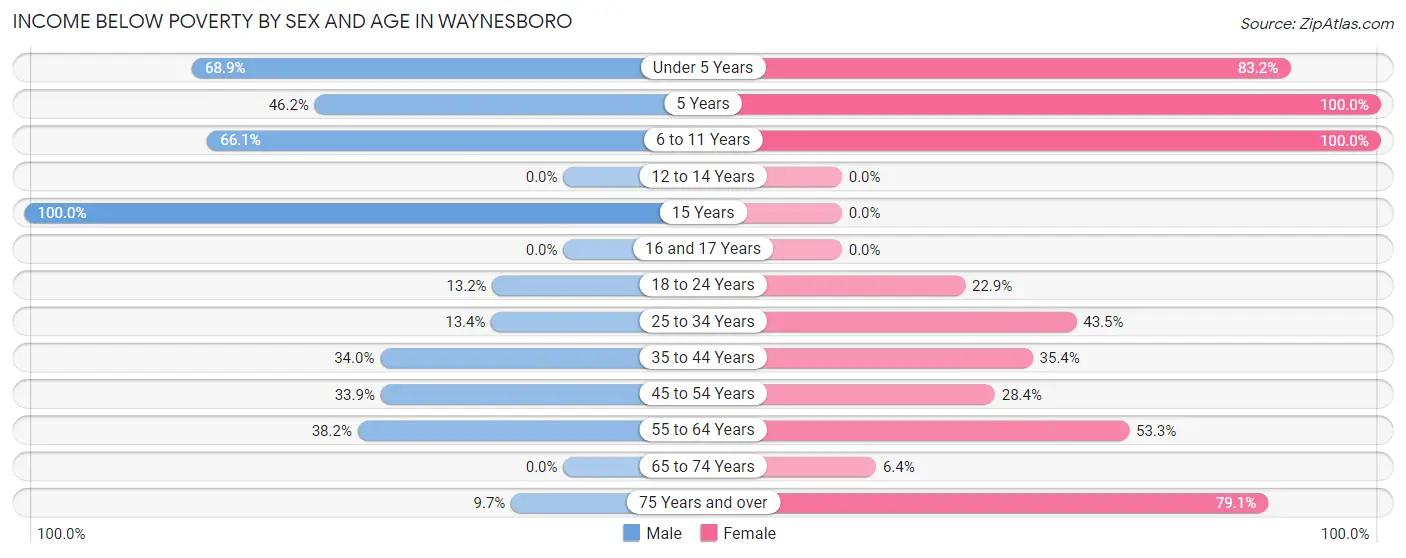
| Age Bracket | Male | Female |
| Under 5 Years | 93 (68.9%) | 89 (83.2%) |
| 5 Years | 6 (46.2%) | 8 (100.0%) |
| 6 to 11 Years | 37 (66.1%) | 33 (100.0%) |
| 12 to 14 Years | 0 (0.0%) | 0 (0.0%) |
| 15 Years | 4 (100.0%) | 0 (0.0%) |
| 16 and 17 Years | 0 (0.0%) | 0 (0.0%) |
| 18 to 24 Years | 15 (13.2%) | 27 (22.9%) |
| 25 to 34 Years | 19 (13.4%) | 47 (43.5%) |
| 35 to 44 Years | 52 (34.0%) | 17 (35.4%) |
| 45 to 54 Years | 20 (33.9%) | 48 (28.4%) |
| 55 to 64 Years | 29 (38.2%) | 48 (53.3%) |
| 65 to 74 Years | 0 (0.0%) | 8 (6.4%) |
| 75 Years and over | 6 (9.7%) | 159 (79.1%) |
| Total | 281 (30.7%) | 484 (43.3%) |
Income Above Poverty by Sex and Age in Waynesboro
According to the poverty statistics in Waynesboro, males aged 12 to 14 years and females aged 12 to 14 years are the age groups that are most secure financially, with 100.0% of males and 100.0% of females in these age groups living above the poverty line.
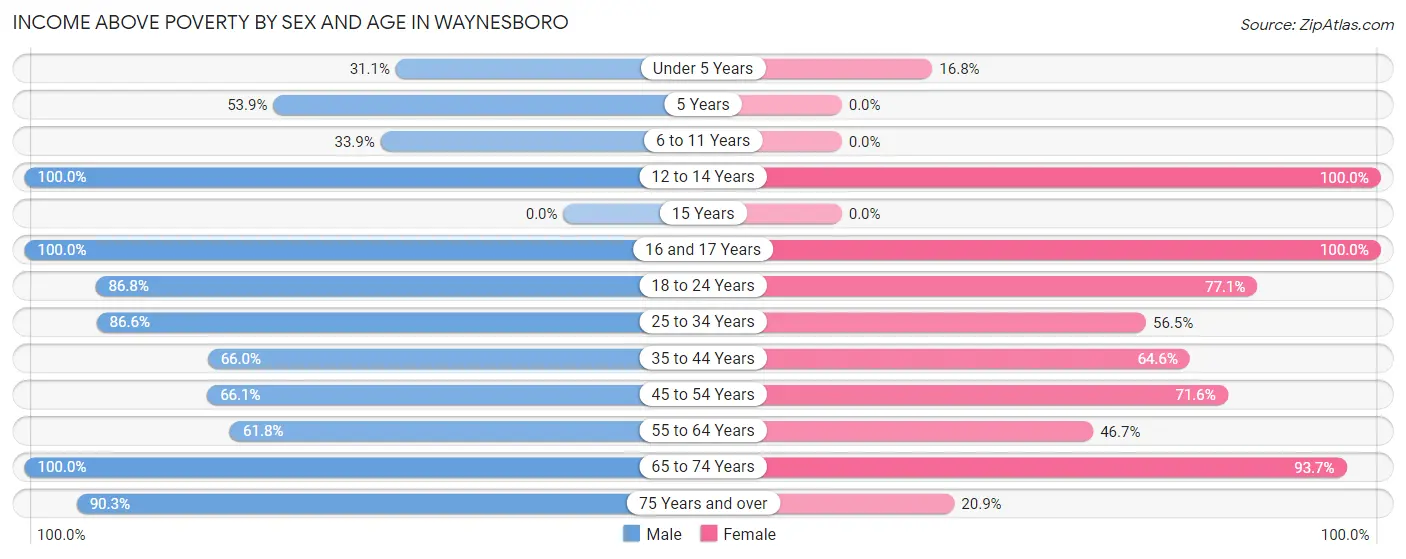
| Age Bracket | Male | Female |
| Under 5 Years | 42 (31.1%) | 18 (16.8%) |
| 5 Years | 7 (53.8%) | 0 (0.0%) |
| 6 to 11 Years | 19 (33.9%) | 0 (0.0%) |
| 12 to 14 Years | 28 (100.0%) | 24 (100.0%) |
| 15 Years | 0 (0.0%) | 0 (0.0%) |
| 16 and 17 Years | 17 (100.0%) | 85 (100.0%) |
| 18 to 24 Years | 99 (86.8%) | 91 (77.1%) |
| 25 to 34 Years | 123 (86.6%) | 61 (56.5%) |
| 35 to 44 Years | 101 (66.0%) | 31 (64.6%) |
| 45 to 54 Years | 39 (66.1%) | 121 (71.6%) |
| 55 to 64 Years | 47 (61.8%) | 42 (46.7%) |
| 65 to 74 Years | 57 (100.0%) | 118 (93.6%) |
| 75 Years and over | 56 (90.3%) | 42 (20.9%) |
| Total | 635 (69.3%) | 633 (56.7%) |
Income Below Poverty Among Married-Couple Families in Waynesboro
The poverty statistics for married-couple families in Waynesboro show that 2.2% or 7 of the total 320 families live below the poverty line. Families with 3 or 4 children have the highest poverty rate of 100.0%, comprising of 7 families. On the other hand, families with no children have the lowest poverty rate of 0.0%, which includes 0 families.
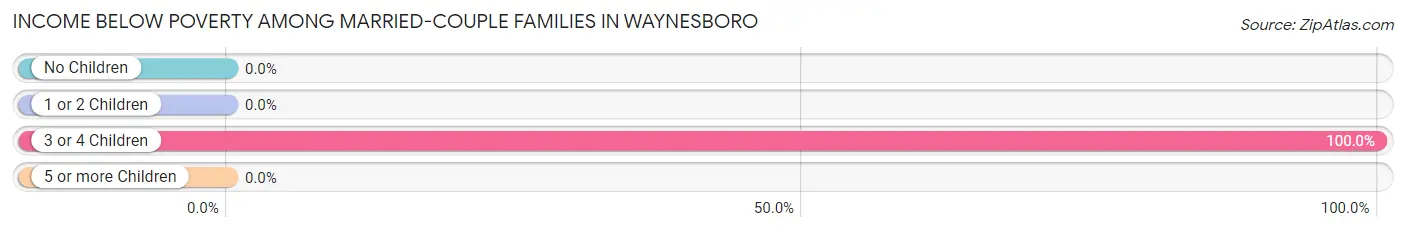
| Children | Above Poverty | Below Poverty |
| No Children | 195 (100.0%) | 0 (0.0%) |
| 1 or 2 Children | 118 (100.0%) | 0 (0.0%) |
| 3 or 4 Children | 0 (0.0%) | 7 (100.0%) |
| 5 or more Children | 0 (0.0%) | 0 (0.0%) |
| Total | 313 (97.8%) | 7 (2.2%) |
Income Below Poverty Among Single-Parent Households in Waynesboro
According to the poverty data in Waynesboro, 28.6% or 20 single-father households and 61.3% or 76 single-mother households are living below the poverty line. Among single-father households, those with 1 or 2 children have the highest poverty rate, with 20 households (31.2%) experiencing poverty. Likewise, among single-mother households, those with 3 or 4 children have the highest poverty rate, with 8 households (88.9%) falling below the poverty line.
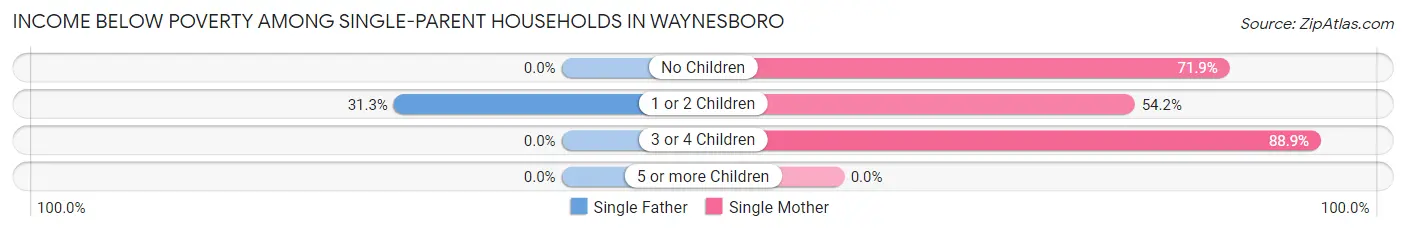
| Children | Single Father | Single Mother |
| No Children | 0 (0.0%) | 23 (71.9%) |
| 1 or 2 Children | 20 (31.2%) | 45 (54.2%) |
| 3 or 4 Children | 0 (0.0%) | 8 (88.9%) |
| 5 or more Children | 0 (0.0%) | 0 (0.0%) |
| Total | 20 (28.6%) | 76 (61.3%) |
Income Below Poverty Among Married-Couple vs Single-Parent Households in Waynesboro
The poverty data for Waynesboro shows that 7 of the married-couple family households (2.2%) and 96 of the single-parent households (49.5%) are living below the poverty level. Within the married-couple family households, those with 3 or 4 children have the highest poverty rate, with 7 households (100.0%) falling below the poverty line. Among the single-parent households, those with 3 or 4 children have the highest poverty rate, with 8 household (88.9%) living below poverty.
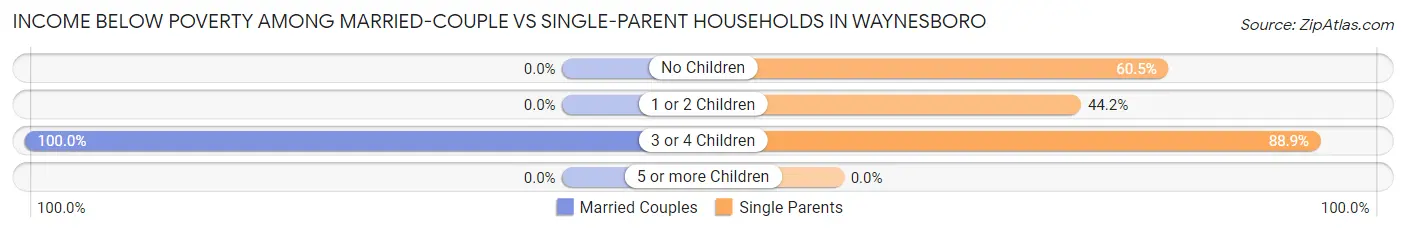
| Children | Married-Couple Families | Single-Parent Households |
| No Children | 0 (0.0%) | 23 (60.5%) |
| 1 or 2 Children | 0 (0.0%) | 65 (44.2%) |
| 3 or 4 Children | 7 (100.0%) | 8 (88.9%) |
| 5 or more Children | 0 (0.0%) | 0 (0.0%) |
| Total | 7 (2.2%) | 96 (49.5%) |
Race in Waynesboro
The most populous races in Waynesboro are White / Caucasian (1,916 | 80.5%), Black / African American (251 | 10.5%), and Two or more Races (193 | 8.1%).
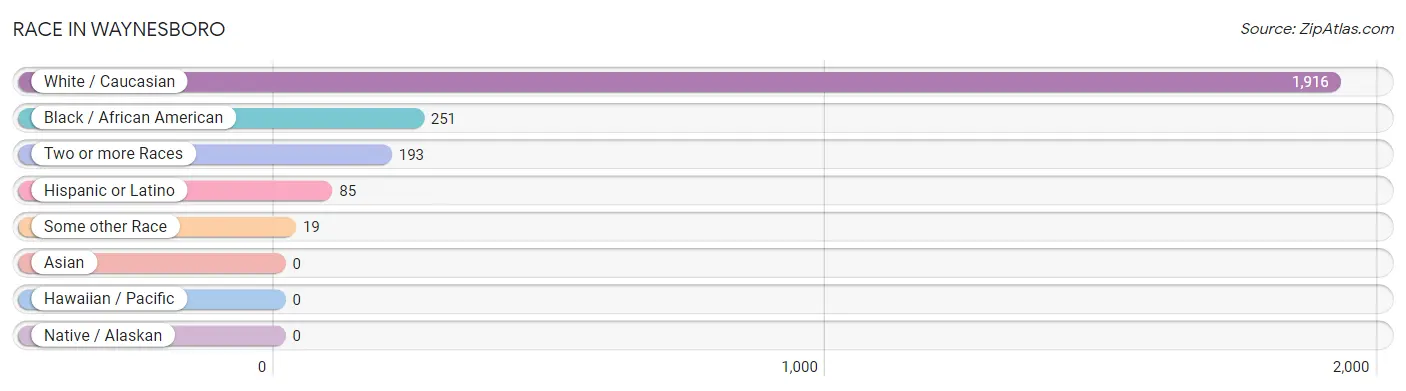
| Race | # Population | % Population |
| Asian | 0 | 0.0% |
| Black / African American | 251 | 10.5% |
| Hawaiian / Pacific | 0 | 0.0% |
| Hispanic or Latino | 85 | 3.6% |
| Native / Alaskan | 0 | 0.0% |
| White / Caucasian | 1,916 | 80.5% |
| Two or more Races | 193 | 8.1% |
| Some other Race | 19 | 0.8% |
| Total | 2,379 | 100.0% |
Ancestry in Waynesboro
The most populous ancestries reported in Waynesboro are American (348 | 14.6%), Irish (308 | 13.0%), German (245 | 10.3%), English (147 | 6.2%), and Italian (129 | 5.4%), together accounting for 49.5% of all Waynesboro residents.

| Ancestry | # Population | % Population |
| African | 14 | 0.6% |
| American | 348 | 14.6% |
| Austrian | 13 | 0.5% |
| Cherokee | 40 | 1.7% |
| Dutch | 63 | 2.6% |
| English | 147 | 6.2% |
| European | 22 | 0.9% |
| French | 26 | 1.1% |
| German | 245 | 10.3% |
| Irish | 308 | 13.0% |
| Italian | 129 | 5.4% |
| Mexican | 83 | 3.5% |
| Polish | 26 | 1.1% |
| Puerto Rican | 2 | 0.1% |
| Scotch-Irish | 54 | 2.3% |
| Scottish | 74 | 3.1% |
| Subsaharan African | 14 | 0.6% |
| Swiss | 8 | 0.3% | View All 18 Rows |
Immigrants in Waynesboro
The most numerous immigrant groups reported in Waynesboro came from Asia (3 | 0.1%), Laos (3 | 0.1%), and South Eastern Asia (3 | 0.1%), together accounting for 0.4% of all Waynesboro residents.
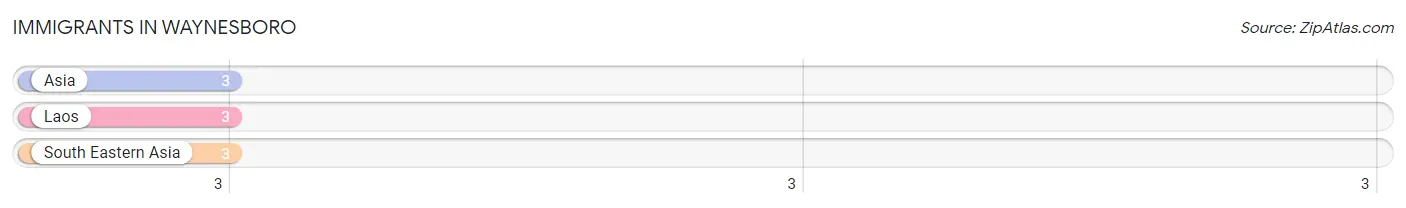
| Immigration Origin | # Population | % Population |
| Asia | 3 | 0.1% |
| Laos | 3 | 0.1% |
| South Eastern Asia | 3 | 0.1% | View All 3 Rows |
Sex and Age in Waynesboro
Sex and Age in Waynesboro
The most populous age groups in Waynesboro are 40 to 44 Years (143 | 12.8%) for men and 15 to 19 Years (164 | 13.1%) for women.
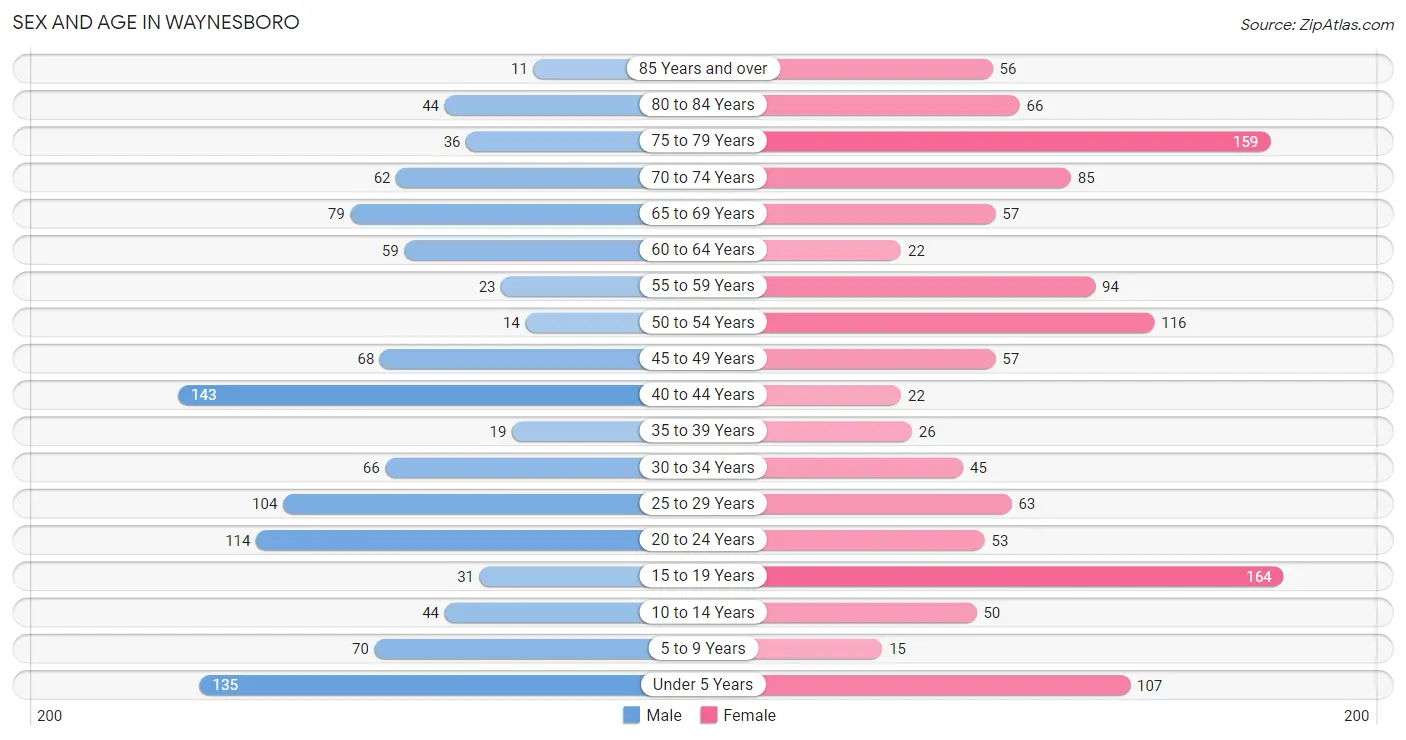
| Age Bracket | Male | Female |
| Under 5 Years | 135 (12.0%) | 107 (8.5%) |
| 5 to 9 Years | 70 (6.2%) | 15 (1.2%) |
| 10 to 14 Years | 44 (3.9%) | 50 (4.0%) |
| 15 to 19 Years | 31 (2.8%) | 164 (13.1%) |
| 20 to 24 Years | 114 (10.2%) | 53 (4.2%) |
| 25 to 29 Years | 104 (9.3%) | 63 (5.0%) |
| 30 to 34 Years | 66 (5.9%) | 45 (3.6%) |
| 35 to 39 Years | 19 (1.7%) | 26 (2.1%) |
| 40 to 44 Years | 143 (12.8%) | 22 (1.8%) |
| 45 to 49 Years | 68 (6.1%) | 57 (4.5%) |
| 50 to 54 Years | 14 (1.3%) | 116 (9.2%) |
| 55 to 59 Years | 23 (2.1%) | 94 (7.5%) |
| 60 to 64 Years | 59 (5.3%) | 22 (1.8%) |
| 65 to 69 Years | 79 (7.0%) | 57 (4.5%) |
| 70 to 74 Years | 62 (5.5%) | 85 (6.8%) |
| 75 to 79 Years | 36 (3.2%) | 159 (12.7%) |
| 80 to 84 Years | 44 (3.9%) | 66 (5.2%) |
| 85 Years and over | 11 (1.0%) | 56 (4.5%) |
| Total | 1,122 (100.0%) | 1,257 (100.0%) |
Families and Households in Waynesboro
Median Family Size in Waynesboro
The median family size in Waynesboro is 3.04 persons per family, with single female/mother families (124 | 24.1%) accounting for the largest median family size of 3.76 persons per family. On the other hand, single male/father families (70 | 13.6%) represent the smallest median family size with 2.29 persons per family.
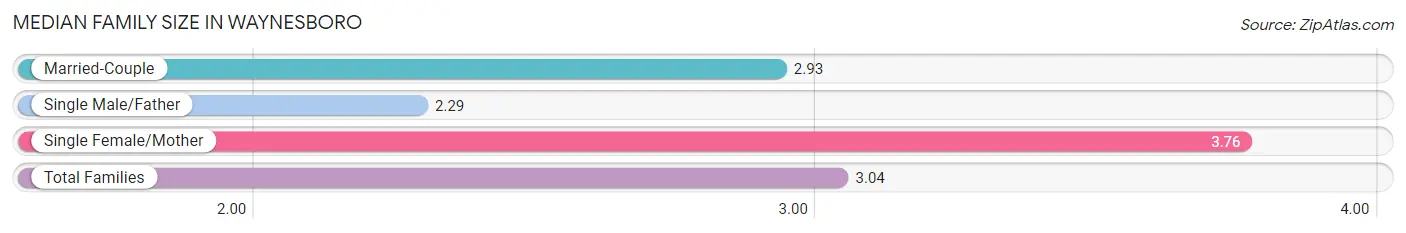
| Family Type | # Families | Family Size |
| Married-Couple | 320 (62.3%) | 2.93 |
| Single Male/Father | 70 (13.6%) | 2.29 |
| Single Female/Mother | 124 (24.1%) | 3.76 |
| Total Families | 514 (100.0%) | 3.04 |
Median Household Size in Waynesboro
The median household size in Waynesboro is 2.30 persons per household, with single female/mother households (124 | 14.1%) accounting for the largest median household size of 4.08 persons per household. non-family households (367 | 41.7%) represent the smallest median household size with 1.07 persons per household.
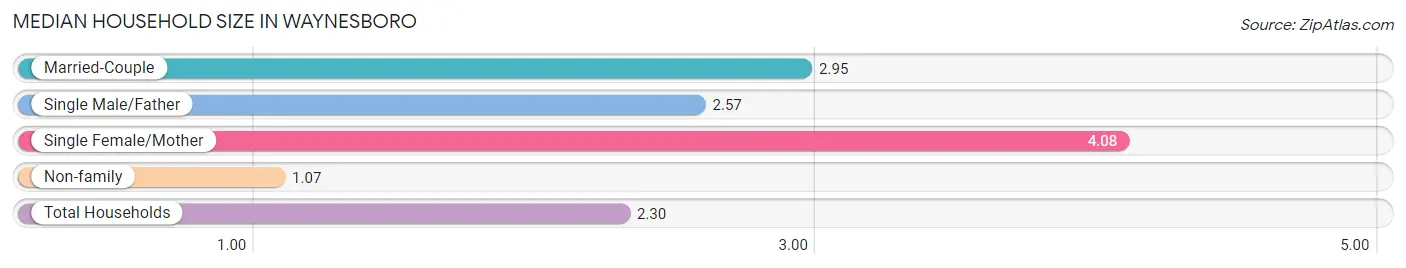
| Household Type | # Households | Household Size |
| Married-Couple | 320 (36.3%) | 2.95 |
| Single Male/Father | 70 (8.0%) | 2.57 |
| Single Female/Mother | 124 (14.1%) | 4.08 |
| Non-family | 367 (41.7%) | 1.07 |
| Total Households | 881 (100.0%) | 2.30 |
Household Size by Marriage Status in Waynesboro
Out of a total of 881 households in Waynesboro, 514 (58.3%) are family households, while 367 (41.7%) are nonfamily households. The most numerous type of family households are 2-person households, comprising 230, and the most common type of nonfamily households are 1-person households, comprising 341.
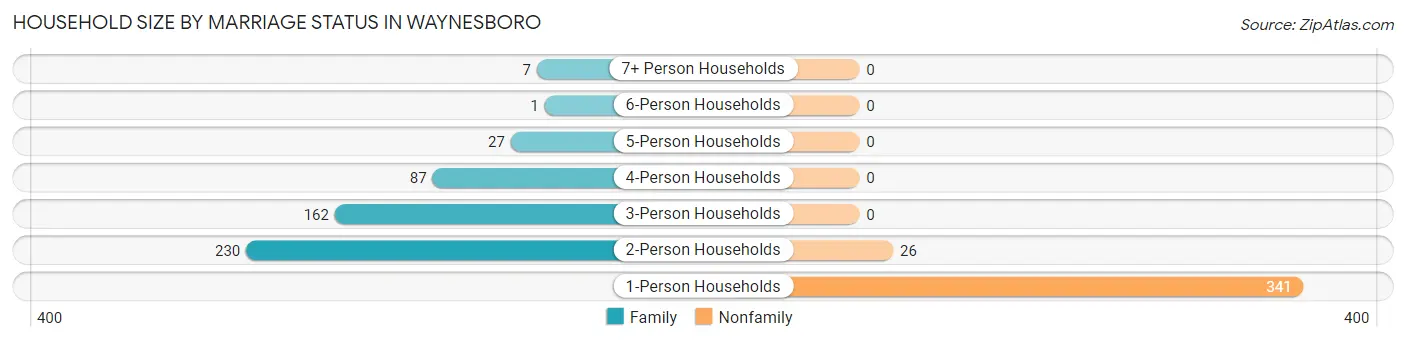
| Household Size | Family Households | Nonfamily Households |
| 1-Person Households | - | 341 (38.7%) |
| 2-Person Households | 230 (26.1%) | 26 (2.9%) |
| 3-Person Households | 162 (18.4%) | 0 (0.0%) |
| 4-Person Households | 87 (9.9%) | 0 (0.0%) |
| 5-Person Households | 27 (3.1%) | 0 (0.0%) |
| 6-Person Households | 1 (0.1%) | 0 (0.0%) |
| 7+ Person Households | 7 (0.8%) | 0 (0.0%) |
| Total | 514 (58.3%) | 367 (41.7%) |
Female Fertility in Waynesboro
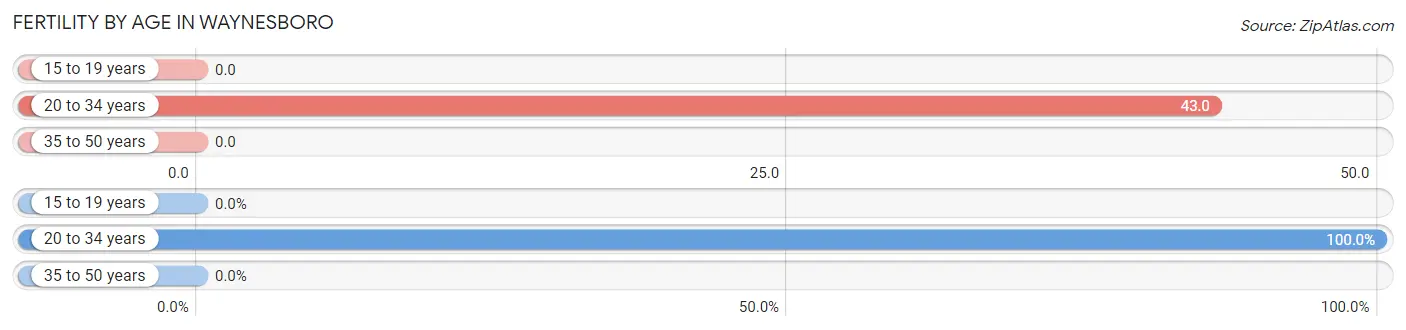
Fertility by Age in Waynesboro
Average fertility rate in Waynesboro is 16.0 births per 1,000 women. Women in the age bracket of 20 to 34 years have the highest fertility rate with 43.0 births per 1,000 women. Women in the age bracket of 20 to 34 years acount for 100.0% of all women with births.
| Age Bracket | Women with Births | Births / 1,000 Women |
| 15 to 19 years | 0 (0.0%) | 0.0 |
| 20 to 34 years | 7 (100.0%) | 43.0 |
| 35 to 50 years | 0 (0.0%) | 0.0 |
| Total | 7 (100.0%) | 16.0 |
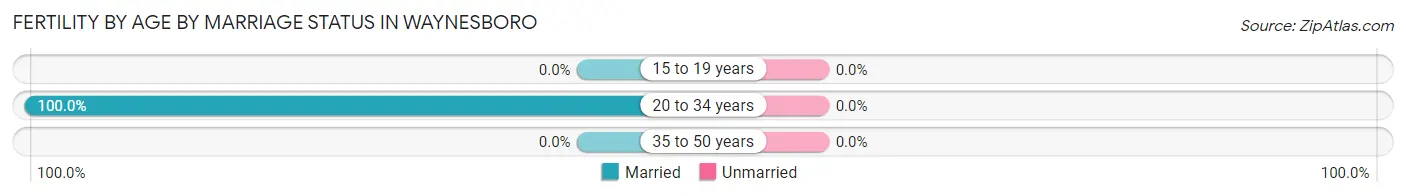
Fertility by Age by Marriage Status in Waynesboro
| Age Bracket | Married | Unmarried |
| 15 to 19 years | 0 (0.0%) | 0 (0.0%) |
| 20 to 34 years | 7 (100.0%) | 0 (0.0%) |
| 35 to 50 years | 0 (0.0%) | 0 (0.0%) |
| Total | 7 (100.0%) | 0 (0.0%) |
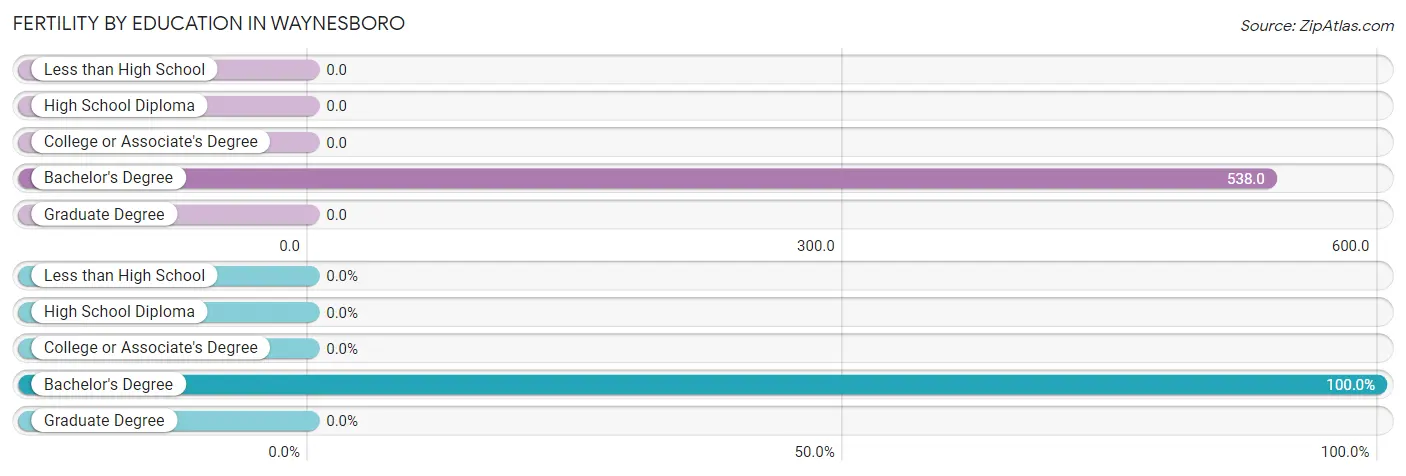
Fertility by Education in Waynesboro
| Educational Attainment | Women with Births | Births / 1,000 Women |
| Less than High School | 0 (0.0%) | 0.0 |
| High School Diploma | 0 (0.0%) | 0.0 |
| College or Associate's Degree | 0 (0.0%) | 0.0 |
| Bachelor's Degree | 7 (100.0%) | 538.0 |
| Graduate Degree | 0 (0.0%) | 0.0 |
| Total | 7 (100.0%) | 16.0 |
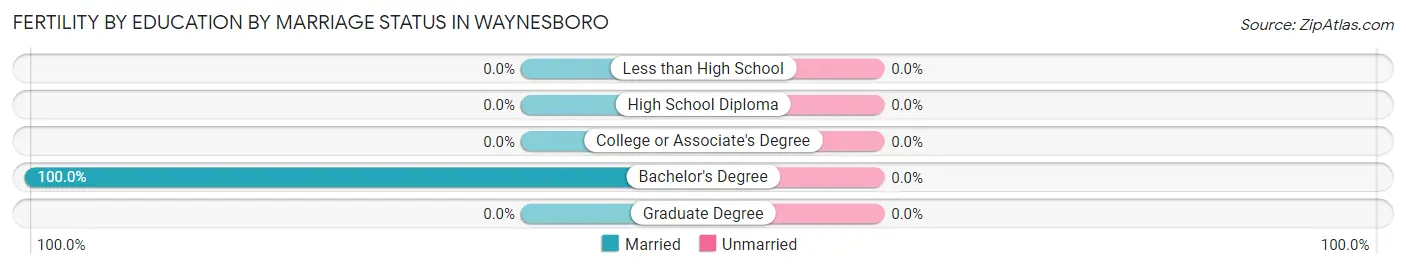
Fertility by Education by Marriage Status in Waynesboro
| Educational Attainment | Married | Unmarried |
| Less than High School | 0 (0.0%) | 0 (0.0%) |
| High School Diploma | 0 (0.0%) | 0 (0.0%) |
| College or Associate's Degree | 0 (0.0%) | 0 (0.0%) |
| Bachelor's Degree | 7 (100.0%) | 0 (0.0%) |
| Graduate Degree | 0 (0.0%) | 0 (0.0%) |
| Total | 7 (100.0%) | 0 (0.0%) |
Employment Characteristics in Waynesboro
Employment by Class of Employer in Waynesboro
Among the 737 employed individuals in Waynesboro, private company employees (517 | 70.2%), local government employees (103 | 14.0%), and state government employees (37 | 5.0%) make up the most common classes of employment.
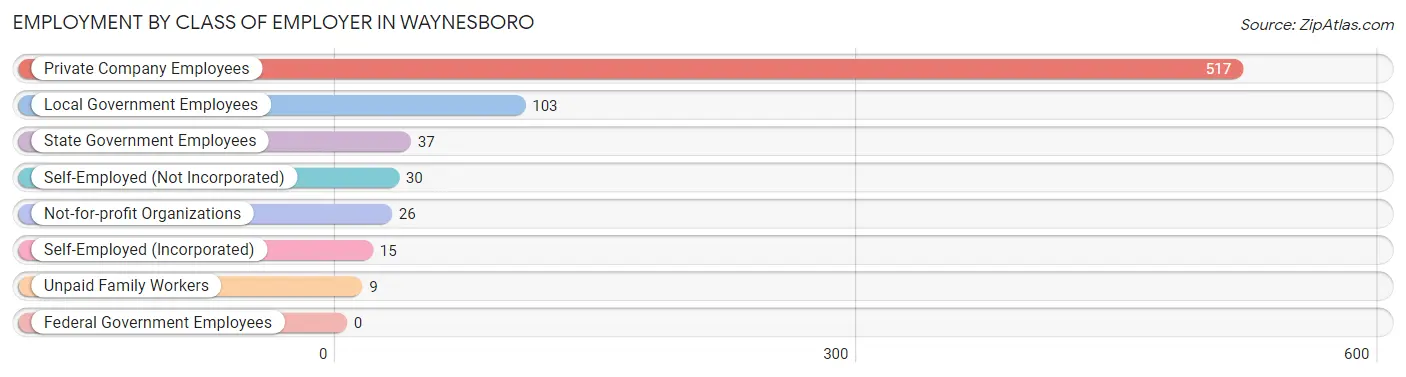
| Employer Class | # Employees | % Employees |
| Private Company Employees | 517 | 70.2% |
| Self-Employed (Incorporated) | 15 | 2.0% |
| Self-Employed (Not Incorporated) | 30 | 4.1% |
| Not-for-profit Organizations | 26 | 3.5% |
| Local Government Employees | 103 | 14.0% |
| State Government Employees | 37 | 5.0% |
| Federal Government Employees | 0 | 0.0% |
| Unpaid Family Workers | 9 | 1.2% |
| Total | 737 | 100.0% |
Employment Status by Age in Waynesboro
According to the labor force statistics for Waynesboro, out of the total population over 16 years of age (1,940), 41.4% or 803 individuals are in the labor force, with 7.8% or 63 of them unemployed. The age group with the highest labor force participation rate is 20 to 24 years, with 88.0% or 147 individuals in the labor force. Within the labor force, the 35 to 44 years age range has the highest percentage of unemployed individuals, with 27.6% or 47 of them being unemployed.
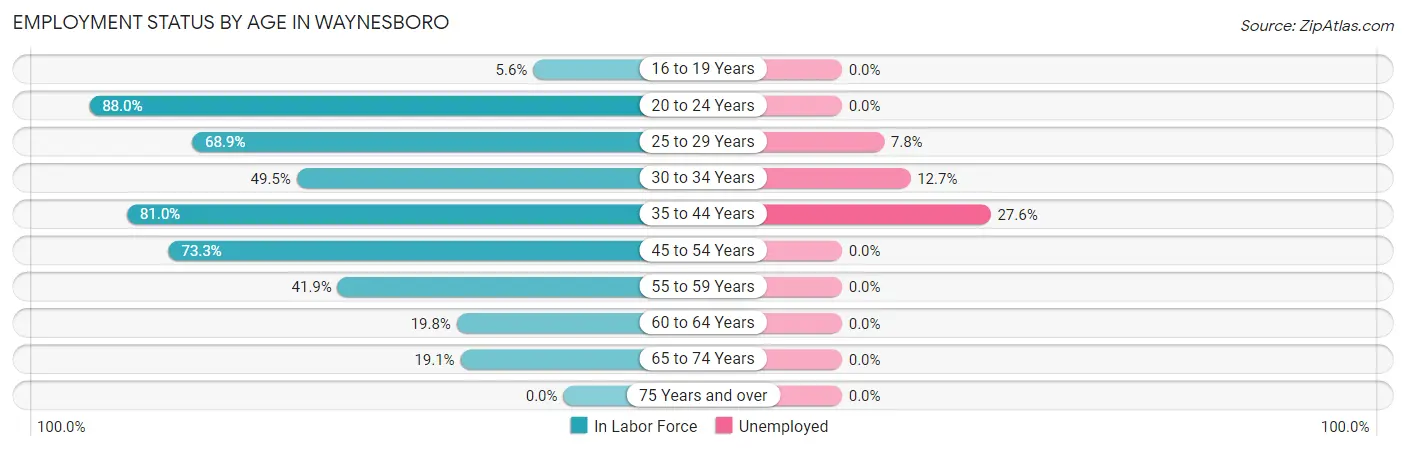
| Age Bracket | In Labor Force | Unemployed |
| 16 to 19 Years | 10 (5.6%) | 0 (0.0%) |
| 20 to 24 Years | 147 (88.0%) | 0 (0.0%) |
| 25 to 29 Years | 115 (68.9%) | 9 (7.8%) |
| 30 to 34 Years | 55 (49.5%) | 7 (12.7%) |
| 35 to 44 Years | 170 (81.0%) | 47 (27.6%) |
| 45 to 54 Years | 187 (73.3%) | 0 (0.0%) |
| 55 to 59 Years | 49 (41.9%) | 0 (0.0%) |
| 60 to 64 Years | 16 (19.8%) | 0 (0.0%) |
| 65 to 74 Years | 54 (19.1%) | 0 (0.0%) |
| 75 Years and over | 0 (0.0%) | 0 (0.0%) |
| Total | 803 (41.4%) | 63 (7.8%) |
Employment Status by Educational Attainment in Waynesboro
According to labor force statistics for Waynesboro, 62.9% of individuals (592) out of the total population between 25 and 64 years of age (941) are in the labor force, with 10.6% or 63 of them being unemployed. The group with the highest labor force participation rate are those with the educational attainment of bachelor's degree or higher, with 86.9% or 152 individuals in the labor force. Within the labor force, individuals with less than high school education have the highest percentage of unemployment, with 60.9% or 39 of them being unemployed.
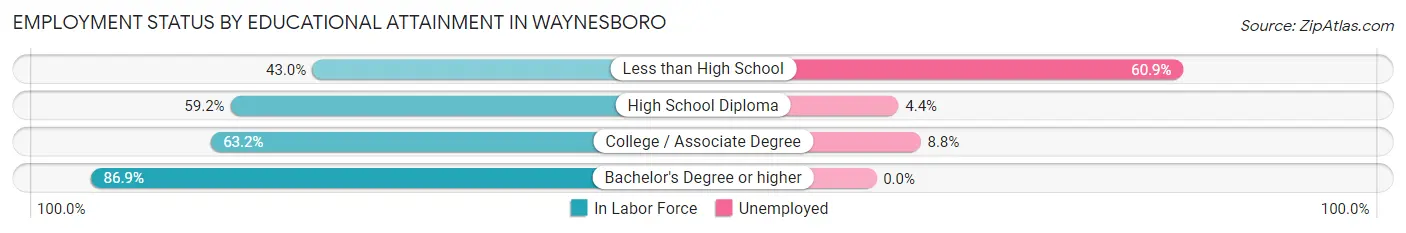
| Educational Attainment | In Labor Force | Unemployed |
| Less than High School | 64 (43.0%) | 91 (60.9%) |
| High School Diploma | 206 (59.2%) | 15 (4.4%) |
| College / Associate Degree | 170 (63.2%) | 24 (8.8%) |
| Bachelor's Degree or higher | 152 (86.9%) | 0 (0.0%) |
| Total | 592 (62.9%) | 100 (10.6%) |
Employment Occupations by Sex in Waynesboro
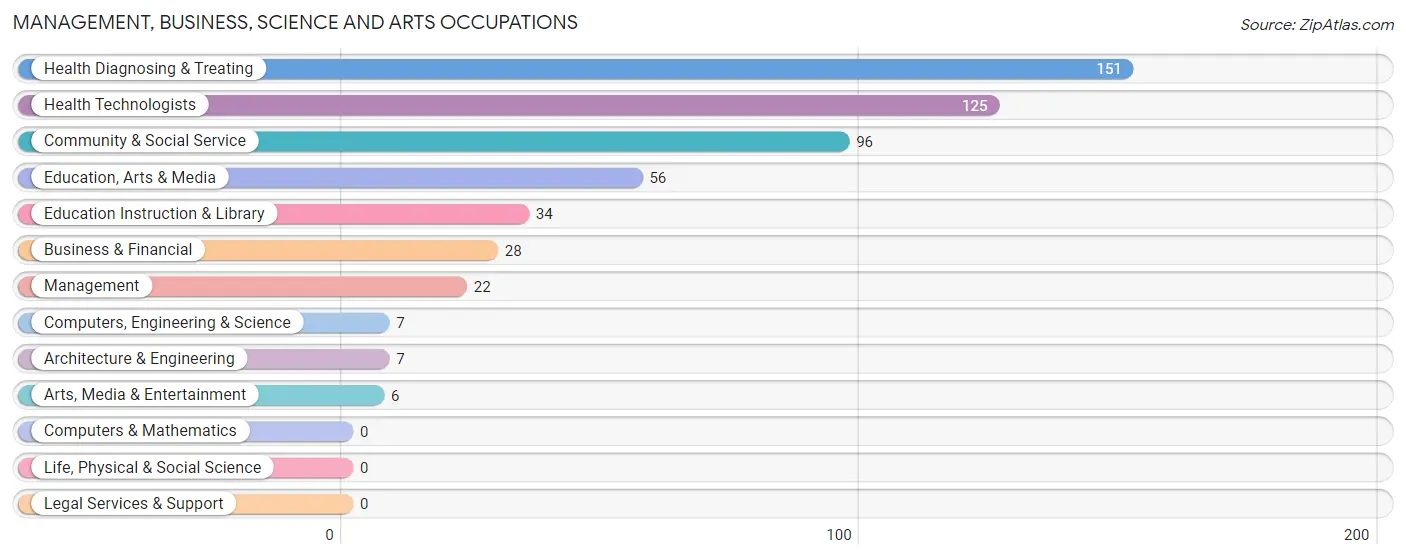
Management, Business, Science and Arts Occupations
The most common Management, Business, Science and Arts occupations in Waynesboro are Health Diagnosing & Treating (151 | 20.4%), Health Technologists (125 | 16.9%), Community & Social Service (96 | 13.0%), Education, Arts & Media (56 | 7.6%), and Education Instruction & Library (34 | 4.6%).
Management, Business, Science and Arts Occupations by Sex
Within the Management, Business, Science and Arts occupations in Waynesboro, the most male-oriented occupations are Business & Financial (100.0%), Computers, Engineering & Science (100.0%), and Architecture & Engineering (100.0%), while the most female-oriented occupations are Management (100.0%), Education Instruction & Library (100.0%), and Arts, Media & Entertainment (100.0%).
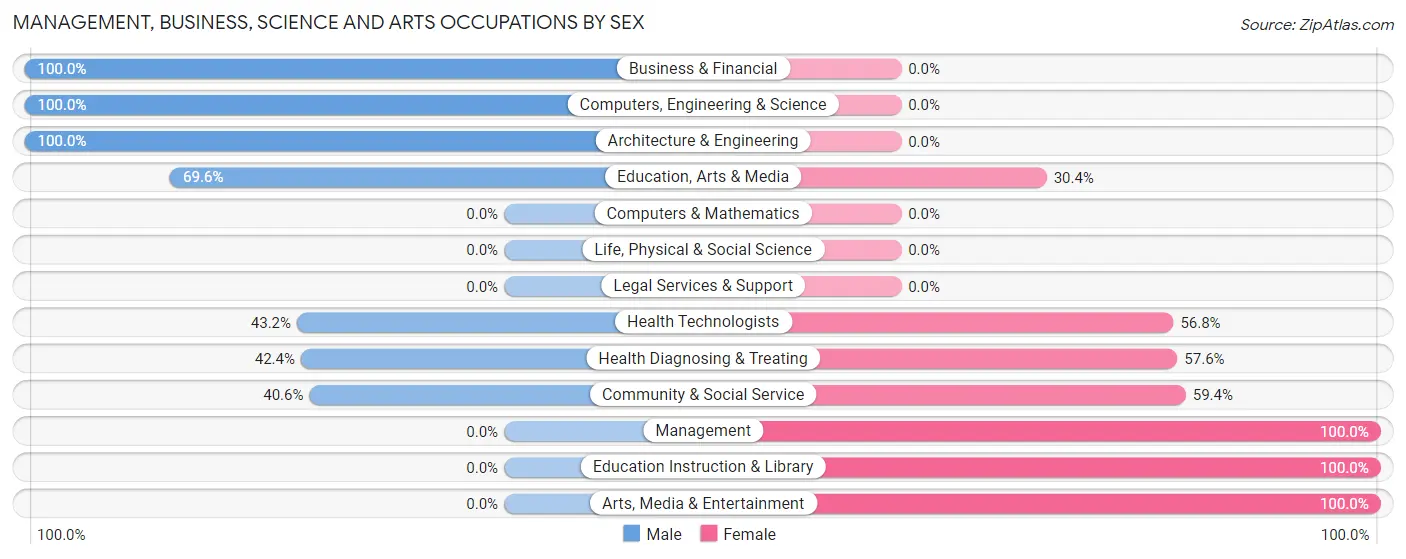
| Occupation | Male | Female |
| Management | 0 (0.0%) | 22 (100.0%) |
| Business & Financial | 28 (100.0%) | 0 (0.0%) |
| Computers, Engineering & Science | 7 (100.0%) | 0 (0.0%) |
| Computers & Mathematics | 0 (0.0%) | 0 (0.0%) |
| Architecture & Engineering | 7 (100.0%) | 0 (0.0%) |
| Life, Physical & Social Science | 0 (0.0%) | 0 (0.0%) |
| Community & Social Service | 39 (40.6%) | 57 (59.4%) |
| Education, Arts & Media | 39 (69.6%) | 17 (30.4%) |
| Legal Services & Support | 0 (0.0%) | 0 (0.0%) |
| Education Instruction & Library | 0 (0.0%) | 34 (100.0%) |
| Arts, Media & Entertainment | 0 (0.0%) | 6 (100.0%) |
| Health Diagnosing & Treating | 64 (42.4%) | 87 (57.6%) |
| Health Technologists | 54 (43.2%) | 71 (56.8%) |
| Total (Category) | 138 (45.4%) | 166 (54.6%) |
| Total (Overall) | 439 (59.3%) | 301 (40.7%) |
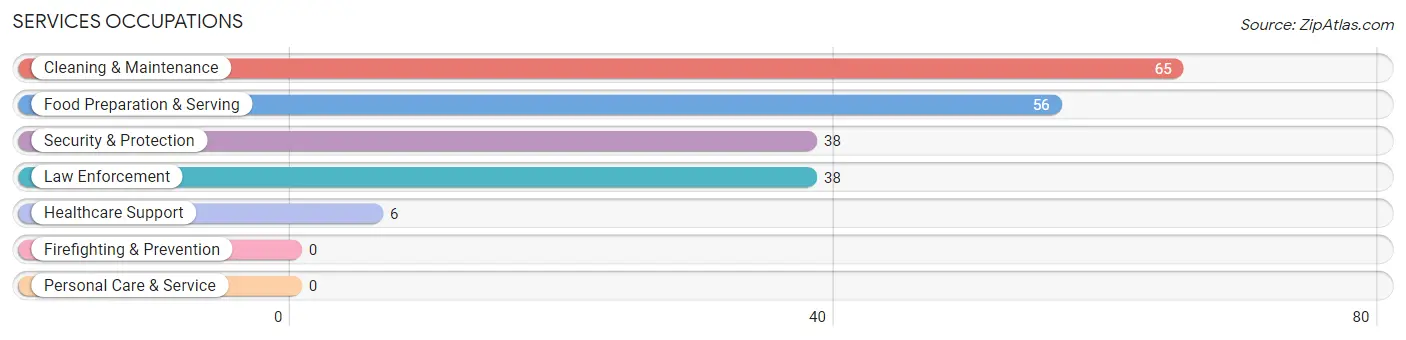
Services Occupations
The most common Services occupations in Waynesboro are Cleaning & Maintenance (65 | 8.8%), Food Preparation & Serving (56 | 7.6%), Security & Protection (38 | 5.1%), Law Enforcement (38 | 5.1%), and Healthcare Support (6 | 0.8%).
Services Occupations by Sex
Within the Services occupations in Waynesboro, the most male-oriented occupations are Security & Protection (89.5%), Law Enforcement (89.5%), and Cleaning & Maintenance (69.2%), while the most female-oriented occupations are Healthcare Support (100.0%), Food Preparation & Serving (73.2%), and Cleaning & Maintenance (30.8%).
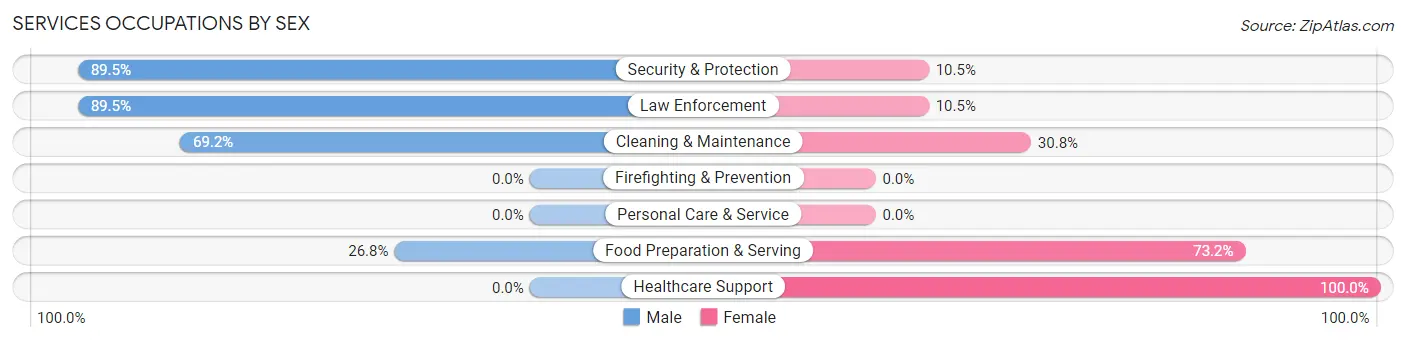
| Occupation | Male | Female |
| Healthcare Support | 0 (0.0%) | 6 (100.0%) |
| Security & Protection | 34 (89.5%) | 4 (10.5%) |
| Firefighting & Prevention | 0 (0.0%) | 0 (0.0%) |
| Law Enforcement | 34 (89.5%) | 4 (10.5%) |
| Food Preparation & Serving | 15 (26.8%) | 41 (73.2%) |
| Cleaning & Maintenance | 45 (69.2%) | 20 (30.8%) |
| Personal Care & Service | 0 (0.0%) | 0 (0.0%) |
| Total (Category) | 94 (57.0%) | 71 (43.0%) |
| Total (Overall) | 439 (59.3%) | 301 (40.7%) |
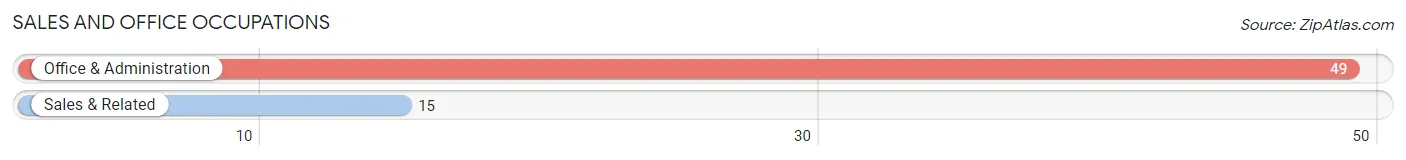
Sales and Office Occupations
The most common Sales and Office occupations in Waynesboro are Office & Administration (49 | 6.6%), and Sales & Related (15 | 2.0%).
Sales and Office Occupations by Sex

| Occupation | Male | Female |
| Sales & Related | 0 (0.0%) | 15 (100.0%) |
| Office & Administration | 11 (22.5%) | 38 (77.5%) |
| Total (Category) | 11 (17.2%) | 53 (82.8%) |
| Total (Overall) | 439 (59.3%) | 301 (40.7%) |
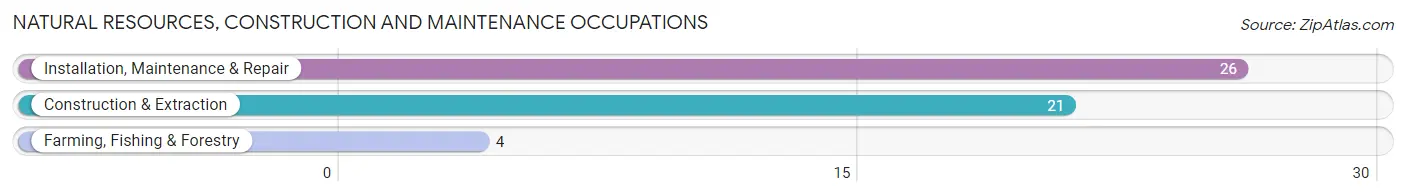
Natural Resources, Construction and Maintenance Occupations
The most common Natural Resources, Construction and Maintenance occupations in Waynesboro are Installation, Maintenance & Repair (26 | 3.5%), Construction & Extraction (21 | 2.8%), and Farming, Fishing & Forestry (4 | 0.5%).
Natural Resources, Construction and Maintenance Occupations by Sex
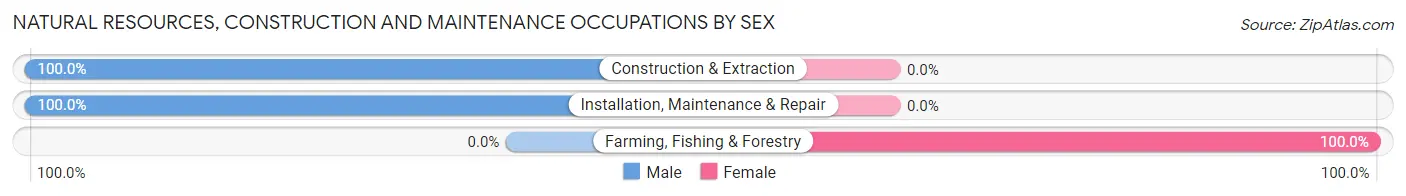
| Occupation | Male | Female |
| Farming, Fishing & Forestry | 0 (0.0%) | 4 (100.0%) |
| Construction & Extraction | 21 (100.0%) | 0 (0.0%) |
| Installation, Maintenance & Repair | 26 (100.0%) | 0 (0.0%) |
| Total (Category) | 47 (92.2%) | 4 (7.8%) |
| Total (Overall) | 439 (59.3%) | 301 (40.7%) |
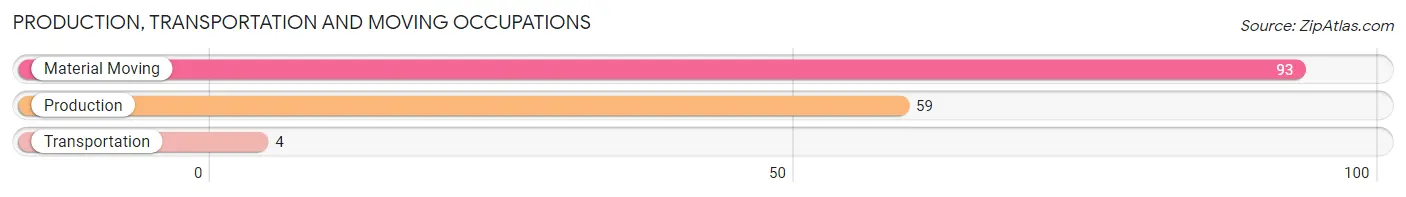
Production, Transportation and Moving Occupations
The most common Production, Transportation and Moving occupations in Waynesboro are Material Moving (93 | 12.6%), Production (59 | 8.0%), and Transportation (4 | 0.5%).
Production, Transportation and Moving Occupations by Sex
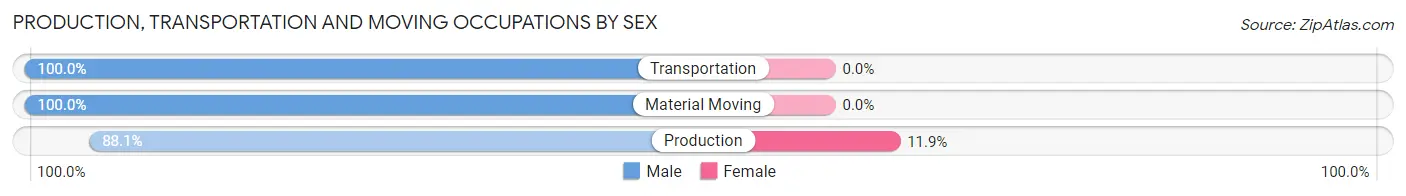
| Occupation | Male | Female |
| Production | 52 (88.1%) | 7 (11.9%) |
| Transportation | 4 (100.0%) | 0 (0.0%) |
| Material Moving | 93 (100.0%) | 0 (0.0%) |
| Total (Category) | 149 (95.5%) | 7 (4.5%) |
| Total (Overall) | 439 (59.3%) | 301 (40.7%) |
Employment Industries by Sex in Waynesboro
Employment Industries in Waynesboro
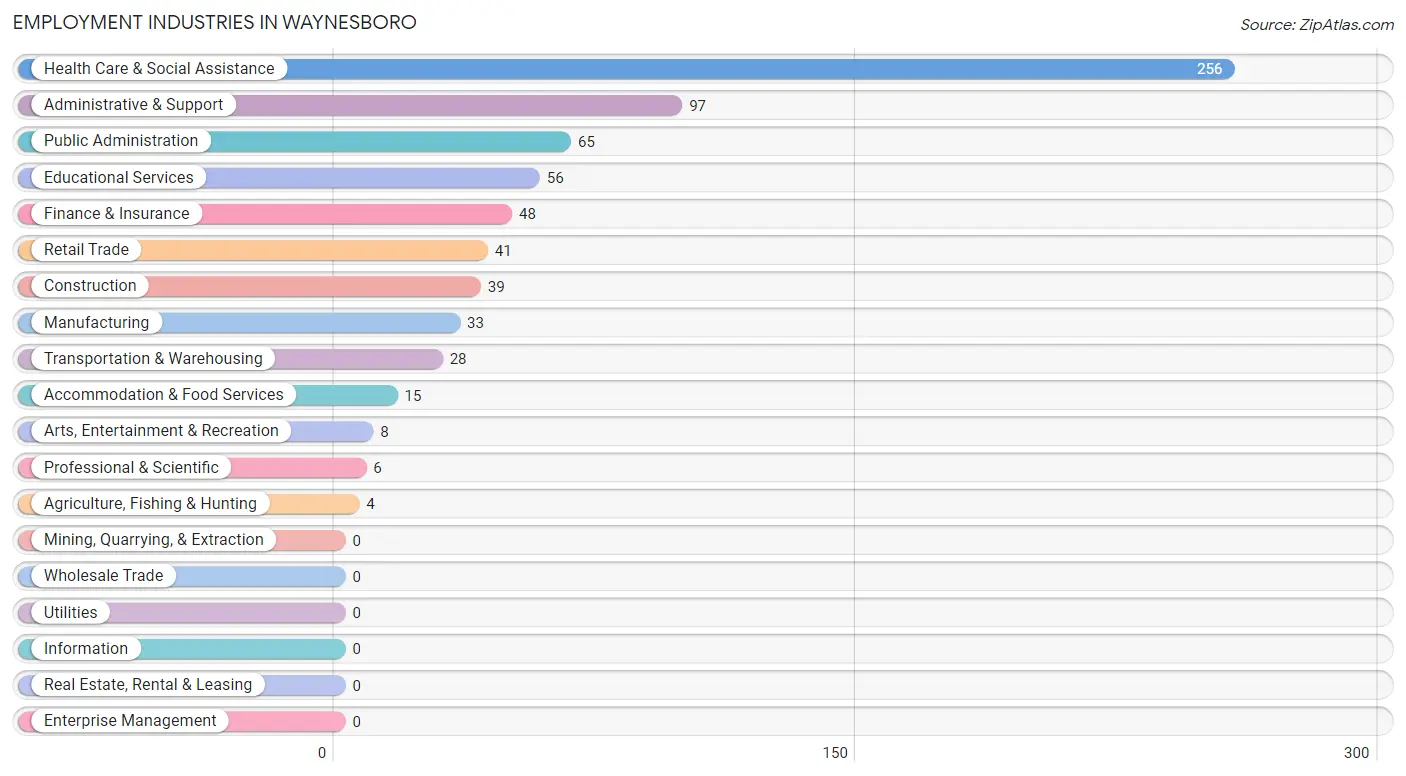
The major employment industries in Waynesboro include Health Care & Social Assistance (256 | 34.6%), Administrative & Support (97 | 13.1%), Public Administration (65 | 8.8%), Educational Services (56 | 7.6%), and Finance & Insurance (48 | 6.5%).
Employment Industries by Sex in Waynesboro
The Waynesboro industries that see more men than women are Transportation & Warehousing (100.0%), Arts, Entertainment & Recreation (100.0%), and Accommodation & Food Services (100.0%), whereas the industries that tend to have a higher number of women are Agriculture, Fishing & Hunting (100.0%), Professional & Scientific (100.0%), and Educational Services (100.0%).
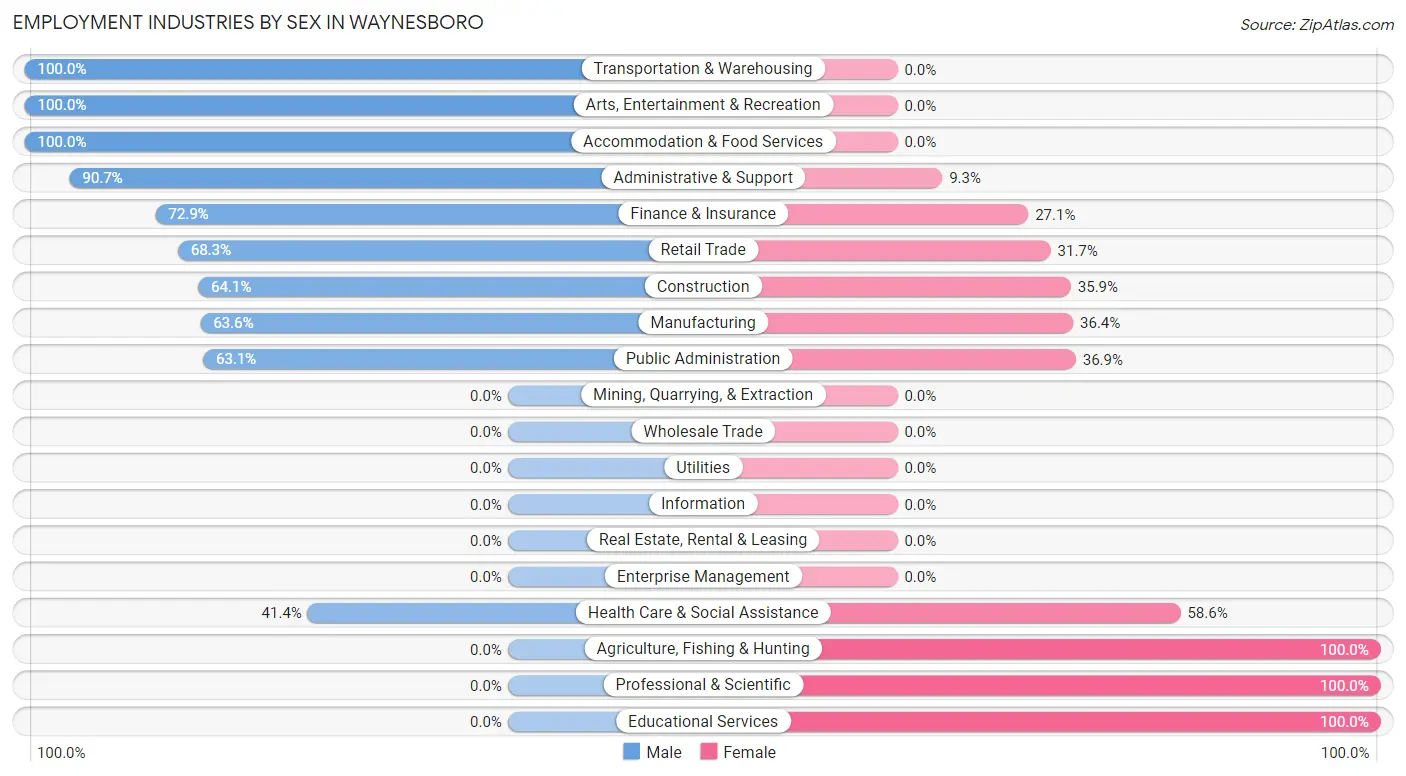
| Industry | Male | Female |
| Agriculture, Fishing & Hunting | 0 (0.0%) | 4 (100.0%) |
| Mining, Quarrying, & Extraction | 0 (0.0%) | 0 (0.0%) |
| Construction | 25 (64.1%) | 14 (35.9%) |
| Manufacturing | 21 (63.6%) | 12 (36.4%) |
| Wholesale Trade | 0 (0.0%) | 0 (0.0%) |
| Retail Trade | 28 (68.3%) | 13 (31.7%) |
| Transportation & Warehousing | 28 (100.0%) | 0 (0.0%) |
| Utilities | 0 (0.0%) | 0 (0.0%) |
| Information | 0 (0.0%) | 0 (0.0%) |
| Finance & Insurance | 35 (72.9%) | 13 (27.1%) |
| Real Estate, Rental & Leasing | 0 (0.0%) | 0 (0.0%) |
| Professional & Scientific | 0 (0.0%) | 6 (100.0%) |
| Enterprise Management | 0 (0.0%) | 0 (0.0%) |
| Administrative & Support | 88 (90.7%) | 9 (9.3%) |
| Educational Services | 0 (0.0%) | 56 (100.0%) |
| Health Care & Social Assistance | 106 (41.4%) | 150 (58.6%) |
| Arts, Entertainment & Recreation | 8 (100.0%) | 0 (0.0%) |
| Accommodation & Food Services | 15 (100.0%) | 0 (0.0%) |
| Public Administration | 41 (63.1%) | 24 (36.9%) |
| Total | 439 (59.3%) | 301 (40.7%) |
Education in Waynesboro
School Enrollment in Waynesboro
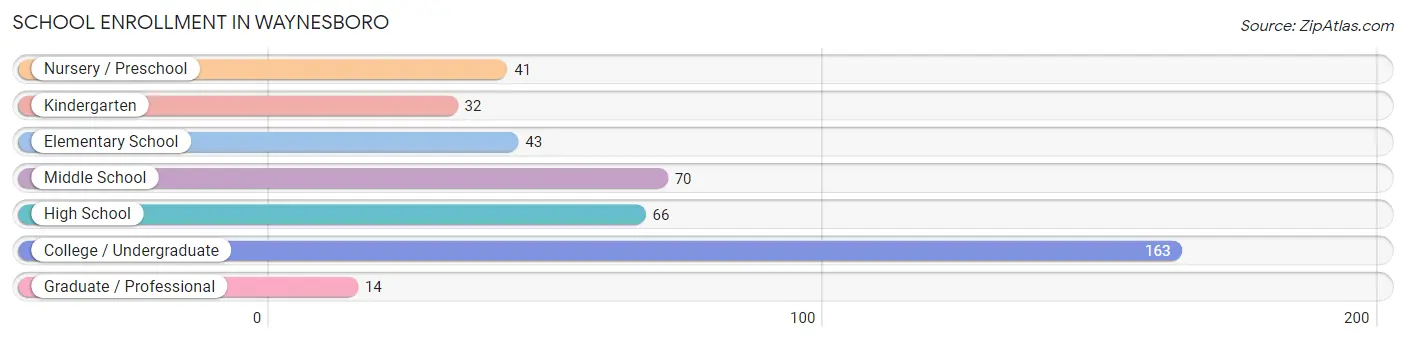
The most common levels of schooling among the 429 students in Waynesboro are college / undergraduate (163 | 38.0%), middle school (70 | 16.3%), and high school (66 | 15.4%).
| School Level | # Students | % Students |
| Nursery / Preschool | 41 | 9.6% |
| Kindergarten | 32 | 7.5% |
| Elementary School | 43 | 10.0% |
| Middle School | 70 | 16.3% |
| High School | 66 | 15.4% |
| College / Undergraduate | 163 | 38.0% |
| Graduate / Professional | 14 | 3.3% |
| Total | 429 | 100.0% |
School Enrollment by Age by Funding Source in Waynesboro
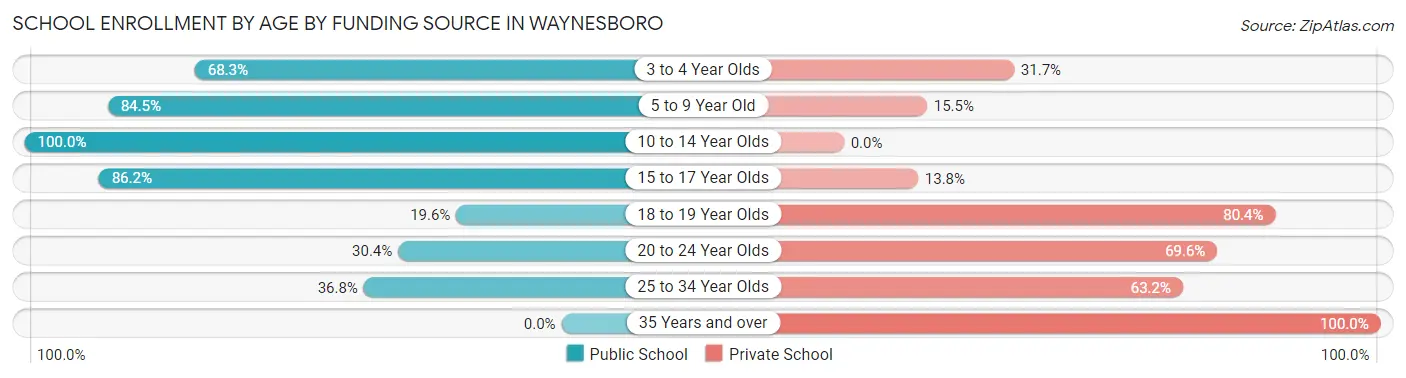
Out of a total of 429 students who are enrolled in schools in Waynesboro, 117 (27.3%) attend a private institution, while the remaining 312 (72.7%) are enrolled in public schools. The age group of 35 years and over has the highest likelihood of being enrolled in private schools, with 7 (100.0% in the age bracket) enrolled. Conversely, the age group of 10 to 14 year olds has the lowest likelihood of being enrolled in a private school, with 94 (100.0% in the age bracket) attending a public institution.
| Age Bracket | Public School | Private School |
| 3 to 4 Year Olds | 28 (68.3%) | 13 (31.7%) |
| 5 to 9 Year Old | 60 (84.5%) | 11 (15.5%) |
| 10 to 14 Year Olds | 94 (100.0%) | 0 (0.0%) |
| 15 to 17 Year Olds | 106 (86.2%) | 17 (13.8%) |
| 18 to 19 Year Olds | 10 (19.6%) | 41 (80.4%) |
| 20 to 24 Year Olds | 7 (30.4%) | 16 (69.6%) |
| 25 to 34 Year Olds | 7 (36.8%) | 12 (63.2%) |
| 35 Years and over | 0 (0.0%) | 7 (100.0%) |
| Total | 312 (72.7%) | 117 (27.3%) |
Educational Attainment by Field of Study in Waynesboro
Psychology (68 | 30.9%), education (44 | 20.0%), business (31 | 14.1%), arts & humanities (30 | 13.6%), and bio, nature & agricultural (23 | 10.4%) are the most common fields of study among 220 individuals in Waynesboro who have obtained a bachelor's degree or higher.
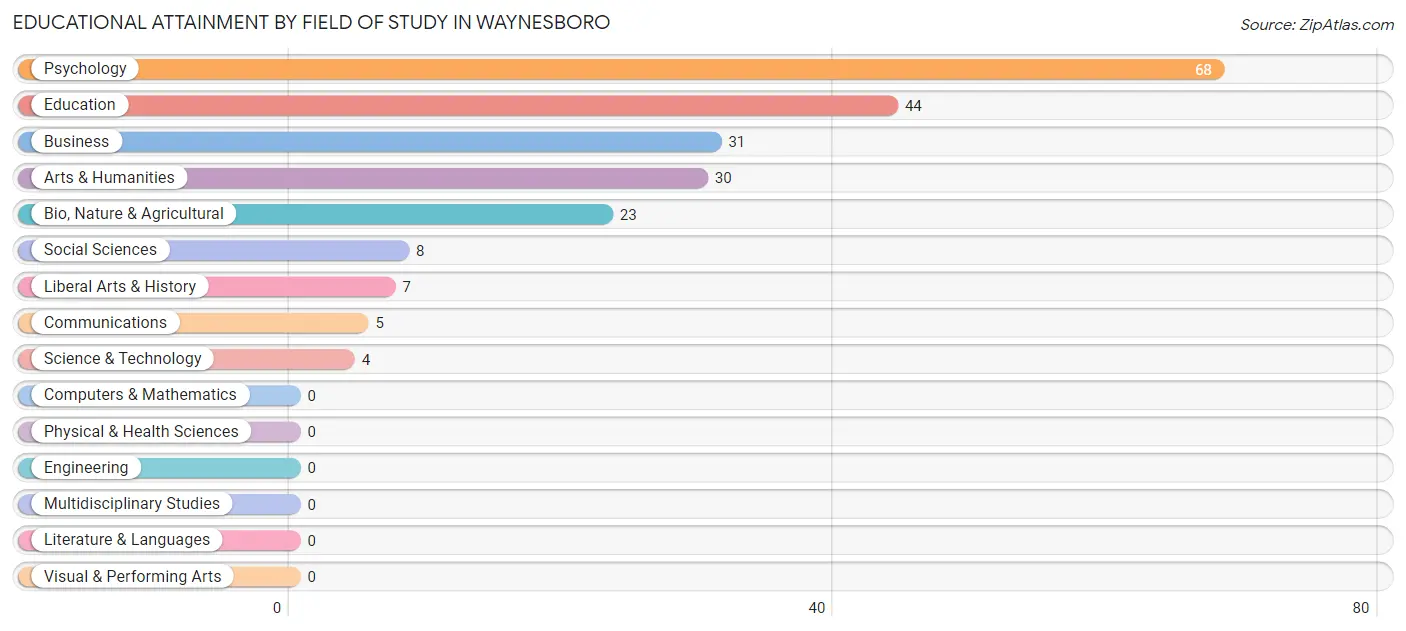
| Field of Study | # Graduates | % Graduates |
| Computers & Mathematics | 0 | 0.0% |
| Bio, Nature & Agricultural | 23 | 10.4% |
| Physical & Health Sciences | 0 | 0.0% |
| Psychology | 68 | 30.9% |
| Social Sciences | 8 | 3.6% |
| Engineering | 0 | 0.0% |
| Multidisciplinary Studies | 0 | 0.0% |
| Science & Technology | 4 | 1.8% |
| Business | 31 | 14.1% |
| Education | 44 | 20.0% |
| Literature & Languages | 0 | 0.0% |
| Liberal Arts & History | 7 | 3.2% |
| Visual & Performing Arts | 0 | 0.0% |
| Communications | 5 | 2.3% |
| Arts & Humanities | 30 | 13.6% |
| Total | 220 | 100.0% |
Transportation & Commute in Waynesboro
Vehicle Availability by Sex in Waynesboro
The most prevalent vehicle ownership categories in Waynesboro are males with 3 vehicles (259, accounting for 59.4%) and females with 3 vehicles (128, making up 88.1%).
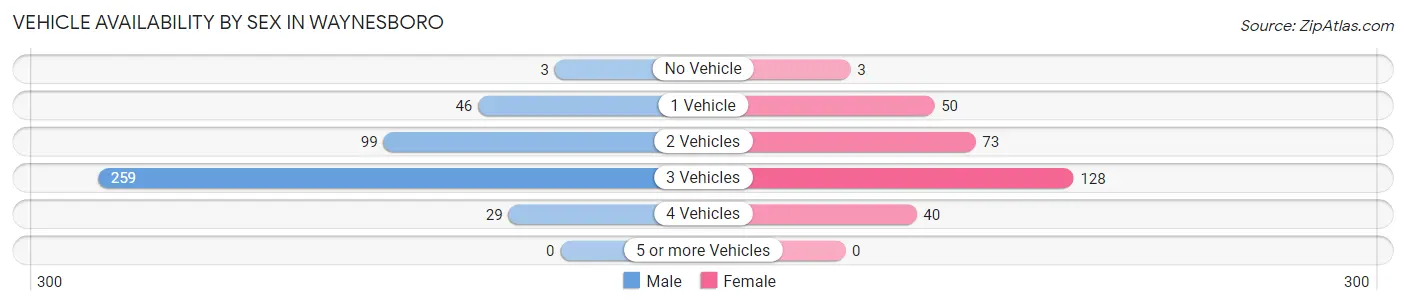
| Vehicles Available | Male | Female |
| No Vehicle | 3 (0.7%) | 3 (1.0%) |
| 1 Vehicle | 46 (10.5%) | 50 (17.0%) |
| 2 Vehicles | 99 (22.7%) | 73 (24.8%) |
| 3 Vehicles | 259 (59.4%) | 128 (43.5%) |
| 4 Vehicles | 29 (6.7%) | 40 (13.6%) |
| 5 or more Vehicles | 0 (0.0%) | 0 (0.0%) |
| Total | 436 (100.0%) | 294 (100.0%) |
Commute Time in Waynesboro
The most frequently occuring commute durations in Waynesboro are 5 to 9 minutes (178 commuters, 24.6%), 60 to 89 minutes (151 commuters, 20.9%), and 10 to 14 minutes (85 commuters, 11.7%).
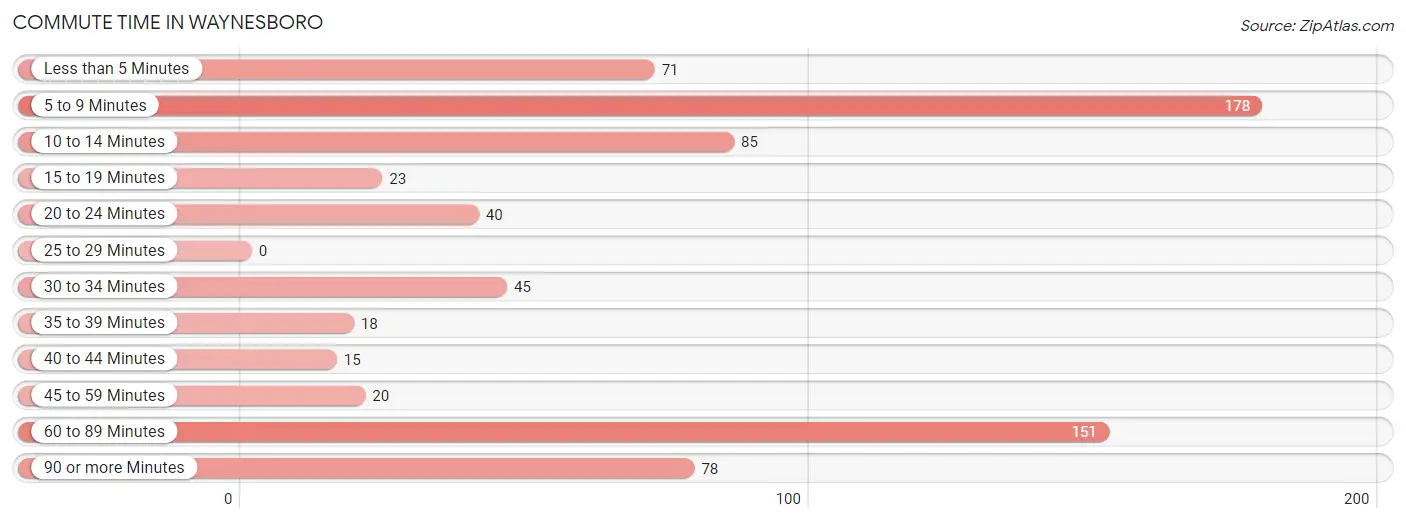
| Commute Time | # Commuters | % Commuters |
| Less than 5 Minutes | 71 | 9.8% |
| 5 to 9 Minutes | 178 | 24.6% |
| 10 to 14 Minutes | 85 | 11.7% |
| 15 to 19 Minutes | 23 | 3.2% |
| 20 to 24 Minutes | 40 | 5.5% |
| 25 to 29 Minutes | 0 | 0.0% |
| 30 to 34 Minutes | 45 | 6.2% |
| 35 to 39 Minutes | 18 | 2.5% |
| 40 to 44 Minutes | 15 | 2.1% |
| 45 to 59 Minutes | 20 | 2.8% |
| 60 to 89 Minutes | 151 | 20.9% |
| 90 or more Minutes | 78 | 10.8% |
Commute Time by Sex in Waynesboro
The most common commute times in Waynesboro are 60 to 89 minutes (122 commuters, 28.4%) for males and 5 to 9 minutes (85 commuters, 28.8%) for females.
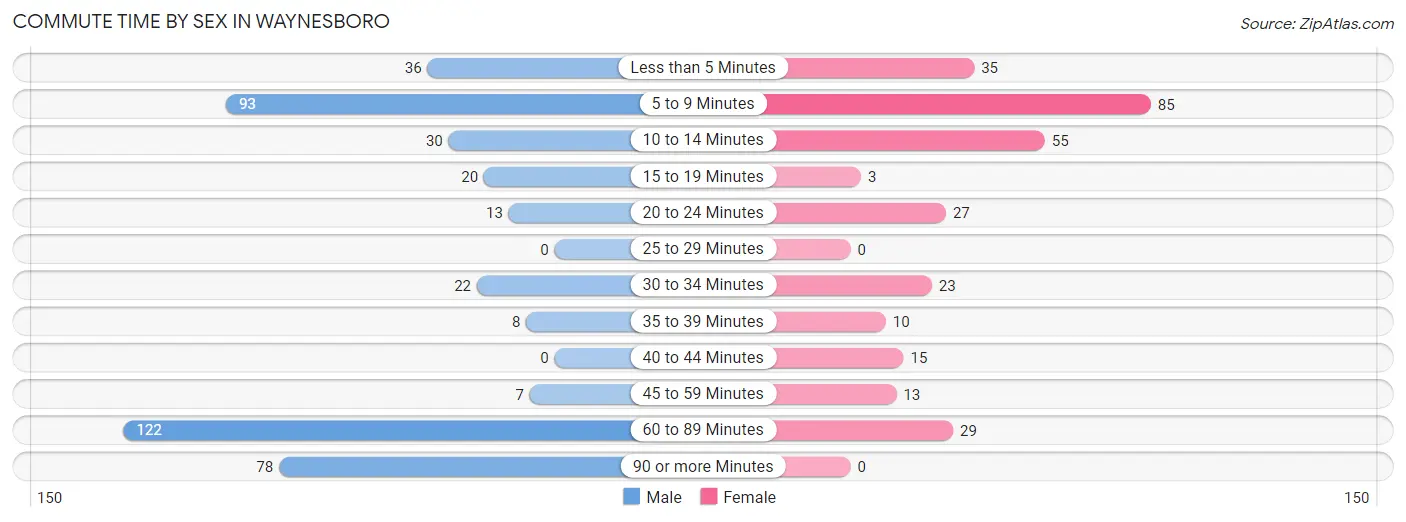
| Commute Time | Male | Female |
| Less than 5 Minutes | 36 (8.4%) | 35 (11.9%) |
| 5 to 9 Minutes | 93 (21.7%) | 85 (28.8%) |
| 10 to 14 Minutes | 30 (7.0%) | 55 (18.6%) |
| 15 to 19 Minutes | 20 (4.7%) | 3 (1.0%) |
| 20 to 24 Minutes | 13 (3.0%) | 27 (9.1%) |
| 25 to 29 Minutes | 0 (0.0%) | 0 (0.0%) |
| 30 to 34 Minutes | 22 (5.1%) | 23 (7.8%) |
| 35 to 39 Minutes | 8 (1.9%) | 10 (3.4%) |
| 40 to 44 Minutes | 0 (0.0%) | 15 (5.1%) |
| 45 to 59 Minutes | 7 (1.6%) | 13 (4.4%) |
| 60 to 89 Minutes | 122 (28.4%) | 29 (9.8%) |
| 90 or more Minutes | 78 (18.2%) | 0 (0.0%) |
Time of Departure to Work by Sex in Waynesboro
The most frequent times of departure to work in Waynesboro are 12:00 AM to 4:59 AM (78, 18.2%) for males and 7:30 AM to 7:59 AM (89, 30.2%) for females.
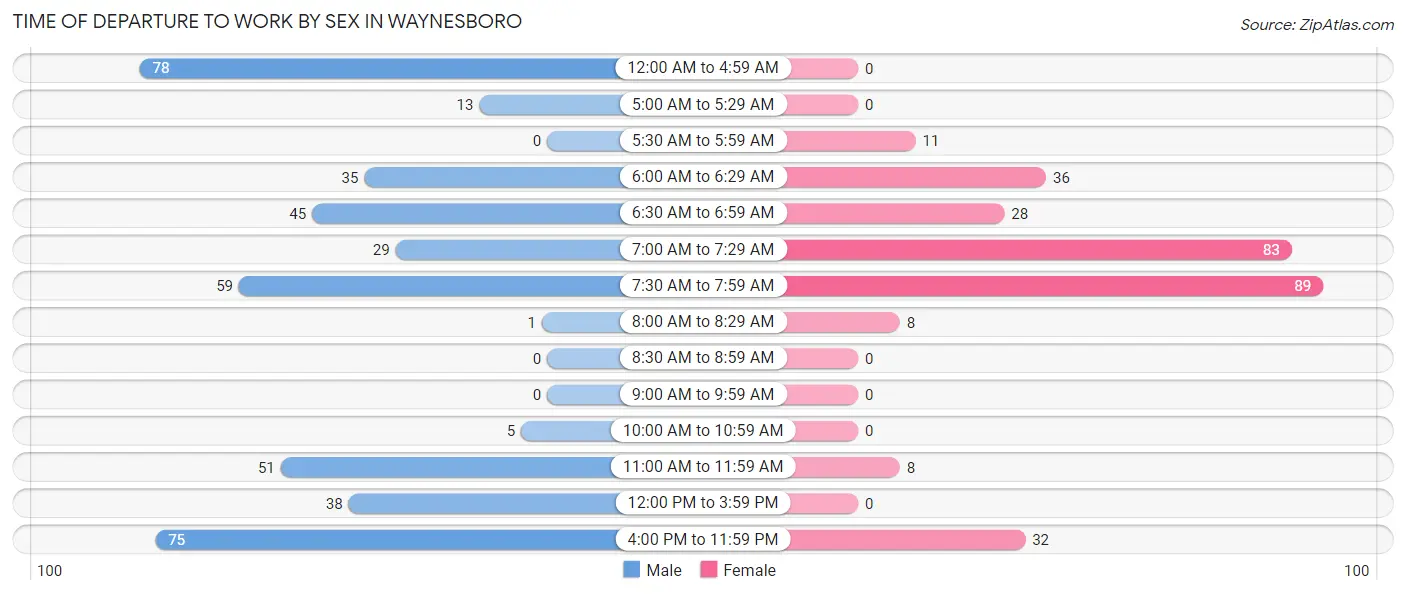
| Time of Departure | Male | Female |
| 12:00 AM to 4:59 AM | 78 (18.2%) | 0 (0.0%) |
| 5:00 AM to 5:29 AM | 13 (3.0%) | 0 (0.0%) |
| 5:30 AM to 5:59 AM | 0 (0.0%) | 11 (3.7%) |
| 6:00 AM to 6:29 AM | 35 (8.2%) | 36 (12.2%) |
| 6:30 AM to 6:59 AM | 45 (10.5%) | 28 (9.5%) |
| 7:00 AM to 7:29 AM | 29 (6.8%) | 83 (28.1%) |
| 7:30 AM to 7:59 AM | 59 (13.8%) | 89 (30.2%) |
| 8:00 AM to 8:29 AM | 1 (0.2%) | 8 (2.7%) |
| 8:30 AM to 8:59 AM | 0 (0.0%) | 0 (0.0%) |
| 9:00 AM to 9:59 AM | 0 (0.0%) | 0 (0.0%) |
| 10:00 AM to 10:59 AM | 5 (1.2%) | 0 (0.0%) |
| 11:00 AM to 11:59 AM | 51 (11.9%) | 8 (2.7%) |
| 12:00 PM to 3:59 PM | 38 (8.9%) | 0 (0.0%) |
| 4:00 PM to 11:59 PM | 75 (17.5%) | 32 (10.8%) |
| Total | 429 (100.0%) | 295 (100.0%) |
Housing Occupancy in Waynesboro
Occupancy by Ownership in Waynesboro
Of the total 881 dwellings in Waynesboro, owner-occupied units account for 458 (52.0%), while renter-occupied units make up 423 (48.0%).
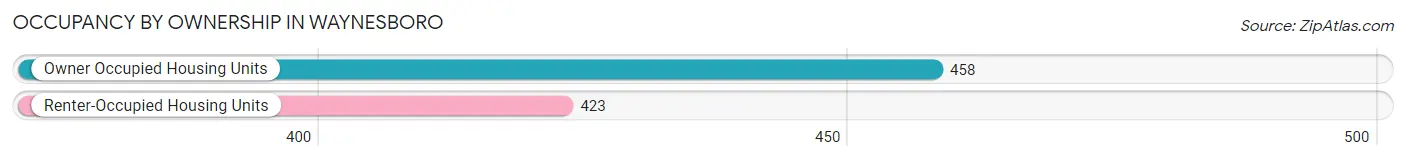
| Occupancy | # Housing Units | % Housing Units |
| Owner Occupied Housing Units | 458 | 52.0% |
| Renter-Occupied Housing Units | 423 | 48.0% |
| Total Occupied Housing Units | 881 | 100.0% |
Occupancy by Household Size in Waynesboro
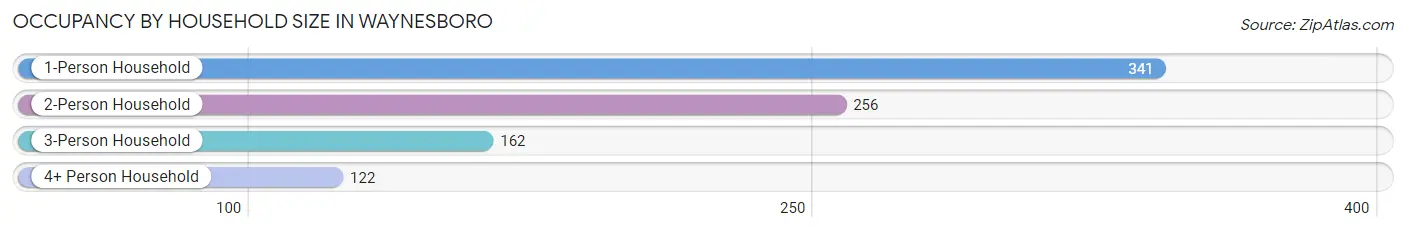
| Household Size | # Housing Units | % Housing Units |
| 1-Person Household | 341 | 38.7% |
| 2-Person Household | 256 | 29.1% |
| 3-Person Household | 162 | 18.4% |
| 4+ Person Household | 122 | 13.9% |
| Total Housing Units | 881 | 100.0% |
Occupancy by Ownership by Household Size in Waynesboro
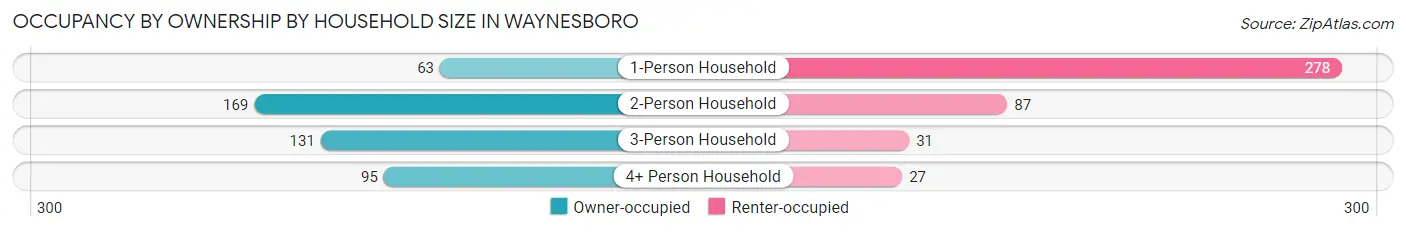
| Household Size | Owner-occupied | Renter-occupied |
| 1-Person Household | 63 (18.5%) | 278 (81.5%) |
| 2-Person Household | 169 (66.0%) | 87 (34.0%) |
| 3-Person Household | 131 (80.9%) | 31 (19.1%) |
| 4+ Person Household | 95 (77.9%) | 27 (22.1%) |
| Total Housing Units | 458 (52.0%) | 423 (48.0%) |
Occupancy by Educational Attainment in Waynesboro
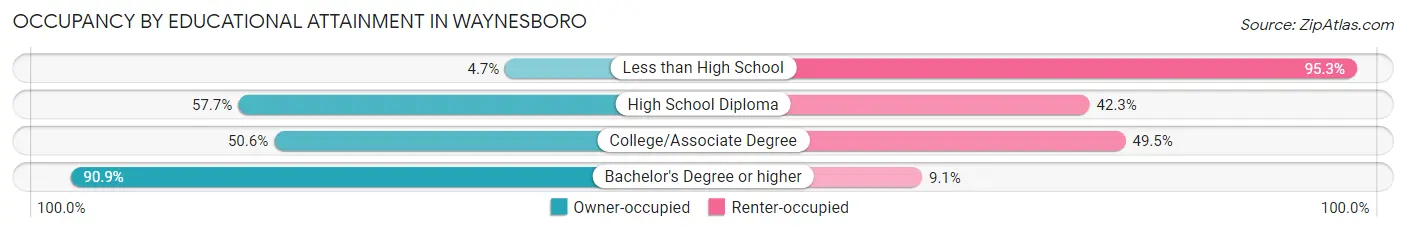
| Household Size | Owner-occupied | Renter-occupied |
| Less than High School | 7 (4.7%) | 141 (95.3%) |
| High School Diploma | 184 (57.7%) | 135 (42.3%) |
| College/Associate Degree | 137 (50.5%) | 134 (49.4%) |
| Bachelor's Degree or higher | 130 (90.9%) | 13 (9.1%) |
Occupancy by Age of Householder in Waynesboro
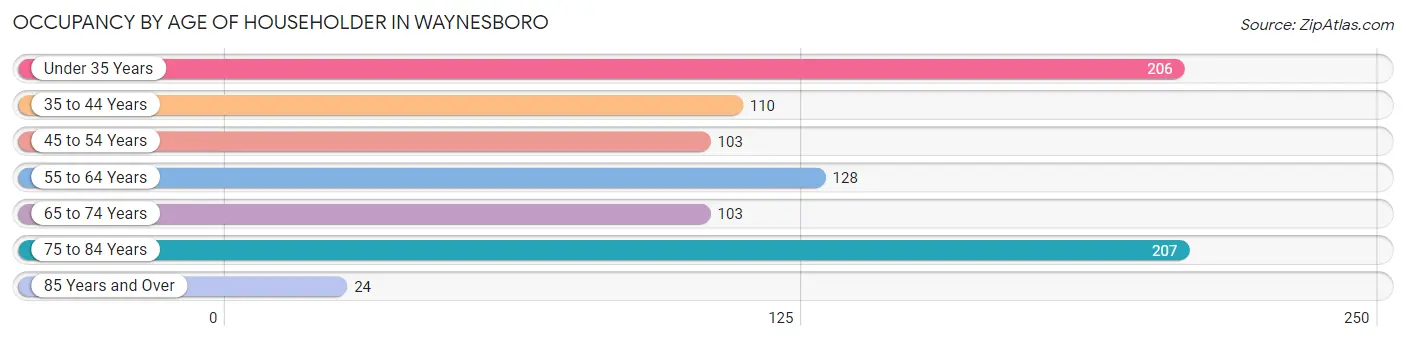
| Age Bracket | # Households | % Households |
| Under 35 Years | 206 | 23.4% |
| 35 to 44 Years | 110 | 12.5% |
| 45 to 54 Years | 103 | 11.7% |
| 55 to 64 Years | 128 | 14.5% |
| 65 to 74 Years | 103 | 11.7% |
| 75 to 84 Years | 207 | 23.5% |
| 85 Years and Over | 24 | 2.7% |
| Total | 881 | 100.0% |
Housing Finances in Waynesboro
Median Income by Occupancy in Waynesboro
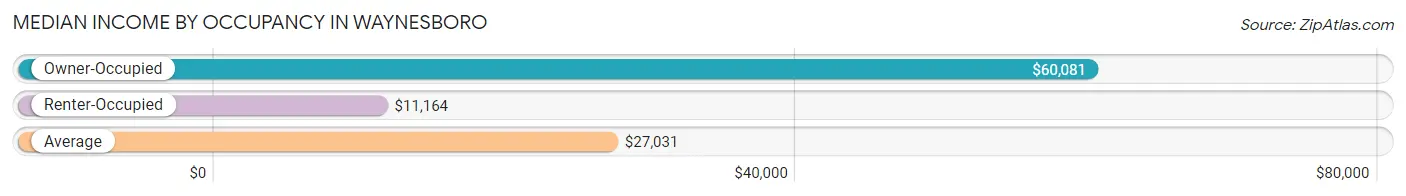
| Occupancy Type | # Households | Median Income |
| Owner-Occupied | 458 (52.0%) | $60,081 |
| Renter-Occupied | 423 (48.0%) | $11,164 |
| Average | 881 (100.0%) | $27,031 |
Occupancy by Householder Income Bracket in Waynesboro
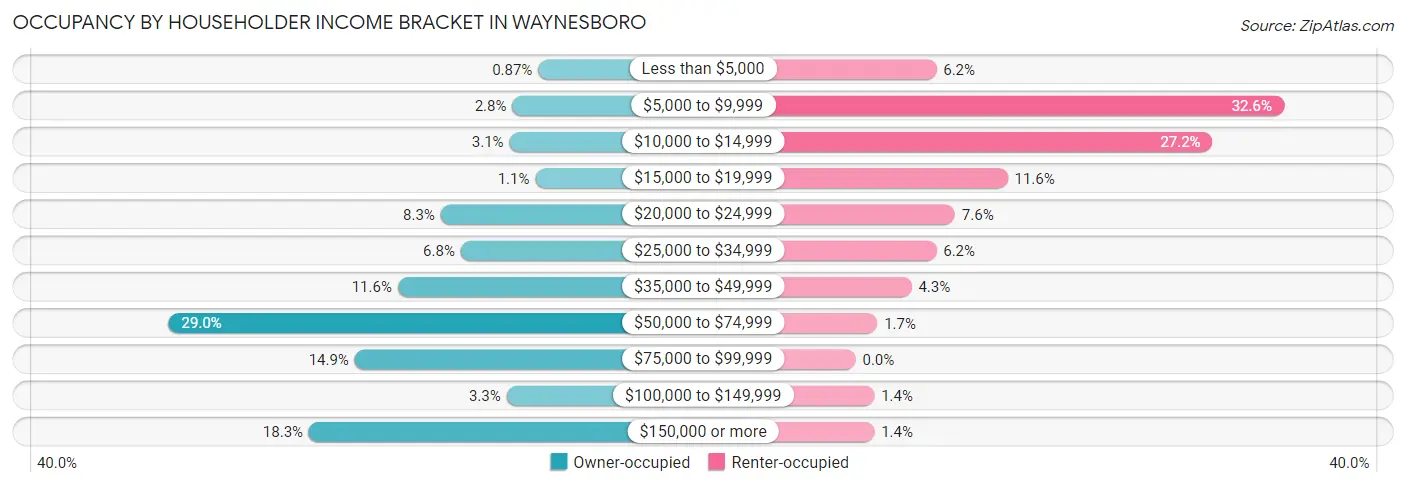
| Income Bracket | Owner-occupied | Renter-occupied |
| Less than $5,000 | 4 (0.9%) | 26 (6.1%) |
| $5,000 to $9,999 | 13 (2.8%) | 138 (32.6%) |
| $10,000 to $14,999 | 14 (3.1%) | 115 (27.2%) |
| $15,000 to $19,999 | 5 (1.1%) | 49 (11.6%) |
| $20,000 to $24,999 | 38 (8.3%) | 32 (7.6%) |
| $25,000 to $34,999 | 31 (6.8%) | 26 (6.1%) |
| $35,000 to $49,999 | 53 (11.6%) | 18 (4.3%) |
| $50,000 to $74,999 | 133 (29.0%) | 7 (1.7%) |
| $75,000 to $99,999 | 68 (14.8%) | 0 (0.0%) |
| $100,000 to $149,999 | 15 (3.3%) | 6 (1.4%) |
| $150,000 or more | 84 (18.3%) | 6 (1.4%) |
| Total | 458 (100.0%) | 423 (100.0%) |
Monthly Housing Cost Tiers in Waynesboro
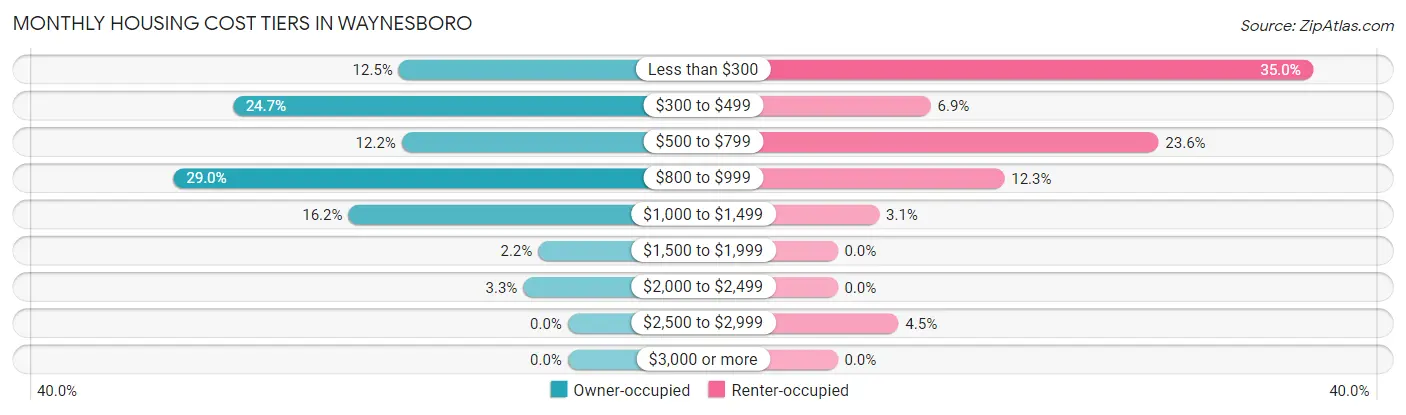
| Monthly Cost | Owner-occupied | Renter-occupied |
| Less than $300 | 57 (12.4%) | 148 (35.0%) |
| $300 to $499 | 113 (24.7%) | 29 (6.9%) |
| $500 to $799 | 56 (12.2%) | 100 (23.6%) |
| $800 to $999 | 133 (29.0%) | 52 (12.3%) |
| $1,000 to $1,499 | 74 (16.2%) | 13 (3.1%) |
| $1,500 to $1,999 | 10 (2.2%) | 0 (0.0%) |
| $2,000 to $2,499 | 15 (3.3%) | 0 (0.0%) |
| $2,500 to $2,999 | 0 (0.0%) | 19 (4.5%) |
| $3,000 or more | 0 (0.0%) | 0 (0.0%) |
| Total | 458 (100.0%) | 423 (100.0%) |
Physical Housing Characteristics in Waynesboro
Housing Structures in Waynesboro
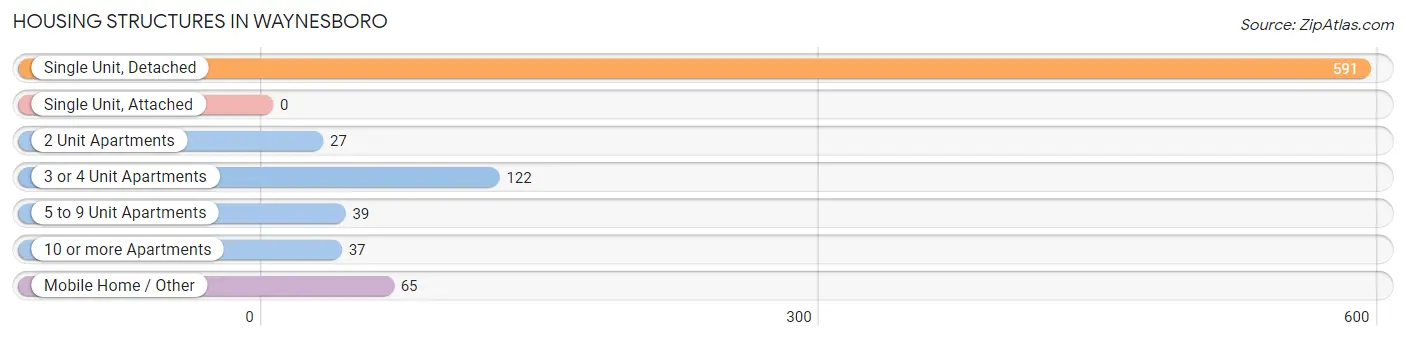
| Structure Type | # Housing Units | % Housing Units |
| Single Unit, Detached | 591 | 67.1% |
| Single Unit, Attached | 0 | 0.0% |
| 2 Unit Apartments | 27 | 3.1% |
| 3 or 4 Unit Apartments | 122 | 13.9% |
| 5 to 9 Unit Apartments | 39 | 4.4% |
| 10 or more Apartments | 37 | 4.2% |
| Mobile Home / Other | 65 | 7.4% |
| Total | 881 | 100.0% |
Housing Structures by Occupancy in Waynesboro
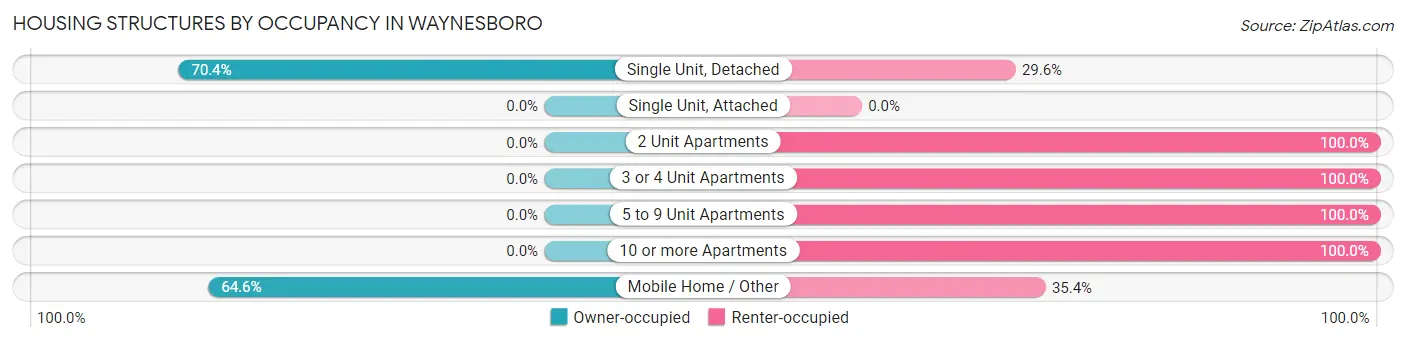
| Structure Type | Owner-occupied | Renter-occupied |
| Single Unit, Detached | 416 (70.4%) | 175 (29.6%) |
| Single Unit, Attached | 0 (0.0%) | 0 (0.0%) |
| 2 Unit Apartments | 0 (0.0%) | 27 (100.0%) |
| 3 or 4 Unit Apartments | 0 (0.0%) | 122 (100.0%) |
| 5 to 9 Unit Apartments | 0 (0.0%) | 39 (100.0%) |
| 10 or more Apartments | 0 (0.0%) | 37 (100.0%) |
| Mobile Home / Other | 42 (64.6%) | 23 (35.4%) |
| Total | 458 (52.0%) | 423 (48.0%) |
Housing Structures by Number of Rooms in Waynesboro
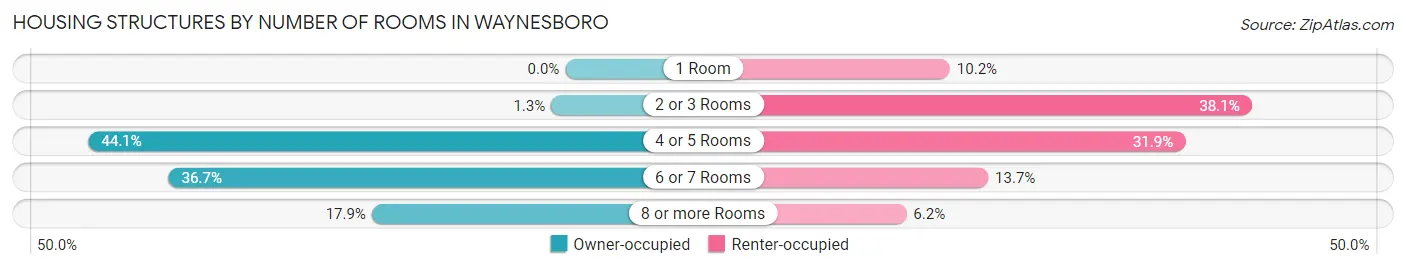
| Number of Rooms | Owner-occupied | Renter-occupied |
| 1 Room | 0 (0.0%) | 43 (10.2%) |
| 2 or 3 Rooms | 6 (1.3%) | 161 (38.1%) |
| 4 or 5 Rooms | 202 (44.1%) | 135 (31.9%) |
| 6 or 7 Rooms | 168 (36.7%) | 58 (13.7%) |
| 8 or more Rooms | 82 (17.9%) | 26 (6.1%) |
| Total | 458 (100.0%) | 423 (100.0%) |
Housing Structure by Heating Type in Waynesboro
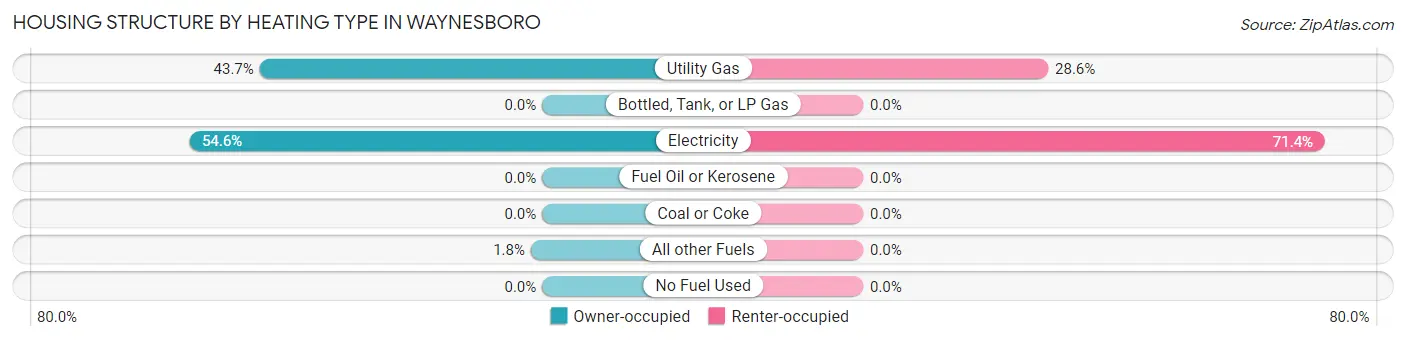
| Heating Type | Owner-occupied | Renter-occupied |
| Utility Gas | 200 (43.7%) | 121 (28.6%) |
| Bottled, Tank, or LP Gas | 0 (0.0%) | 0 (0.0%) |
| Electricity | 250 (54.6%) | 302 (71.4%) |
| Fuel Oil or Kerosene | 0 (0.0%) | 0 (0.0%) |
| Coal or Coke | 0 (0.0%) | 0 (0.0%) |
| All other Fuels | 8 (1.8%) | 0 (0.0%) |
| No Fuel Used | 0 (0.0%) | 0 (0.0%) |
| Total | 458 (100.0%) | 423 (100.0%) |
Household Vehicle Usage in Waynesboro
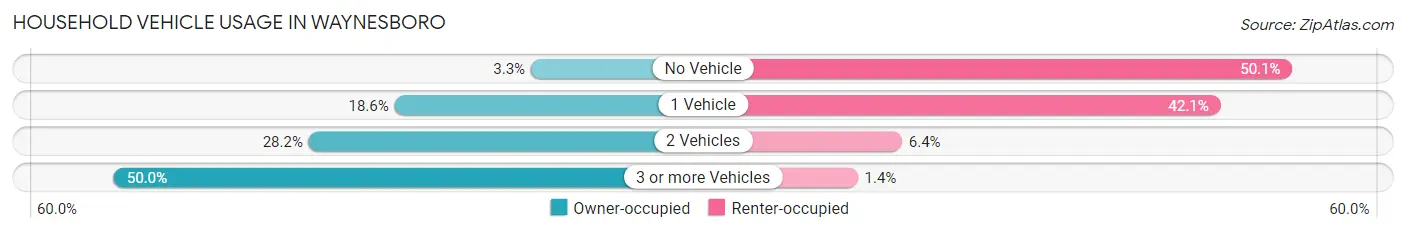
| Vehicles per Household | Owner-occupied | Renter-occupied |
| No Vehicle | 15 (3.3%) | 212 (50.1%) |
| 1 Vehicle | 85 (18.6%) | 178 (42.1%) |
| 2 Vehicles | 129 (28.2%) | 27 (6.4%) |
| 3 or more Vehicles | 229 (50.0%) | 6 (1.4%) |
| Total | 458 (100.0%) | 423 (100.0%) |
Real Estate & Mortgages in Waynesboro
Real Estate and Mortgage Overview in Waynesboro
| Characteristic | Without Mortgage | With Mortgage |
| Housing Units | 216 | 242 |
| Median Property Value | $85,700 | $78,900 |
| Median Household Income | $56,250 | $60 |
| Monthly Housing Costs | $426 | $0 |
| Real Estate Taxes | $837 | $0 |
Property Value by Mortgage Status in Waynesboro
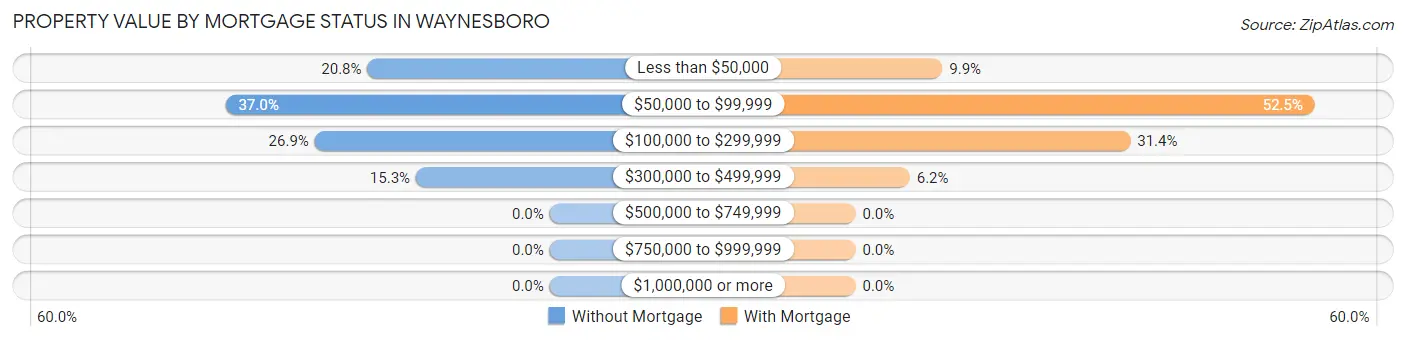
| Property Value | Without Mortgage | With Mortgage |
| Less than $50,000 | 45 (20.8%) | 24 (9.9%) |
| $50,000 to $99,999 | 80 (37.0%) | 127 (52.5%) |
| $100,000 to $299,999 | 58 (26.9%) | 76 (31.4%) |
| $300,000 to $499,999 | 33 (15.3%) | 15 (6.2%) |
| $500,000 to $749,999 | 0 (0.0%) | 0 (0.0%) |
| $750,000 to $999,999 | 0 (0.0%) | 0 (0.0%) |
| $1,000,000 or more | 0 (0.0%) | 0 (0.0%) |
| Total | 216 (100.0%) | 242 (100.0%) |
Household Income by Mortgage Status in Waynesboro
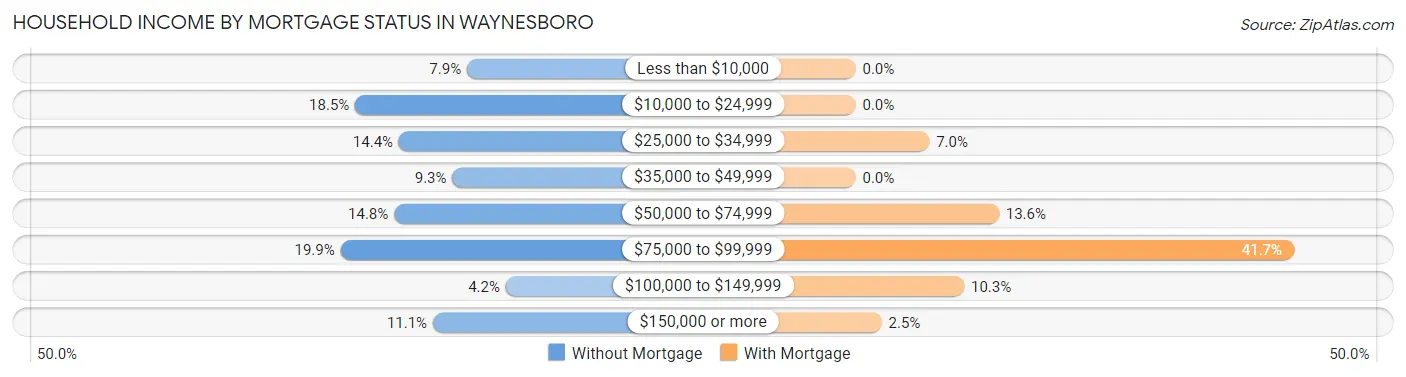
| Household Income | Without Mortgage | With Mortgage |
| Less than $10,000 | 17 (7.9%) | 0 (0.0%) |
| $10,000 to $24,999 | 40 (18.5%) | 0 (0.0%) |
| $25,000 to $34,999 | 31 (14.3%) | 17 (7.0%) |
| $35,000 to $49,999 | 20 (9.3%) | 0 (0.0%) |
| $50,000 to $74,999 | 32 (14.8%) | 33 (13.6%) |
| $75,000 to $99,999 | 43 (19.9%) | 101 (41.7%) |
| $100,000 to $149,999 | 9 (4.2%) | 25 (10.3%) |
| $150,000 or more | 24 (11.1%) | 6 (2.5%) |
| Total | 216 (100.0%) | 242 (100.0%) |
Property Value to Household Income Ratio in Waynesboro
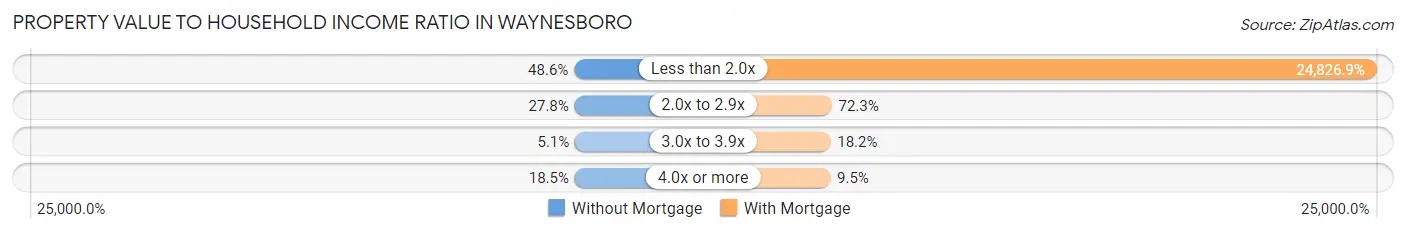
| Value-to-Income Ratio | Without Mortgage | With Mortgage |
| Less than 2.0x | 105 (48.6%) | 60,081 (24,826.9%) |
| 2.0x to 2.9x | 60 (27.8%) | 175 (72.3%) |
| 3.0x to 3.9x | 11 (5.1%) | 44 (18.2%) |
| 4.0x or more | 40 (18.5%) | 23 (9.5%) |
| Total | 216 (100.0%) | 242 (100.0%) |
Real Estate Taxes by Mortgage Status in Waynesboro
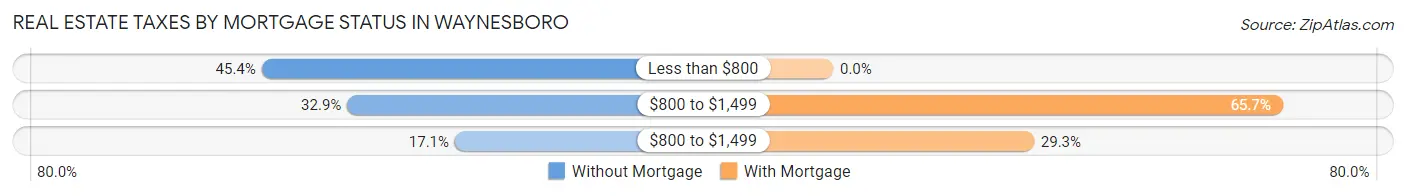
| Property Taxes | Without Mortgage | With Mortgage |
| Less than $800 | 98 (45.4%) | 0 (0.0%) |
| $800 to $1,499 | 71 (32.9%) | 159 (65.7%) |
| $800 to $1,499 | 37 (17.1%) | 71 (29.3%) |
| Total | 216 (100.0%) | 242 (100.0%) |
Health & Disability in Waynesboro
Health Insurance Coverage by Age in Waynesboro
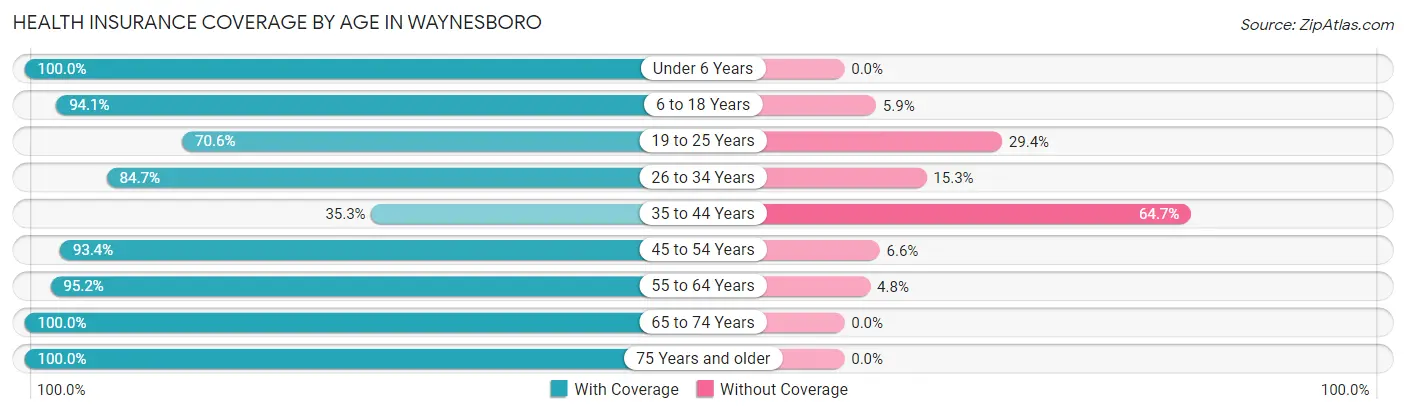
| Age Bracket | With Coverage | Without Coverage |
| Under 6 Years | 263 (100.0%) | 0 (0.0%) |
| 6 to 18 Years | 271 (94.1%) | 17 (5.9%) |
| 19 to 25 Years | 173 (70.6%) | 72 (29.4%) |
| 26 to 34 Years | 166 (84.7%) | 30 (15.3%) |
| 35 to 44 Years | 71 (35.3%) | 130 (64.7%) |
| 45 to 54 Years | 213 (93.4%) | 15 (6.6%) |
| 55 to 64 Years | 158 (95.2%) | 8 (4.8%) |
| 65 to 74 Years | 183 (100.0%) | 0 (0.0%) |
| 75 Years and older | 263 (100.0%) | 0 (0.0%) |
| Total | 1,761 (86.6%) | 272 (13.4%) |
Health Insurance Coverage by Citizenship Status in Waynesboro
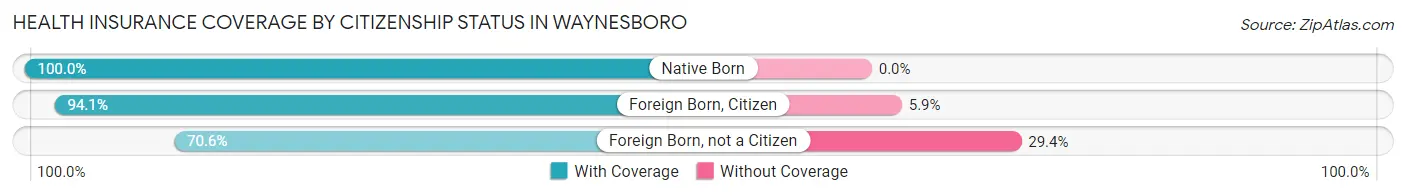
| Citizenship Status | With Coverage | Without Coverage |
| Native Born | 263 (100.0%) | 0 (0.0%) |
| Foreign Born, Citizen | 271 (94.1%) | 17 (5.9%) |
| Foreign Born, not a Citizen | 173 (70.6%) | 72 (29.4%) |
Health Insurance Coverage by Household Income in Waynesboro
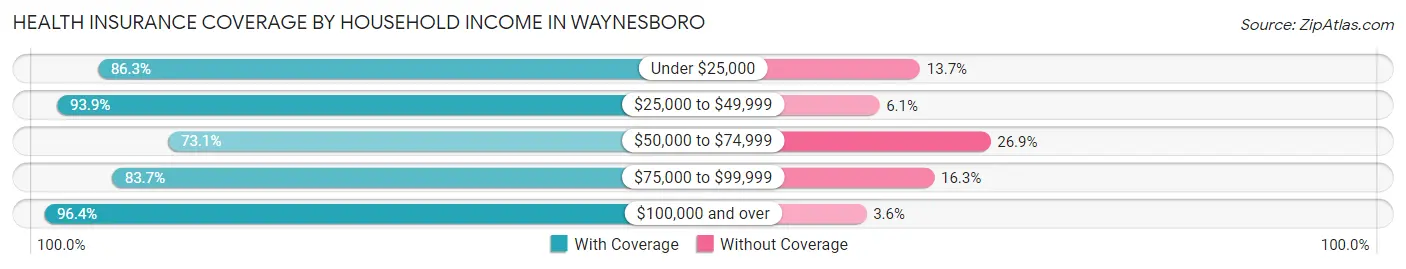
| Household Income | With Coverage | Without Coverage |
| Under $25,000 | 592 (86.3%) | 94 (13.7%) |
| $25,000 to $49,999 | 355 (93.9%) | 23 (6.1%) |
| $50,000 to $74,999 | 291 (73.1%) | 107 (26.9%) |
| $75,000 to $99,999 | 169 (83.7%) | 33 (16.3%) |
| $100,000 and over | 345 (96.4%) | 13 (3.6%) |
Public vs Private Health Insurance Coverage by Age in Waynesboro
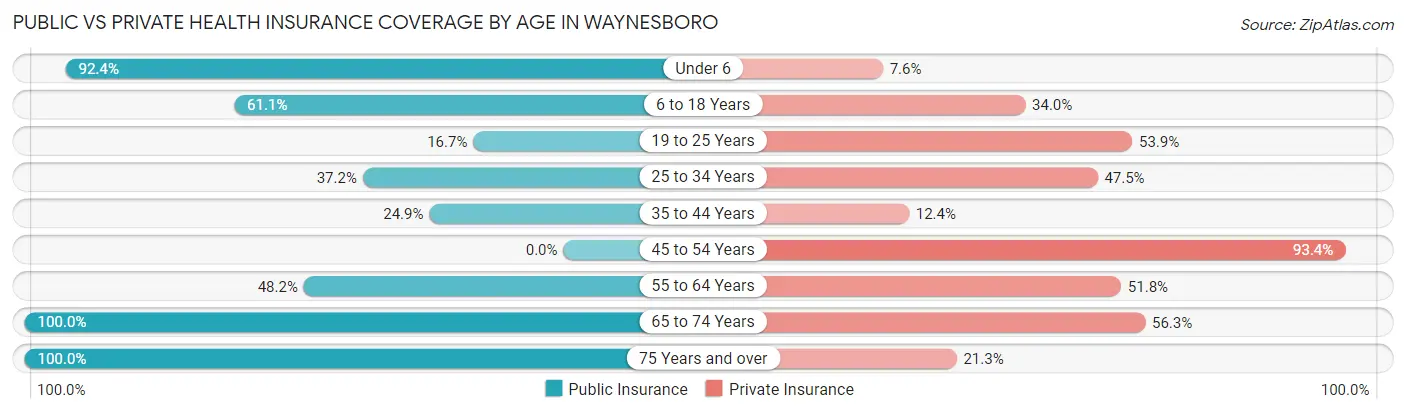
| Age Bracket | Public Insurance | Private Insurance |
| Under 6 | 243 (92.4%) | 20 (7.6%) |
| 6 to 18 Years | 176 (61.1%) | 98 (34.0%) |
| 19 to 25 Years | 41 (16.7%) | 132 (53.9%) |
| 25 to 34 Years | 73 (37.2%) | 93 (47.4%) |
| 35 to 44 Years | 50 (24.9%) | 25 (12.4%) |
| 45 to 54 Years | 0 (0.0%) | 213 (93.4%) |
| 55 to 64 Years | 80 (48.2%) | 86 (51.8%) |
| 65 to 74 Years | 183 (100.0%) | 103 (56.3%) |
| 75 Years and over | 263 (100.0%) | 56 (21.3%) |
| Total | 1,109 (54.5%) | 826 (40.6%) |
Disability Status by Sex by Age in Waynesboro
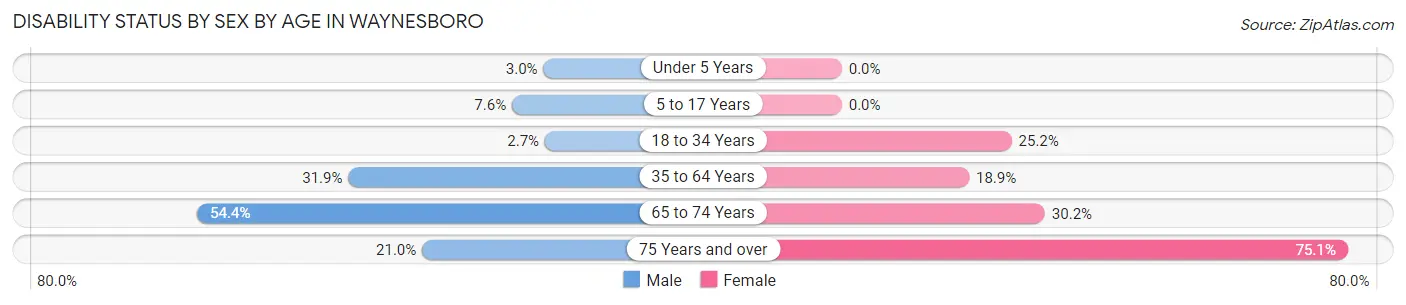
| Age Bracket | Male | Female |
| Under 5 Years | 4 (3.0%) | 0 (0.0%) |
| 5 to 17 Years | 9 (7.6%) | 0 (0.0%) |
| 18 to 34 Years | 7 (2.7%) | 57 (25.2%) |
| 35 to 64 Years | 92 (31.9%) | 58 (18.9%) |
| 65 to 74 Years | 31 (54.4%) | 38 (30.2%) |
| 75 Years and over | 13 (21.0%) | 151 (75.1%) |
Disability Class by Sex by Age in Waynesboro
Disability Class: Hearing Difficulty
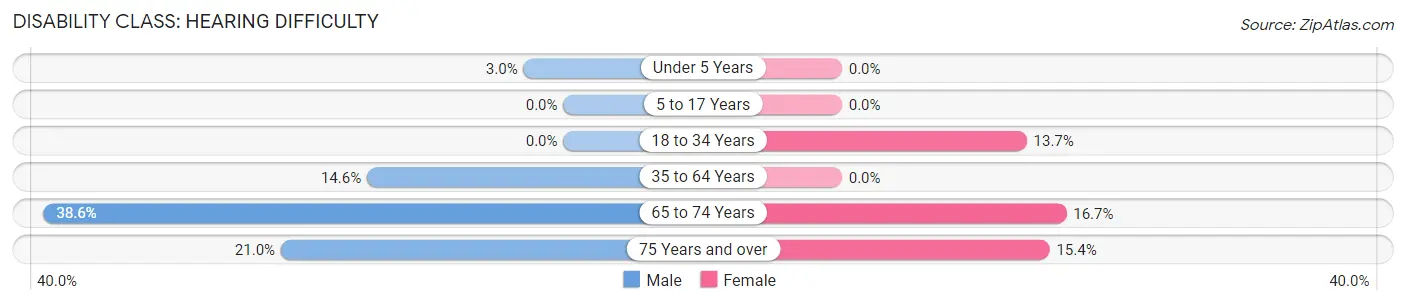
| Age Bracket | Male | Female |
| Under 5 Years | 4 (3.0%) | 0 (0.0%) |
| 5 to 17 Years | 0 (0.0%) | 0 (0.0%) |
| 18 to 34 Years | 0 (0.0%) | 31 (13.7%) |
| 35 to 64 Years | 42 (14.6%) | 0 (0.0%) |
| 65 to 74 Years | 22 (38.6%) | 21 (16.7%) |
| 75 Years and over | 13 (21.0%) | 31 (15.4%) |
Disability Class: Vision Difficulty
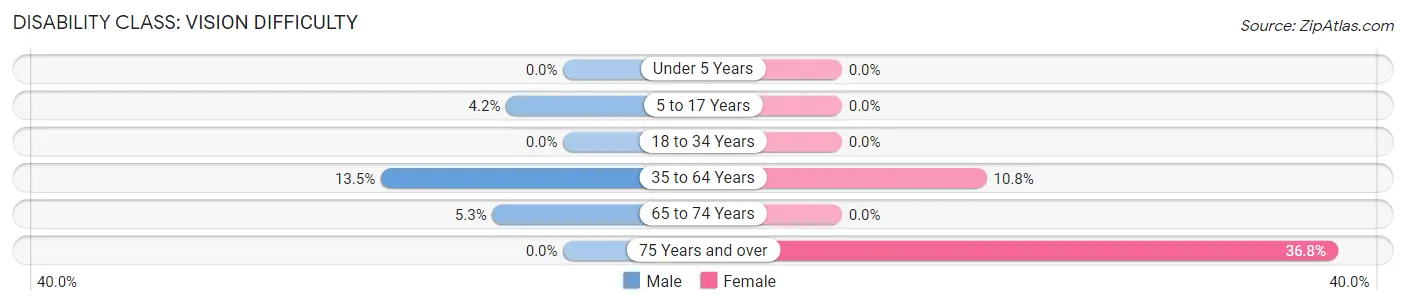
| Age Bracket | Male | Female |
| Under 5 Years | 0 (0.0%) | 0 (0.0%) |
| 5 to 17 Years | 5 (4.2%) | 0 (0.0%) |
| 18 to 34 Years | 0 (0.0%) | 0 (0.0%) |
| 35 to 64 Years | 39 (13.5%) | 33 (10.7%) |
| 65 to 74 Years | 3 (5.3%) | 0 (0.0%) |
| 75 Years and over | 0 (0.0%) | 74 (36.8%) |
Disability Class: Cognitive Difficulty
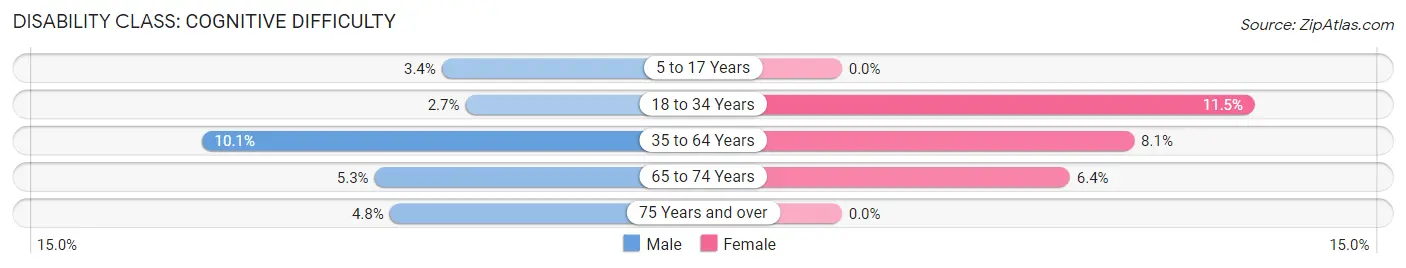
| Age Bracket | Male | Female |
| 5 to 17 Years | 4 (3.4%) | 0 (0.0%) |
| 18 to 34 Years | 7 (2.7%) | 26 (11.5%) |
| 35 to 64 Years | 29 (10.1%) | 25 (8.1%) |
| 65 to 74 Years | 3 (5.3%) | 8 (6.4%) |
| 75 Years and over | 3 (4.8%) | 0 (0.0%) |
Disability Class: Ambulatory Difficulty
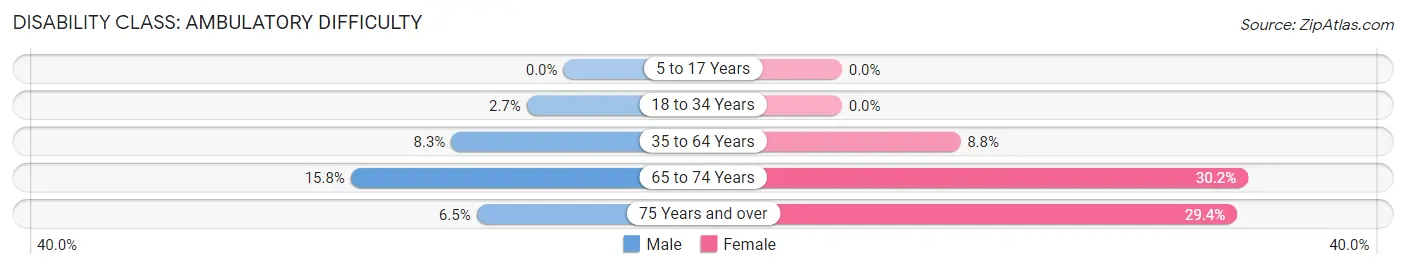
| Age Bracket | Male | Female |
| 5 to 17 Years | 0 (0.0%) | 0 (0.0%) |
| 18 to 34 Years | 7 (2.7%) | 0 (0.0%) |
| 35 to 64 Years | 24 (8.3%) | 27 (8.8%) |
| 65 to 74 Years | 9 (15.8%) | 38 (30.2%) |
| 75 Years and over | 4 (6.5%) | 59 (29.3%) |
Disability Class: Self-Care Difficulty
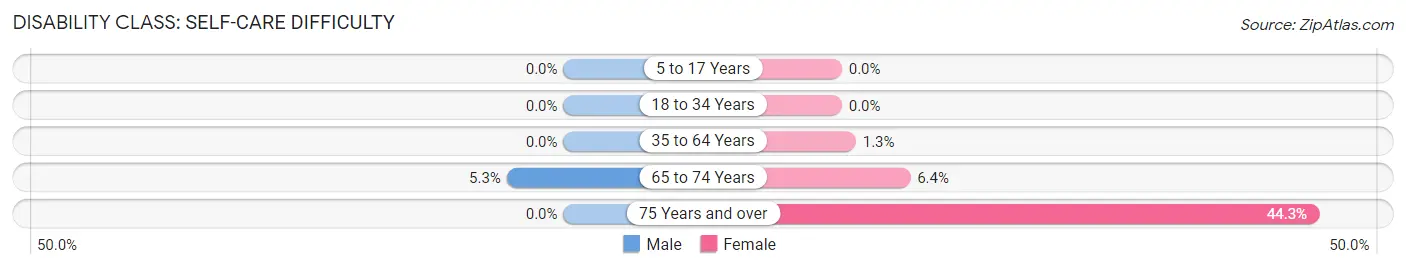
| Age Bracket | Male | Female |
| 5 to 17 Years | 0 (0.0%) | 0 (0.0%) |
| 18 to 34 Years | 0 (0.0%) | 0 (0.0%) |
| 35 to 64 Years | 0 (0.0%) | 4 (1.3%) |
| 65 to 74 Years | 3 (5.3%) | 8 (6.4%) |
| 75 Years and over | 0 (0.0%) | 89 (44.3%) |
Technology Access in Waynesboro
Computing Device Access in Waynesboro
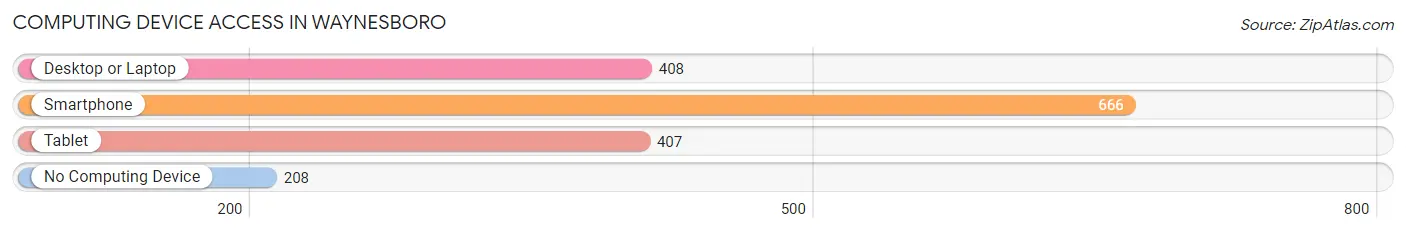
| Device Type | # Households | % Households |
| Desktop or Laptop | 408 | 46.3% |
| Smartphone | 666 | 75.6% |
| Tablet | 407 | 46.2% |
| No Computing Device | 208 | 23.6% |
| Total | 881 | 100.0% |
Internet Access in Waynesboro
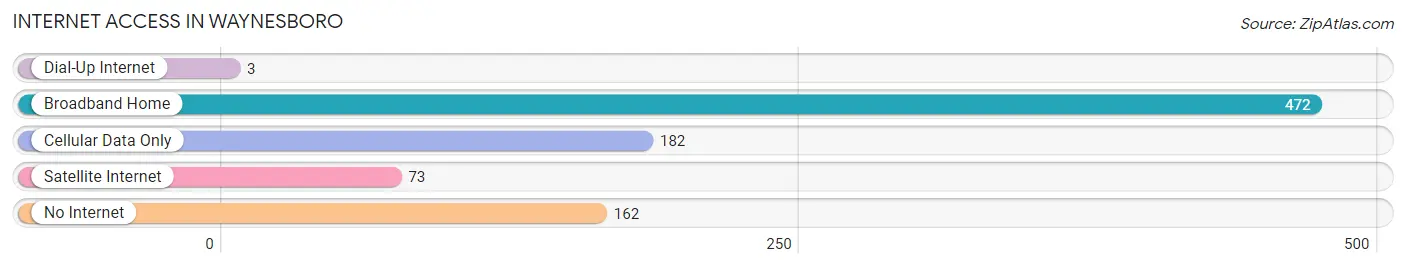
| Internet Type | # Households | % Households |
| Dial-Up Internet | 3 | 0.3% |
| Broadband Home | 472 | 53.6% |
| Cellular Data Only | 182 | 20.7% |
| Satellite Internet | 73 | 8.3% |
| No Internet | 162 | 18.4% |
| Total | 881 | 100.0% |
Waynesboro Summary
Waynesboro is a small town located in Wayne County, Tennessee. It is situated in the southwestern part of the state, about halfway between Nashville and Memphis. The town has a population of approximately 2,000 people and is the county seat of Wayne County.
History
Waynesboro was founded in 1825 and named after General Anthony Wayne, a Revolutionary War hero. The town was originally known as Waynesborough, but the name was changed to Waynesboro in 1836. The town was incorporated in 1837 and has been the county seat of Wayne County since its founding.
The town was an important stop on the stagecoach route between Nashville and Memphis. It was also a major stop on the railroad line between the two cities. The town was a center of commerce and industry in the late 19th and early 20th centuries.
Geography
Waynesboro is located in the southwestern part of Tennessee, about halfway between Nashville and Memphis. The town is situated in the foothills of the Appalachian Mountains and is surrounded by rolling hills and forests. The town is located on the banks of the Buffalo River, which flows through the town.
The climate in Waynesboro is humid subtropical, with hot summers and mild winters. The average annual temperature is around 64°F (18°C). The average annual precipitation is around 45 inches (114 cm).
Economy
Waynesboro’s economy is largely based on agriculture and manufacturing. The town is home to several large farms, which produce a variety of crops, including corn, soybeans, cotton, and tobacco. The town is also home to several manufacturing companies, which produce a variety of products, including furniture, clothing, and automotive parts.
The town is also home to several small businesses, including restaurants, shops, and services. The town is also home to several tourist attractions, including the Buffalo River State Park and the Waynesboro Historic District.
Demographics
As of the 2010 census, the population of Waynesboro was 2,000. The racial makeup of the town was 95.2% White, 2.2% African American, 0.4% Native American, 0.2% Asian, 0.1% Pacific Islander, 0.7% from other races, and 1.2% from two or more races. Hispanic or Latino of any race were 1.7% of the population.
The median income for a household in the town was $30,000, and the median income for a family was $35,000. The per capita income for the town was $15,000. About 17.5% of families and 20.2% of the population were below the poverty line, including 28.3% of those under age 18 and 11.1% of those age 65 or over.
Waynesboro is a small town with a rich history and a diverse economy. The town is home to several farms, manufacturing companies, and small businesses. The town is also home to several tourist attractions, including the Buffalo River State Park and the Waynesboro Historic District. The town has a population of approximately 2,000 people and is the county seat of Wayne County.
Common Questions
What is Per Capita Income in Waynesboro?
Per Capita income in Waynesboro is $22,703.
What is the Median Family Income in Waynesboro?
Median Family Income in Waynesboro is $53,657.
What is the Median Household income in Waynesboro?
Median Household Income in Waynesboro is $27,031.
What is Income or Wage Gap in Waynesboro?
Income or Wage Gap in Waynesboro is 2.3%.
Women in Waynesboro earn 97.7 cents for every dollar earned by a man.
What is Inequality or Gini Index in Waynesboro?
Inequality or Gini Index in Waynesboro is 0.56.
What is the Total Population of Waynesboro?
Total Population of Waynesboro is 2,379.
What is the Total Male Population of Waynesboro?
Total Male Population of Waynesboro is 1,122.
What is the Total Female Population of Waynesboro?
Total Female Population of Waynesboro is 1,257.
What is the Ratio of Males per 100 Females in Waynesboro?
There are 89.26 Males per 100 Females in Waynesboro.
What is the Ratio of Females per 100 Males in Waynesboro?
There are 112.03 Females per 100 Males in Waynesboro.
What is the Median Population Age in Waynesboro?
Median Population Age in Waynesboro is 43.5 Years.
What is the Average Family Size in Waynesboro
Average Family Size in Waynesboro is 3.0 People.
What is the Average Household Size in Waynesboro
Average Household Size in Waynesboro is 2.3 People.
How Large is the Labor Force in Waynesboro?
There are 803 People in the Labor Forcein in Waynesboro.
What is the Percentage of People in the Labor Force in Waynesboro?
41.4% of People are in the Labor Force in Waynesboro.
What is the Unemployment Rate in Waynesboro?
Unemployment Rate in Waynesboro is 7.8%.