Montague, MI Map & Demographics
Montague Map
Montague Overview
$28,213
PER CAPITA INCOME
$76,481
AVG FAMILY INCOME
$70,547
AVG HOUSEHOLD INCOME
51.6%
WAGE / INCOME GAP [ % ]
48.4¢/ $1
WAGE / INCOME GAP [ $ ]
$10,058
FAMILY INCOME DEFICIT
0.33
INEQUALITY / GINI INDEX
2,514
TOTAL POPULATION
1,197
MALE POPULATION
1,317
FEMALE POPULATION
90.89
MALES / 100 FEMALES
110.03
FEMALES / 100 MALES
36.0
MEDIAN AGE
3.1
AVG FAMILY SIZE
2.5
AVG HOUSEHOLD SIZE
1,160
LABOR FORCE [ PEOPLE ]
63.3%
PERCENT IN LABOR FORCE
1.7%
UNEMPLOYMENT RATE
Montague Zip Codes
Montague Area Codes
Income in Montague
Income Overview in Montague
Per Capita Income in Montague is $28,213, while median incomes of families and households are $76,481 and $70,547 respectively.
| Characteristic | Number | Measure |
| Per Capita Income | 2,514 | $28,213 |
| Median Family Income | 678 | $76,481 |
| Mean Family Income | 678 | $82,968 |
| Median Household Income | 984 | $70,547 |
| Mean Household Income | 984 | $72,055 |
| Income Deficit | 678 | $10,058 |
| Wage / Income Gap (%) | 2,514 | 51.65% |
| Wage / Income Gap ($) | 2,514 | 48.35¢ per $1 |
| Gini / Inequality Index | 2,514 | 0.33 |
Earnings by Sex in Montague
Average Earnings in Montague are $36,216, $50,986 for men and $24,653 for women, a difference of 51.6%.
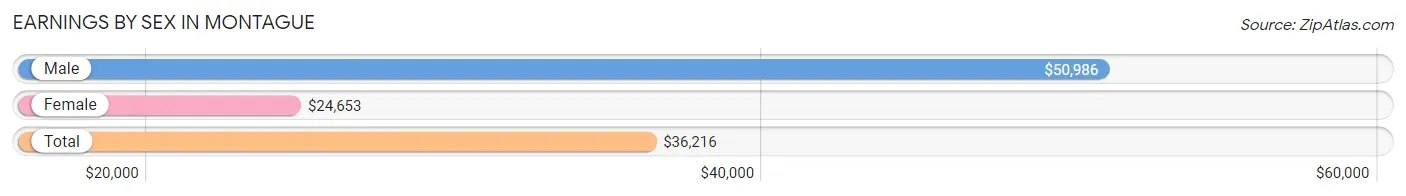
| Sex | Number | Average Earnings |
| Male | 635 (50.6%) | $50,986 |
| Female | 620 (49.4%) | $24,653 |
| Total | 1,255 (100.0%) | $36,216 |
Earnings by Sex by Income Bracket in Montague
The most common earnings brackets in Montague are $65,000 to $74,999 for men (99 | 15.6%) and $35,000 to $39,999 for women (116 | 18.7%).
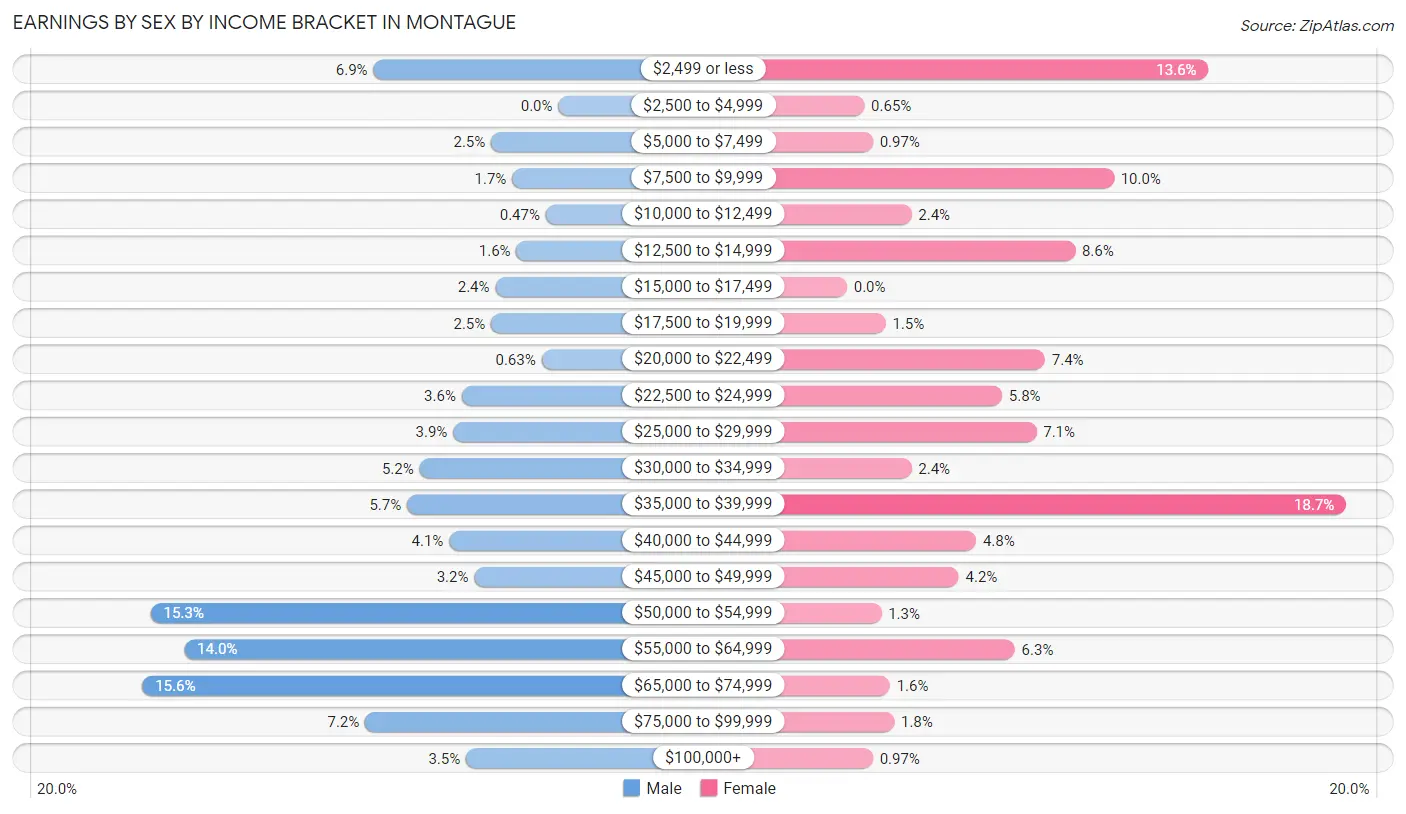
| Income | Male | Female |
| $2,499 or less | 44 (6.9%) | 84 (13.6%) |
| $2,500 to $4,999 | 0 (0.0%) | 4 (0.6%) |
| $5,000 to $7,499 | 16 (2.5%) | 6 (1.0%) |
| $7,500 to $9,999 | 11 (1.7%) | 62 (10.0%) |
| $10,000 to $12,499 | 3 (0.5%) | 15 (2.4%) |
| $12,500 to $14,999 | 10 (1.6%) | 53 (8.6%) |
| $15,000 to $17,499 | 15 (2.4%) | 0 (0.0%) |
| $17,500 to $19,999 | 16 (2.5%) | 9 (1.5%) |
| $20,000 to $22,499 | 4 (0.6%) | 46 (7.4%) |
| $22,500 to $24,999 | 23 (3.6%) | 36 (5.8%) |
| $25,000 to $29,999 | 25 (3.9%) | 44 (7.1%) |
| $30,000 to $34,999 | 33 (5.2%) | 15 (2.4%) |
| $35,000 to $39,999 | 36 (5.7%) | 116 (18.7%) |
| $40,000 to $44,999 | 26 (4.1%) | 30 (4.8%) |
| $45,000 to $49,999 | 20 (3.2%) | 26 (4.2%) |
| $50,000 to $54,999 | 97 (15.3%) | 8 (1.3%) |
| $55,000 to $64,999 | 89 (14.0%) | 39 (6.3%) |
| $65,000 to $74,999 | 99 (15.6%) | 10 (1.6%) |
| $75,000 to $99,999 | 46 (7.2%) | 11 (1.8%) |
| $100,000+ | 22 (3.5%) | 6 (1.0%) |
| Total | 635 (100.0%) | 620 (100.0%) |
Earnings by Sex by Educational Attainment in Montague
Average earnings in Montague are $52,153 for men and $28,688 for women, a difference of 45.0%. Men with an educational attainment of bachelor's degree enjoy the highest average annual earnings of $72,708, while those with high school diploma education earn the least with $37,031. Women with an educational attainment of college or associate's degree earn the most with the average annual earnings of $35,872, while those with graduate degree education have the smallest earnings of $22,095.
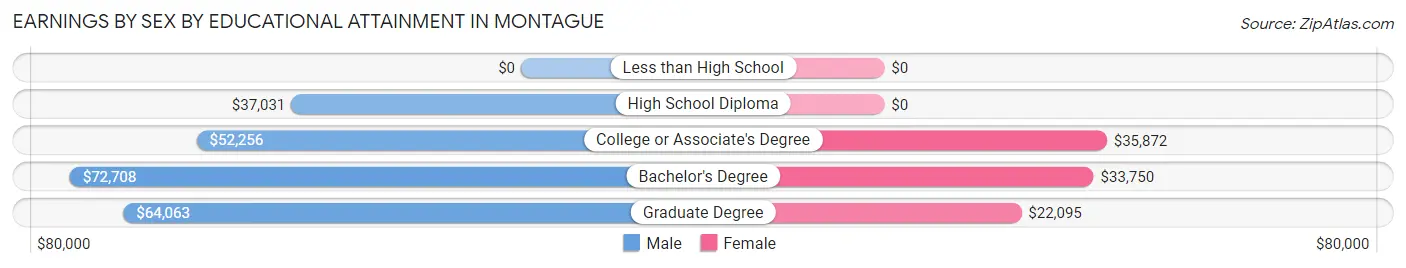
| Educational Attainment | Male Income | Female Income |
| Less than High School | - | - |
| High School Diploma | $37,031 | $0 |
| College or Associate's Degree | $52,256 | $35,872 |
| Bachelor's Degree | $72,708 | $33,750 |
| Graduate Degree | $64,063 | $22,095 |
| Total | $52,153 | $28,688 |
Family Income in Montague
Family Income Brackets in Montague
According to the Montague family income data, there are 229 families falling into the $75,000 to $99,999 income range, which is the most common income bracket and makes up 33.8% of all families. Conversely, the $200,000+ income bracket is the least frequent group with only 4 families (0.6%) belonging to this category.
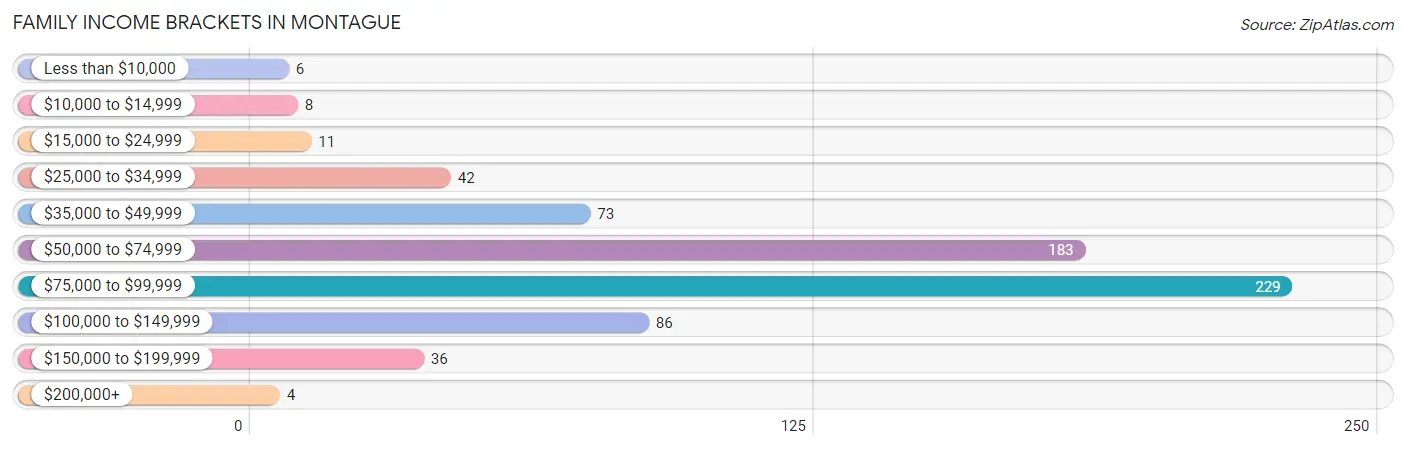
| Income Bracket | # Families | % Families |
| Less than $10,000 | 6 | 0.9% |
| $10,000 to $14,999 | 8 | 1.2% |
| $15,000 to $24,999 | 11 | 1.6% |
| $25,000 to $34,999 | 42 | 6.2% |
| $35,000 to $49,999 | 73 | 10.8% |
| $50,000 to $74,999 | 183 | 27.0% |
| $75,000 to $99,999 | 229 | 33.8% |
| $100,000 to $149,999 | 86 | 12.7% |
| $150,000 to $199,999 | 36 | 5.3% |
| $200,000+ | 4 | 0.6% |
Family Income by Famaliy Size in Montague
3-person families (159 | 23.4%) account for the highest median family income in Montague with $90,815 per family, while 2-person families (297 | 43.8%) have the highest median income of $36,719 per family member.
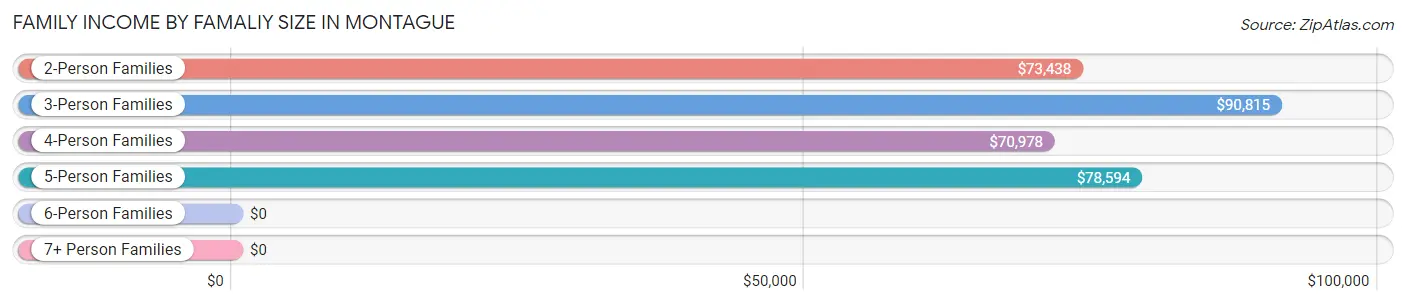
| Income Bracket | # Families | Median Income |
| 2-Person Families | 297 (43.8%) | $73,438 |
| 3-Person Families | 159 (23.4%) | $90,815 |
| 4-Person Families | 90 (13.3%) | $70,978 |
| 5-Person Families | 123 (18.1%) | $78,594 |
| 6-Person Families | 7 (1.0%) | $0 |
| 7+ Person Families | 2 (0.3%) | $0 |
| Total | 678 (100.0%) | $76,481 |
Family Income by Number of Earners in Montague
The median family income in Montague is $76,481, with families comprising 3+ earners (71) having the highest median family income of $110,179, while families with 1 earner (189) have the lowest median family income of $55,972, accounting for 10.5% and 27.9% of families, respectively.
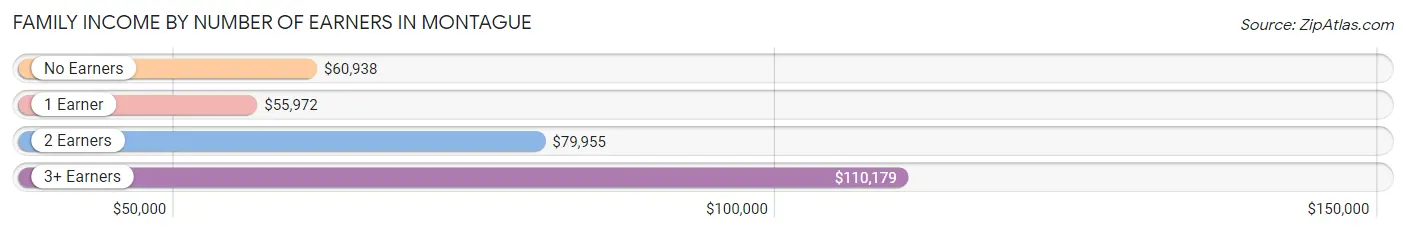
| Number of Earners | # Families | Median Income |
| No Earners | 96 (14.2%) | $60,938 |
| 1 Earner | 189 (27.9%) | $55,972 |
| 2 Earners | 322 (47.5%) | $79,955 |
| 3+ Earners | 71 (10.5%) | $110,179 |
| Total | 678 (100.0%) | $76,481 |
Household Income in Montague
Household Income Brackets in Montague
With 268 households falling in the category, the $50,000 to $74,999 income range is the most frequent in Montague, accounting for 27.2% of all households. In contrast, only 4 households (0.4%) fall into the $200,000+ income bracket, making it the least populous group.
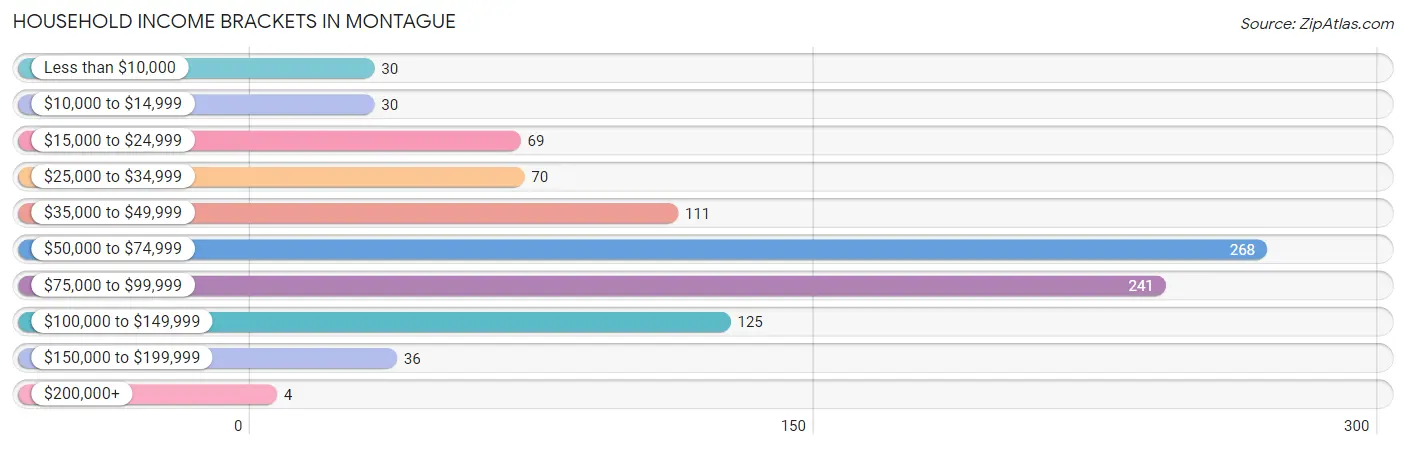
| Income Bracket | # Households | % Households |
| Less than $10,000 | 30 | 3.0% |
| $10,000 to $14,999 | 30 | 3.0% |
| $15,000 to $24,999 | 69 | 7.0% |
| $25,000 to $34,999 | 70 | 7.1% |
| $35,000 to $49,999 | 111 | 11.3% |
| $50,000 to $74,999 | 268 | 27.2% |
| $75,000 to $99,999 | 241 | 24.5% |
| $100,000 to $149,999 | 125 | 12.7% |
| $150,000 to $199,999 | 36 | 3.7% |
| $200,000+ | 4 | 0.4% |
Household Income by Householder Age in Montague
The median household income in Montague is $70,547, with the highest median household income of $78,770 found in the 25 to 44 years age bracket for the primary householder. A total of 329 households (33.4%) fall into this category. Meanwhile, the 15 to 24 years age bracket for the primary householder has the lowest median household income of $35,313, with 21 households (2.1%) in this group.
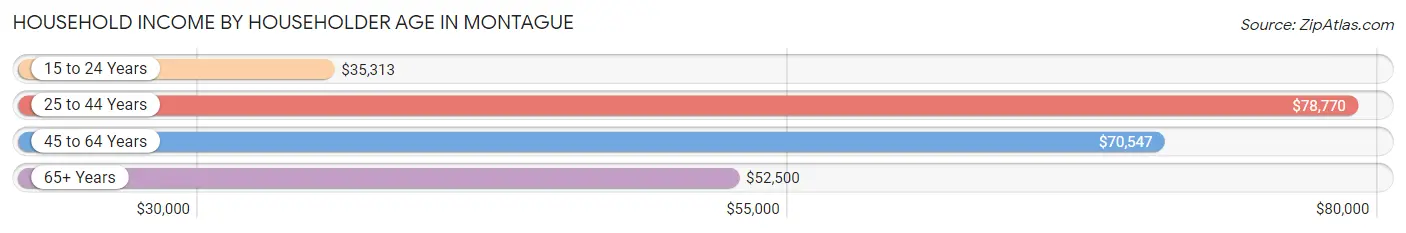
| Income Bracket | # Households | Median Income |
| 15 to 24 Years | 21 (2.1%) | $35,313 |
| 25 to 44 Years | 329 (33.4%) | $78,770 |
| 45 to 64 Years | 348 (35.4%) | $70,547 |
| 65+ Years | 286 (29.1%) | $52,500 |
| Total | 984 (100.0%) | $70,547 |
Poverty in Montague
Income Below Poverty by Sex and Age in Montague
With 2.6% poverty level for males and 6.2% for females among the residents of Montague, 55 to 64 year old males and 15 year old females are the most vulnerable to poverty, with 12 males (9.5%) and 6 females (27.3%) in their respective age groups living below the poverty level.
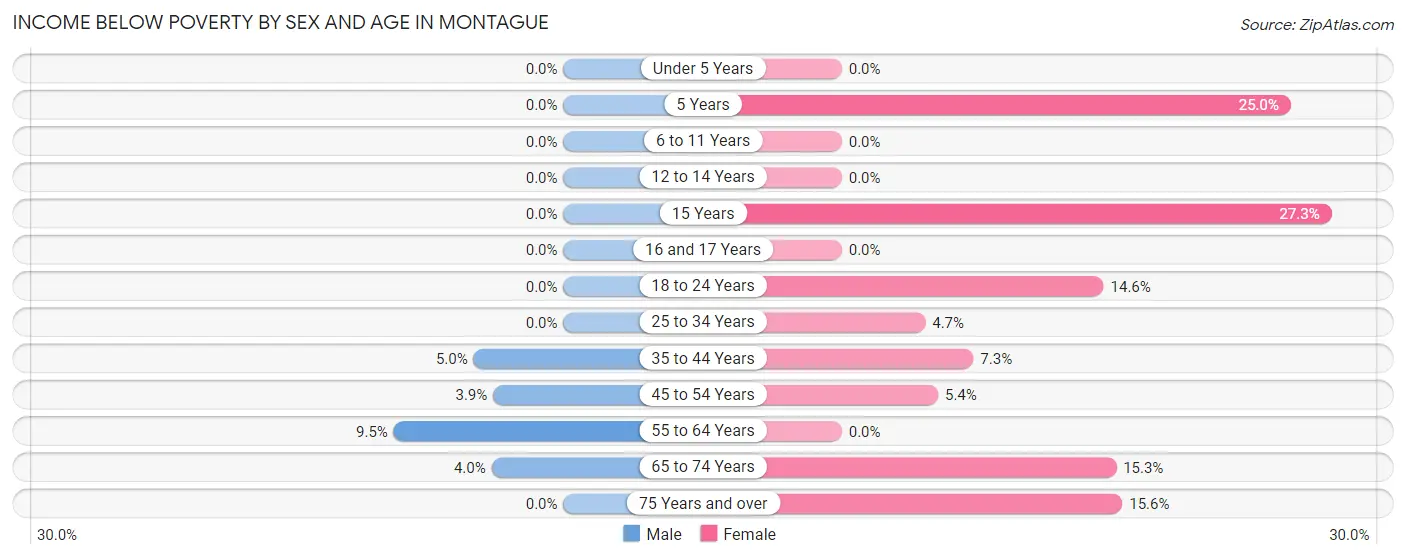
| Age Bracket | Male | Female |
| Under 5 Years | 0 (0.0%) | 0 (0.0%) |
| 5 Years | 0 (0.0%) | 6 (25.0%) |
| 6 to 11 Years | 0 (0.0%) | 0 (0.0%) |
| 12 to 14 Years | 0 (0.0%) | 0 (0.0%) |
| 15 Years | 0 (0.0%) | 6 (27.3%) |
| 16 and 17 Years | 0 (0.0%) | 0 (0.0%) |
| 18 to 24 Years | 0 (0.0%) | 7 (14.6%) |
| 25 to 34 Years | 0 (0.0%) | 8 (4.6%) |
| 35 to 44 Years | 8 (5.0%) | 11 (7.3%) |
| 45 to 54 Years | 5 (3.9%) | 6 (5.4%) |
| 55 to 64 Years | 12 (9.5%) | 0 (0.0%) |
| 65 to 74 Years | 6 (4.0%) | 22 (15.3%) |
| 75 Years and over | 0 (0.0%) | 15 (15.6%) |
| Total | 31 (2.6%) | 81 (6.2%) |
Income Above Poverty by Sex and Age in Montague
According to the poverty statistics in Montague, males aged under 5 years and females aged under 5 years are the age groups that are most secure financially, with 100.0% of males and 100.0% of females in these age groups living above the poverty line.
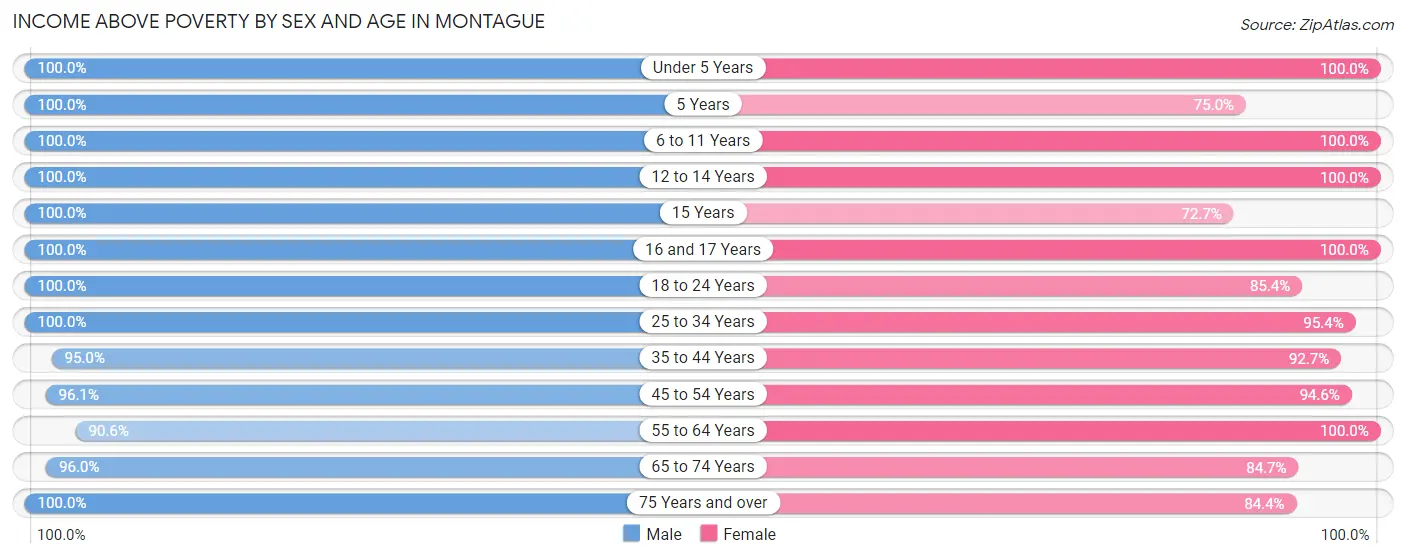
| Age Bracket | Male | Female |
| Under 5 Years | 56 (100.0%) | 55 (100.0%) |
| 5 Years | 11 (100.0%) | 18 (75.0%) |
| 6 to 11 Years | 207 (100.0%) | 206 (100.0%) |
| 12 to 14 Years | 41 (100.0%) | 25 (100.0%) |
| 15 Years | 22 (100.0%) | 16 (72.7%) |
| 16 and 17 Years | 20 (100.0%) | 66 (100.0%) |
| 18 to 24 Years | 78 (100.0%) | 41 (85.4%) |
| 25 to 34 Years | 132 (100.0%) | 164 (95.4%) |
| 35 to 44 Years | 152 (95.0%) | 139 (92.7%) |
| 45 to 54 Years | 123 (96.1%) | 106 (94.6%) |
| 55 to 64 Years | 115 (90.5%) | 191 (100.0%) |
| 65 to 74 Years | 144 (96.0%) | 122 (84.7%) |
| 75 Years and over | 55 (100.0%) | 81 (84.4%) |
| Total | 1,156 (97.4%) | 1,230 (93.8%) |
Income Below Poverty Among Married-Couple Families in Montague
The poverty statistics for married-couple families in Montague show that 3.5% or 19 of the total 535 families live below the poverty line. Families with 1 or 2 children have the highest poverty rate of 4.8%, comprising of 6 families. On the other hand, families with 3 or 4 children have the lowest poverty rate of 0.0%, which includes 0 families.
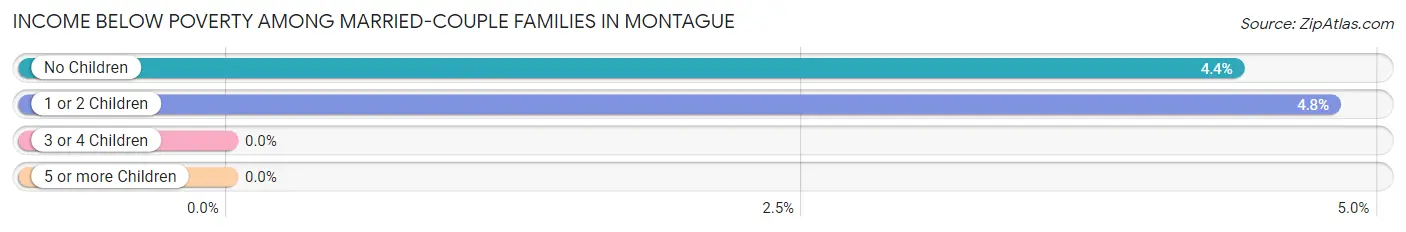
| Children | Above Poverty | Below Poverty |
| No Children | 284 (95.6%) | 13 (4.4%) |
| 1 or 2 Children | 119 (95.2%) | 6 (4.8%) |
| 3 or 4 Children | 111 (100.0%) | 0 (0.0%) |
| 5 or more Children | 2 (100.0%) | 0 (0.0%) |
| Total | 516 (96.5%) | 19 (3.5%) |
Income Below Poverty Among Single-Parent Households in Montague
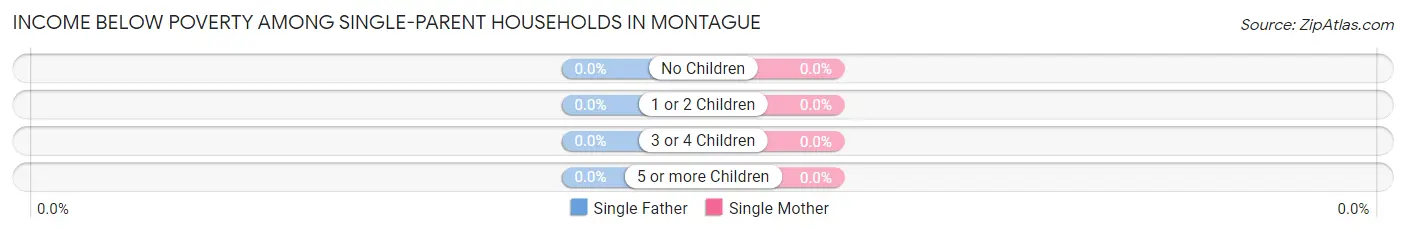
| Children | Single Father | Single Mother |
| No Children | 0 (0.0%) | 0 (0.0%) |
| 1 or 2 Children | 0 (0.0%) | 0 (0.0%) |
| 3 or 4 Children | 0 (0.0%) | 0 (0.0%) |
| 5 or more Children | 0 (0.0%) | 0 (0.0%) |
| Total | 0 (0.0%) | 0 (0.0%) |
Income Below Poverty Among Married-Couple vs Single-Parent Households in Montague
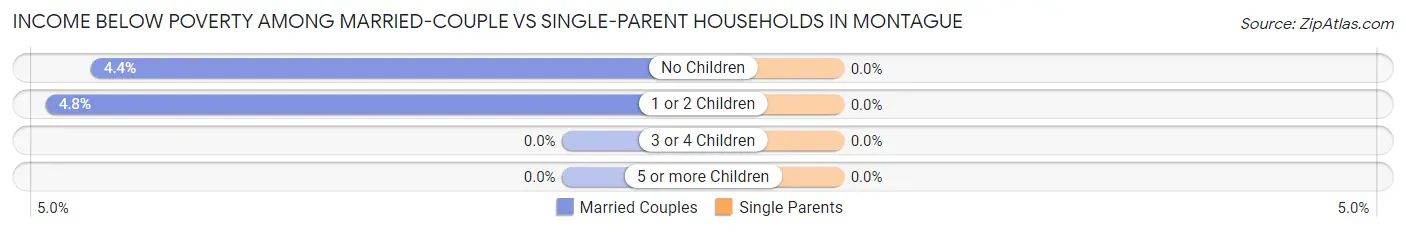
| Children | Married-Couple Families | Single-Parent Households |
| No Children | 13 (4.4%) | 0 (0.0%) |
| 1 or 2 Children | 6 (4.8%) | 0 (0.0%) |
| 3 or 4 Children | 0 (0.0%) | 0 (0.0%) |
| 5 or more Children | 0 (0.0%) | 0 (0.0%) |
| Total | 19 (3.5%) | 0 (0.0%) |
Race in Montague
The most populous races in Montague are White / Caucasian (2,363 | 94.0%), Hispanic or Latino (209 | 8.3%), and Two or more Races (121 | 4.8%).
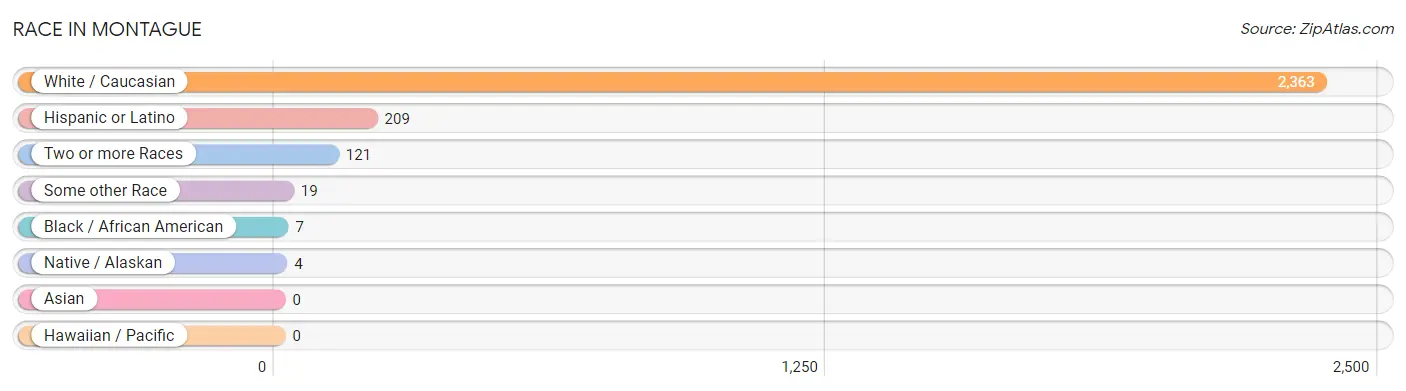
| Race | # Population | % Population |
| Asian | 0 | 0.0% |
| Black / African American | 7 | 0.3% |
| Hawaiian / Pacific | 0 | 0.0% |
| Hispanic or Latino | 209 | 8.3% |
| Native / Alaskan | 4 | 0.2% |
| White / Caucasian | 2,363 | 94.0% |
| Two or more Races | 121 | 4.8% |
| Some other Race | 19 | 0.8% |
| Total | 2,514 | 100.0% |
Ancestry in Montague
The most populous ancestries reported in Montague are Dutch (542 | 21.6%), German (519 | 20.6%), English (451 | 17.9%), Irish (192 | 7.6%), and Swedish (163 | 6.5%), together accounting for 74.3% of all Montague residents.
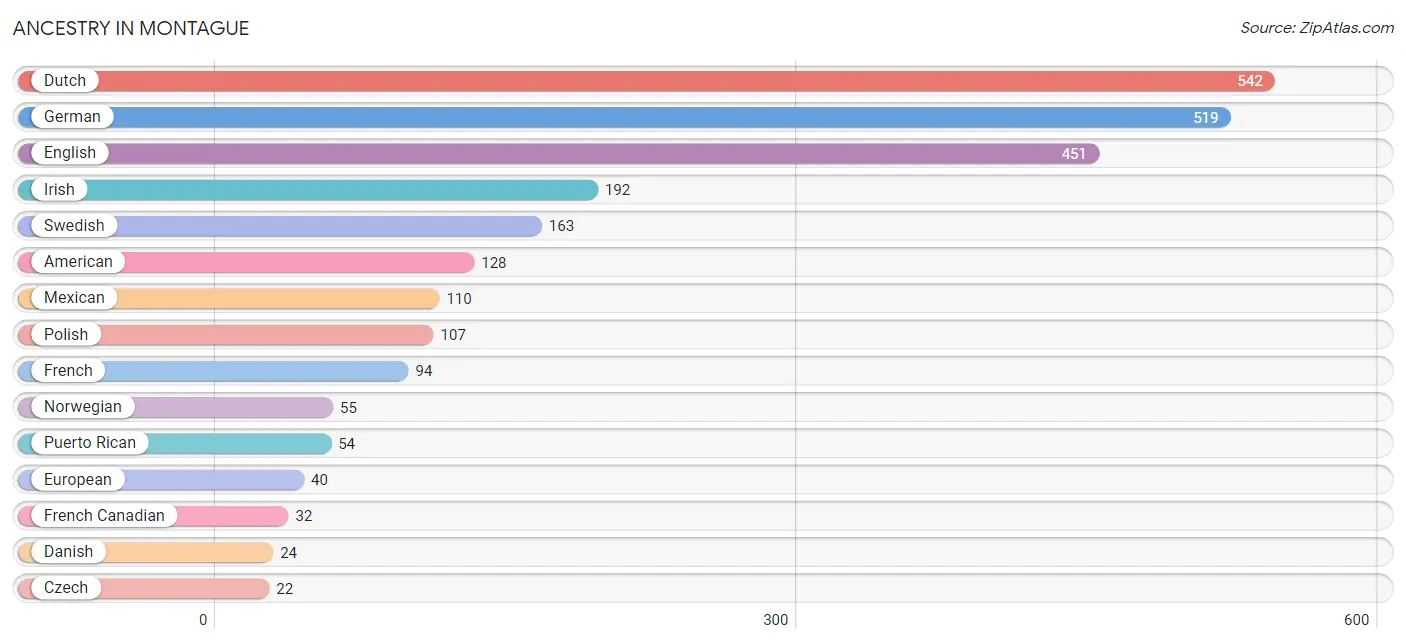
| Ancestry | # Population | % Population |
| American | 128 | 5.1% |
| Burmese | 17 | 0.7% |
| Canadian | 5 | 0.2% |
| Celtic | 3 | 0.1% |
| Cherokee | 7 | 0.3% |
| Chippewa | 20 | 0.8% |
| Czech | 22 | 0.9% |
| Czechoslovakian | 5 | 0.2% |
| Danish | 24 | 0.9% |
| Dutch | 542 | 21.6% |
| English | 451 | 17.9% |
| European | 40 | 1.6% |
| Finnish | 15 | 0.6% |
| French | 94 | 3.7% |
| French Canadian | 32 | 1.3% |
| German | 519 | 20.6% |
| Irish | 192 | 7.6% |
| Italian | 21 | 0.8% |
| Mexican | 110 | 4.4% |
| Northern European | 9 | 0.4% |
| Norwegian | 55 | 2.2% |
| Ottawa | 8 | 0.3% |
| Pima | 4 | 0.2% |
| Polish | 107 | 4.3% |
| Puerto Rican | 54 | 2.1% |
| Russian | 4 | 0.2% |
| Scandinavian | 15 | 0.6% |
| Scotch-Irish | 11 | 0.4% |
| Scottish | 18 | 0.7% |
| Slovak | 4 | 0.2% |
| Swedish | 163 | 6.5% |
| Welsh | 4 | 0.2% | View All 32 Rows |
Immigrants in Montague
The most numerous immigrant groups reported in Montague came from Canada (8 | 0.3%), Europe (8 | 0.3%), Austria (4 | 0.2%), Eastern Europe (4 | 0.2%), and Poland (4 | 0.2%), together accounting for 1.1% of all Montague residents.
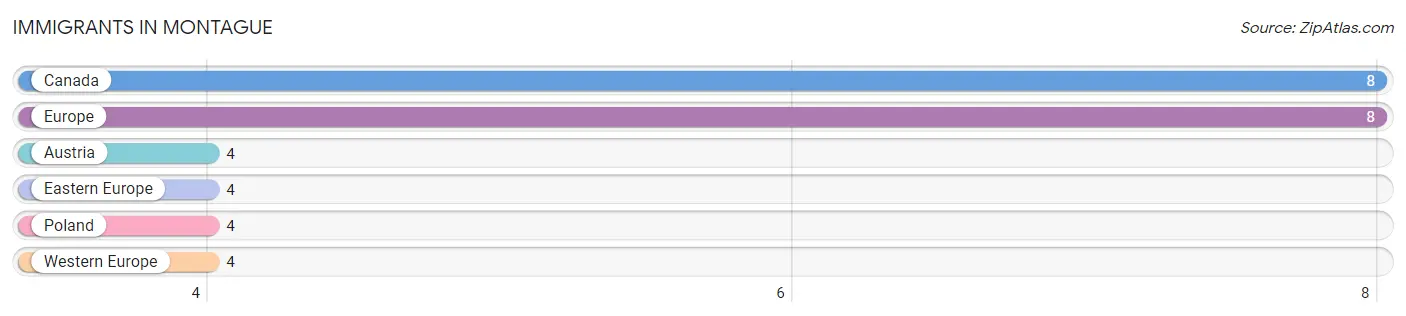
| Immigration Origin | # Population | % Population |
| Austria | 4 | 0.2% |
| Canada | 8 | 0.3% |
| Eastern Europe | 4 | 0.2% |
| Europe | 8 | 0.3% |
| Poland | 4 | 0.2% |
| Western Europe | 4 | 0.2% | View All 6 Rows |
Sex and Age in Montague
Sex and Age in Montague
The most populous age groups in Montague are 5 to 9 Years (143 | 11.9%) for men and 5 to 9 Years (199 | 15.1%) for women.
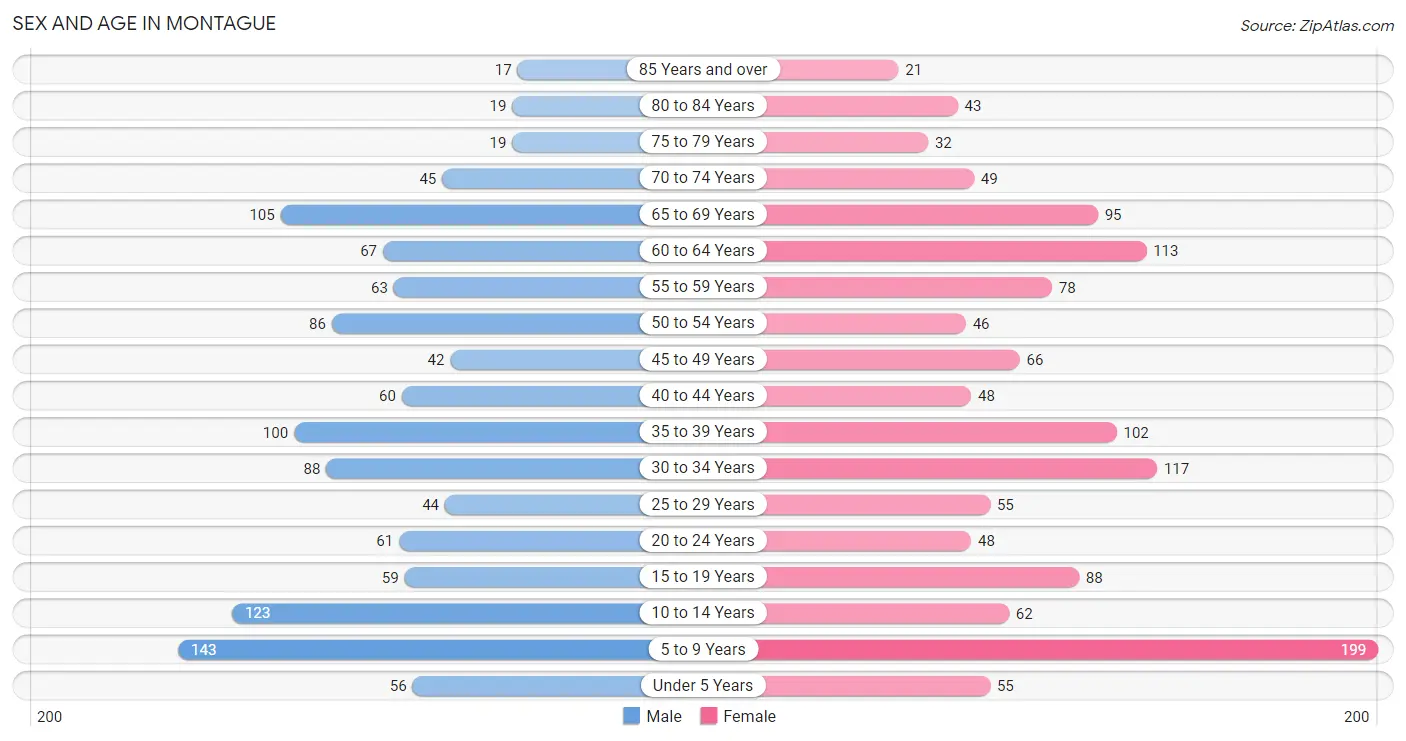
| Age Bracket | Male | Female |
| Under 5 Years | 56 (4.7%) | 55 (4.2%) |
| 5 to 9 Years | 143 (11.9%) | 199 (15.1%) |
| 10 to 14 Years | 123 (10.3%) | 62 (4.7%) |
| 15 to 19 Years | 59 (4.9%) | 88 (6.7%) |
| 20 to 24 Years | 61 (5.1%) | 48 (3.6%) |
| 25 to 29 Years | 44 (3.7%) | 55 (4.2%) |
| 30 to 34 Years | 88 (7.3%) | 117 (8.9%) |
| 35 to 39 Years | 100 (8.4%) | 102 (7.7%) |
| 40 to 44 Years | 60 (5.0%) | 48 (3.6%) |
| 45 to 49 Years | 42 (3.5%) | 66 (5.0%) |
| 50 to 54 Years | 86 (7.2%) | 46 (3.5%) |
| 55 to 59 Years | 63 (5.3%) | 78 (5.9%) |
| 60 to 64 Years | 67 (5.6%) | 113 (8.6%) |
| 65 to 69 Years | 105 (8.8%) | 95 (7.2%) |
| 70 to 74 Years | 45 (3.8%) | 49 (3.7%) |
| 75 to 79 Years | 19 (1.6%) | 32 (2.4%) |
| 80 to 84 Years | 19 (1.6%) | 43 (3.3%) |
| 85 Years and over | 17 (1.4%) | 21 (1.6%) |
| Total | 1,197 (100.0%) | 1,317 (100.0%) |
Families and Households in Montague
Median Family Size in Montague
The median family size in Montague is 3.11 persons per family, with married-couple families (535 | 78.9%) accounting for the largest median family size of 3.18 persons per family. On the other hand, single female/mother families (95 | 14.0%) represent the smallest median family size with 2.73 persons per family.
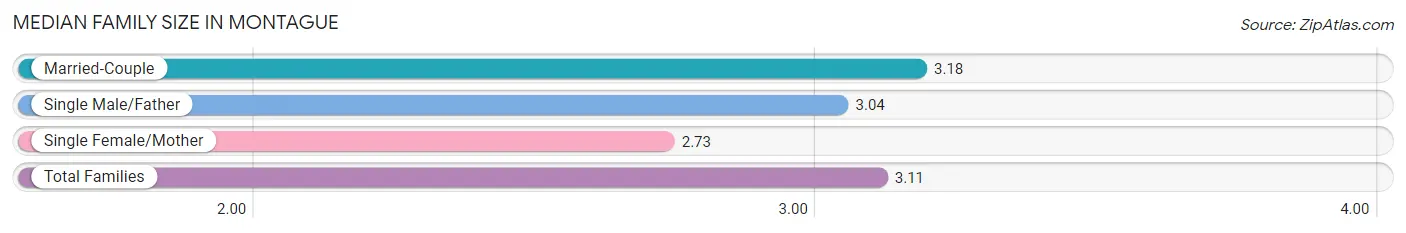
| Family Type | # Families | Family Size |
| Married-Couple | 535 (78.9%) | 3.18 |
| Single Male/Father | 48 (7.1%) | 3.04 |
| Single Female/Mother | 95 (14.0%) | 2.73 |
| Total Families | 678 (100.0%) | 3.11 |
Median Household Size in Montague
The median household size in Montague is 2.54 persons per household, with single male/father households (48 | 4.9%) accounting for the largest median household size of 3.46 persons per household. non-family households (306 | 31.1%) represent the smallest median household size with 1.14 persons per household.
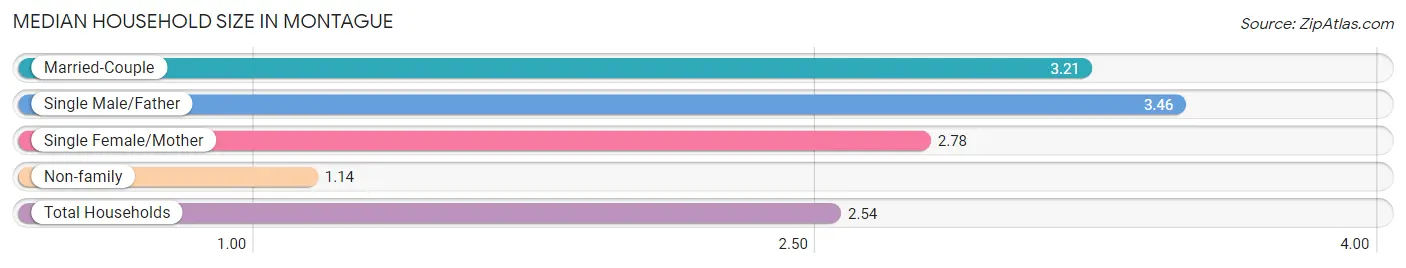
| Household Type | # Households | Household Size |
| Married-Couple | 535 (54.4%) | 3.21 |
| Single Male/Father | 48 (4.9%) | 3.46 |
| Single Female/Mother | 95 (9.7%) | 2.78 |
| Non-family | 306 (31.1%) | 1.14 |
| Total Households | 984 (100.0%) | 2.54 |
Household Size by Marriage Status in Montague
Out of a total of 984 households in Montague, 678 (68.9%) are family households, while 306 (31.1%) are nonfamily households. The most numerous type of family households are 2-person households, comprising 269, and the most common type of nonfamily households are 1-person households, comprising 270.
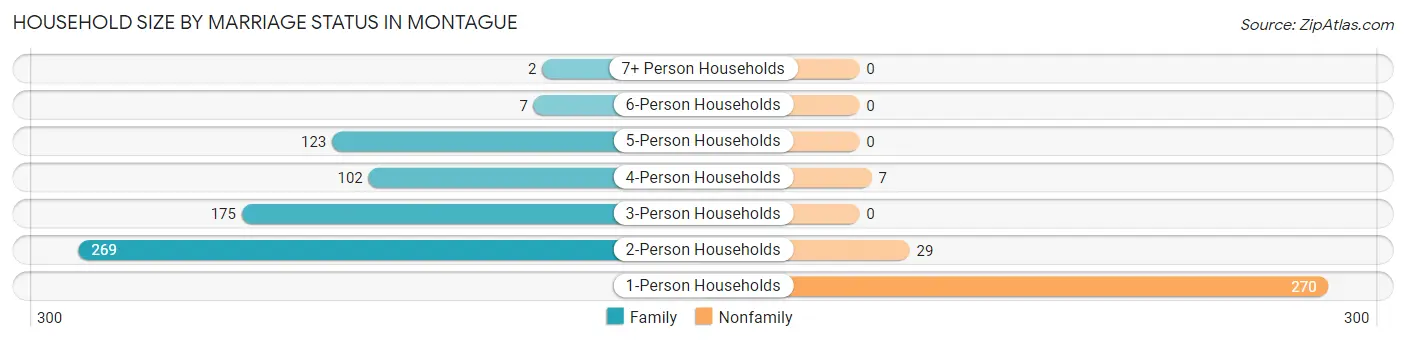
| Household Size | Family Households | Nonfamily Households |
| 1-Person Households | - | 270 (27.4%) |
| 2-Person Households | 269 (27.3%) | 29 (2.9%) |
| 3-Person Households | 175 (17.8%) | 0 (0.0%) |
| 4-Person Households | 102 (10.4%) | 7 (0.7%) |
| 5-Person Households | 123 (12.5%) | 0 (0.0%) |
| 6-Person Households | 7 (0.7%) | 0 (0.0%) |
| 7+ Person Households | 2 (0.2%) | 0 (0.0%) |
| Total | 678 (68.9%) | 306 (31.1%) |
Female Fertility in Montague
Fertility by Age in Montague
Average fertility rate in Montague is 21.0 births per 1,000 women. Women in the age bracket of 20 to 34 years have the highest fertility rate with 32.0 births per 1,000 women. Women in the age bracket of 20 to 34 years acount for 63.6% of all women with births.
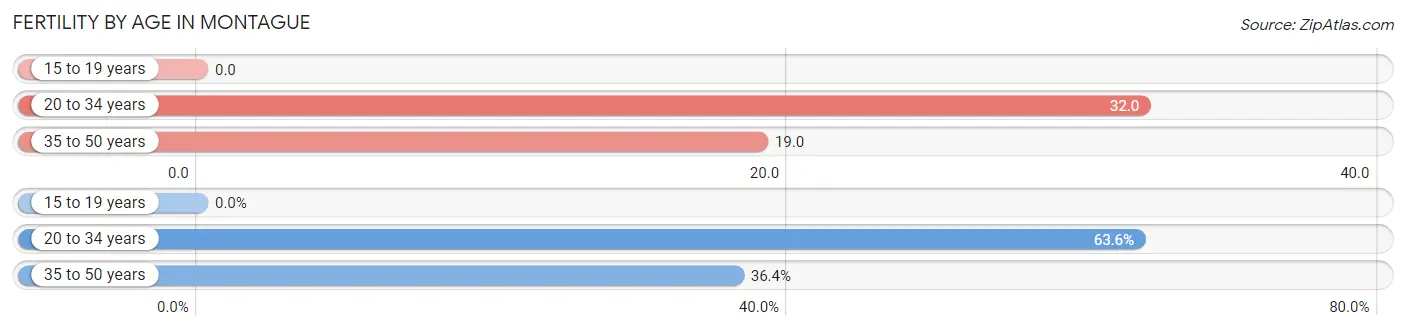
| Age Bracket | Women with Births | Births / 1,000 Women |
| 15 to 19 years | 0 (0.0%) | 0.0 |
| 20 to 34 years | 7 (63.6%) | 32.0 |
| 35 to 50 years | 4 (36.4%) | 19.0 |
| Total | 11 (100.0%) | 21.0 |
Fertility by Age by Marriage Status in Montague
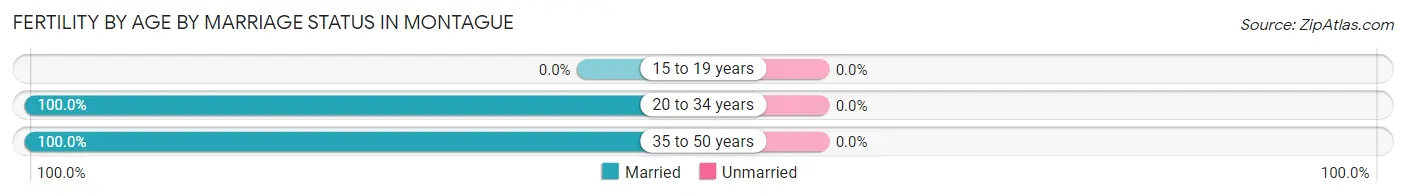
| Age Bracket | Married | Unmarried |
| 15 to 19 years | 0 (0.0%) | 0 (0.0%) |
| 20 to 34 years | 7 (100.0%) | 0 (0.0%) |
| 35 to 50 years | 4 (100.0%) | 0 (0.0%) |
| Total | 11 (100.0%) | 0 (0.0%) |
Fertility by Education in Montague
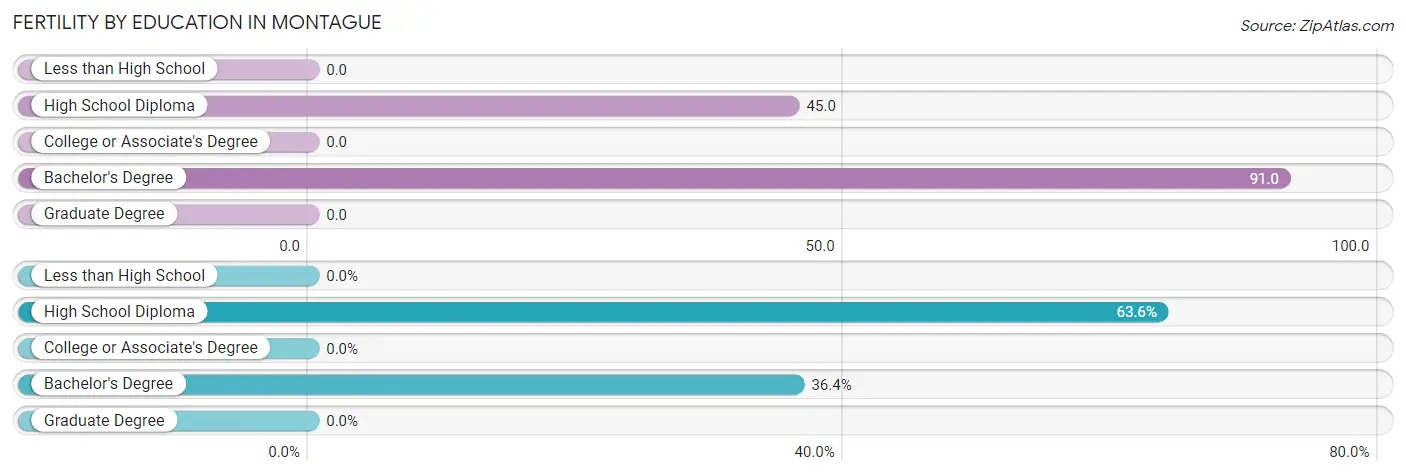
| Educational Attainment | Women with Births | Births / 1,000 Women |
| Less than High School | 0 (0.0%) | 0.0 |
| High School Diploma | 7 (63.6%) | 45.0 |
| College or Associate's Degree | 0 (0.0%) | 0.0 |
| Bachelor's Degree | 4 (36.4%) | 91.0 |
| Graduate Degree | 0 (0.0%) | 0.0 |
| Total | 11 (100.0%) | 21.0 |
Fertility by Education by Marriage Status in Montague
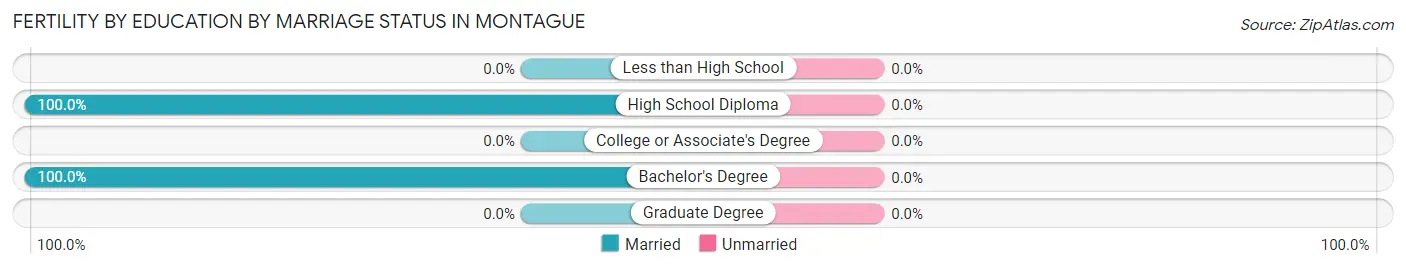
| Educational Attainment | Married | Unmarried |
| Less than High School | 0 (0.0%) | 0 (0.0%) |
| High School Diploma | 7 (100.0%) | 0 (0.0%) |
| College or Associate's Degree | 0 (0.0%) | 0 (0.0%) |
| Bachelor's Degree | 4 (100.0%) | 0 (0.0%) |
| Graduate Degree | 0 (0.0%) | 0 (0.0%) |
| Total | 11 (100.0%) | 0 (0.0%) |
Employment Characteristics in Montague
Employment by Class of Employer in Montague
Among the 1,133 employed individuals in Montague, private company employees (670 | 59.1%), self-employed (not incorporated) (144 | 12.7%), and not-for-profit organizations (134 | 11.8%) make up the most common classes of employment.
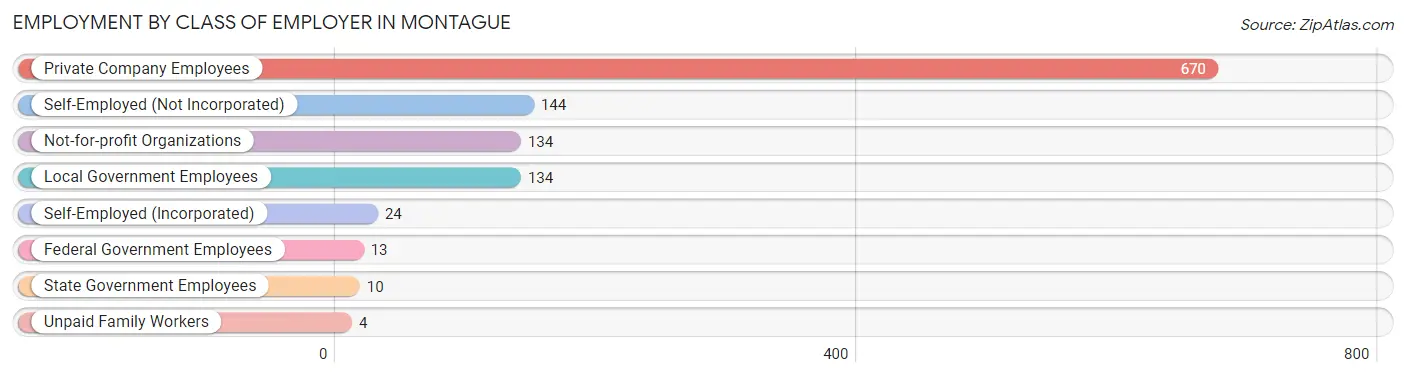
| Employer Class | # Employees | % Employees |
| Private Company Employees | 670 | 59.1% |
| Self-Employed (Incorporated) | 24 | 2.1% |
| Self-Employed (Not Incorporated) | 144 | 12.7% |
| Not-for-profit Organizations | 134 | 11.8% |
| Local Government Employees | 134 | 11.8% |
| State Government Employees | 10 | 0.9% |
| Federal Government Employees | 13 | 1.1% |
| Unpaid Family Workers | 4 | 0.4% |
| Total | 1,133 | 100.0% |
Employment Status by Age in Montague
According to the labor force statistics for Montague, out of the total population over 16 years of age (1,832), 63.3% or 1,160 individuals are in the labor force, with 1.7% or 20 of them unemployed. The age group with the highest labor force participation rate is 30 to 34 years, with 100.0% or 205 individuals in the labor force. Within the labor force, the 60 to 64 years age range has the highest percentage of unemployed individuals, with 6.3% or 5 of them being unemployed.
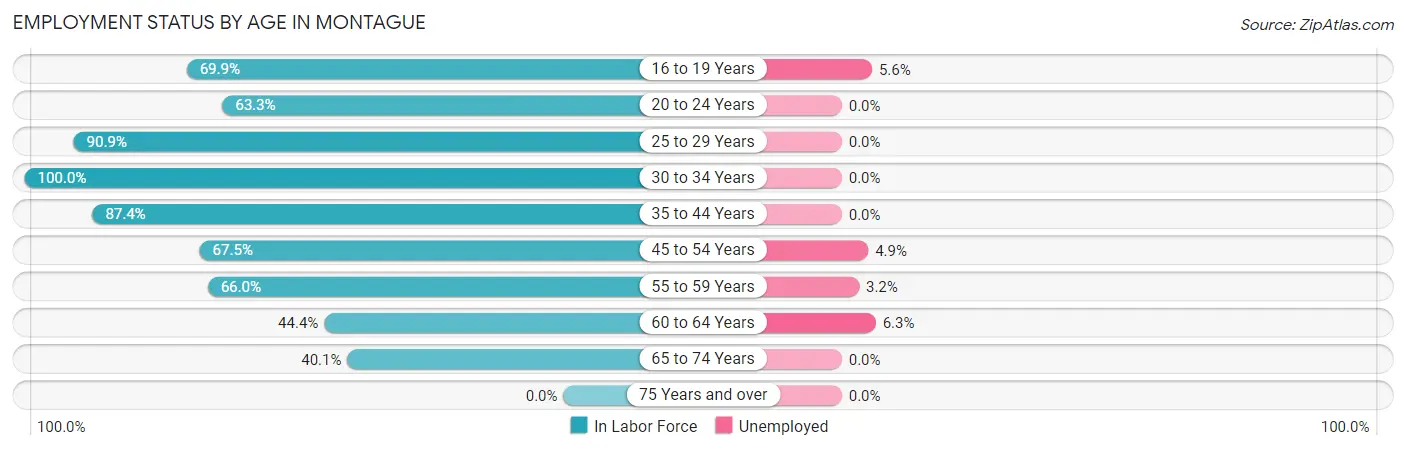
| Age Bracket | In Labor Force | Unemployed |
| 16 to 19 Years | 72 (69.9%) | 4 (5.6%) |
| 20 to 24 Years | 69 (63.3%) | 0 (0.0%) |
| 25 to 29 Years | 90 (90.9%) | 0 (0.0%) |
| 30 to 34 Years | 205 (100.0%) | 0 (0.0%) |
| 35 to 44 Years | 271 (87.4%) | 0 (0.0%) |
| 45 to 54 Years | 162 (67.5%) | 8 (4.9%) |
| 55 to 59 Years | 93 (66.0%) | 3 (3.2%) |
| 60 to 64 Years | 80 (44.4%) | 5 (6.3%) |
| 65 to 74 Years | 118 (40.1%) | 0 (0.0%) |
| 75 Years and over | 0 (0.0%) | 0 (0.0%) |
| Total | 1,160 (63.3%) | 20 (1.7%) |
Employment Status by Educational Attainment in Montague
According to labor force statistics for Montague, 76.7% of individuals (901) out of the total population between 25 and 64 years of age (1,175) are in the labor force, with 1.8% or 16 of them being unemployed. The group with the highest labor force participation rate are those with the educational attainment of college / associate degree, with 83.2% or 515 individuals in the labor force. Within the labor force, individuals with bachelor's degree or higher education have the highest percentage of unemployment, with 5.1% or 7 of them being unemployed.
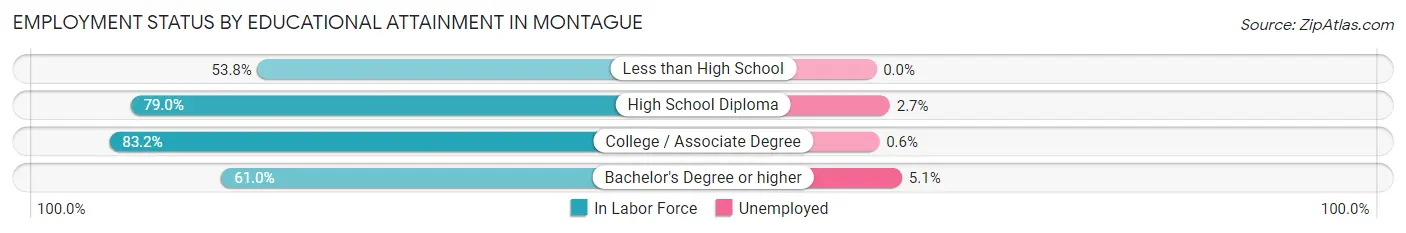
| Educational Attainment | In Labor Force | Unemployed |
| Less than High School | 28 (53.8%) | 0 (0.0%) |
| High School Diploma | 222 (79.0%) | 8 (2.7%) |
| College / Associate Degree | 515 (83.2%) | 4 (0.6%) |
| Bachelor's Degree or higher | 136 (61.0%) | 11 (5.1%) |
| Total | 901 (76.7%) | 21 (1.8%) |
Employment Occupations by Sex in Montague
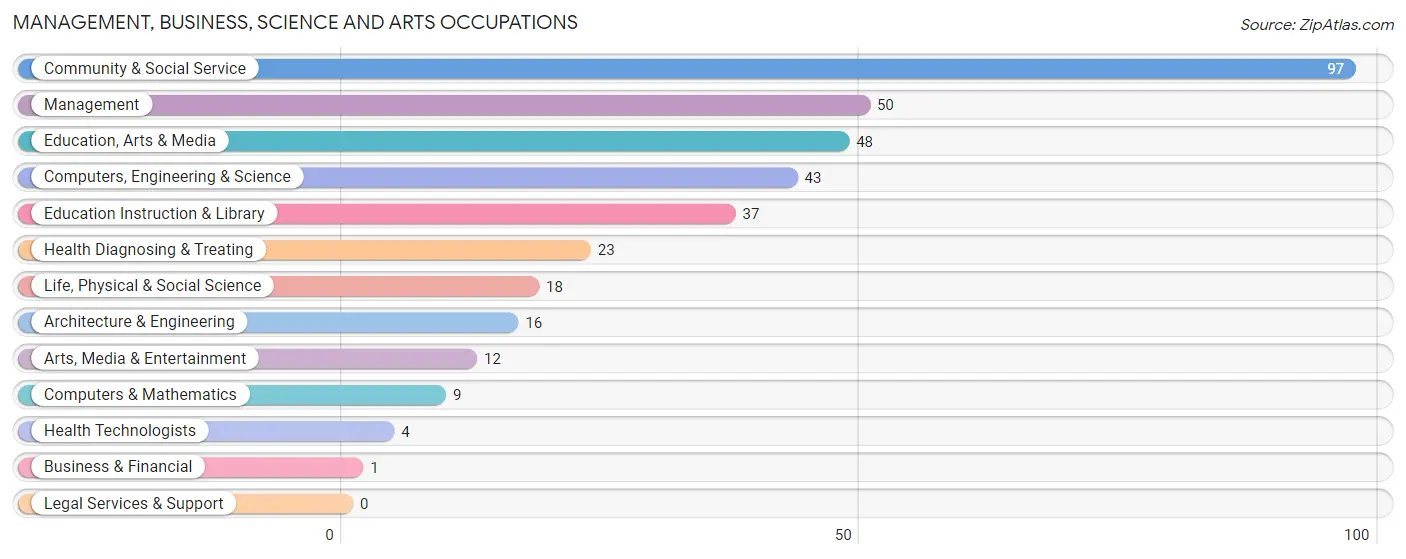
Management, Business, Science and Arts Occupations
The most common Management, Business, Science and Arts occupations in Montague are Community & Social Service (97 | 8.6%), Management (50 | 4.4%), Education, Arts & Media (48 | 4.2%), Computers, Engineering & Science (43 | 3.8%), and Education Instruction & Library (37 | 3.3%).
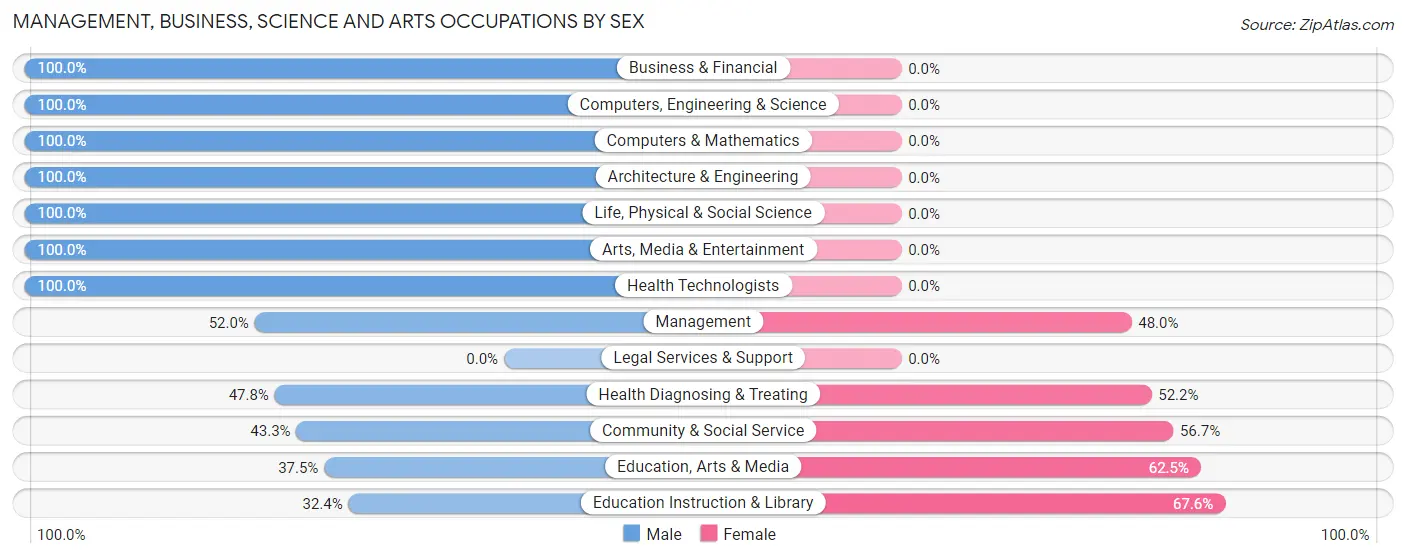
Management, Business, Science and Arts Occupations by Sex
Within the Management, Business, Science and Arts occupations in Montague, the most male-oriented occupations are Business & Financial (100.0%), Computers, Engineering & Science (100.0%), and Computers & Mathematics (100.0%), while the most female-oriented occupations are Education Instruction & Library (67.6%), Education, Arts & Media (62.5%), and Community & Social Service (56.7%).
| Occupation | Male | Female |
| Management | 26 (52.0%) | 24 (48.0%) |
| Business & Financial | 1 (100.0%) | 0 (0.0%) |
| Computers, Engineering & Science | 43 (100.0%) | 0 (0.0%) |
| Computers & Mathematics | 9 (100.0%) | 0 (0.0%) |
| Architecture & Engineering | 16 (100.0%) | 0 (0.0%) |
| Life, Physical & Social Science | 18 (100.0%) | 0 (0.0%) |
| Community & Social Service | 42 (43.3%) | 55 (56.7%) |
| Education, Arts & Media | 18 (37.5%) | 30 (62.5%) |
| Legal Services & Support | 0 (0.0%) | 0 (0.0%) |
| Education Instruction & Library | 12 (32.4%) | 25 (67.6%) |
| Arts, Media & Entertainment | 12 (100.0%) | 0 (0.0%) |
| Health Diagnosing & Treating | 11 (47.8%) | 12 (52.2%) |
| Health Technologists | 4 (100.0%) | 0 (0.0%) |
| Total (Category) | 123 (57.5%) | 91 (42.5%) |
| Total (Overall) | 581 (51.2%) | 553 (48.8%) |
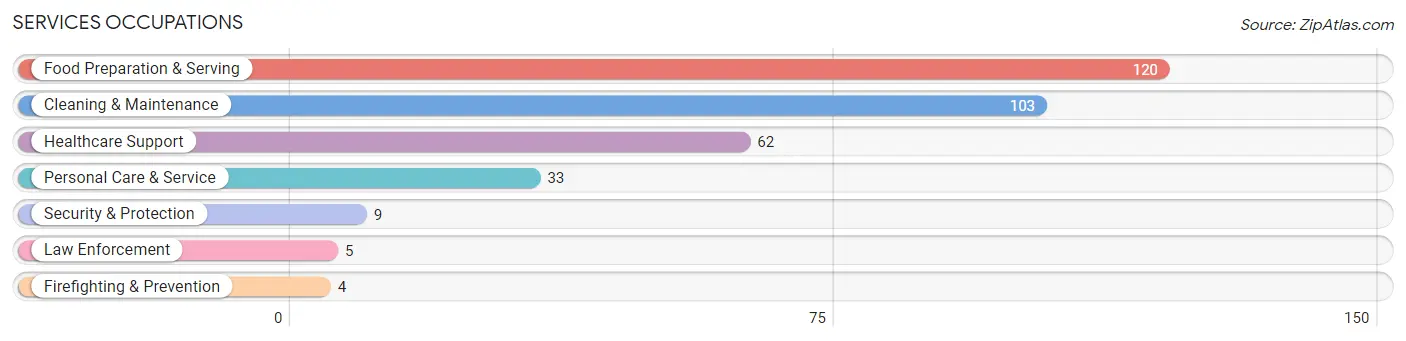
Services Occupations
The most common Services occupations in Montague are Food Preparation & Serving (120 | 10.6%), Cleaning & Maintenance (103 | 9.1%), Healthcare Support (62 | 5.5%), Personal Care & Service (33 | 2.9%), and Security & Protection (9 | 0.8%).
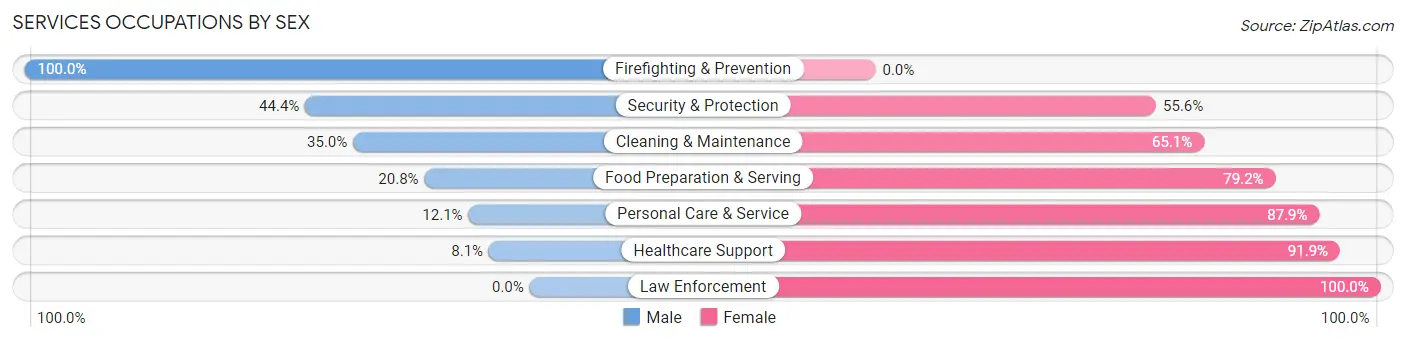
Services Occupations by Sex
Within the Services occupations in Montague, the most male-oriented occupations are Firefighting & Prevention (100.0%), Security & Protection (44.4%), and Cleaning & Maintenance (34.9%), while the most female-oriented occupations are Law Enforcement (100.0%), Healthcare Support (91.9%), and Personal Care & Service (87.9%).
| Occupation | Male | Female |
| Healthcare Support | 5 (8.1%) | 57 (91.9%) |
| Security & Protection | 4 (44.4%) | 5 (55.6%) |
| Firefighting & Prevention | 4 (100.0%) | 0 (0.0%) |
| Law Enforcement | 0 (0.0%) | 5 (100.0%) |
| Food Preparation & Serving | 25 (20.8%) | 95 (79.2%) |
| Cleaning & Maintenance | 36 (34.9%) | 67 (65.0%) |
| Personal Care & Service | 4 (12.1%) | 29 (87.9%) |
| Total (Category) | 74 (22.6%) | 253 (77.4%) |
| Total (Overall) | 581 (51.2%) | 553 (48.8%) |
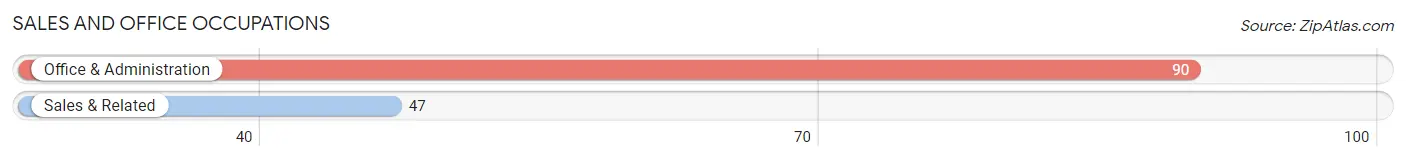
Sales and Office Occupations
The most common Sales and Office occupations in Montague are Office & Administration (90 | 7.9%), and Sales & Related (47 | 4.1%).
Sales and Office Occupations by Sex
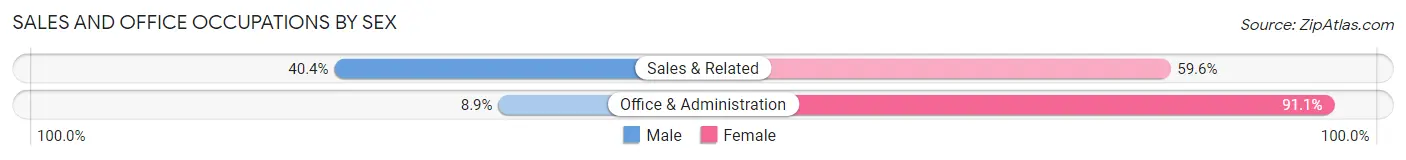
| Occupation | Male | Female |
| Sales & Related | 19 (40.4%) | 28 (59.6%) |
| Office & Administration | 8 (8.9%) | 82 (91.1%) |
| Total (Category) | 27 (19.7%) | 110 (80.3%) |
| Total (Overall) | 581 (51.2%) | 553 (48.8%) |
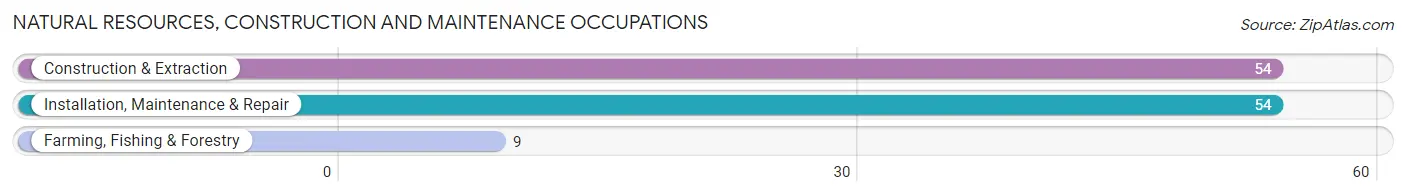
Natural Resources, Construction and Maintenance Occupations
The most common Natural Resources, Construction and Maintenance occupations in Montague are Construction & Extraction (54 | 4.8%), Installation, Maintenance & Repair (54 | 4.8%), and Farming, Fishing & Forestry (9 | 0.8%).
Natural Resources, Construction and Maintenance Occupations by Sex
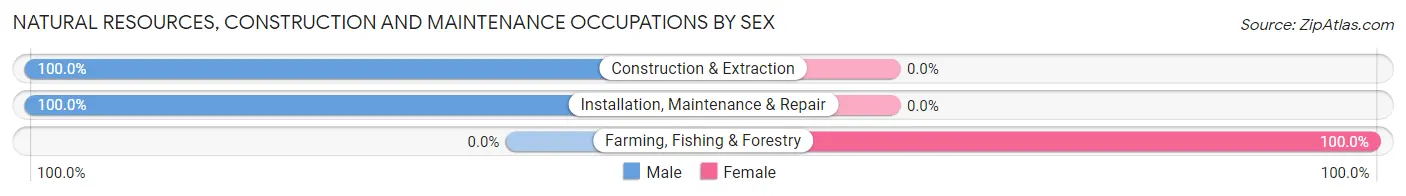
| Occupation | Male | Female |
| Farming, Fishing & Forestry | 0 (0.0%) | 9 (100.0%) |
| Construction & Extraction | 54 (100.0%) | 0 (0.0%) |
| Installation, Maintenance & Repair | 54 (100.0%) | 0 (0.0%) |
| Total (Category) | 108 (92.3%) | 9 (7.7%) |
| Total (Overall) | 581 (51.2%) | 553 (48.8%) |
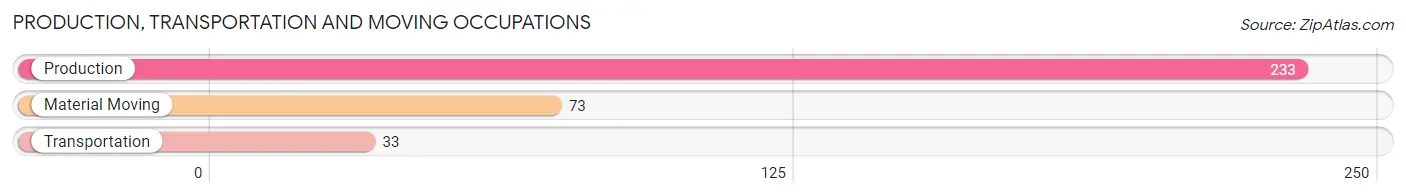
Production, Transportation and Moving Occupations
The most common Production, Transportation and Moving occupations in Montague are Production (233 | 20.5%), Material Moving (73 | 6.4%), and Transportation (33 | 2.9%).
Production, Transportation and Moving Occupations by Sex
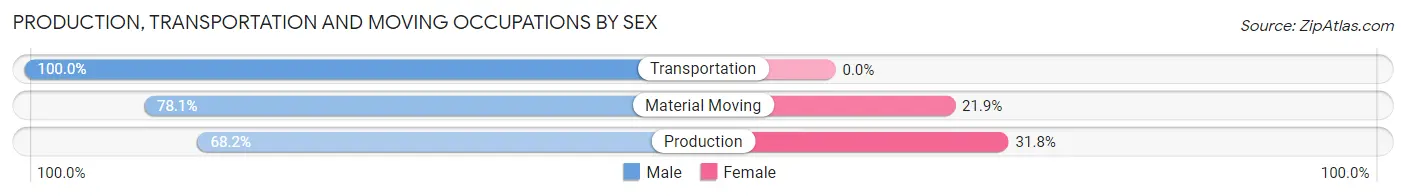
| Occupation | Male | Female |
| Production | 159 (68.2%) | 74 (31.8%) |
| Transportation | 33 (100.0%) | 0 (0.0%) |
| Material Moving | 57 (78.1%) | 16 (21.9%) |
| Total (Category) | 249 (73.5%) | 90 (26.6%) |
| Total (Overall) | 581 (51.2%) | 553 (48.8%) |
Employment Industries by Sex in Montague
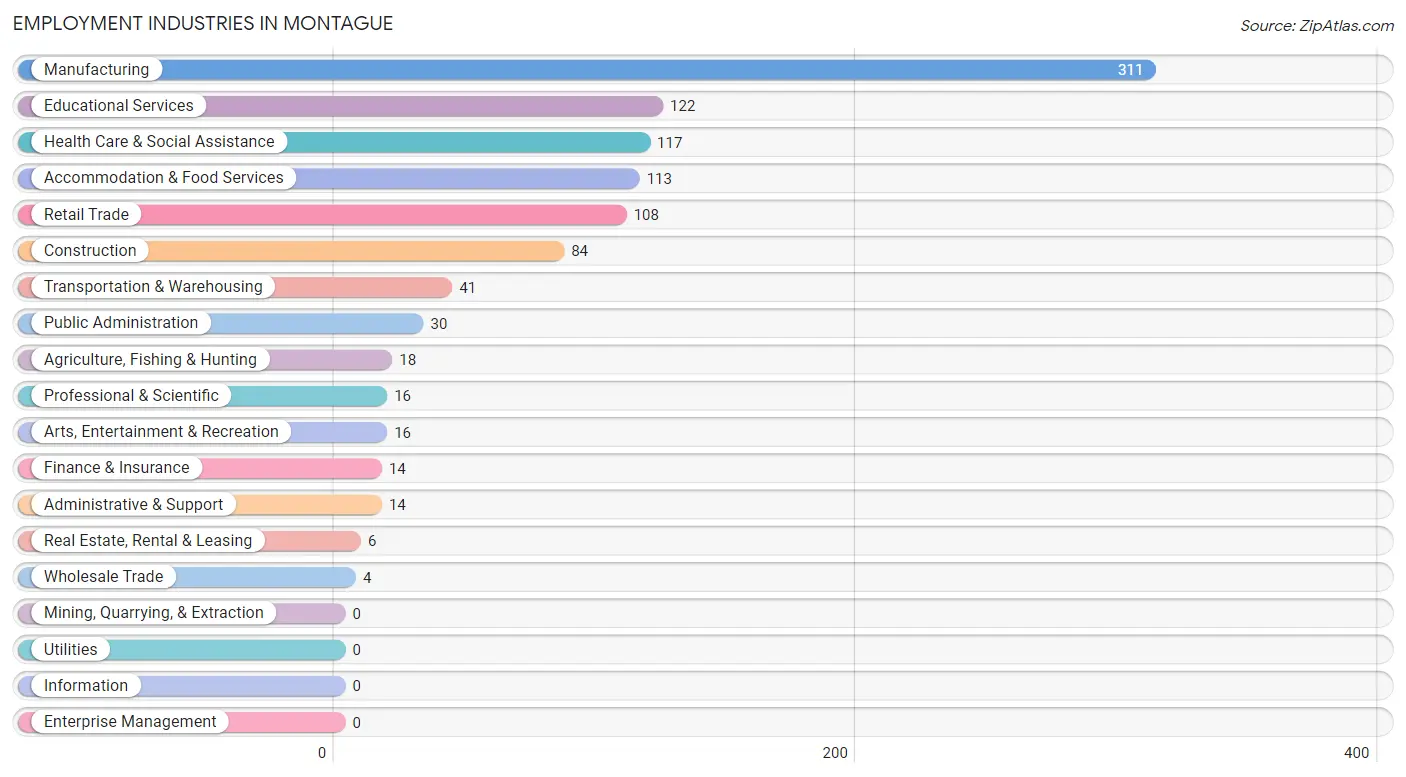
Employment Industries in Montague
The major employment industries in Montague include Manufacturing (311 | 27.4%), Educational Services (122 | 10.8%), Health Care & Social Assistance (117 | 10.3%), Accommodation & Food Services (113 | 10.0%), and Retail Trade (108 | 9.5%).
Employment Industries by Sex in Montague
The Montague industries that see more men than women are Wholesale Trade (100.0%), Arts, Entertainment & Recreation (100.0%), and Construction (89.3%), whereas the industries that tend to have a higher number of women are Finance & Insurance (100.0%), Real Estate, Rental & Leasing (100.0%), and Administrative & Support (100.0%).
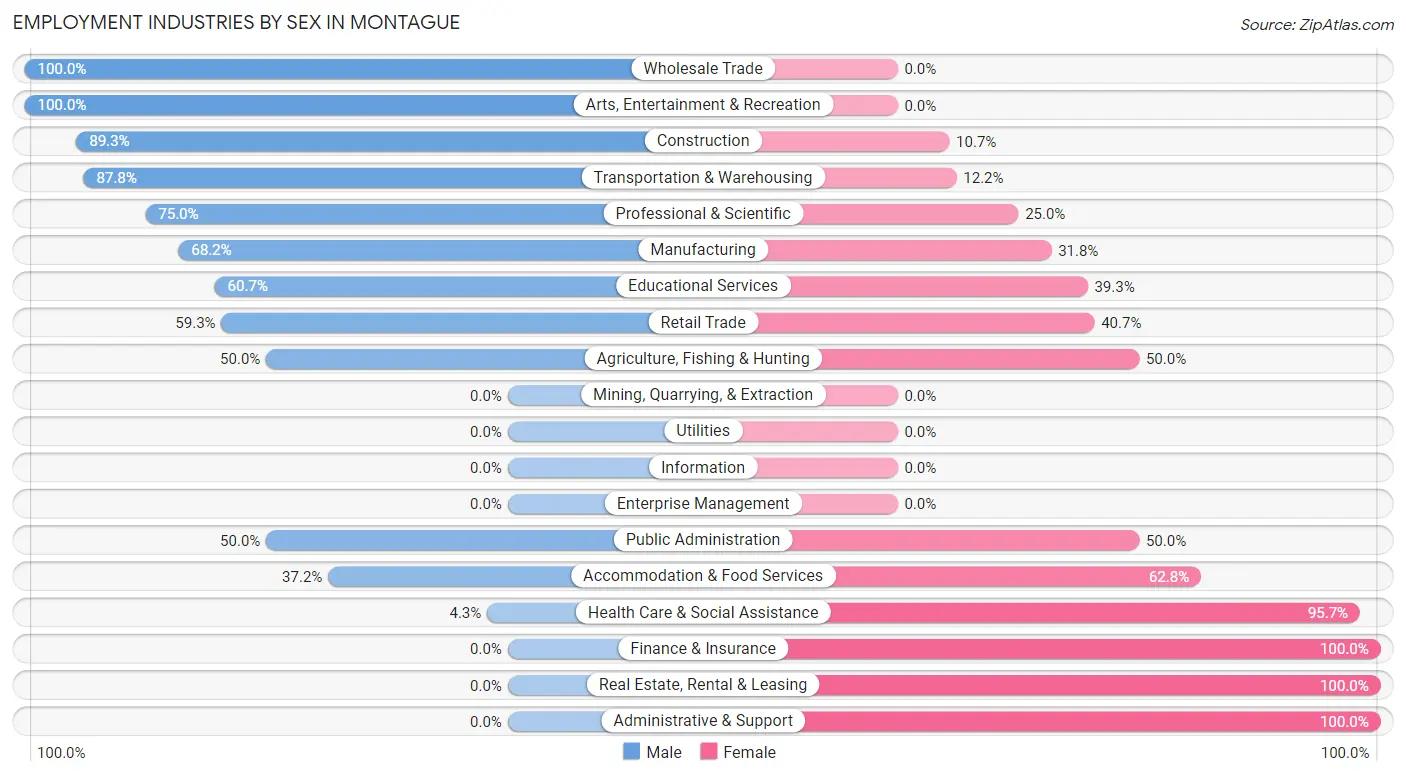
| Industry | Male | Female |
| Agriculture, Fishing & Hunting | 9 (50.0%) | 9 (50.0%) |
| Mining, Quarrying, & Extraction | 0 (0.0%) | 0 (0.0%) |
| Construction | 75 (89.3%) | 9 (10.7%) |
| Manufacturing | 212 (68.2%) | 99 (31.8%) |
| Wholesale Trade | 4 (100.0%) | 0 (0.0%) |
| Retail Trade | 64 (59.3%) | 44 (40.7%) |
| Transportation & Warehousing | 36 (87.8%) | 5 (12.2%) |
| Utilities | 0 (0.0%) | 0 (0.0%) |
| Information | 0 (0.0%) | 0 (0.0%) |
| Finance & Insurance | 0 (0.0%) | 14 (100.0%) |
| Real Estate, Rental & Leasing | 0 (0.0%) | 6 (100.0%) |
| Professional & Scientific | 12 (75.0%) | 4 (25.0%) |
| Enterprise Management | 0 (0.0%) | 0 (0.0%) |
| Administrative & Support | 0 (0.0%) | 14 (100.0%) |
| Educational Services | 74 (60.7%) | 48 (39.3%) |
| Health Care & Social Assistance | 5 (4.3%) | 112 (95.7%) |
| Arts, Entertainment & Recreation | 16 (100.0%) | 0 (0.0%) |
| Accommodation & Food Services | 42 (37.2%) | 71 (62.8%) |
| Public Administration | 15 (50.0%) | 15 (50.0%) |
| Total | 581 (51.2%) | 553 (48.8%) |
Education in Montague
School Enrollment in Montague
The most common levels of schooling among the 747 students in Montague are elementary school (270 | 36.1%), middle school (163 | 21.8%), and high school (154 | 20.6%).
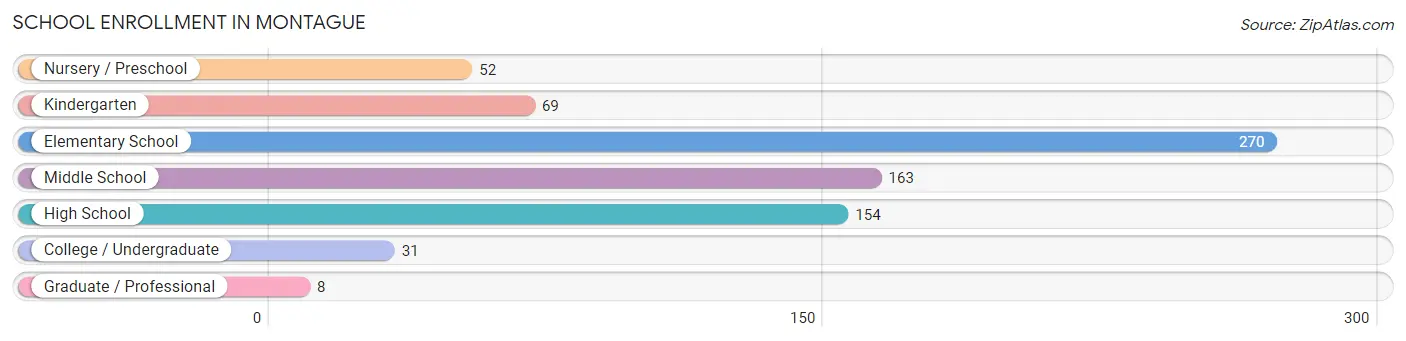
| School Level | # Students | % Students |
| Nursery / Preschool | 52 | 7.0% |
| Kindergarten | 69 | 9.2% |
| Elementary School | 270 | 36.1% |
| Middle School | 163 | 21.8% |
| High School | 154 | 20.6% |
| College / Undergraduate | 31 | 4.2% |
| Graduate / Professional | 8 | 1.1% |
| Total | 747 | 100.0% |
School Enrollment by Age by Funding Source in Montague
Out of a total of 747 students who are enrolled in schools in Montague, 45 (6.0%) attend a private institution, while the remaining 702 (94.0%) are enrolled in public schools. The age group of 3 to 4 year olds has the highest likelihood of being enrolled in private schools, with 19 (55.9% in the age bracket) enrolled. Conversely, the age group of 15 to 17 year olds has the lowest likelihood of being enrolled in a private school, with 130 (100.0% in the age bracket) attending a public institution.
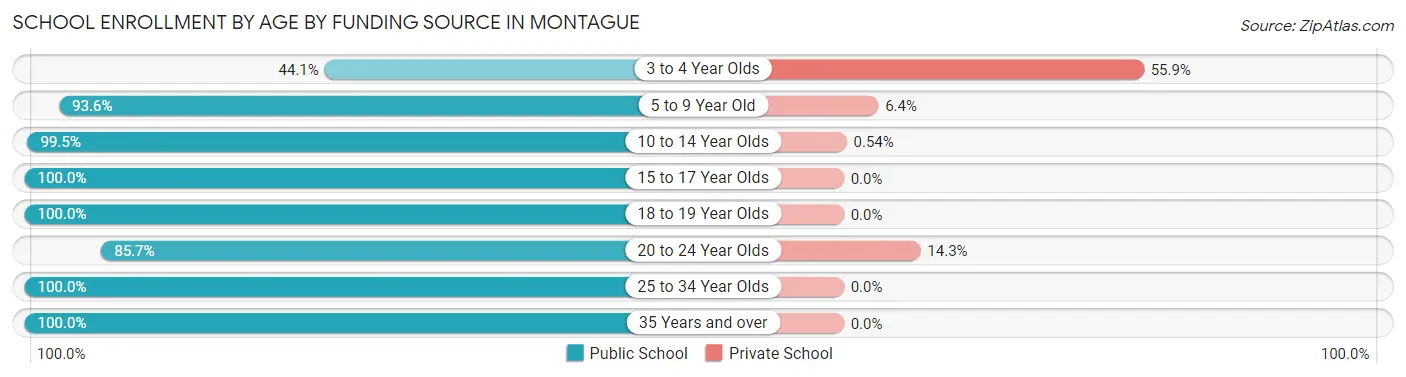
| Age Bracket | Public School | Private School |
| 3 to 4 Year Olds | 15 (44.1%) | 19 (55.9%) |
| 5 to 9 Year Old | 320 (93.6%) | 22 (6.4%) |
| 10 to 14 Year Olds | 184 (99.5%) | 1 (0.5%) |
| 15 to 17 Year Olds | 130 (100.0%) | 0 (0.0%) |
| 18 to 19 Year Olds | 17 (100.0%) | 0 (0.0%) |
| 20 to 24 Year Olds | 18 (85.7%) | 3 (14.3%) |
| 25 to 34 Year Olds | 2 (100.0%) | 0 (0.0%) |
| 35 Years and over | 16 (100.0%) | 0 (0.0%) |
| Total | 702 (94.0%) | 45 (6.0%) |
Educational Attainment by Field of Study in Montague
Education (104 | 29.6%), arts & humanities (47 | 13.4%), business (33 | 9.4%), science & technology (31 | 8.8%), and bio, nature & agricultural (30 | 8.6%) are the most common fields of study among 351 individuals in Montague who have obtained a bachelor's degree or higher.
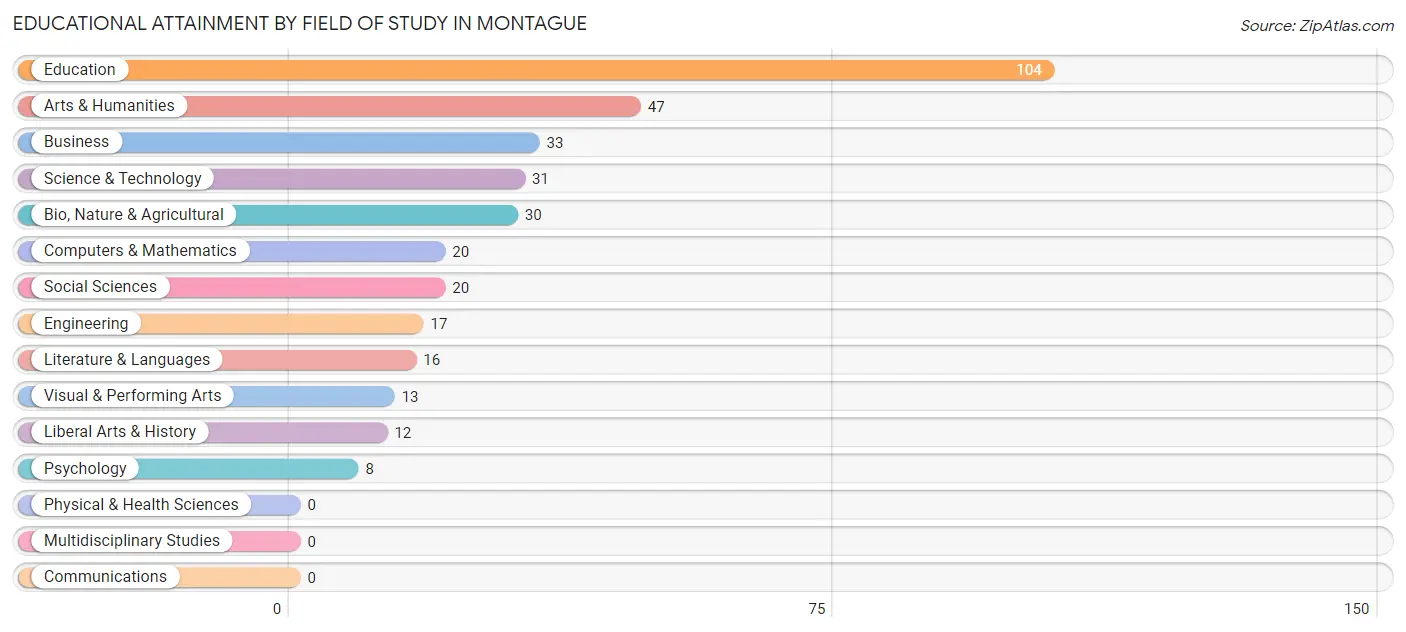
| Field of Study | # Graduates | % Graduates |
| Computers & Mathematics | 20 | 5.7% |
| Bio, Nature & Agricultural | 30 | 8.6% |
| Physical & Health Sciences | 0 | 0.0% |
| Psychology | 8 | 2.3% |
| Social Sciences | 20 | 5.7% |
| Engineering | 17 | 4.8% |
| Multidisciplinary Studies | 0 | 0.0% |
| Science & Technology | 31 | 8.8% |
| Business | 33 | 9.4% |
| Education | 104 | 29.6% |
| Literature & Languages | 16 | 4.6% |
| Liberal Arts & History | 12 | 3.4% |
| Visual & Performing Arts | 13 | 3.7% |
| Communications | 0 | 0.0% |
| Arts & Humanities | 47 | 13.4% |
| Total | 351 | 100.0% |
Transportation & Commute in Montague
Vehicle Availability by Sex in Montague
The most prevalent vehicle ownership categories in Montague are males with 2 vehicles (285, accounting for 49.0%) and females with 2 vehicles (275, making up 52.0%).
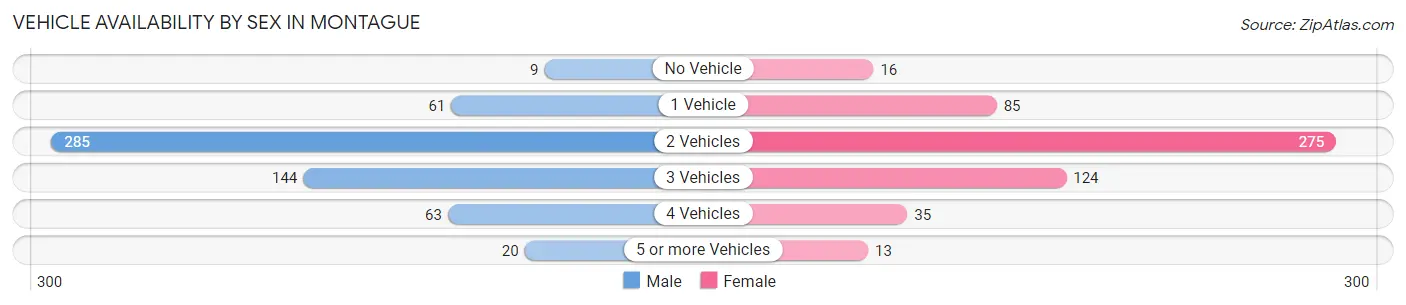
| Vehicles Available | Male | Female |
| No Vehicle | 9 (1.5%) | 16 (2.9%) |
| 1 Vehicle | 61 (10.5%) | 85 (15.5%) |
| 2 Vehicles | 285 (49.0%) | 275 (50.2%) |
| 3 Vehicles | 144 (24.7%) | 124 (22.6%) |
| 4 Vehicles | 63 (10.8%) | 35 (6.4%) |
| 5 or more Vehicles | 20 (3.4%) | 13 (2.4%) |
| Total | 582 (100.0%) | 548 (100.0%) |
Commute Time in Montague
The most frequently occuring commute durations in Montague are 10 to 14 minutes (237 commuters, 21.3%), less than 5 minutes (164 commuters, 14.8%), and 5 to 9 minutes (162 commuters, 14.6%).
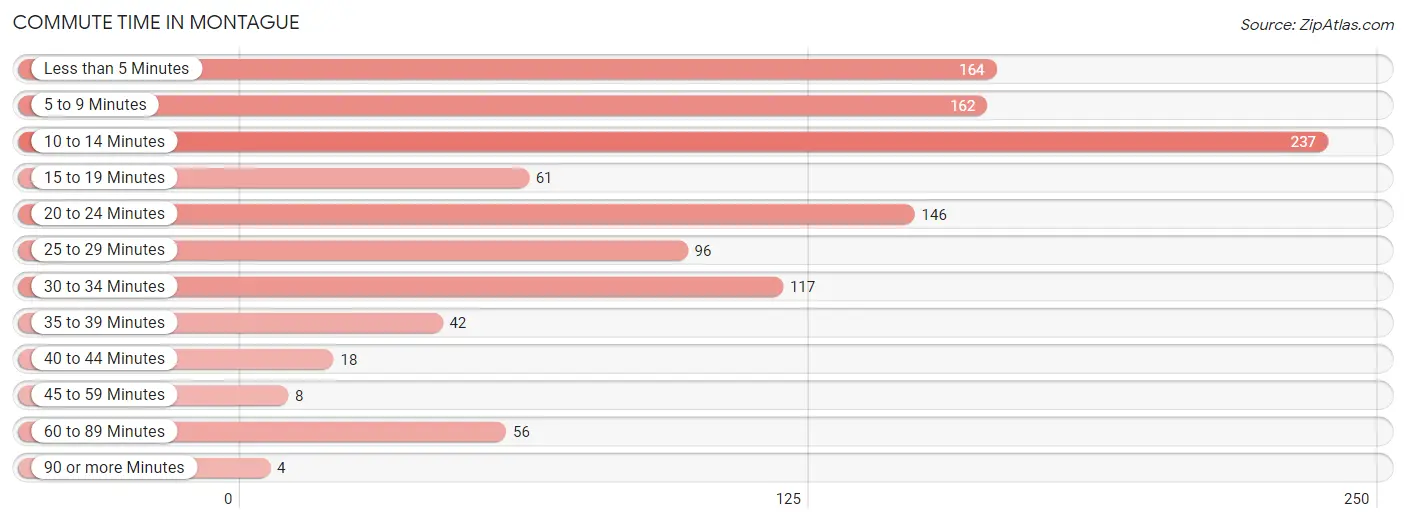
| Commute Time | # Commuters | % Commuters |
| Less than 5 Minutes | 164 | 14.8% |
| 5 to 9 Minutes | 162 | 14.6% |
| 10 to 14 Minutes | 237 | 21.3% |
| 15 to 19 Minutes | 61 | 5.5% |
| 20 to 24 Minutes | 146 | 13.1% |
| 25 to 29 Minutes | 96 | 8.6% |
| 30 to 34 Minutes | 117 | 10.5% |
| 35 to 39 Minutes | 42 | 3.8% |
| 40 to 44 Minutes | 18 | 1.6% |
| 45 to 59 Minutes | 8 | 0.7% |
| 60 to 89 Minutes | 56 | 5.0% |
| 90 or more Minutes | 4 | 0.4% |
Commute Time by Sex in Montague
The most common commute times in Montague are less than 5 minutes (136 commuters, 23.9%) for males and 10 to 14 minutes (135 commuters, 24.9%) for females.
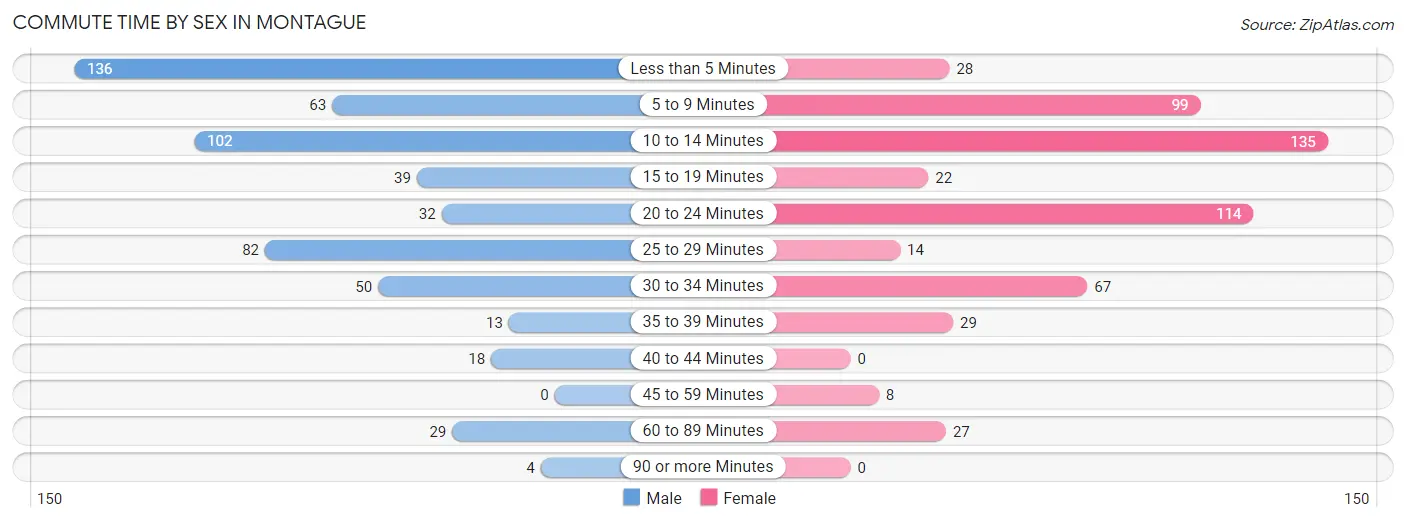
| Commute Time | Male | Female |
| Less than 5 Minutes | 136 (23.9%) | 28 (5.2%) |
| 5 to 9 Minutes | 63 (11.1%) | 99 (18.2%) |
| 10 to 14 Minutes | 102 (18.0%) | 135 (24.9%) |
| 15 to 19 Minutes | 39 (6.9%) | 22 (4.1%) |
| 20 to 24 Minutes | 32 (5.6%) | 114 (21.0%) |
| 25 to 29 Minutes | 82 (14.4%) | 14 (2.6%) |
| 30 to 34 Minutes | 50 (8.8%) | 67 (12.3%) |
| 35 to 39 Minutes | 13 (2.3%) | 29 (5.3%) |
| 40 to 44 Minutes | 18 (3.2%) | 0 (0.0%) |
| 45 to 59 Minutes | 0 (0.0%) | 8 (1.5%) |
| 60 to 89 Minutes | 29 (5.1%) | 27 (5.0%) |
| 90 or more Minutes | 4 (0.7%) | 0 (0.0%) |
Time of Departure to Work by Sex in Montague
The most frequent times of departure to work in Montague are 6:00 AM to 6:29 AM (130, 22.9%) for males and 7:00 AM to 7:29 AM (91, 16.8%) for females.
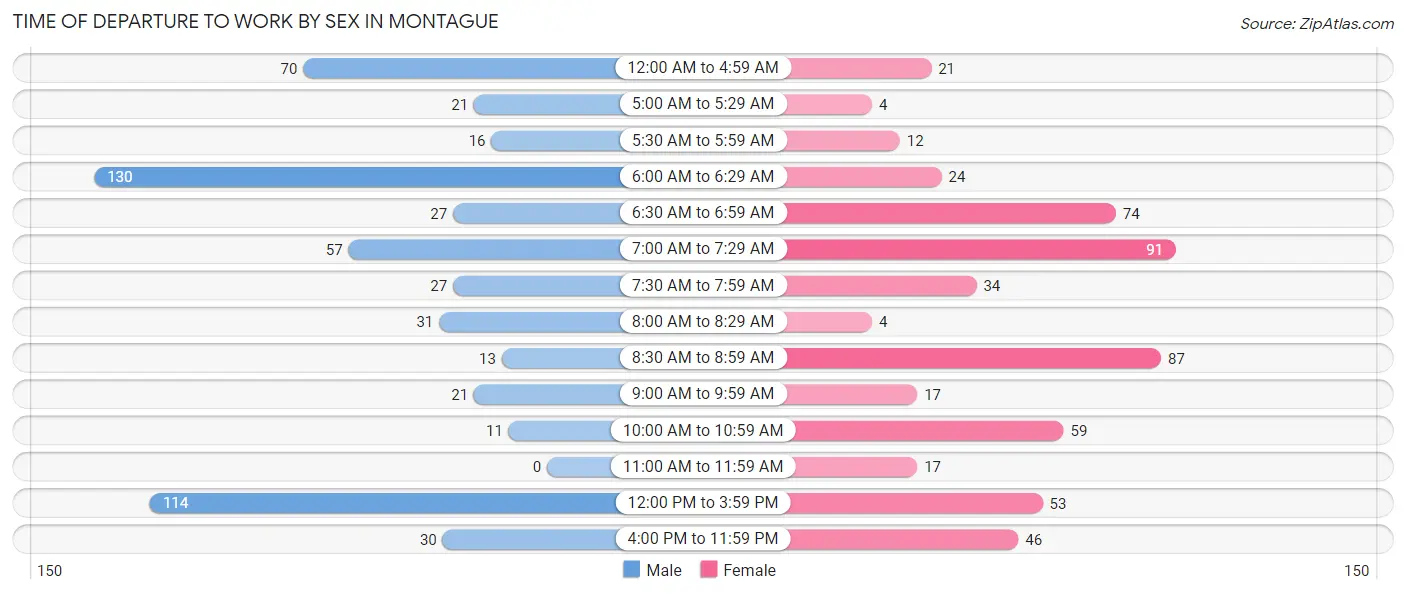
| Time of Departure | Male | Female |
| 12:00 AM to 4:59 AM | 70 (12.3%) | 21 (3.9%) |
| 5:00 AM to 5:29 AM | 21 (3.7%) | 4 (0.7%) |
| 5:30 AM to 5:59 AM | 16 (2.8%) | 12 (2.2%) |
| 6:00 AM to 6:29 AM | 130 (22.9%) | 24 (4.4%) |
| 6:30 AM to 6:59 AM | 27 (4.8%) | 74 (13.6%) |
| 7:00 AM to 7:29 AM | 57 (10.0%) | 91 (16.8%) |
| 7:30 AM to 7:59 AM | 27 (4.8%) | 34 (6.3%) |
| 8:00 AM to 8:29 AM | 31 (5.5%) | 4 (0.7%) |
| 8:30 AM to 8:59 AM | 13 (2.3%) | 87 (16.0%) |
| 9:00 AM to 9:59 AM | 21 (3.7%) | 17 (3.1%) |
| 10:00 AM to 10:59 AM | 11 (1.9%) | 59 (10.9%) |
| 11:00 AM to 11:59 AM | 0 (0.0%) | 17 (3.1%) |
| 12:00 PM to 3:59 PM | 114 (20.1%) | 53 (9.8%) |
| 4:00 PM to 11:59 PM | 30 (5.3%) | 46 (8.5%) |
| Total | 568 (100.0%) | 543 (100.0%) |
Housing Occupancy in Montague
Occupancy by Ownership in Montague
Of the total 984 dwellings in Montague, owner-occupied units account for 753 (76.5%), while renter-occupied units make up 231 (23.5%).
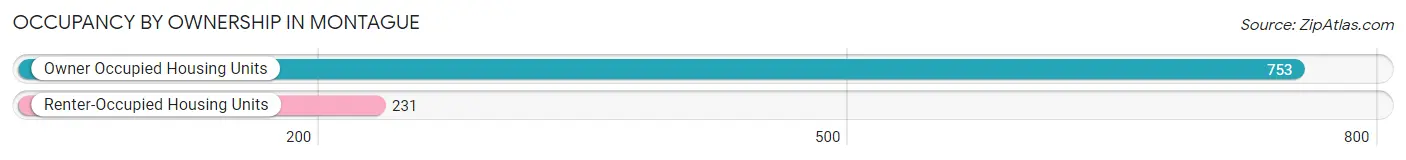
| Occupancy | # Housing Units | % Housing Units |
| Owner Occupied Housing Units | 753 | 76.5% |
| Renter-Occupied Housing Units | 231 | 23.5% |
| Total Occupied Housing Units | 984 | 100.0% |
Occupancy by Household Size in Montague
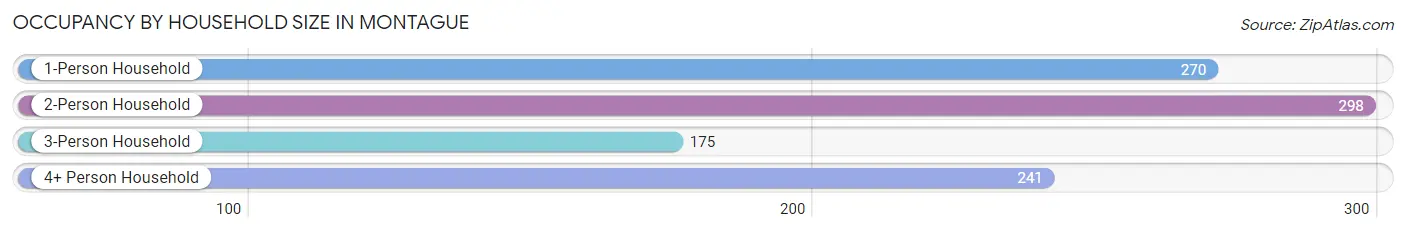
| Household Size | # Housing Units | % Housing Units |
| 1-Person Household | 270 | 27.4% |
| 2-Person Household | 298 | 30.3% |
| 3-Person Household | 175 | 17.8% |
| 4+ Person Household | 241 | 24.5% |
| Total Housing Units | 984 | 100.0% |
Occupancy by Ownership by Household Size in Montague
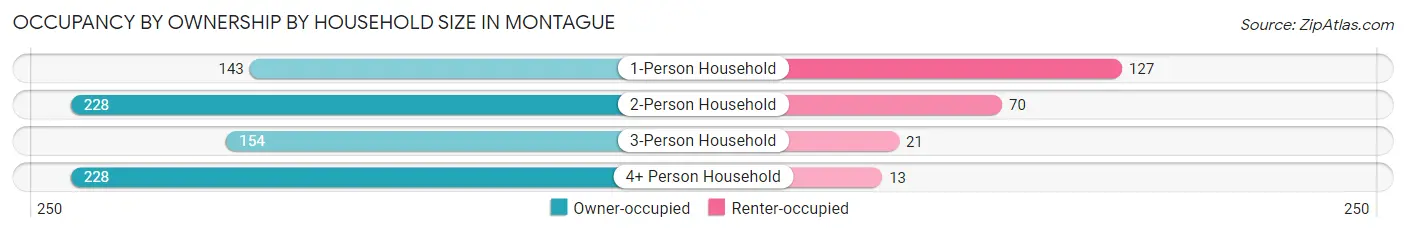
| Household Size | Owner-occupied | Renter-occupied |
| 1-Person Household | 143 (53.0%) | 127 (47.0%) |
| 2-Person Household | 228 (76.5%) | 70 (23.5%) |
| 3-Person Household | 154 (88.0%) | 21 (12.0%) |
| 4+ Person Household | 228 (94.6%) | 13 (5.4%) |
| Total Housing Units | 753 (76.5%) | 231 (23.5%) |
Occupancy by Educational Attainment in Montague
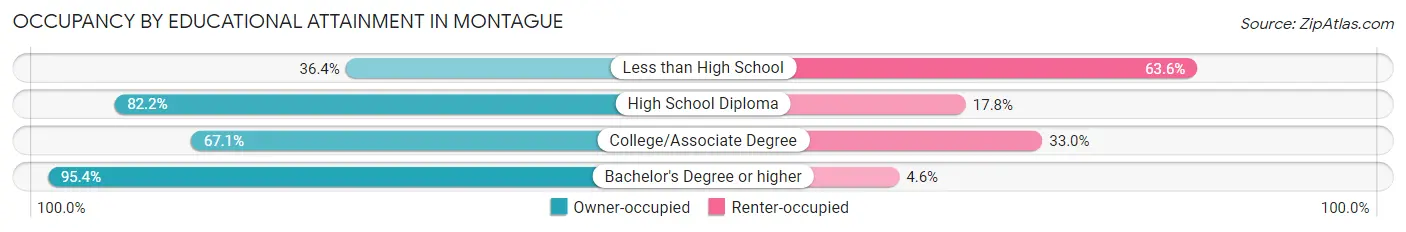
| Household Size | Owner-occupied | Renter-occupied |
| Less than High School | 12 (36.4%) | 21 (63.6%) |
| High School Diploma | 259 (82.2%) | 56 (17.8%) |
| College/Associate Degree | 295 (67.0%) | 145 (33.0%) |
| Bachelor's Degree or higher | 187 (95.4%) | 9 (4.6%) |
Occupancy by Age of Householder in Montague
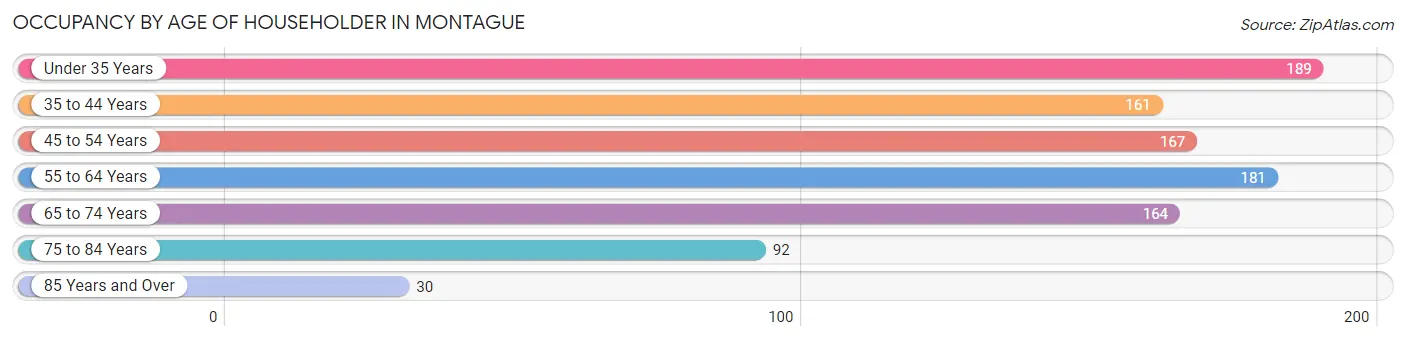
| Age Bracket | # Households | % Households |
| Under 35 Years | 189 | 19.2% |
| 35 to 44 Years | 161 | 16.4% |
| 45 to 54 Years | 167 | 17.0% |
| 55 to 64 Years | 181 | 18.4% |
| 65 to 74 Years | 164 | 16.7% |
| 75 to 84 Years | 92 | 9.3% |
| 85 Years and Over | 30 | 3.0% |
| Total | 984 | 100.0% |
Housing Finances in Montague
Median Income by Occupancy in Montague
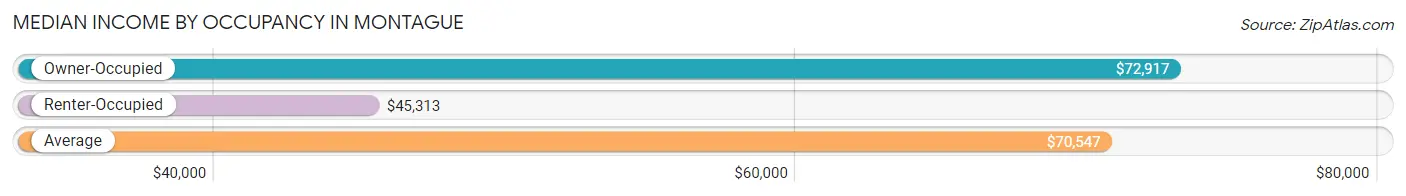
| Occupancy Type | # Households | Median Income |
| Owner-Occupied | 753 (76.5%) | $72,917 |
| Renter-Occupied | 231 (23.5%) | $45,313 |
| Average | 984 (100.0%) | $70,547 |
Occupancy by Householder Income Bracket in Montague
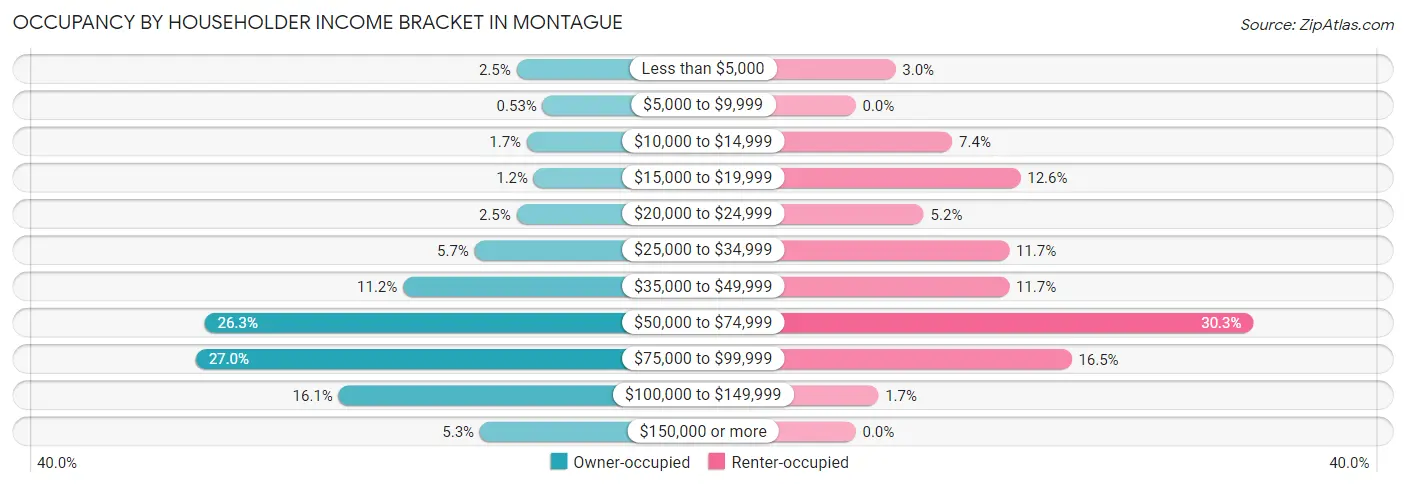
| Income Bracket | Owner-occupied | Renter-occupied |
| Less than $5,000 | 19 (2.5%) | 7 (3.0%) |
| $5,000 to $9,999 | 4 (0.5%) | 0 (0.0%) |
| $10,000 to $14,999 | 13 (1.7%) | 17 (7.4%) |
| $15,000 to $19,999 | 9 (1.2%) | 29 (12.6%) |
| $20,000 to $24,999 | 19 (2.5%) | 12 (5.2%) |
| $25,000 to $34,999 | 43 (5.7%) | 27 (11.7%) |
| $35,000 to $49,999 | 84 (11.2%) | 27 (11.7%) |
| $50,000 to $74,999 | 198 (26.3%) | 70 (30.3%) |
| $75,000 to $99,999 | 203 (27.0%) | 38 (16.5%) |
| $100,000 to $149,999 | 121 (16.1%) | 4 (1.7%) |
| $150,000 or more | 40 (5.3%) | 0 (0.0%) |
| Total | 753 (100.0%) | 231 (100.0%) |
Monthly Housing Cost Tiers in Montague
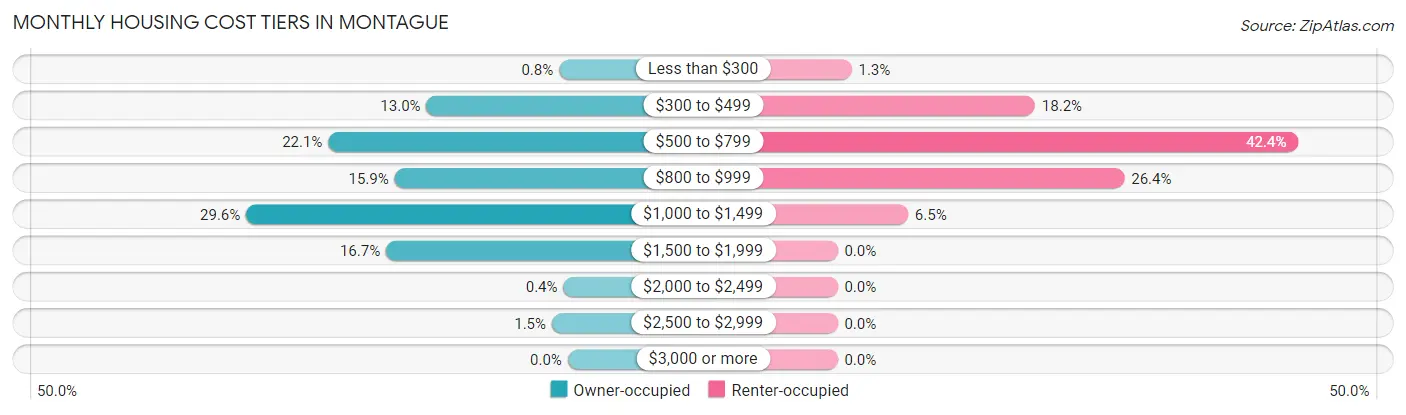
| Monthly Cost | Owner-occupied | Renter-occupied |
| Less than $300 | 6 (0.8%) | 3 (1.3%) |
| $300 to $499 | 98 (13.0%) | 42 (18.2%) |
| $500 to $799 | 166 (22.1%) | 98 (42.4%) |
| $800 to $999 | 120 (15.9%) | 61 (26.4%) |
| $1,000 to $1,499 | 223 (29.6%) | 15 (6.5%) |
| $1,500 to $1,999 | 126 (16.7%) | 0 (0.0%) |
| $2,000 to $2,499 | 3 (0.4%) | 0 (0.0%) |
| $2,500 to $2,999 | 11 (1.5%) | 0 (0.0%) |
| $3,000 or more | 0 (0.0%) | 0 (0.0%) |
| Total | 753 (100.0%) | 231 (100.0%) |
Physical Housing Characteristics in Montague
Housing Structures in Montague
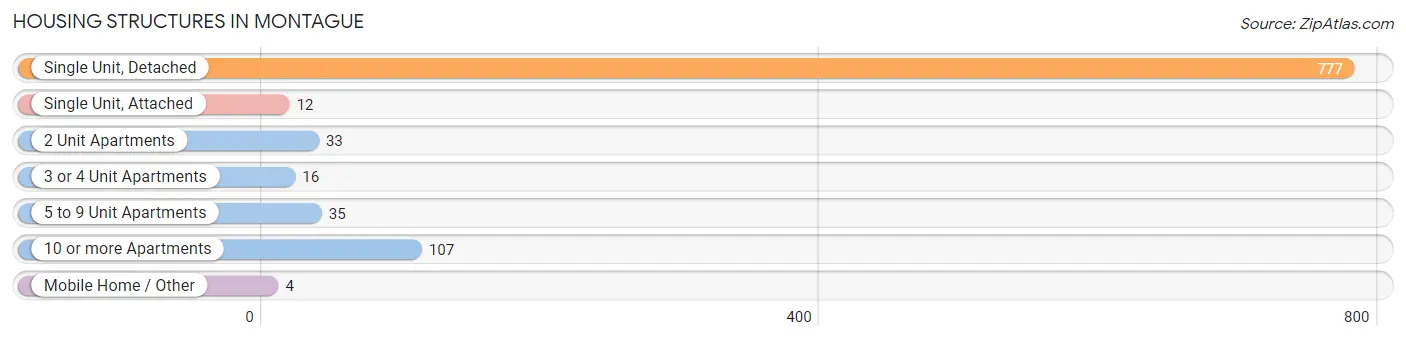
| Structure Type | # Housing Units | % Housing Units |
| Single Unit, Detached | 777 | 79.0% |
| Single Unit, Attached | 12 | 1.2% |
| 2 Unit Apartments | 33 | 3.4% |
| 3 or 4 Unit Apartments | 16 | 1.6% |
| 5 to 9 Unit Apartments | 35 | 3.6% |
| 10 or more Apartments | 107 | 10.9% |
| Mobile Home / Other | 4 | 0.4% |
| Total | 984 | 100.0% |
Housing Structures by Occupancy in Montague
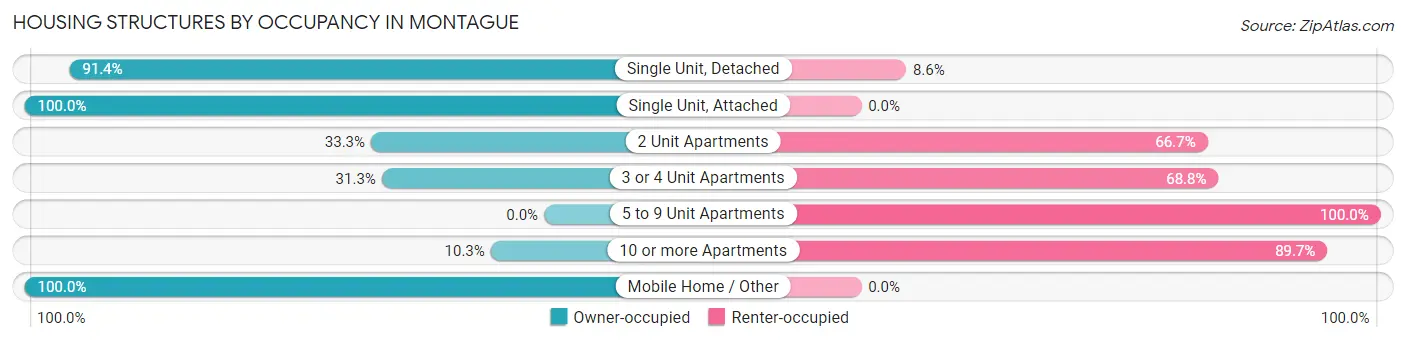
| Structure Type | Owner-occupied | Renter-occupied |
| Single Unit, Detached | 710 (91.4%) | 67 (8.6%) |
| Single Unit, Attached | 12 (100.0%) | 0 (0.0%) |
| 2 Unit Apartments | 11 (33.3%) | 22 (66.7%) |
| 3 or 4 Unit Apartments | 5 (31.2%) | 11 (68.8%) |
| 5 to 9 Unit Apartments | 0 (0.0%) | 35 (100.0%) |
| 10 or more Apartments | 11 (10.3%) | 96 (89.7%) |
| Mobile Home / Other | 4 (100.0%) | 0 (0.0%) |
| Total | 753 (76.5%) | 231 (23.5%) |
Housing Structures by Number of Rooms in Montague
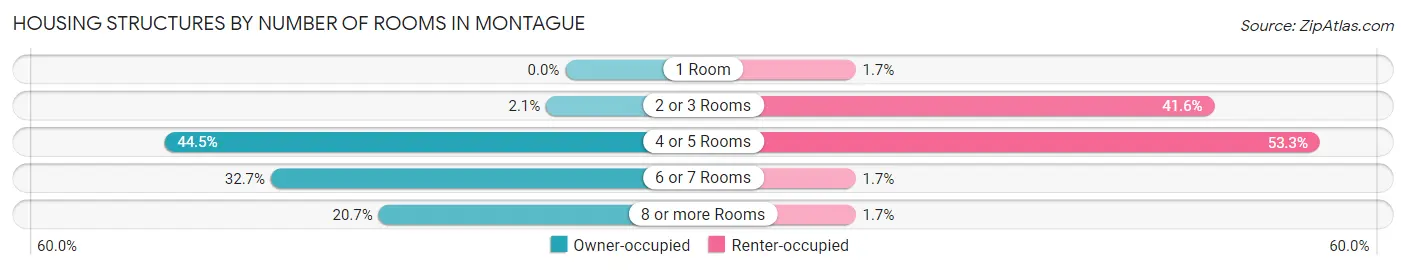
| Number of Rooms | Owner-occupied | Renter-occupied |
| 1 Room | 0 (0.0%) | 4 (1.7%) |
| 2 or 3 Rooms | 16 (2.1%) | 96 (41.6%) |
| 4 or 5 Rooms | 335 (44.5%) | 123 (53.2%) |
| 6 or 7 Rooms | 246 (32.7%) | 4 (1.7%) |
| 8 or more Rooms | 156 (20.7%) | 4 (1.7%) |
| Total | 753 (100.0%) | 231 (100.0%) |
Housing Structure by Heating Type in Montague
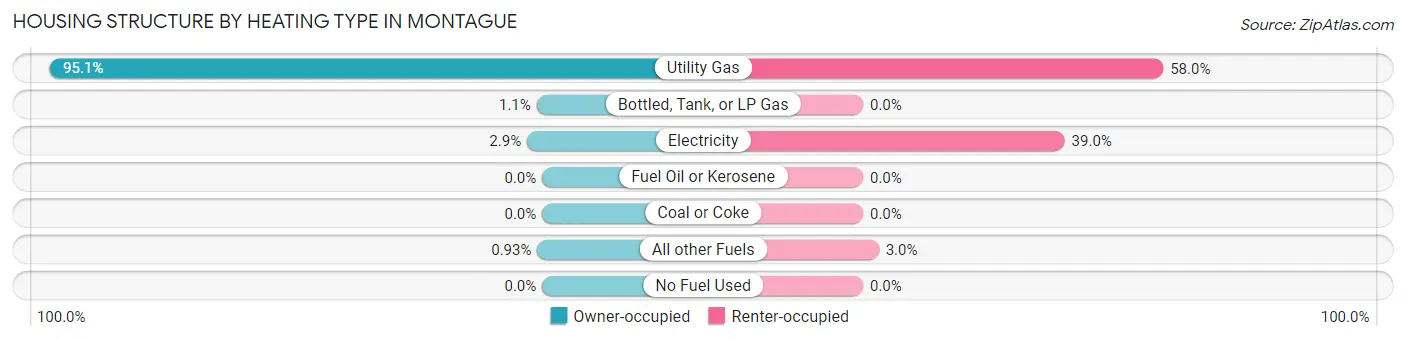
| Heating Type | Owner-occupied | Renter-occupied |
| Utility Gas | 716 (95.1%) | 134 (58.0%) |
| Bottled, Tank, or LP Gas | 8 (1.1%) | 0 (0.0%) |
| Electricity | 22 (2.9%) | 90 (39.0%) |
| Fuel Oil or Kerosene | 0 (0.0%) | 0 (0.0%) |
| Coal or Coke | 0 (0.0%) | 0 (0.0%) |
| All other Fuels | 7 (0.9%) | 7 (3.0%) |
| No Fuel Used | 0 (0.0%) | 0 (0.0%) |
| Total | 753 (100.0%) | 231 (100.0%) |
Household Vehicle Usage in Montague
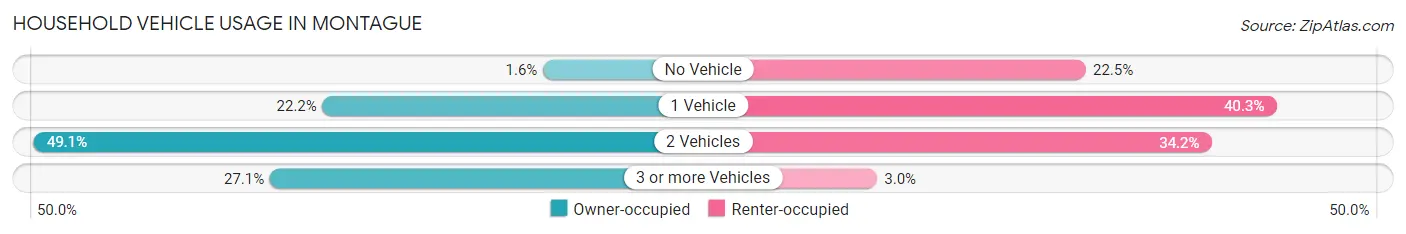
| Vehicles per Household | Owner-occupied | Renter-occupied |
| No Vehicle | 12 (1.6%) | 52 (22.5%) |
| 1 Vehicle | 167 (22.2%) | 93 (40.3%) |
| 2 Vehicles | 370 (49.1%) | 79 (34.2%) |
| 3 or more Vehicles | 204 (27.1%) | 7 (3.0%) |
| Total | 753 (100.0%) | 231 (100.0%) |
Real Estate & Mortgages in Montague
Real Estate and Mortgage Overview in Montague
| Characteristic | Without Mortgage | With Mortgage |
| Housing Units | 257 | 496 |
| Median Property Value | $173,300 | $158,900 |
| Median Household Income | $57,663 | $28 |
| Monthly Housing Costs | $545 | $0 |
| Real Estate Taxes | $2,890 | $20 |
Property Value by Mortgage Status in Montague
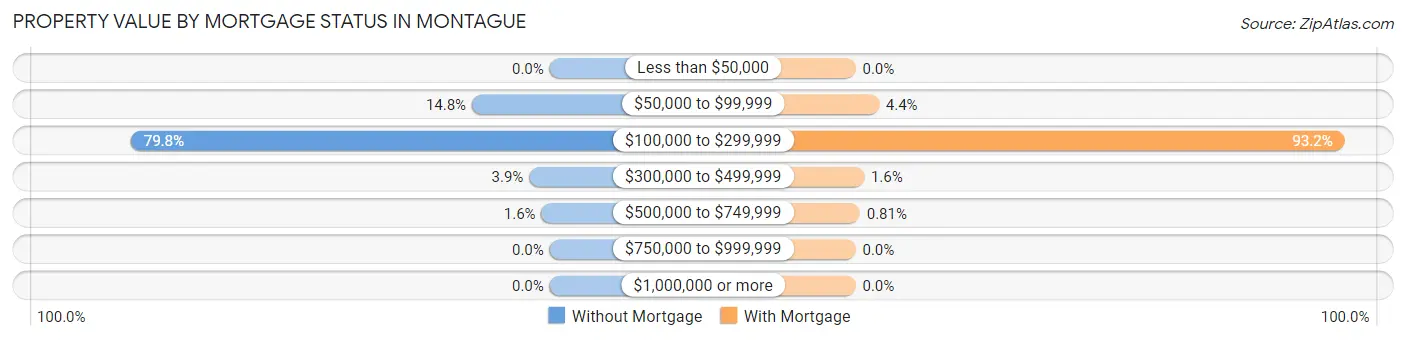
| Property Value | Without Mortgage | With Mortgage |
| Less than $50,000 | 0 (0.0%) | 0 (0.0%) |
| $50,000 to $99,999 | 38 (14.8%) | 22 (4.4%) |
| $100,000 to $299,999 | 205 (79.8%) | 462 (93.1%) |
| $300,000 to $499,999 | 10 (3.9%) | 8 (1.6%) |
| $500,000 to $749,999 | 4 (1.6%) | 4 (0.8%) |
| $750,000 to $999,999 | 0 (0.0%) | 0 (0.0%) |
| $1,000,000 or more | 0 (0.0%) | 0 (0.0%) |
| Total | 257 (100.0%) | 496 (100.0%) |
Household Income by Mortgage Status in Montague
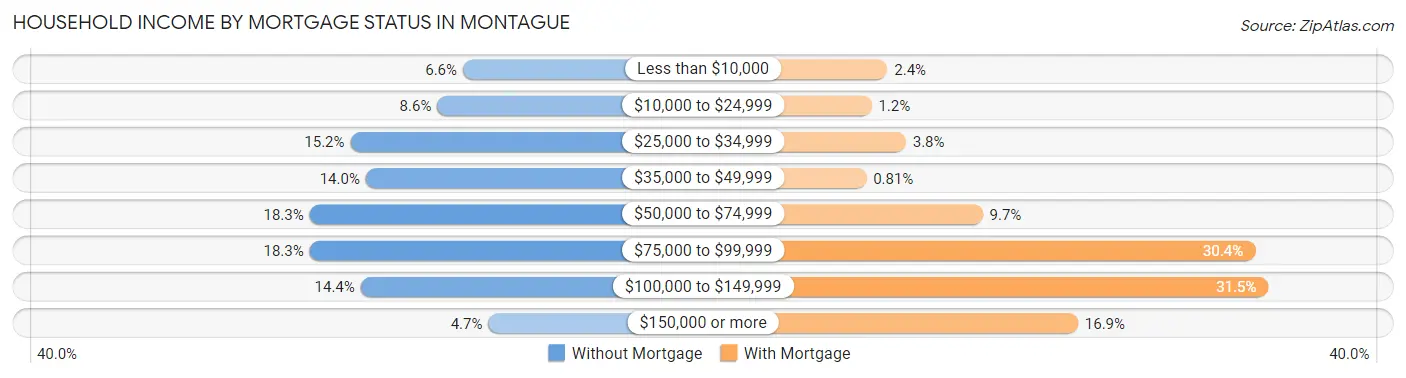
| Household Income | Without Mortgage | With Mortgage |
| Less than $10,000 | 17 (6.6%) | 12 (2.4%) |
| $10,000 to $24,999 | 22 (8.6%) | 6 (1.2%) |
| $25,000 to $34,999 | 39 (15.2%) | 19 (3.8%) |
| $35,000 to $49,999 | 36 (14.0%) | 4 (0.8%) |
| $50,000 to $74,999 | 47 (18.3%) | 48 (9.7%) |
| $75,000 to $99,999 | 47 (18.3%) | 151 (30.4%) |
| $100,000 to $149,999 | 37 (14.4%) | 156 (31.5%) |
| $150,000 or more | 12 (4.7%) | 84 (16.9%) |
| Total | 257 (100.0%) | 496 (100.0%) |
Property Value to Household Income Ratio in Montague
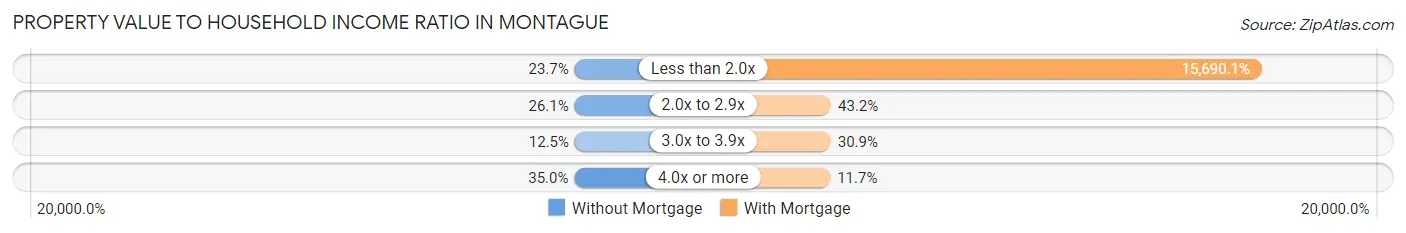
| Value-to-Income Ratio | Without Mortgage | With Mortgage |
| Less than 2.0x | 61 (23.7%) | 77,823 (15,690.1%) |
| 2.0x to 2.9x | 67 (26.1%) | 214 (43.1%) |
| 3.0x to 3.9x | 32 (12.4%) | 153 (30.8%) |
| 4.0x or more | 90 (35.0%) | 58 (11.7%) |
| Total | 257 (100.0%) | 496 (100.0%) |
Real Estate Taxes by Mortgage Status in Montague
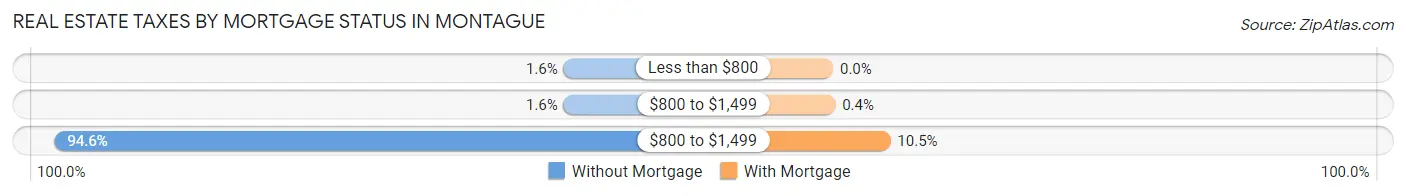
| Property Taxes | Without Mortgage | With Mortgage |
| Less than $800 | 4 (1.6%) | 0 (0.0%) |
| $800 to $1,499 | 4 (1.6%) | 2 (0.4%) |
| $800 to $1,499 | 243 (94.6%) | 52 (10.5%) |
| Total | 257 (100.0%) | 496 (100.0%) |
Health & Disability in Montague
Health Insurance Coverage by Age in Montague
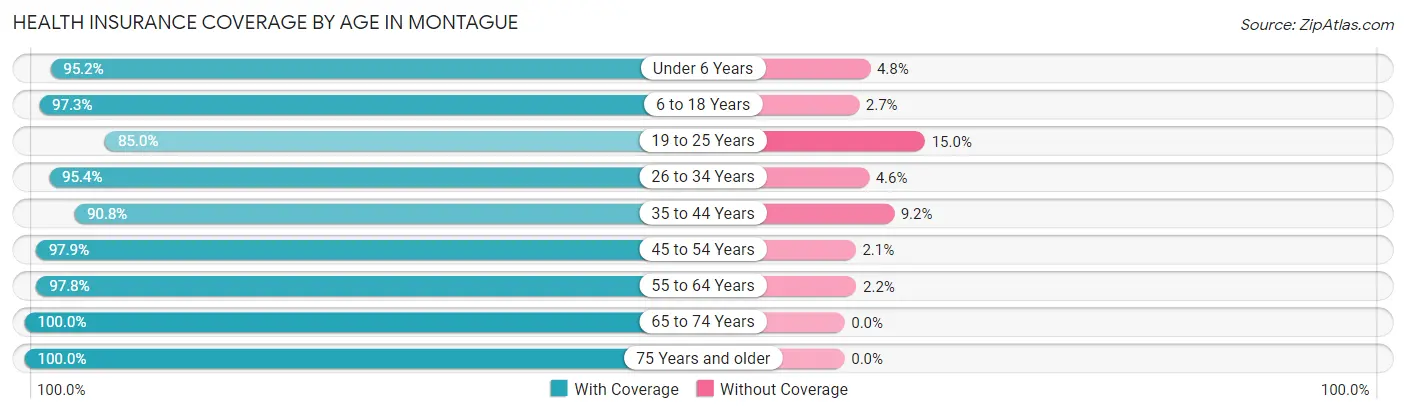
| Age Bracket | With Coverage | Without Coverage |
| Under 6 Years | 139 (95.2%) | 7 (4.8%) |
| 6 to 18 Years | 610 (97.3%) | 17 (2.7%) |
| 19 to 25 Years | 119 (85.0%) | 21 (15.0%) |
| 26 to 34 Years | 272 (95.4%) | 13 (4.6%) |
| 35 to 44 Years | 276 (90.8%) | 28 (9.2%) |
| 45 to 54 Years | 235 (97.9%) | 5 (2.1%) |
| 55 to 64 Years | 311 (97.8%) | 7 (2.2%) |
| 65 to 74 Years | 294 (100.0%) | 0 (0.0%) |
| 75 Years and older | 151 (100.0%) | 0 (0.0%) |
| Total | 2,407 (96.1%) | 98 (3.9%) |
Health Insurance Coverage by Citizenship Status in Montague
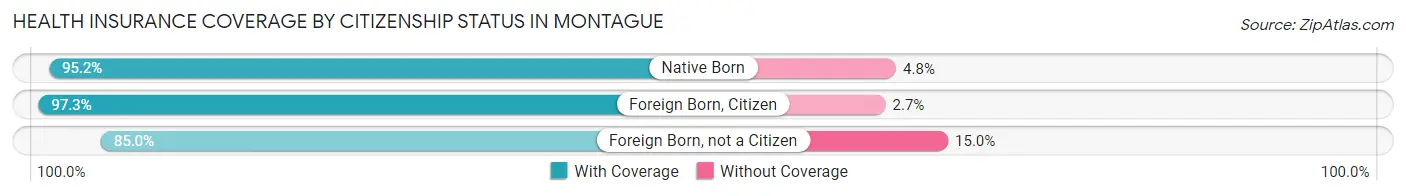
| Citizenship Status | With Coverage | Without Coverage |
| Native Born | 139 (95.2%) | 7 (4.8%) |
| Foreign Born, Citizen | 610 (97.3%) | 17 (2.7%) |
| Foreign Born, not a Citizen | 119 (85.0%) | 21 (15.0%) |
Health Insurance Coverage by Household Income in Montague
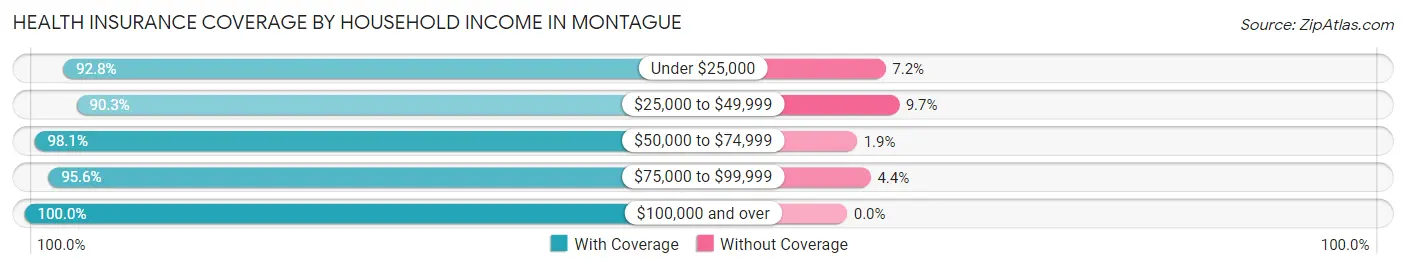
| Household Income | With Coverage | Without Coverage |
| Under $25,000 | 154 (92.8%) | 12 (7.2%) |
| $25,000 to $49,999 | 325 (90.3%) | 35 (9.7%) |
| $50,000 to $74,999 | 634 (98.1%) | 12 (1.9%) |
| $75,000 to $99,999 | 776 (95.6%) | 36 (4.4%) |
| $100,000 and over | 508 (100.0%) | 0 (0.0%) |
Public vs Private Health Insurance Coverage by Age in Montague
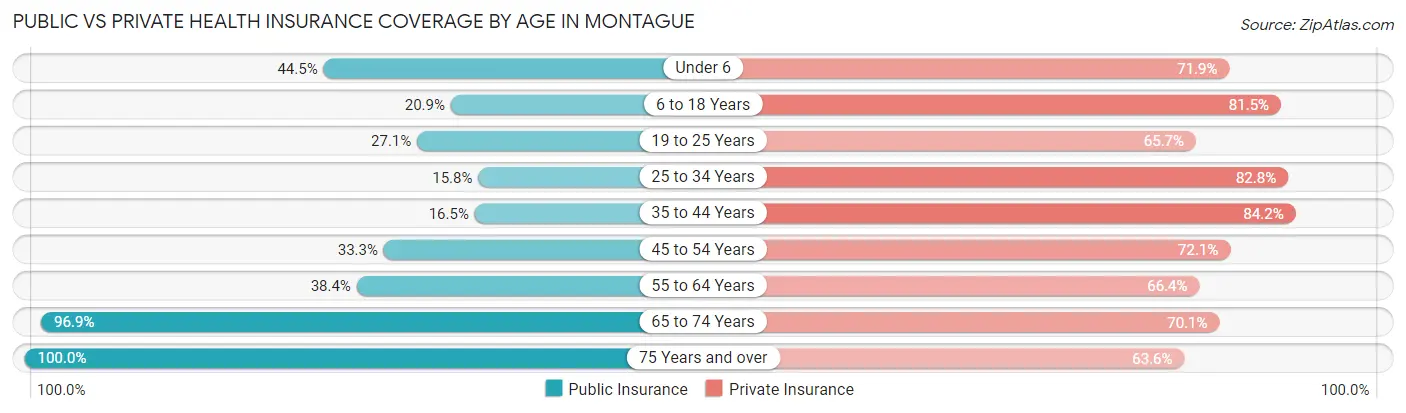
| Age Bracket | Public Insurance | Private Insurance |
| Under 6 | 65 (44.5%) | 105 (71.9%) |
| 6 to 18 Years | 131 (20.9%) | 511 (81.5%) |
| 19 to 25 Years | 38 (27.1%) | 92 (65.7%) |
| 25 to 34 Years | 45 (15.8%) | 236 (82.8%) |
| 35 to 44 Years | 50 (16.5%) | 256 (84.2%) |
| 45 to 54 Years | 80 (33.3%) | 173 (72.1%) |
| 55 to 64 Years | 122 (38.4%) | 211 (66.3%) |
| 65 to 74 Years | 285 (96.9%) | 206 (70.1%) |
| 75 Years and over | 151 (100.0%) | 96 (63.6%) |
| Total | 967 (38.6%) | 1,886 (75.3%) |
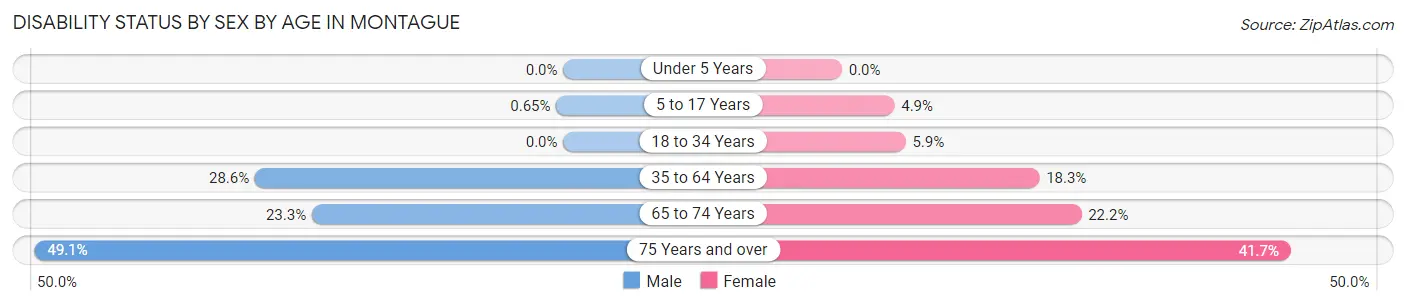
Disability Status by Sex by Age in Montague
| Age Bracket | Male | Female |
| Under 5 Years | 0 (0.0%) | 0 (0.0%) |
| 5 to 17 Years | 2 (0.6%) | 17 (4.9%) |
| 18 to 34 Years | 0 (0.0%) | 13 (5.9%) |
| 35 to 64 Years | 117 (28.6%) | 83 (18.3%) |
| 65 to 74 Years | 35 (23.3%) | 32 (22.2%) |
| 75 Years and over | 27 (49.1%) | 40 (41.7%) |
Disability Class by Sex by Age in Montague
Disability Class: Hearing Difficulty
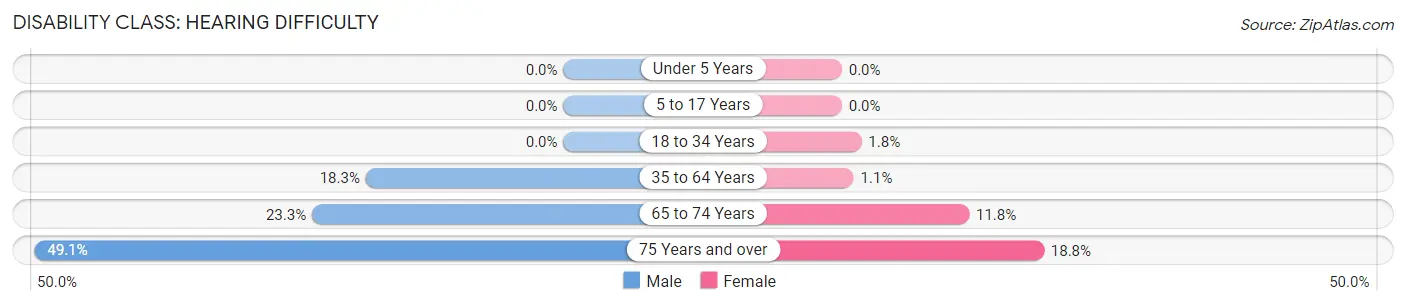
| Age Bracket | Male | Female |
| Under 5 Years | 0 (0.0%) | 0 (0.0%) |
| 5 to 17 Years | 0 (0.0%) | 0 (0.0%) |
| 18 to 34 Years | 0 (0.0%) | 4 (1.8%) |
| 35 to 64 Years | 75 (18.3%) | 5 (1.1%) |
| 65 to 74 Years | 35 (23.3%) | 17 (11.8%) |
| 75 Years and over | 27 (49.1%) | 18 (18.8%) |
Disability Class: Vision Difficulty
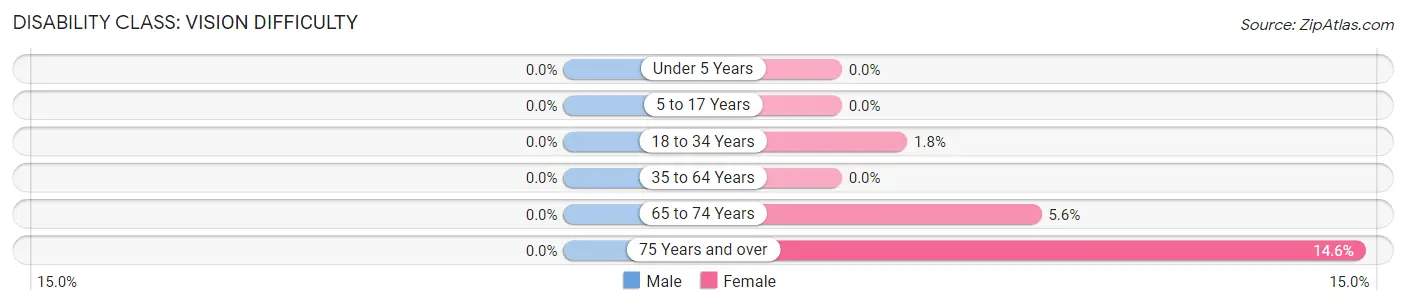
| Age Bracket | Male | Female |
| Under 5 Years | 0 (0.0%) | 0 (0.0%) |
| 5 to 17 Years | 0 (0.0%) | 0 (0.0%) |
| 18 to 34 Years | 0 (0.0%) | 4 (1.8%) |
| 35 to 64 Years | 0 (0.0%) | 0 (0.0%) |
| 65 to 74 Years | 0 (0.0%) | 8 (5.6%) |
| 75 Years and over | 0 (0.0%) | 14 (14.6%) |
Disability Class: Cognitive Difficulty
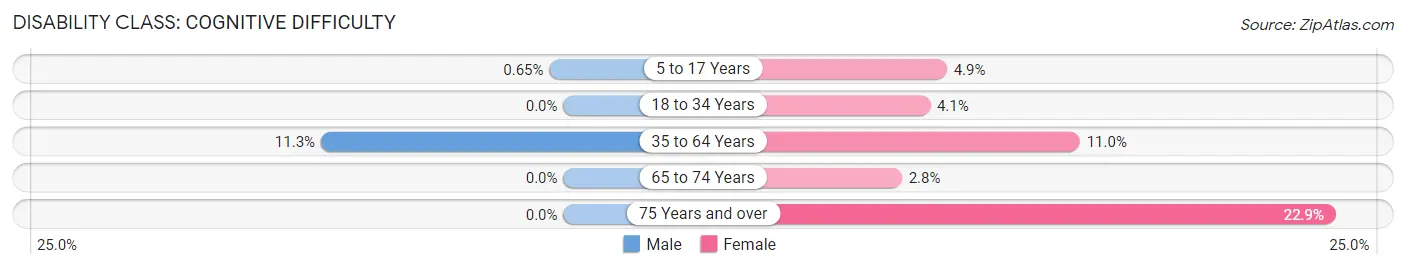
| Age Bracket | Male | Female |
| 5 to 17 Years | 2 (0.6%) | 17 (4.9%) |
| 18 to 34 Years | 0 (0.0%) | 9 (4.1%) |
| 35 to 64 Years | 46 (11.3%) | 50 (11.0%) |
| 65 to 74 Years | 0 (0.0%) | 4 (2.8%) |
| 75 Years and over | 0 (0.0%) | 22 (22.9%) |
Disability Class: Ambulatory Difficulty
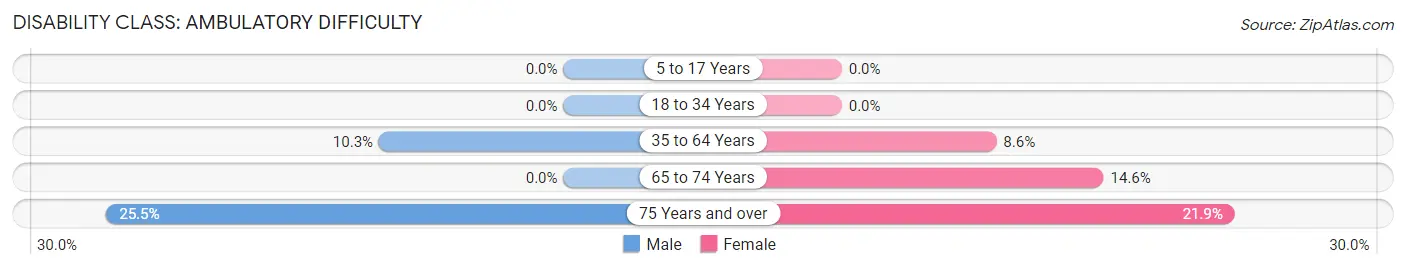
| Age Bracket | Male | Female |
| 5 to 17 Years | 0 (0.0%) | 0 (0.0%) |
| 18 to 34 Years | 0 (0.0%) | 0 (0.0%) |
| 35 to 64 Years | 42 (10.3%) | 39 (8.6%) |
| 65 to 74 Years | 0 (0.0%) | 21 (14.6%) |
| 75 Years and over | 14 (25.5%) | 21 (21.9%) |
Disability Class: Self-Care Difficulty
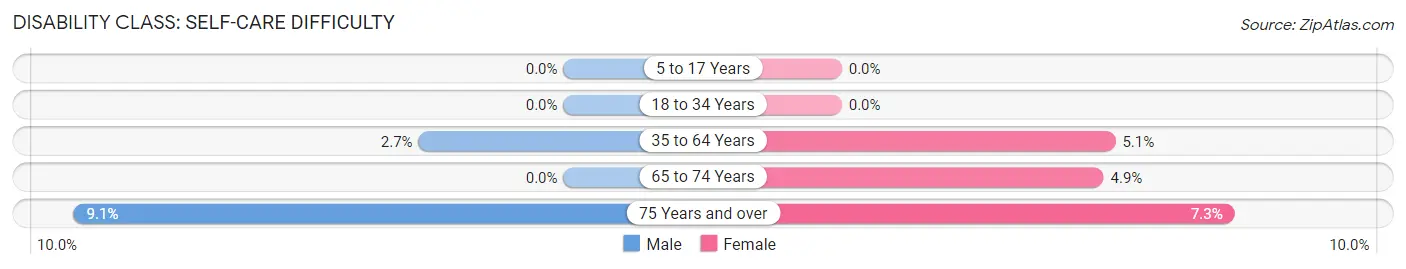
| Age Bracket | Male | Female |
| 5 to 17 Years | 0 (0.0%) | 0 (0.0%) |
| 18 to 34 Years | 0 (0.0%) | 0 (0.0%) |
| 35 to 64 Years | 11 (2.7%) | 23 (5.1%) |
| 65 to 74 Years | 0 (0.0%) | 7 (4.9%) |
| 75 Years and over | 5 (9.1%) | 7 (7.3%) |
Technology Access in Montague
Computing Device Access in Montague
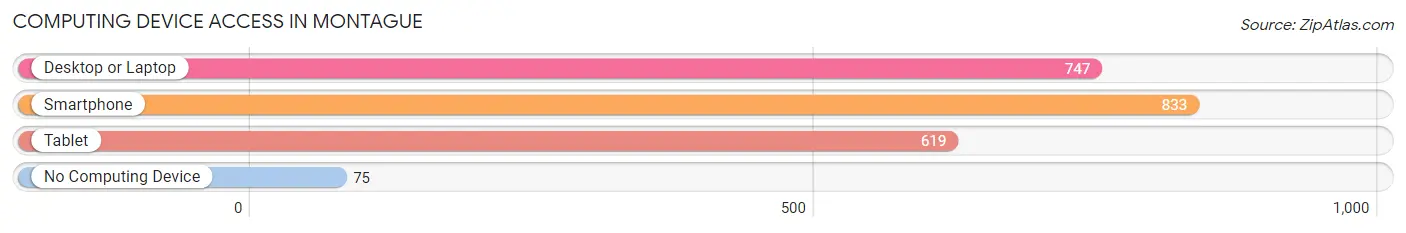
| Device Type | # Households | % Households |
| Desktop or Laptop | 747 | 75.9% |
| Smartphone | 833 | 84.7% |
| Tablet | 619 | 62.9% |
| No Computing Device | 75 | 7.6% |
| Total | 984 | 100.0% |
Internet Access in Montague
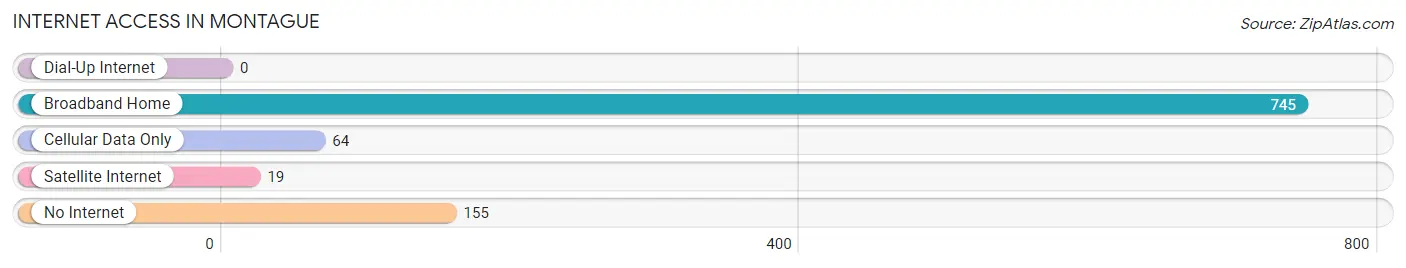
| Internet Type | # Households | % Households |
| Dial-Up Internet | 0 | 0.0% |
| Broadband Home | 745 | 75.7% |
| Cellular Data Only | 64 | 6.5% |
| Satellite Internet | 19 | 1.9% |
| No Internet | 155 | 15.8% |
| Total | 984 | 100.0% |
Montague Summary
Montague, Michigan is a small city located in Muskegon County, Michigan. It is situated on the eastern shore of White Lake, a popular recreational area. The city has a population of approximately 3,000 people and is part of the larger Muskegon-Norton Shores Metropolitan Statistical Area.
History
Montague was first settled in 1837 by a group of settlers from New York. The settlement was originally called Whitehall, but was later changed to Montague in 1845. The name was chosen in honor of the Montague family, who were prominent in the area. The city was incorporated in 1867 and has remained a small, rural community ever since.
Geography
Montague is located in Muskegon County, Michigan. It is situated on the eastern shore of White Lake, a popular recreational area. The city is bordered by the cities of Whitehall to the north, Muskegon to the south, and Norton Shores to the east. The city is located approximately 25 miles from Grand Rapids and 40 miles from Kalamazoo.
Economy
Montague’s economy is largely based on tourism and agriculture. The city is home to several popular tourist attractions, including the White Lake State Park, the White Lake Yacht Club, and the Montague Marina. The city also has a thriving agricultural sector, with many local farms producing a variety of crops.
Demographics
As of the 2010 census, Montague had a population of 3,000 people. The racial makeup of the city was 94.2% White, 1.7% African American, 0.7% Native American, 0.3% Asian, 0.1% Pacific Islander, and 2.1% from other races. The median household income was $37,917, and the median family income was $45,938. The per capita income was $19,945.
Montague is a small, rural community with a rich history and a strong sense of community. The city is home to a variety of attractions and businesses, and is a popular destination for tourists and outdoor enthusiasts. The city’s economy is largely based on tourism and agriculture, and the city’s population is diverse and growing.
Common Questions
What is Per Capita Income in Montague?
Per Capita income in Montague is $28,213.
What is the Median Family Income in Montague?
Median Family Income in Montague is $76,481.
What is the Median Household income in Montague?
Median Household Income in Montague is $70,547.
What is Income or Wage Gap in Montague?
Income or Wage Gap in Montague is 51.6%.
Women in Montague earn 48.4 cents for every dollar earned by a man.
What is Family Income Deficit in Montague?
Family Income Deficit in Montague is $10,058.
Families that are below poverty line in Montague earn $10,058 less on average than the poverty threshold level.
What is Inequality or Gini Index in Montague?
Inequality or Gini Index in Montague is 0.33.
What is the Total Population of Montague?
Total Population of Montague is 2,514.
What is the Total Male Population of Montague?
Total Male Population of Montague is 1,197.
What is the Total Female Population of Montague?
Total Female Population of Montague is 1,317.
What is the Ratio of Males per 100 Females in Montague?
There are 90.89 Males per 100 Females in Montague.
What is the Ratio of Females per 100 Males in Montague?
There are 110.03 Females per 100 Males in Montague.
What is the Median Population Age in Montague?
Median Population Age in Montague is 36.0 Years.
What is the Average Family Size in Montague
Average Family Size in Montague is 3.1 People.
What is the Average Household Size in Montague
Average Household Size in Montague is 2.5 People.
How Large is the Labor Force in Montague?
There are 1,160 People in the Labor Forcein in Montague.
What is the Percentage of People in the Labor Force in Montague?
63.3% of People are in the Labor Force in Montague.
What is the Unemployment Rate in Montague?
Unemployment Rate in Montague is 1.7%.