East Jordan, MI Map & Demographics
East Jordan Map
East Jordan Overview
$37,687
PER CAPITA INCOME
$73,977
AVG FAMILY INCOME
$56,761
AVG HOUSEHOLD INCOME
32.2%
WAGE / INCOME GAP [ % ]
67.8¢/ $1
WAGE / INCOME GAP [ $ ]
0.42
INEQUALITY / GINI INDEX
1,876
TOTAL POPULATION
952
MALE POPULATION
924
FEMALE POPULATION
103.03
MALES / 100 FEMALES
97.06
FEMALES / 100 MALES
45.4
MEDIAN AGE
2.3
AVG FAMILY SIZE
1.9
AVG HOUSEHOLD SIZE
1,171
LABOR FORCE [ PEOPLE ]
69.2%
PERCENT IN LABOR FORCE
3.8%
UNEMPLOYMENT RATE
East Jordan Zip Codes
East Jordan Area Codes
Income in East Jordan
Income Overview in East Jordan
Per Capita Income in East Jordan is $37,687, while median incomes of families and households are $73,977 and $56,761 respectively.
| Characteristic | Number | Measure |
| Per Capita Income | 1,876 | $37,687 |
| Median Family Income | 519 | $73,977 |
| Mean Family Income | 519 | $84,796 |
| Median Household Income | 967 | $56,761 |
| Mean Household Income | 967 | $68,540 |
| Income Deficit | 519 | $0 |
| Wage / Income Gap (%) | 1,876 | 32.17% |
| Wage / Income Gap ($) | 1,876 | 67.83¢ per $1 |
| Gini / Inequality Index | 1,876 | 0.42 |
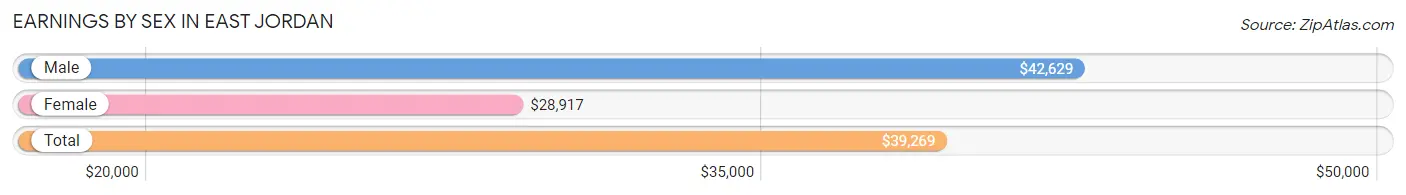
Earnings by Sex in East Jordan
Average Earnings in East Jordan are $39,269, $42,629 for men and $28,917 for women, a difference of 32.2%.
| Sex | Number | Average Earnings |
| Male | 709 (58.5%) | $42,629 |
| Female | 503 (41.5%) | $28,917 |
| Total | 1,212 (100.0%) | $39,269 |
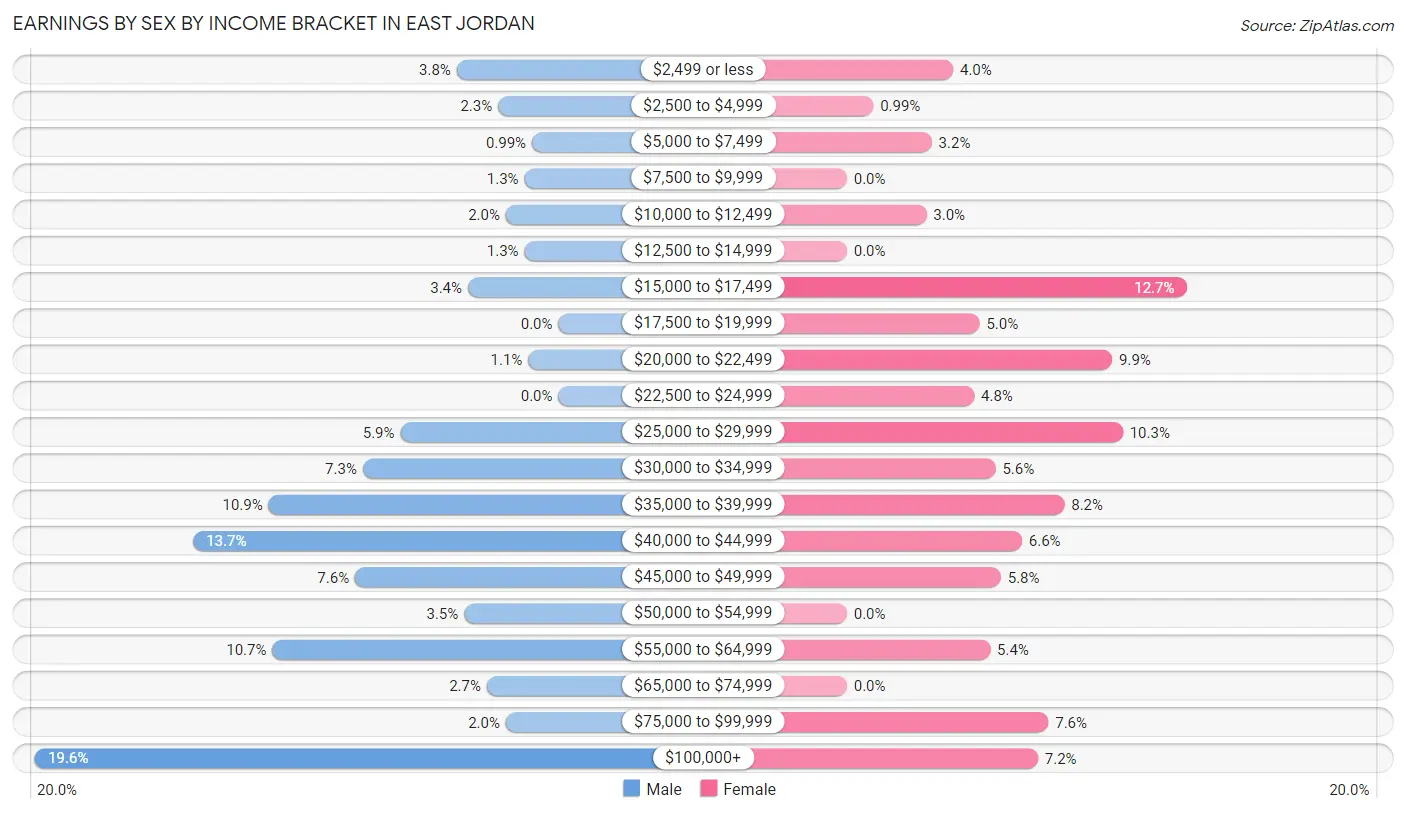
Earnings by Sex by Income Bracket in East Jordan
The most common earnings brackets in East Jordan are $100,000+ for men (139 | 19.6%) and $15,000 to $17,499 for women (64 | 12.7%).
| Income | Male | Female |
| $2,499 or less | 27 (3.8%) | 20 (4.0%) |
| $2,500 to $4,999 | 16 (2.3%) | 5 (1.0%) |
| $5,000 to $7,499 | 7 (1.0%) | 16 (3.2%) |
| $7,500 to $9,999 | 9 (1.3%) | 0 (0.0%) |
| $10,000 to $12,499 | 14 (2.0%) | 15 (3.0%) |
| $12,500 to $14,999 | 9 (1.3%) | 0 (0.0%) |
| $15,000 to $17,499 | 24 (3.4%) | 64 (12.7%) |
| $17,500 to $19,999 | 0 (0.0%) | 25 (5.0%) |
| $20,000 to $22,499 | 8 (1.1%) | 50 (9.9%) |
| $22,500 to $24,999 | 0 (0.0%) | 24 (4.8%) |
| $25,000 to $29,999 | 42 (5.9%) | 52 (10.3%) |
| $30,000 to $34,999 | 52 (7.3%) | 28 (5.6%) |
| $35,000 to $39,999 | 77 (10.9%) | 41 (8.2%) |
| $40,000 to $44,999 | 97 (13.7%) | 33 (6.6%) |
| $45,000 to $49,999 | 54 (7.6%) | 29 (5.8%) |
| $50,000 to $54,999 | 25 (3.5%) | 0 (0.0%) |
| $55,000 to $64,999 | 76 (10.7%) | 27 (5.4%) |
| $65,000 to $74,999 | 19 (2.7%) | 0 (0.0%) |
| $75,000 to $99,999 | 14 (2.0%) | 38 (7.5%) |
| $100,000+ | 139 (19.6%) | 36 (7.2%) |
| Total | 709 (100.0%) | 503 (100.0%) |
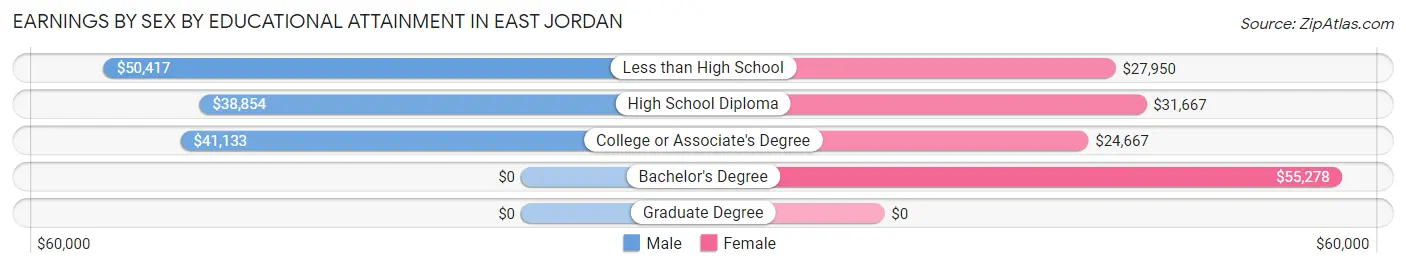
Earnings by Sex by Educational Attainment in East Jordan
Average earnings in East Jordan are $41,342 for men and $29,944 for women, a difference of 27.6%. Men with an educational attainment of less than high school enjoy the highest average annual earnings of $50,417, while those with high school diploma education earn the least with $38,854. Women with an educational attainment of bachelor's degree earn the most with the average annual earnings of $55,278, while those with college or associate's degree education have the smallest earnings of $24,667.
| Educational Attainment | Male Income | Female Income |
| Less than High School | $50,417 | $27,950 |
| High School Diploma | $38,854 | $31,667 |
| College or Associate's Degree | $41,133 | $24,667 |
| Bachelor's Degree | - | - |
| Graduate Degree | - | - |
| Total | $41,342 | $29,944 |
Family Income in East Jordan
Family Income Brackets in East Jordan
According to the East Jordan family income data, there are 126 families falling into the $75,000 to $99,999 income range, which is the most common income bracket and makes up 24.3% of all families.
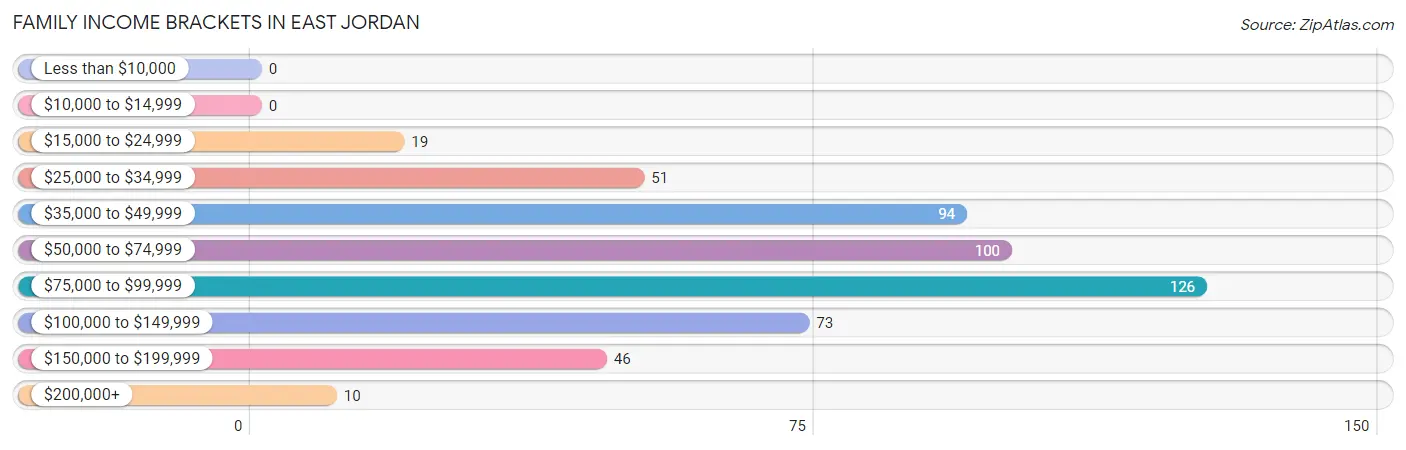
| Income Bracket | # Families | % Families |
| Less than $10,000 | 0 | 0.0% |
| $10,000 to $14,999 | 0 | 0.0% |
| $15,000 to $24,999 | 19 | 3.7% |
| $25,000 to $34,999 | 51 | 9.8% |
| $35,000 to $49,999 | 94 | 18.1% |
| $50,000 to $74,999 | 100 | 19.3% |
| $75,000 to $99,999 | 126 | 24.3% |
| $100,000 to $149,999 | 73 | 14.1% |
| $150,000 to $199,999 | 46 | 8.9% |
| $200,000+ | 10 | 1.9% |
Family Income by Famaliy Size in East Jordan
4-person families (68 | 13.1%) account for the highest median family income in East Jordan with $93,214 per family, while 2-person families (312 | 60.1%) have the highest median income of $34,584 per family member.
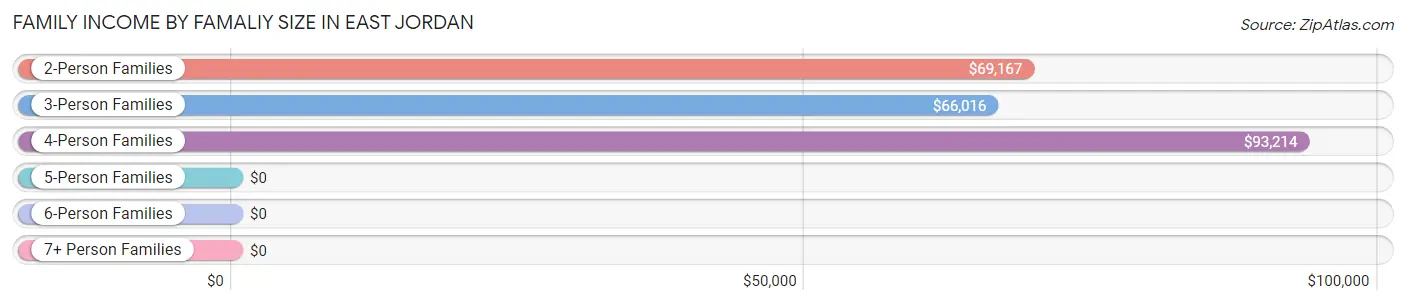
| Income Bracket | # Families | Median Income |
| 2-Person Families | 312 (60.1%) | $69,167 |
| 3-Person Families | 119 (22.9%) | $66,016 |
| 4-Person Families | 68 (13.1%) | $93,214 |
| 5-Person Families | 13 (2.5%) | $0 |
| 6-Person Families | 0 (0.0%) | $0 |
| 7+ Person Families | 7 (1.3%) | $0 |
| Total | 519 (100.0%) | $73,977 |
Family Income by Number of Earners in East Jordan
The median family income in East Jordan is $73,977, with families comprising 3+ earners (86) having the highest median family income of $97,692, while families with no earners (56) have the lowest median family income of $40,000, accounting for 16.6% and 10.8% of families, respectively.
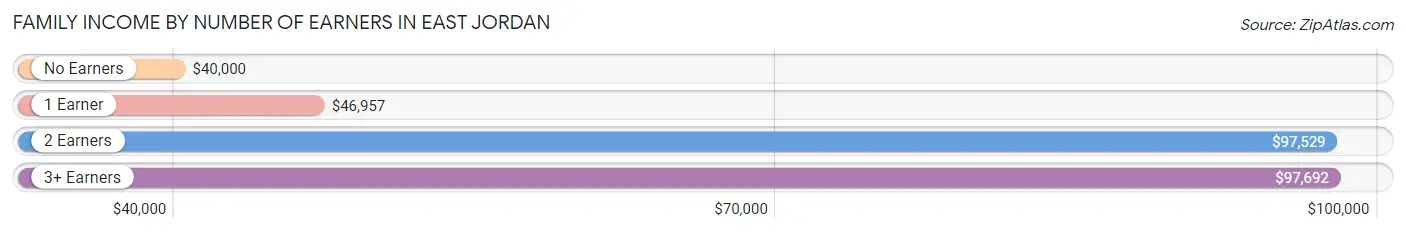
| Number of Earners | # Families | Median Income |
| No Earners | 56 (10.8%) | $40,000 |
| 1 Earner | 184 (35.4%) | $46,957 |
| 2 Earners | 193 (37.2%) | $97,529 |
| 3+ Earners | 86 (16.6%) | $97,692 |
| Total | 519 (100.0%) | $73,977 |
Household Income in East Jordan
Household Income Brackets in East Jordan
With 195 households falling in the category, the $50,000 to $74,999 income range is the most frequent in East Jordan, accounting for 20.2% of all households. In contrast, only 12 households (1.2%) fall into the less than $10,000 income bracket, making it the least populous group.
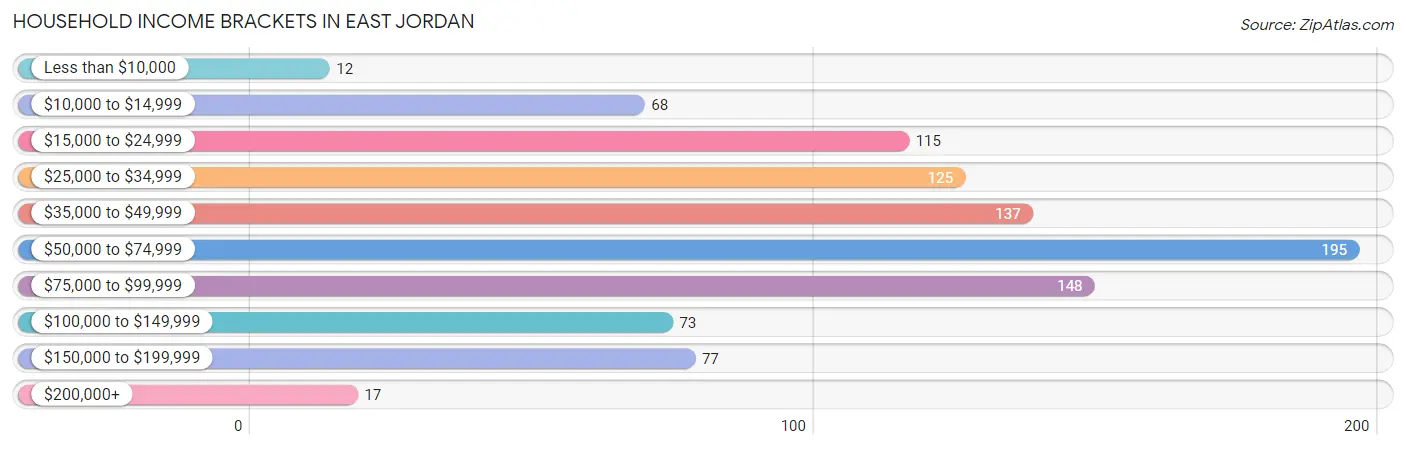
| Income Bracket | # Households | % Households |
| Less than $10,000 | 12 | 1.2% |
| $10,000 to $14,999 | 68 | 7.0% |
| $15,000 to $24,999 | 115 | 11.9% |
| $25,000 to $34,999 | 125 | 12.9% |
| $35,000 to $49,999 | 137 | 14.2% |
| $50,000 to $74,999 | 195 | 20.2% |
| $75,000 to $99,999 | 148 | 15.3% |
| $100,000 to $149,999 | 73 | 7.5% |
| $150,000 to $199,999 | 77 | 8.0% |
| $200,000+ | 17 | 1.8% |
Household Income by Householder Age in East Jordan
The median household income in East Jordan is $56,761, with the highest median household income of $68,021 found in the 25 to 44 years age bracket for the primary householder. A total of 291 households (30.1%) fall into this category. Meanwhile, the 15 to 24 years age bracket for the primary householder has the lowest median household income of $0, with 9 households (0.9%) in this group.
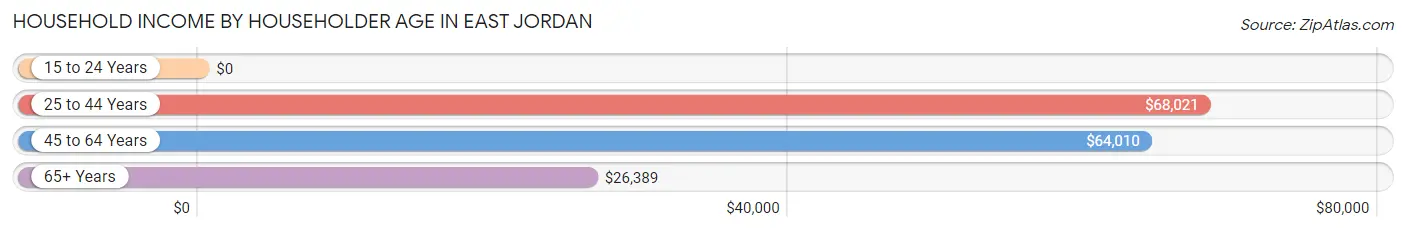
| Income Bracket | # Households | Median Income |
| 15 to 24 Years | 9 (0.9%) | $0 |
| 25 to 44 Years | 291 (30.1%) | $68,021 |
| 45 to 64 Years | 351 (36.3%) | $64,010 |
| 65+ Years | 316 (32.7%) | $26,389 |
| Total | 967 (100.0%) | $56,761 |
Poverty in East Jordan
Income Below Poverty by Sex and Age in East Jordan
With 2.1% poverty level for males and 10.6% for females among the residents of East Jordan, 75 year old and over males and 16 and 17 year old females are the most vulnerable to poverty, with 11 males (16.2%) and 9 females (45.0%) in their respective age groups living below the poverty level.
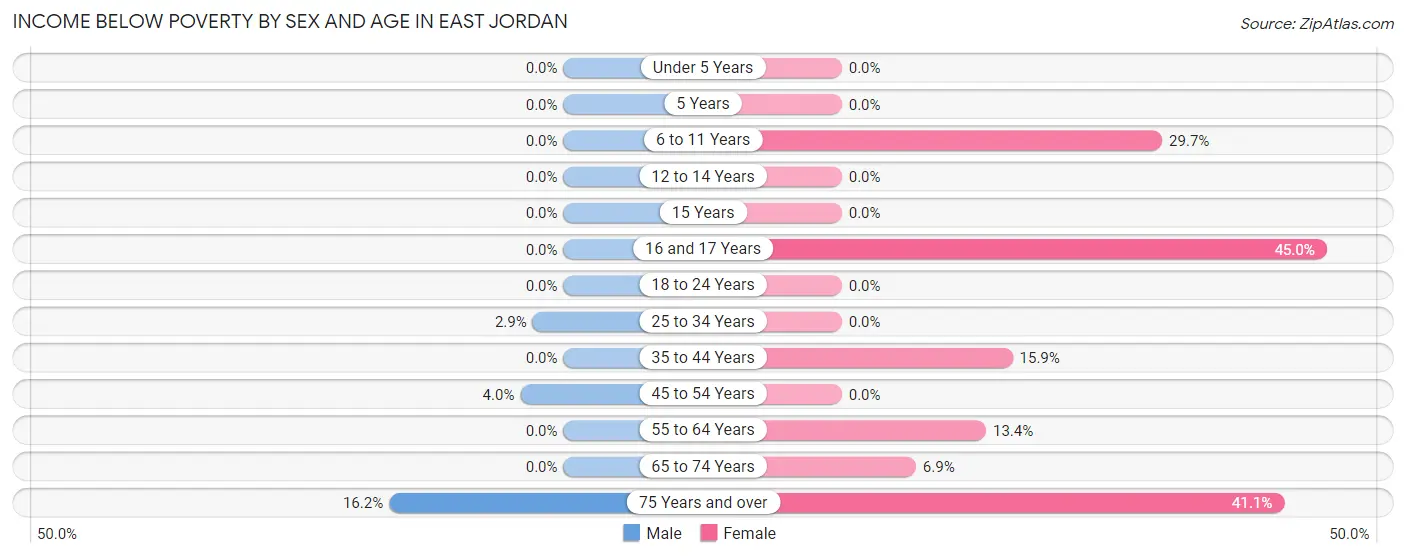
| Age Bracket | Male | Female |
| Under 5 Years | 0 (0.0%) | 0 (0.0%) |
| 5 Years | 0 (0.0%) | 0 (0.0%) |
| 6 to 11 Years | 0 (0.0%) | 11 (29.7%) |
| 12 to 14 Years | 0 (0.0%) | 0 (0.0%) |
| 15 Years | 0 (0.0%) | 0 (0.0%) |
| 16 and 17 Years | 0 (0.0%) | 9 (45.0%) |
| 18 to 24 Years | 0 (0.0%) | 0 (0.0%) |
| 25 to 34 Years | 3 (2.9%) | 0 (0.0%) |
| 35 to 44 Years | 0 (0.0%) | 13 (15.9%) |
| 45 to 54 Years | 6 (4.0%) | 0 (0.0%) |
| 55 to 64 Years | 0 (0.0%) | 15 (13.4%) |
| 65 to 74 Years | 0 (0.0%) | 11 (6.9%) |
| 75 Years and over | 11 (16.2%) | 39 (41.0%) |
| Total | 20 (2.1%) | 98 (10.6%) |
Income Above Poverty by Sex and Age in East Jordan
According to the poverty statistics in East Jordan, males aged under 5 years and females aged under 5 years are the age groups that are most secure financially, with 100.0% of males and 100.0% of females in these age groups living above the poverty line.
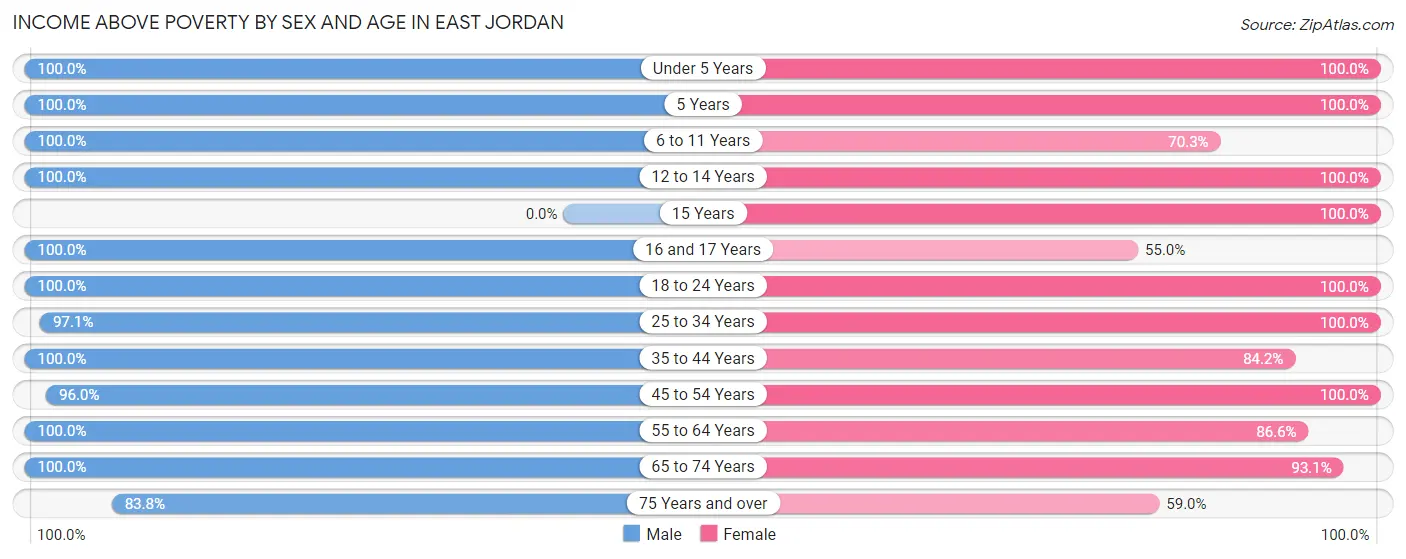
| Age Bracket | Male | Female |
| Under 5 Years | 5 (100.0%) | 32 (100.0%) |
| 5 Years | 5 (100.0%) | 20 (100.0%) |
| 6 to 11 Years | 42 (100.0%) | 26 (70.3%) |
| 12 to 14 Years | 8 (100.0%) | 16 (100.0%) |
| 15 Years | 0 (0.0%) | 13 (100.0%) |
| 16 and 17 Years | 31 (100.0%) | 11 (55.0%) |
| 18 to 24 Years | 173 (100.0%) | 26 (100.0%) |
| 25 to 34 Years | 102 (97.1%) | 175 (100.0%) |
| 35 to 44 Years | 127 (100.0%) | 69 (84.2%) |
| 45 to 54 Years | 144 (96.0%) | 136 (100.0%) |
| 55 to 64 Years | 147 (100.0%) | 97 (86.6%) |
| 65 to 74 Years | 85 (100.0%) | 149 (93.1%) |
| 75 Years and over | 57 (83.8%) | 56 (59.0%) |
| Total | 926 (97.9%) | 826 (89.4%) |
Income Below Poverty Among Married-Couple Families in East Jordan
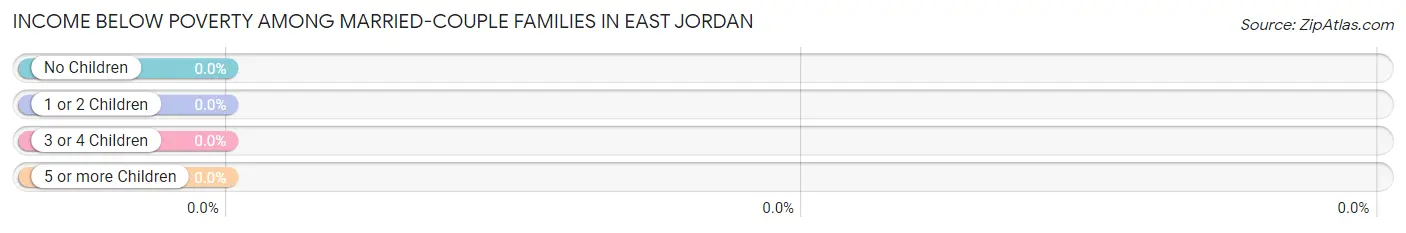
| Children | Above Poverty | Below Poverty |
| No Children | 244 (100.0%) | 0 (0.0%) |
| 1 or 2 Children | 60 (100.0%) | 0 (0.0%) |
| 3 or 4 Children | 7 (100.0%) | 0 (0.0%) |
| 5 or more Children | 0 (0.0%) | 0 (0.0%) |
| Total | 311 (100.0%) | 0 (0.0%) |
Income Below Poverty Among Single-Parent Households in East Jordan
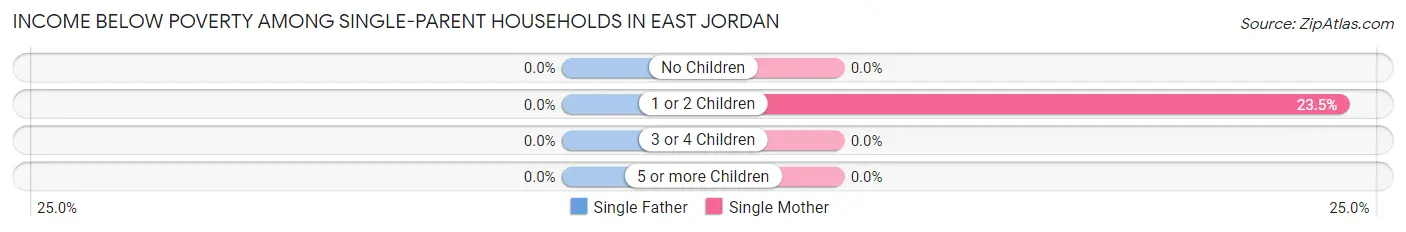
| Children | Single Father | Single Mother |
| No Children | 0 (0.0%) | 0 (0.0%) |
| 1 or 2 Children | 0 (0.0%) | 12 (23.5%) |
| 3 or 4 Children | 0 (0.0%) | 0 (0.0%) |
| 5 or more Children | 0 (0.0%) | 0 (0.0%) |
| Total | 0 (0.0%) | 12 (13.3%) |
Income Below Poverty Among Married-Couple vs Single-Parent Households in East Jordan
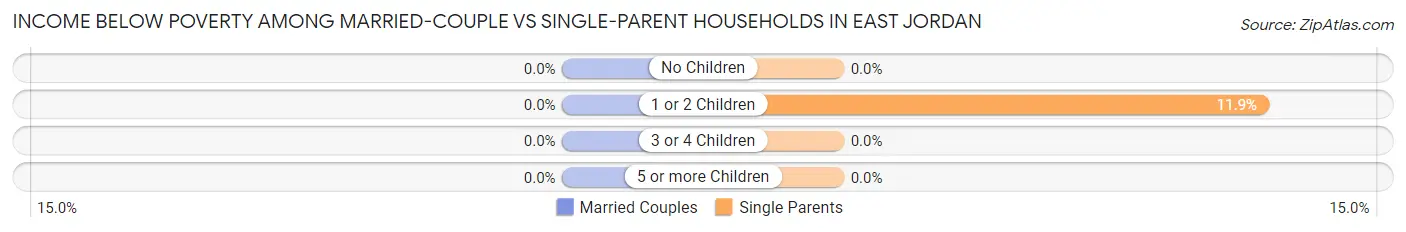
| Children | Married-Couple Families | Single-Parent Households |
| No Children | 0 (0.0%) | 0 (0.0%) |
| 1 or 2 Children | 0 (0.0%) | 12 (11.9%) |
| 3 or 4 Children | 0 (0.0%) | 0 (0.0%) |
| 5 or more Children | 0 (0.0%) | 0 (0.0%) |
| Total | 0 (0.0%) | 12 (5.8%) |
Race in East Jordan
The most populous races in East Jordan are White / Caucasian (1,735 | 92.5%), Hispanic or Latino (140 | 7.5%), and Two or more Races (82 | 4.4%).
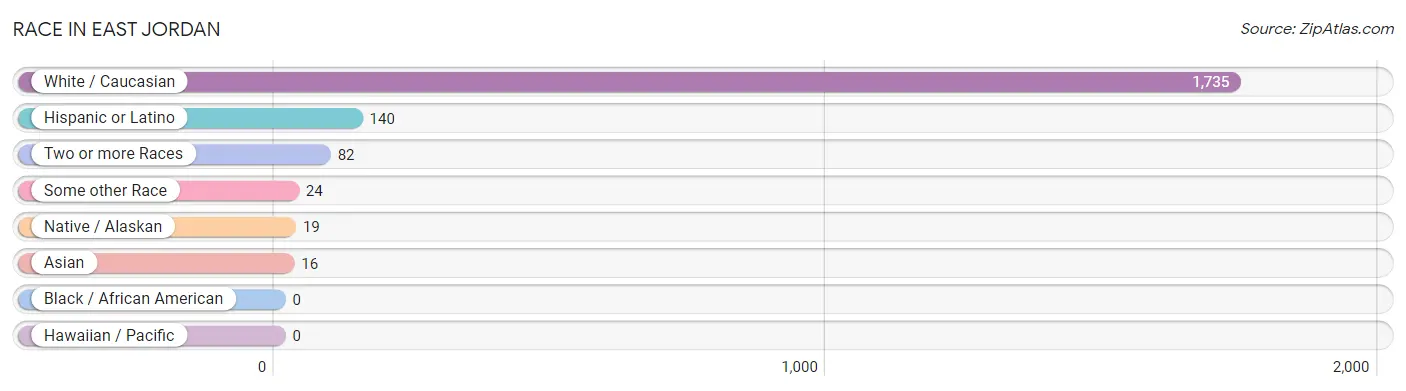
| Race | # Population | % Population |
| Asian | 16 | 0.9% |
| Black / African American | 0 | 0.0% |
| Hawaiian / Pacific | 0 | 0.0% |
| Hispanic or Latino | 140 | 7.5% |
| Native / Alaskan | 19 | 1.0% |
| White / Caucasian | 1,735 | 92.5% |
| Two or more Races | 82 | 4.4% |
| Some other Race | 24 | 1.3% |
| Total | 1,876 | 100.0% |
Ancestry in East Jordan
The most populous ancestries reported in East Jordan are Irish (407 | 21.7%), German (291 | 15.5%), English (252 | 13.4%), Polish (155 | 8.3%), and American (126 | 6.7%), together accounting for 65.6% of all East Jordan residents.
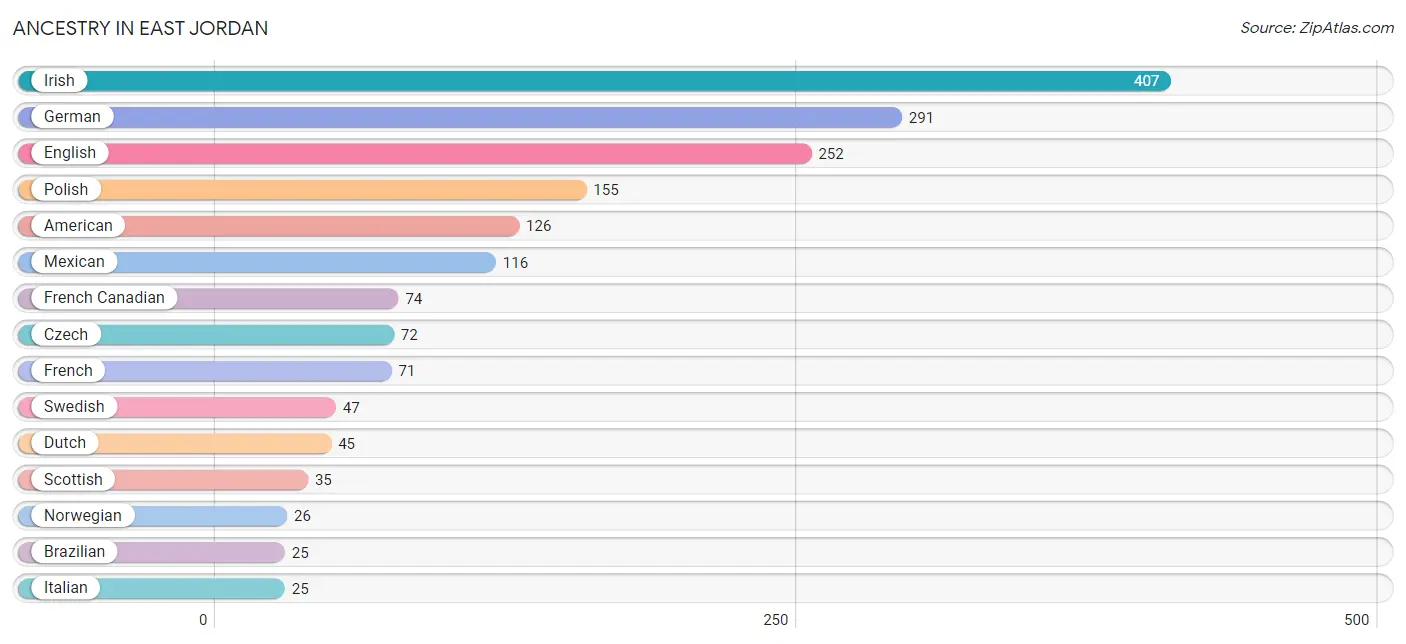
| Ancestry | # Population | % Population |
| American | 126 | 6.7% |
| Brazilian | 25 | 1.3% |
| British | 24 | 1.3% |
| Celtic | 7 | 0.4% |
| Chippewa | 10 | 0.5% |
| Czech | 72 | 3.8% |
| Danish | 10 | 0.5% |
| Dutch | 45 | 2.4% |
| English | 252 | 13.4% |
| European | 12 | 0.6% |
| French | 71 | 3.8% |
| French Canadian | 74 | 3.9% |
| German | 291 | 15.5% |
| Irish | 407 | 21.7% |
| Italian | 25 | 1.3% |
| Mexican | 116 | 6.2% |
| Norwegian | 26 | 1.4% |
| Polish | 155 | 8.3% |
| Puerto Rican | 24 | 1.3% |
| Scotch-Irish | 23 | 1.2% |
| Scottish | 35 | 1.9% |
| Sri Lankan | 16 | 0.9% |
| Swedish | 47 | 2.5% |
| Swiss | 4 | 0.2% |
| Ukrainian | 9 | 0.5% | View All 25 Rows |
Immigrants in East Jordan
The most numerous immigrant groups reported in East Jordan came from Asia (16 | 0.9%), South Eastern Asia (16 | 0.9%), and Vietnam (16 | 0.9%), together accounting for 2.6% of all East Jordan residents.
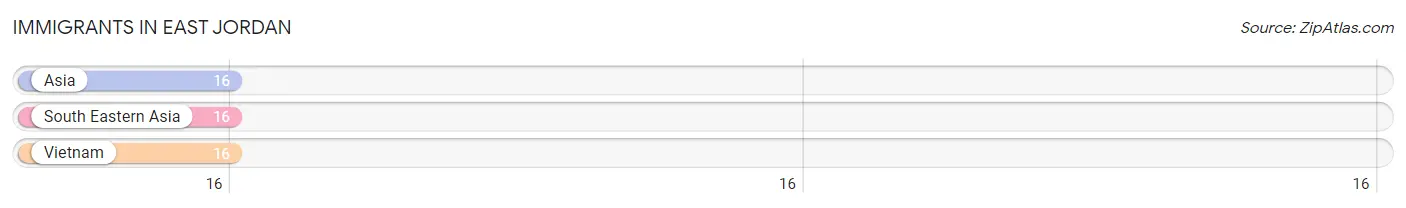
| Immigration Origin | # Population | % Population |
| Asia | 16 | 0.9% |
| South Eastern Asia | 16 | 0.9% |
| Vietnam | 16 | 0.9% | View All 3 Rows |
Sex and Age in East Jordan
Sex and Age in East Jordan
The most populous age groups in East Jordan are 20 to 24 Years (151 | 15.9%) for men and 30 to 34 Years (94 | 10.2%) for women.
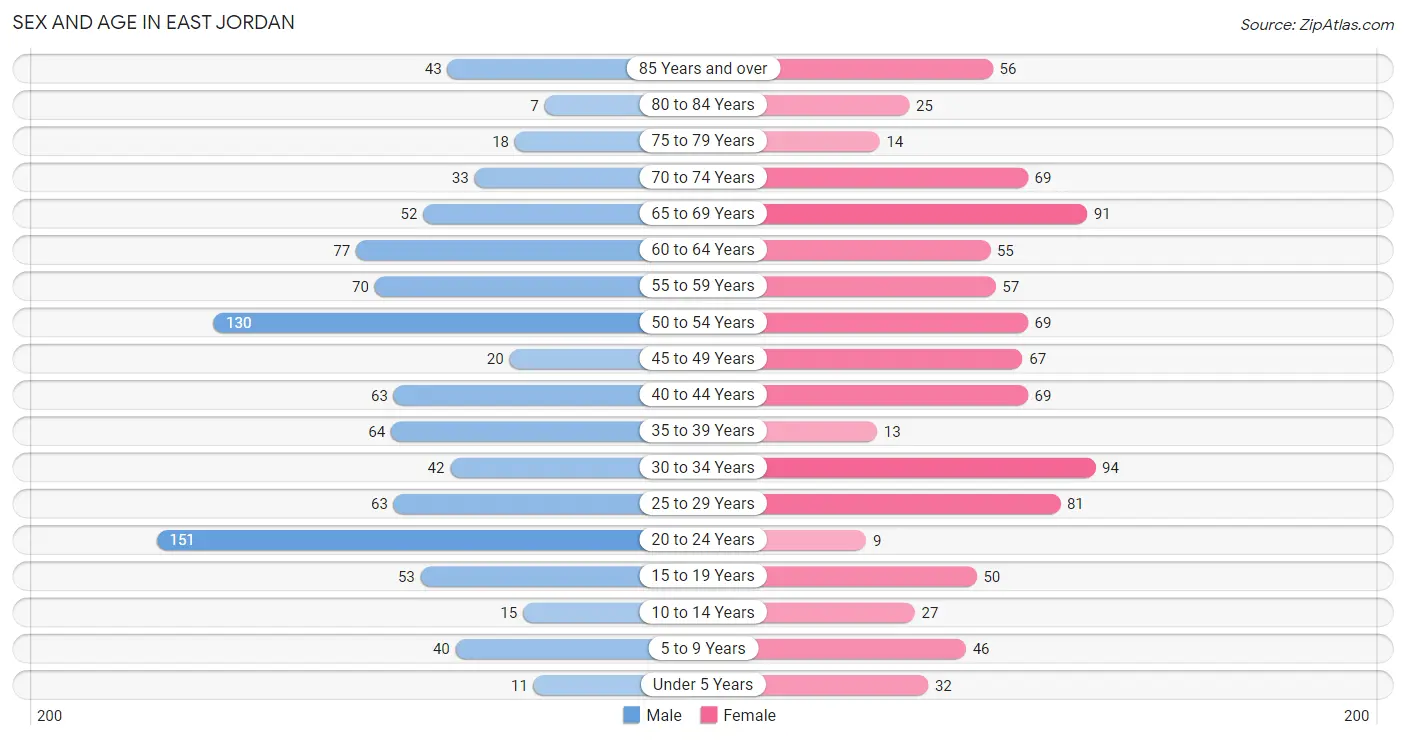
| Age Bracket | Male | Female |
| Under 5 Years | 11 (1.2%) | 32 (3.5%) |
| 5 to 9 Years | 40 (4.2%) | 46 (5.0%) |
| 10 to 14 Years | 15 (1.6%) | 27 (2.9%) |
| 15 to 19 Years | 53 (5.6%) | 50 (5.4%) |
| 20 to 24 Years | 151 (15.9%) | 9 (1.0%) |
| 25 to 29 Years | 63 (6.6%) | 81 (8.8%) |
| 30 to 34 Years | 42 (4.4%) | 94 (10.2%) |
| 35 to 39 Years | 64 (6.7%) | 13 (1.4%) |
| 40 to 44 Years | 63 (6.6%) | 69 (7.5%) |
| 45 to 49 Years | 20 (2.1%) | 67 (7.2%) |
| 50 to 54 Years | 130 (13.7%) | 69 (7.5%) |
| 55 to 59 Years | 70 (7.3%) | 57 (6.2%) |
| 60 to 64 Years | 77 (8.1%) | 55 (5.9%) |
| 65 to 69 Years | 52 (5.5%) | 91 (9.9%) |
| 70 to 74 Years | 33 (3.5%) | 69 (7.5%) |
| 75 to 79 Years | 18 (1.9%) | 14 (1.5%) |
| 80 to 84 Years | 7 (0.7%) | 25 (2.7%) |
| 85 Years and over | 43 (4.5%) | 56 (6.1%) |
| Total | 952 (100.0%) | 924 (100.0%) |
Families and Households in East Jordan
Median Family Size in East Jordan
The median family size in East Jordan is 2.30 persons per family, with married-couple families (311 | 59.9%) accounting for the largest median family size of 2.5 persons per family. On the other hand, single male/father families (118 | 22.7%) represent the smallest median family size with 1.76 persons per family.
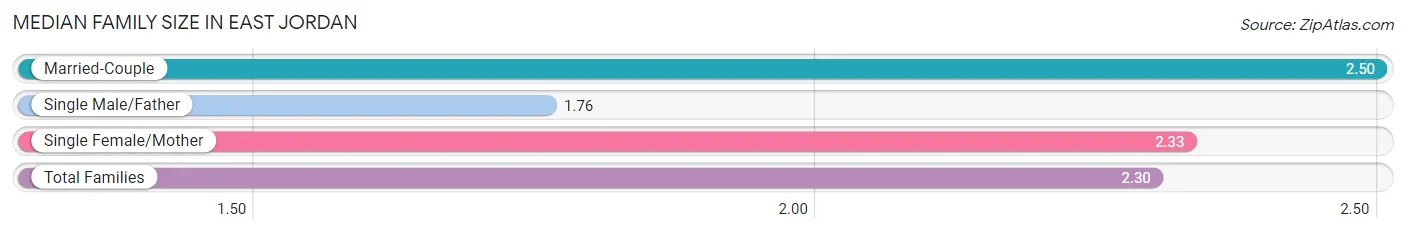
| Family Type | # Families | Family Size |
| Married-Couple | 311 (59.9%) | 2.50 |
| Single Male/Father | 118 (22.7%) | 1.76 |
| Single Female/Mother | 90 (17.3%) | 2.33 |
| Total Families | 519 (100.0%) | 2.30 |
Median Household Size in East Jordan
The median household size in East Jordan is 1.94 persons per household, with married-couple households (311 | 32.2%) accounting for the largest median household size of 2.52 persons per household. non-family households (448 | 46.3%) represent the smallest median household size with 1.45 persons per household.
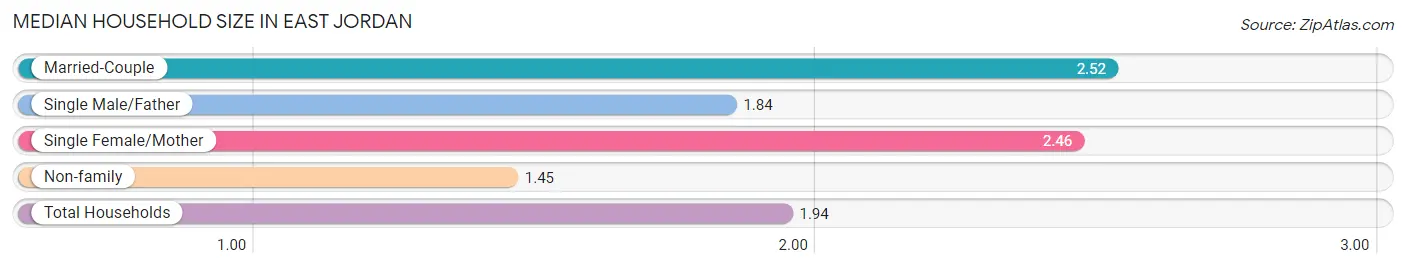
| Household Type | # Households | Household Size |
| Married-Couple | 311 (32.2%) | 2.52 |
| Single Male/Father | 118 (12.2%) | 1.84 |
| Single Female/Mother | 90 (9.3%) | 2.46 |
| Non-family | 448 (46.3%) | 1.45 |
| Total Households | 967 (100.0%) | 1.94 |
Household Size by Marriage Status in East Jordan
Out of a total of 967 households in East Jordan, 519 (53.7%) are family households, while 448 (46.3%) are nonfamily households. The most numerous type of family households are 2-person households, comprising 295, and the most common type of nonfamily households are 1-person households, comprising 317.
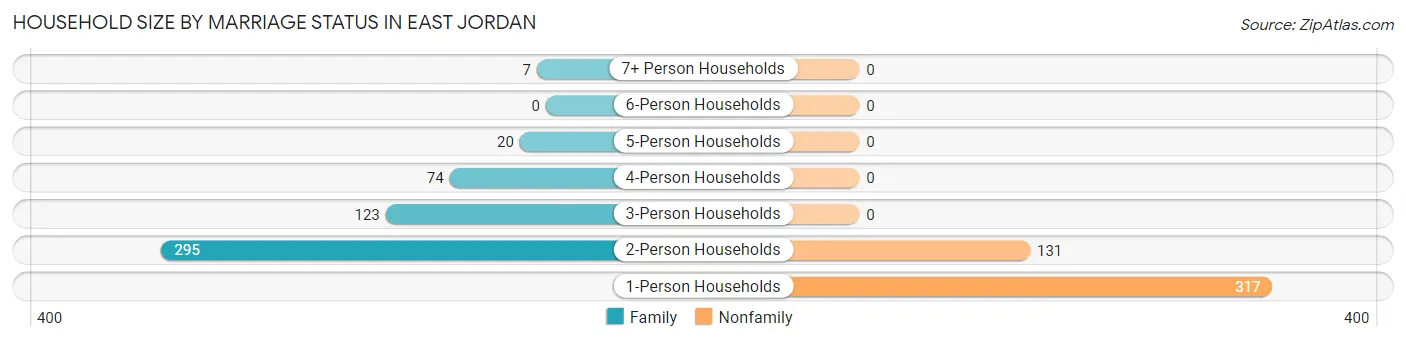
| Household Size | Family Households | Nonfamily Households |
| 1-Person Households | - | 317 (32.8%) |
| 2-Person Households | 295 (30.5%) | 131 (13.6%) |
| 3-Person Households | 123 (12.7%) | 0 (0.0%) |
| 4-Person Households | 74 (7.6%) | 0 (0.0%) |
| 5-Person Households | 20 (2.1%) | 0 (0.0%) |
| 6-Person Households | 0 (0.0%) | 0 (0.0%) |
| 7+ Person Households | 7 (0.7%) | 0 (0.0%) |
| Total | 519 (53.7%) | 448 (46.3%) |
Female Fertility in East Jordan
Fertility by Age in East Jordan
Average fertility rate in East Jordan is 18.0 births per 1,000 women. Women in the age bracket of 20 to 34 years have the highest fertility rate with 38.0 births per 1,000 women. Women in the age bracket of 20 to 34 years acount for 100.0% of all women with births.
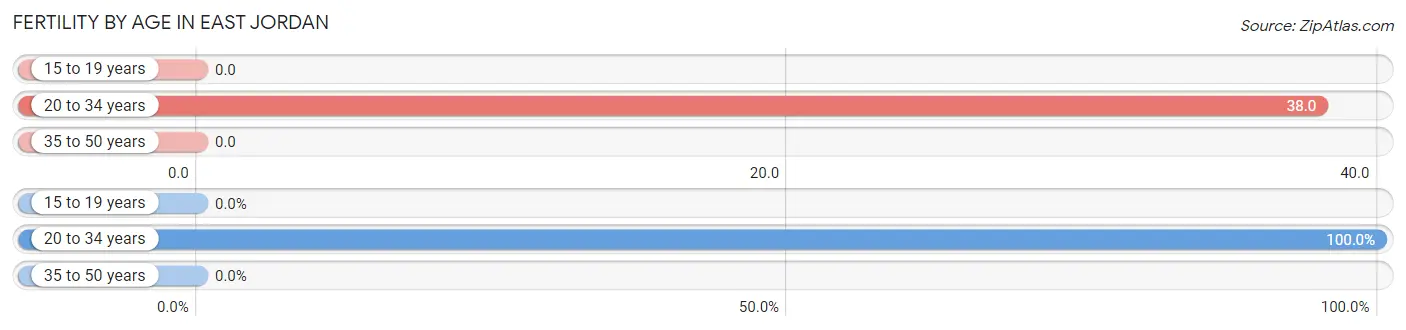
| Age Bracket | Women with Births | Births / 1,000 Women |
| 15 to 19 years | 0 (0.0%) | 0.0 |
| 20 to 34 years | 7 (100.0%) | 38.0 |
| 35 to 50 years | 0 (0.0%) | 0.0 |
| Total | 7 (100.0%) | 18.0 |
Fertility by Age by Marriage Status in East Jordan
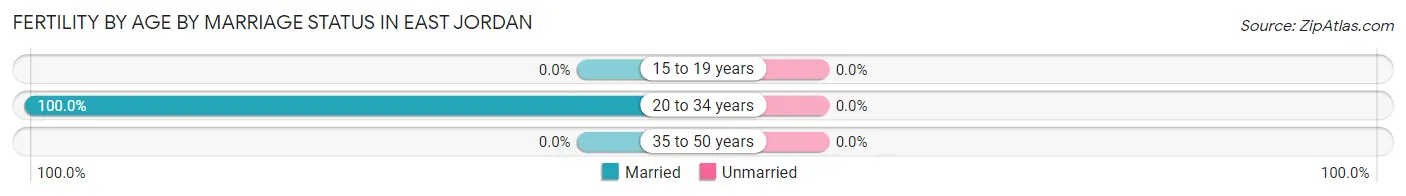
| Age Bracket | Married | Unmarried |
| 15 to 19 years | 0 (0.0%) | 0 (0.0%) |
| 20 to 34 years | 7 (100.0%) | 0 (0.0%) |
| 35 to 50 years | 0 (0.0%) | 0 (0.0%) |
| Total | 7 (100.0%) | 0 (0.0%) |
Fertility by Education in East Jordan
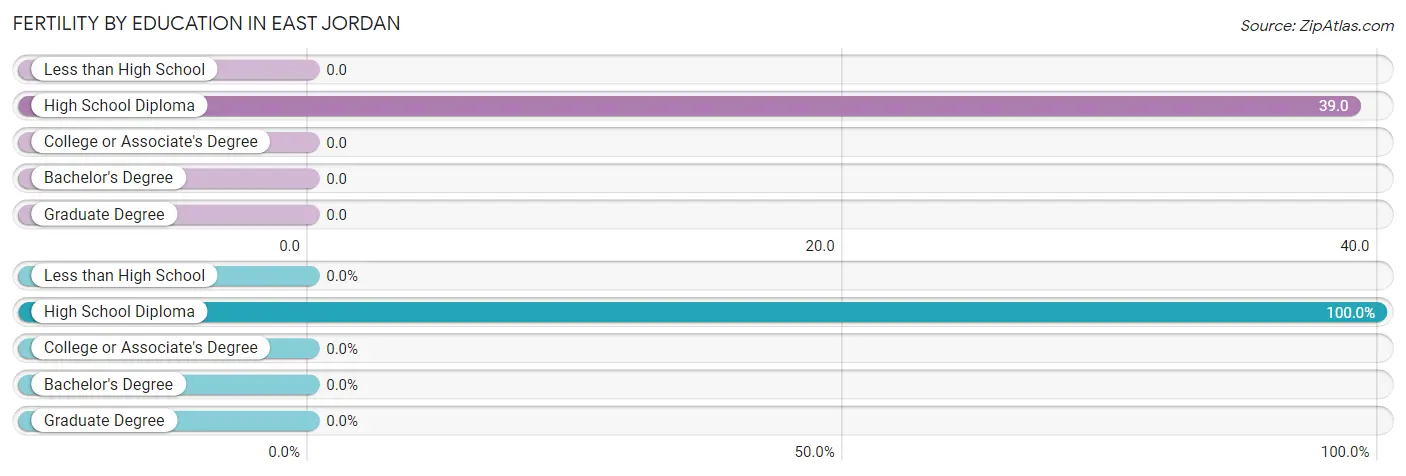
| Educational Attainment | Women with Births | Births / 1,000 Women |
| Less than High School | 0 (0.0%) | 0.0 |
| High School Diploma | 7 (100.0%) | 39.0 |
| College or Associate's Degree | 0 (0.0%) | 0.0 |
| Bachelor's Degree | 0 (0.0%) | 0.0 |
| Graduate Degree | 0 (0.0%) | 0.0 |
| Total | 7 (100.0%) | 18.0 |
Fertility by Education by Marriage Status in East Jordan
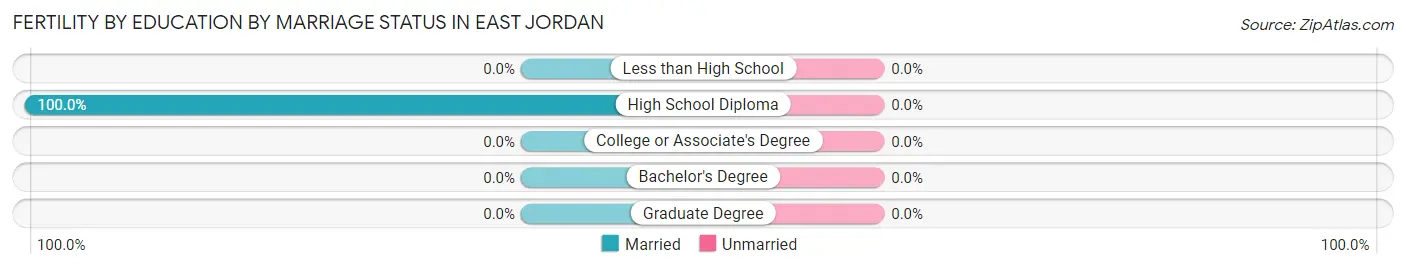
| Educational Attainment | Married | Unmarried |
| Less than High School | 0 (0.0%) | 0 (0.0%) |
| High School Diploma | 7 (100.0%) | 0 (0.0%) |
| College or Associate's Degree | 0 (0.0%) | 0 (0.0%) |
| Bachelor's Degree | 0 (0.0%) | 0 (0.0%) |
| Graduate Degree | 0 (0.0%) | 0 (0.0%) |
| Total | 7 (100.0%) | 0 (0.0%) |
Employment Characteristics in East Jordan
Employment by Class of Employer in East Jordan
Among the 1,084 employed individuals in East Jordan, private company employees (791 | 73.0%), self-employed (not incorporated) (72 | 6.6%), and not-for-profit organizations (72 | 6.6%) make up the most common classes of employment.
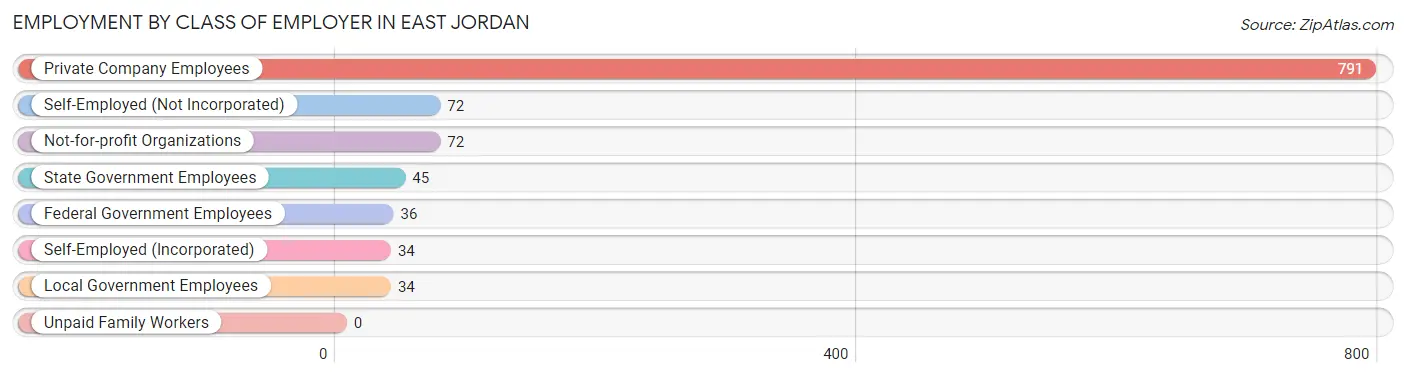
| Employer Class | # Employees | % Employees |
| Private Company Employees | 791 | 73.0% |
| Self-Employed (Incorporated) | 34 | 3.1% |
| Self-Employed (Not Incorporated) | 72 | 6.6% |
| Not-for-profit Organizations | 72 | 6.6% |
| Local Government Employees | 34 | 3.1% |
| State Government Employees | 45 | 4.2% |
| Federal Government Employees | 36 | 3.3% |
| Unpaid Family Workers | 0 | 0.0% |
| Total | 1,084 | 100.0% |
Employment Status by Age in East Jordan
According to the labor force statistics for East Jordan, out of the total population over 16 years of age (1,692), 69.2% or 1,171 individuals are in the labor force, with 3.8% or 44 of them unemployed. The age group with the highest labor force participation rate is 30 to 34 years, with 99.3% or 135 individuals in the labor force. Within the labor force, the 55 to 59 years age range has the highest percentage of unemployed individuals, with 17.0% or 16 of them being unemployed.
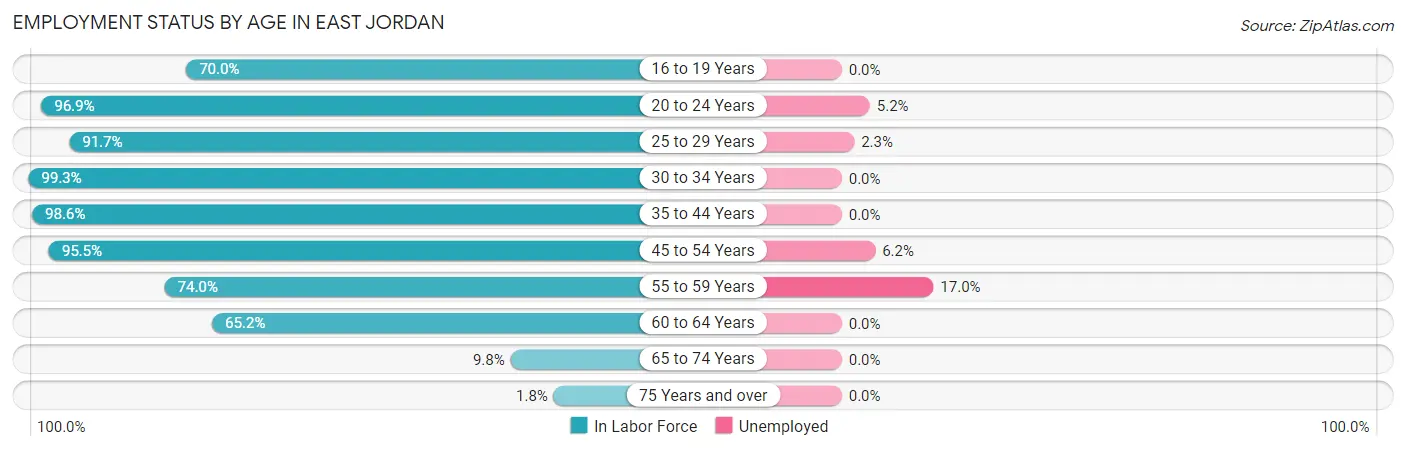
| Age Bracket | In Labor Force | Unemployed |
| 16 to 19 Years | 63 (70.0%) | 0 (0.0%) |
| 20 to 24 Years | 155 (96.9%) | 8 (5.2%) |
| 25 to 29 Years | 132 (91.7%) | 3 (2.3%) |
| 30 to 34 Years | 135 (99.3%) | 0 (0.0%) |
| 35 to 44 Years | 206 (98.6%) | 0 (0.0%) |
| 45 to 54 Years | 273 (95.5%) | 17 (6.2%) |
| 55 to 59 Years | 94 (74.0%) | 16 (17.0%) |
| 60 to 64 Years | 86 (65.2%) | 0 (0.0%) |
| 65 to 74 Years | 24 (9.8%) | 0 (0.0%) |
| 75 Years and over | 3 (1.8%) | 0 (0.0%) |
| Total | 1,171 (69.2%) | 44 (3.8%) |
Employment Status by Educational Attainment in East Jordan
According to labor force statistics for East Jordan, 89.6% of individuals (926) out of the total population between 25 and 64 years of age (1,034) are in the labor force, with 3.9% or 36 of them being unemployed. The group with the highest labor force participation rate are those with the educational attainment of high school diploma, with 96.6% or 428 individuals in the labor force. Within the labor force, individuals with high school diploma education have the highest percentage of unemployment, with 7.7% or 33 of them being unemployed.
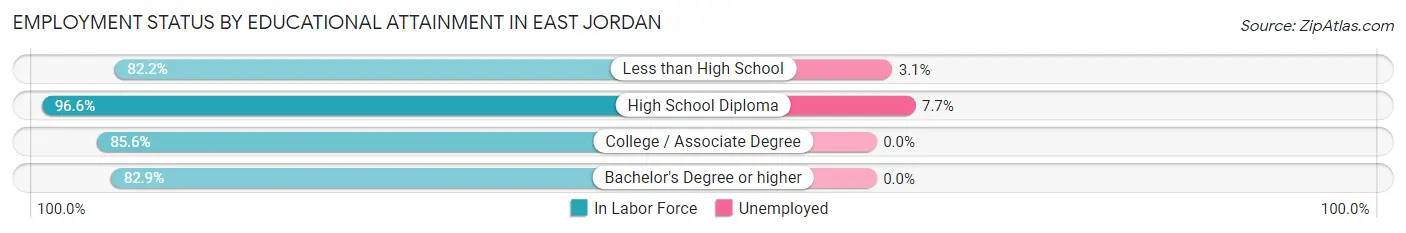
| Educational Attainment | In Labor Force | Unemployed |
| Less than High School | 97 (82.2%) | 4 (3.1%) |
| High School Diploma | 428 (96.6%) | 34 (7.7%) |
| College / Associate Degree | 280 (85.6%) | 0 (0.0%) |
| Bachelor's Degree or higher | 121 (82.9%) | 0 (0.0%) |
| Total | 926 (89.6%) | 40 (3.9%) |
Employment Occupations by Sex in East Jordan
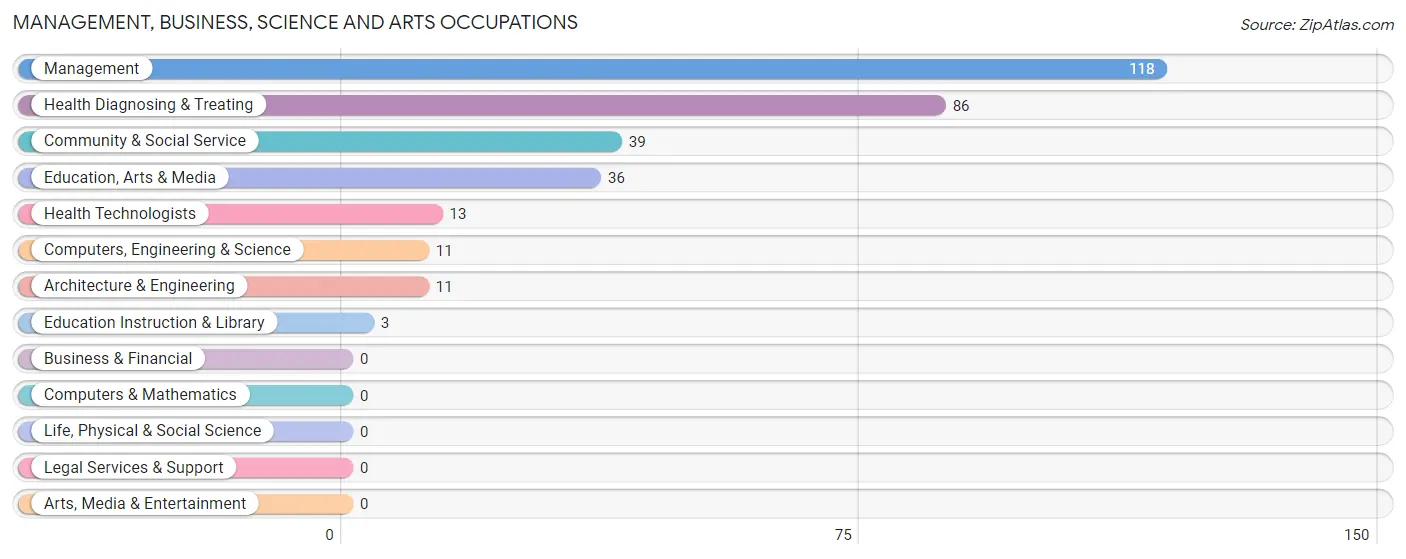
Management, Business, Science and Arts Occupations
The most common Management, Business, Science and Arts occupations in East Jordan are Management (118 | 10.5%), Health Diagnosing & Treating (86 | 7.6%), Community & Social Service (39 | 3.5%), Education, Arts & Media (36 | 3.2%), and Health Technologists (13 | 1.1%).
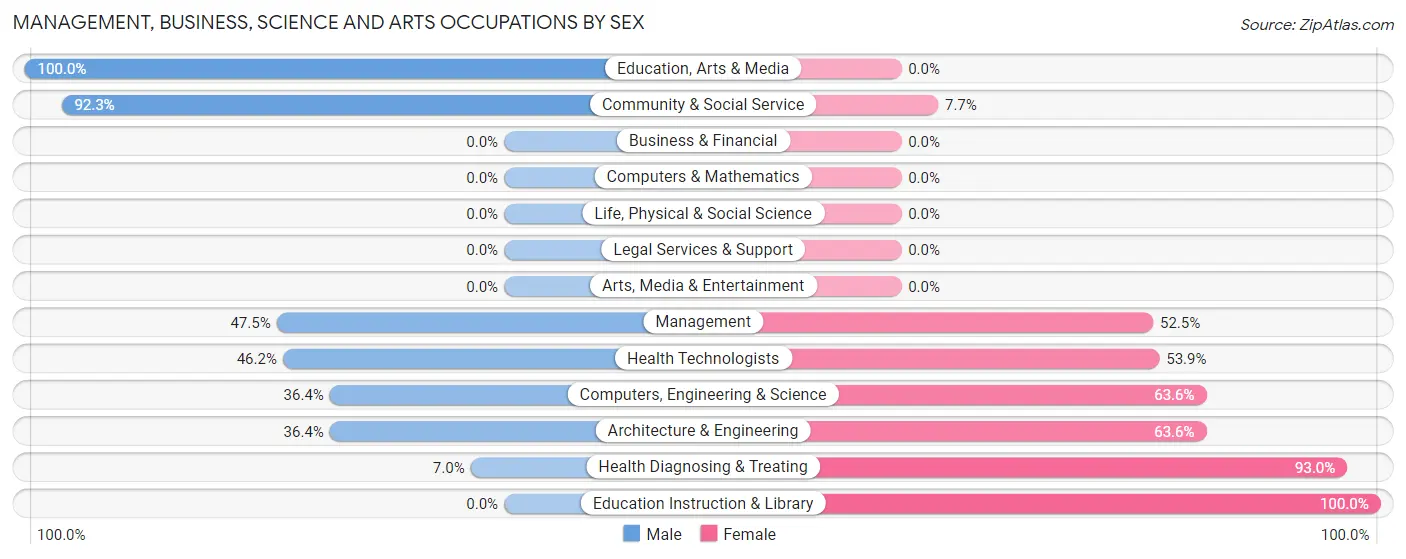
Management, Business, Science and Arts Occupations by Sex
Within the Management, Business, Science and Arts occupations in East Jordan, the most male-oriented occupations are Education, Arts & Media (100.0%), Community & Social Service (92.3%), and Management (47.5%), while the most female-oriented occupations are Education Instruction & Library (100.0%), Health Diagnosing & Treating (93.0%), and Computers, Engineering & Science (63.6%).
| Occupation | Male | Female |
| Management | 56 (47.5%) | 62 (52.5%) |
| Business & Financial | 0 (0.0%) | 0 (0.0%) |
| Computers, Engineering & Science | 4 (36.4%) | 7 (63.6%) |
| Computers & Mathematics | 0 (0.0%) | 0 (0.0%) |
| Architecture & Engineering | 4 (36.4%) | 7 (63.6%) |
| Life, Physical & Social Science | 0 (0.0%) | 0 (0.0%) |
| Community & Social Service | 36 (92.3%) | 3 (7.7%) |
| Education, Arts & Media | 36 (100.0%) | 0 (0.0%) |
| Legal Services & Support | 0 (0.0%) | 0 (0.0%) |
| Education Instruction & Library | 0 (0.0%) | 3 (100.0%) |
| Arts, Media & Entertainment | 0 (0.0%) | 0 (0.0%) |
| Health Diagnosing & Treating | 6 (7.0%) | 80 (93.0%) |
| Health Technologists | 6 (46.2%) | 7 (53.8%) |
| Total (Category) | 102 (40.2%) | 152 (59.8%) |
| Total (Overall) | 675 (59.9%) | 452 (40.1%) |
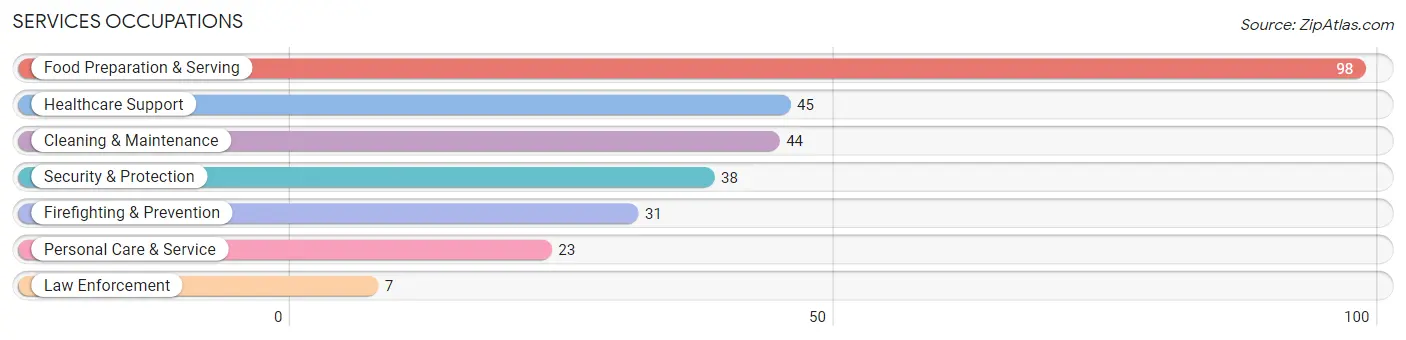
Services Occupations
The most common Services occupations in East Jordan are Food Preparation & Serving (98 | 8.7%), Healthcare Support (45 | 4.0%), Cleaning & Maintenance (44 | 3.9%), Security & Protection (38 | 3.4%), and Firefighting & Prevention (31 | 2.8%).
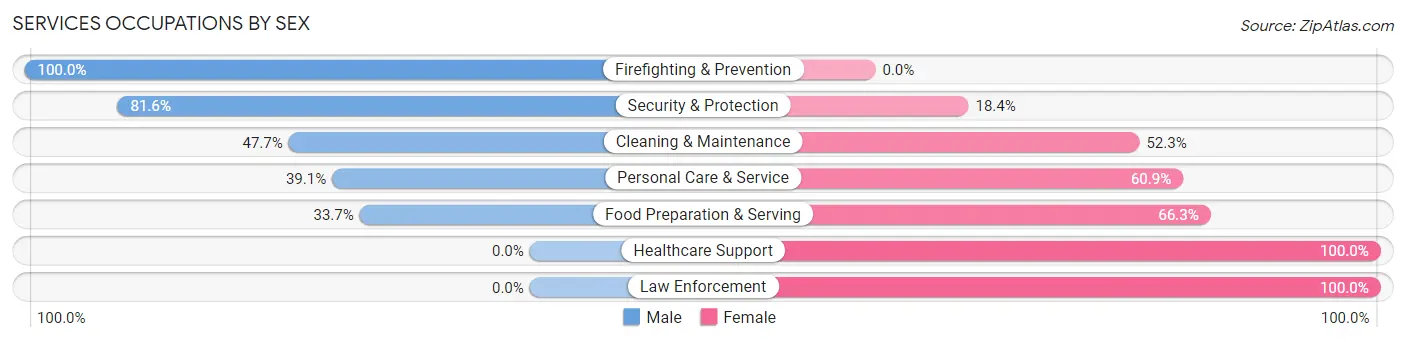
Services Occupations by Sex
Within the Services occupations in East Jordan, the most male-oriented occupations are Firefighting & Prevention (100.0%), Security & Protection (81.6%), and Cleaning & Maintenance (47.7%), while the most female-oriented occupations are Healthcare Support (100.0%), Law Enforcement (100.0%), and Food Preparation & Serving (66.3%).
| Occupation | Male | Female |
| Healthcare Support | 0 (0.0%) | 45 (100.0%) |
| Security & Protection | 31 (81.6%) | 7 (18.4%) |
| Firefighting & Prevention | 31 (100.0%) | 0 (0.0%) |
| Law Enforcement | 0 (0.0%) | 7 (100.0%) |
| Food Preparation & Serving | 33 (33.7%) | 65 (66.3%) |
| Cleaning & Maintenance | 21 (47.7%) | 23 (52.3%) |
| Personal Care & Service | 9 (39.1%) | 14 (60.9%) |
| Total (Category) | 94 (37.9%) | 154 (62.1%) |
| Total (Overall) | 675 (59.9%) | 452 (40.1%) |
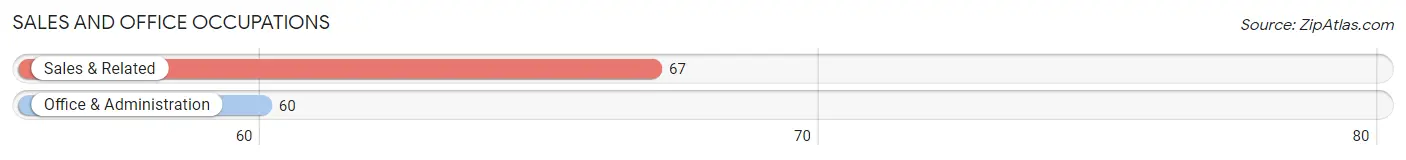
Sales and Office Occupations
The most common Sales and Office occupations in East Jordan are Sales & Related (67 | 5.9%), and Office & Administration (60 | 5.3%).
Sales and Office Occupations by Sex
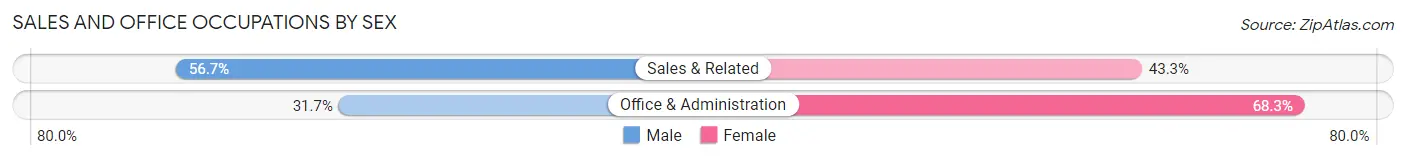
| Occupation | Male | Female |
| Sales & Related | 38 (56.7%) | 29 (43.3%) |
| Office & Administration | 19 (31.7%) | 41 (68.3%) |
| Total (Category) | 57 (44.9%) | 70 (55.1%) |
| Total (Overall) | 675 (59.9%) | 452 (40.1%) |
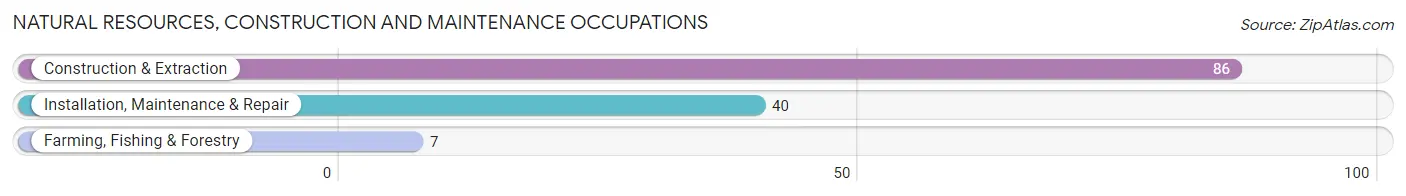
Natural Resources, Construction and Maintenance Occupations
The most common Natural Resources, Construction and Maintenance occupations in East Jordan are Construction & Extraction (86 | 7.6%), Installation, Maintenance & Repair (40 | 3.5%), and Farming, Fishing & Forestry (7 | 0.6%).
Natural Resources, Construction and Maintenance Occupations by Sex
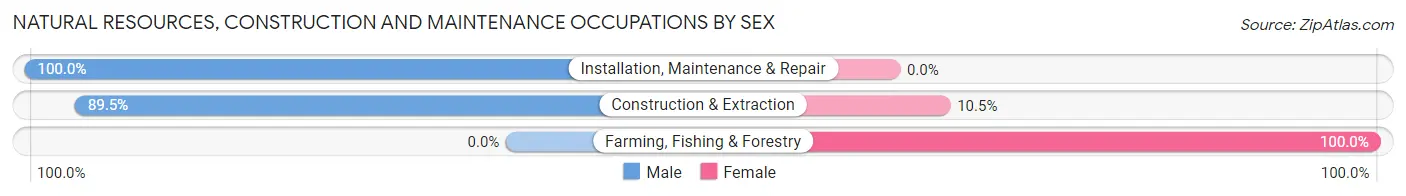
| Occupation | Male | Female |
| Farming, Fishing & Forestry | 0 (0.0%) | 7 (100.0%) |
| Construction & Extraction | 77 (89.5%) | 9 (10.5%) |
| Installation, Maintenance & Repair | 40 (100.0%) | 0 (0.0%) |
| Total (Category) | 117 (88.0%) | 16 (12.0%) |
| Total (Overall) | 675 (59.9%) | 452 (40.1%) |
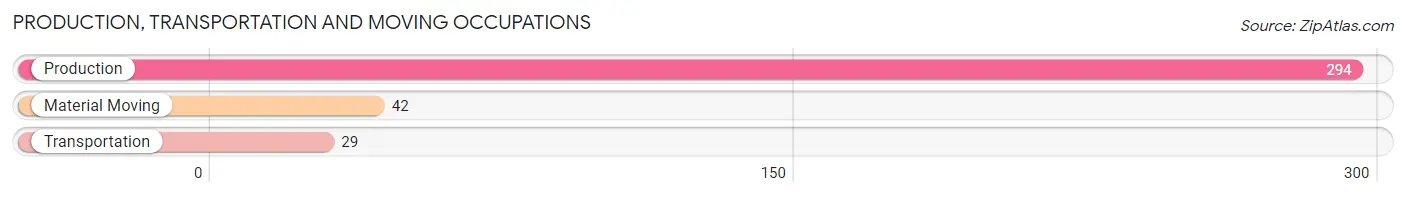
Production, Transportation and Moving Occupations
The most common Production, Transportation and Moving occupations in East Jordan are Production (294 | 26.1%), Material Moving (42 | 3.7%), and Transportation (29 | 2.6%).
Production, Transportation and Moving Occupations by Sex
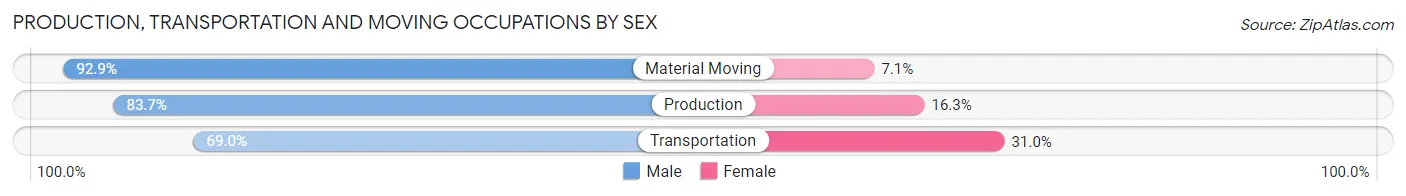
| Occupation | Male | Female |
| Production | 246 (83.7%) | 48 (16.3%) |
| Transportation | 20 (69.0%) | 9 (31.0%) |
| Material Moving | 39 (92.9%) | 3 (7.1%) |
| Total (Category) | 305 (83.6%) | 60 (16.4%) |
| Total (Overall) | 675 (59.9%) | 452 (40.1%) |
Employment Industries by Sex in East Jordan
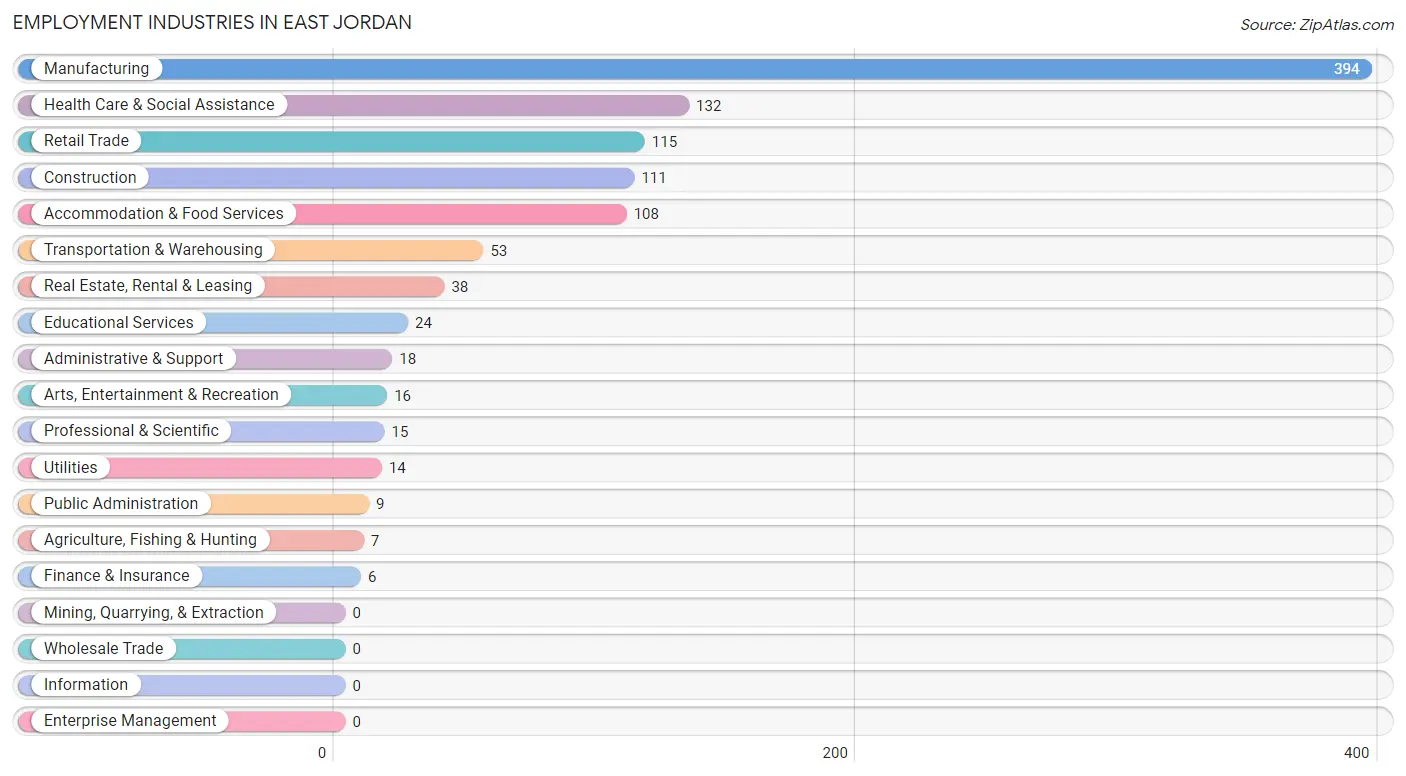
Employment Industries in East Jordan
The major employment industries in East Jordan include Manufacturing (394 | 35.0%), Health Care & Social Assistance (132 | 11.7%), Retail Trade (115 | 10.2%), Construction (111 | 9.9%), and Accommodation & Food Services (108 | 9.6%).
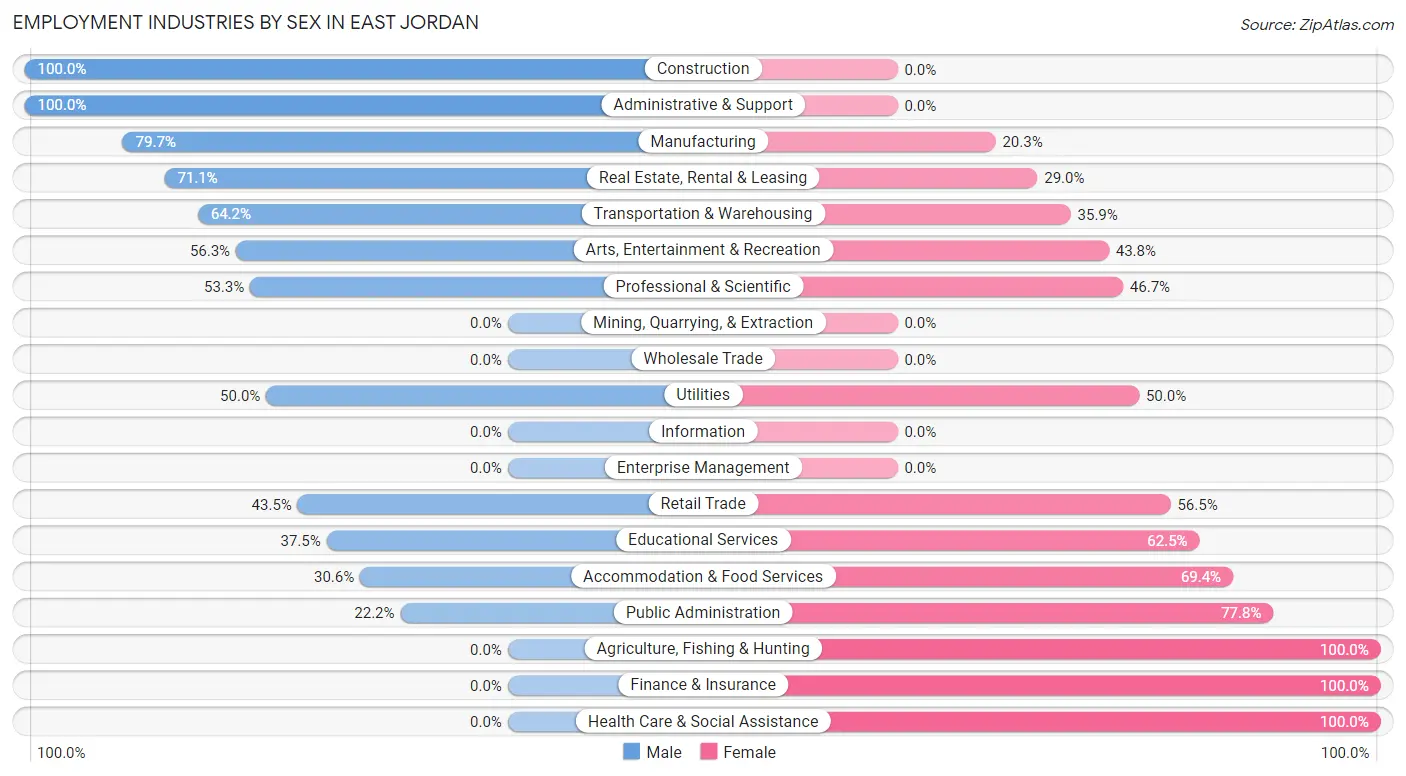
Employment Industries by Sex in East Jordan
The East Jordan industries that see more men than women are Construction (100.0%), Administrative & Support (100.0%), and Manufacturing (79.7%), whereas the industries that tend to have a higher number of women are Agriculture, Fishing & Hunting (100.0%), Finance & Insurance (100.0%), and Health Care & Social Assistance (100.0%).
| Industry | Male | Female |
| Agriculture, Fishing & Hunting | 0 (0.0%) | 7 (100.0%) |
| Mining, Quarrying, & Extraction | 0 (0.0%) | 0 (0.0%) |
| Construction | 111 (100.0%) | 0 (0.0%) |
| Manufacturing | 314 (79.7%) | 80 (20.3%) |
| Wholesale Trade | 0 (0.0%) | 0 (0.0%) |
| Retail Trade | 50 (43.5%) | 65 (56.5%) |
| Transportation & Warehousing | 34 (64.1%) | 19 (35.8%) |
| Utilities | 7 (50.0%) | 7 (50.0%) |
| Information | 0 (0.0%) | 0 (0.0%) |
| Finance & Insurance | 0 (0.0%) | 6 (100.0%) |
| Real Estate, Rental & Leasing | 27 (71.1%) | 11 (28.9%) |
| Professional & Scientific | 8 (53.3%) | 7 (46.7%) |
| Enterprise Management | 0 (0.0%) | 0 (0.0%) |
| Administrative & Support | 18 (100.0%) | 0 (0.0%) |
| Educational Services | 9 (37.5%) | 15 (62.5%) |
| Health Care & Social Assistance | 0 (0.0%) | 132 (100.0%) |
| Arts, Entertainment & Recreation | 9 (56.2%) | 7 (43.8%) |
| Accommodation & Food Services | 33 (30.6%) | 75 (69.4%) |
| Public Administration | 2 (22.2%) | 7 (77.8%) |
| Total | 675 (59.9%) | 452 (40.1%) |
Education in East Jordan
School Enrollment in East Jordan
The most common levels of schooling among the 253 students in East Jordan are high school (92 | 36.4%), elementary school (48 | 19.0%), and kindergarten (27 | 10.7%).
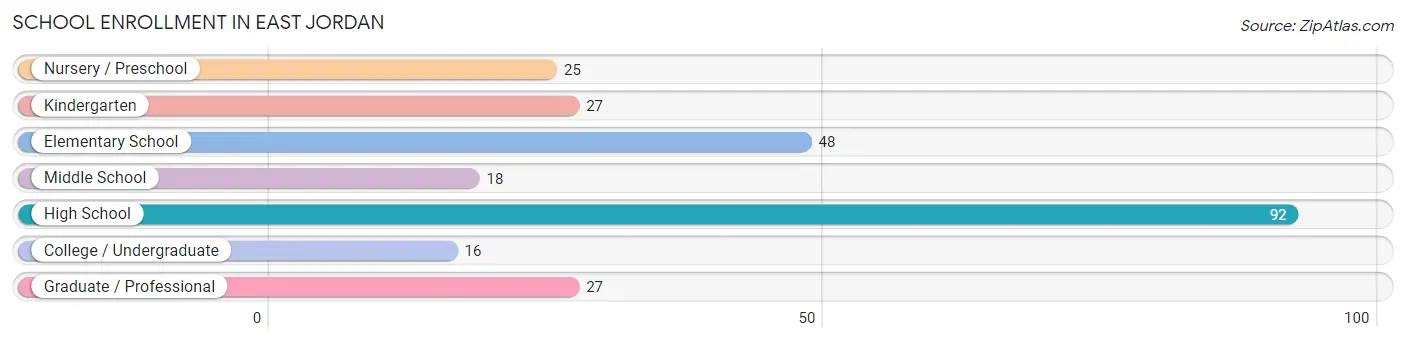
| School Level | # Students | % Students |
| Nursery / Preschool | 25 | 9.9% |
| Kindergarten | 27 | 10.7% |
| Elementary School | 48 | 19.0% |
| Middle School | 18 | 7.1% |
| High School | 92 | 36.4% |
| College / Undergraduate | 16 | 6.3% |
| Graduate / Professional | 27 | 10.7% |
| Total | 253 | 100.0% |
School Enrollment by Age by Funding Source in East Jordan
Out of a total of 253 students who are enrolled in schools in East Jordan, 6 (2.4%) attend a private institution, while the remaining 247 (97.6%) are enrolled in public schools. The age group of 5 to 9 year old has the highest likelihood of being enrolled in private schools, with 6 (7.0% in the age bracket) enrolled. Conversely, the age group of 3 to 4 year olds has the lowest likelihood of being enrolled in a private school, with 14 (100.0% in the age bracket) attending a public institution.
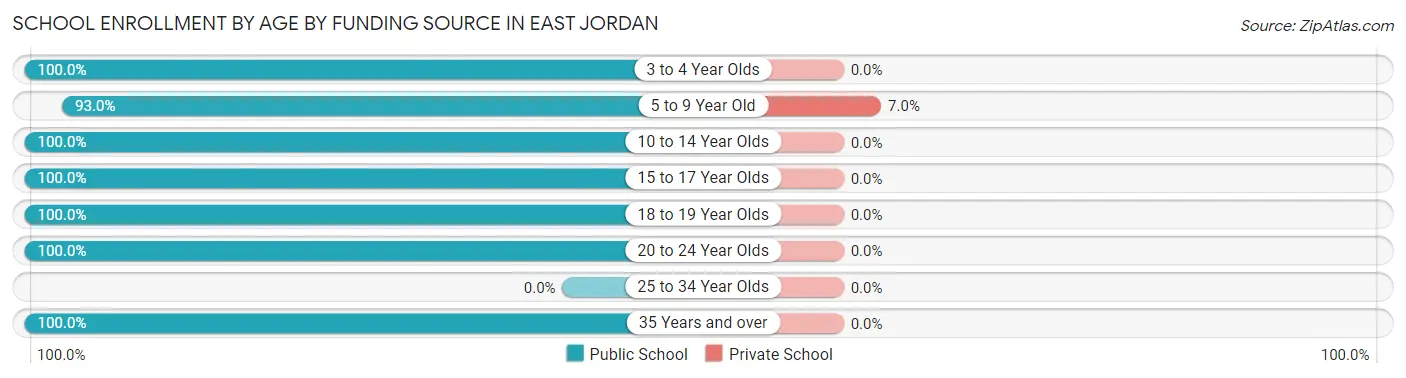
| Age Bracket | Public School | Private School |
| 3 to 4 Year Olds | 14 (100.0%) | 0 (0.0%) |
| 5 to 9 Year Old | 80 (93.0%) | 6 (7.0%) |
| 10 to 14 Year Olds | 42 (100.0%) | 0 (0.0%) |
| 15 to 17 Year Olds | 64 (100.0%) | 0 (0.0%) |
| 18 to 19 Year Olds | 7 (100.0%) | 0 (0.0%) |
| 20 to 24 Year Olds | 13 (100.0%) | 0 (0.0%) |
| 25 to 34 Year Olds | 0 (0.0%) | 0 (0.0%) |
| 35 Years and over | 27 (100.0%) | 0 (0.0%) |
| Total | 247 (97.6%) | 6 (2.4%) |
Educational Attainment by Field of Study in East Jordan
Business (46 | 21.4%), education (37 | 17.2%), science & technology (34 | 15.8%), psychology (18 | 8.4%), and physical & health sciences (14 | 6.5%) are the most common fields of study among 215 individuals in East Jordan who have obtained a bachelor's degree or higher.
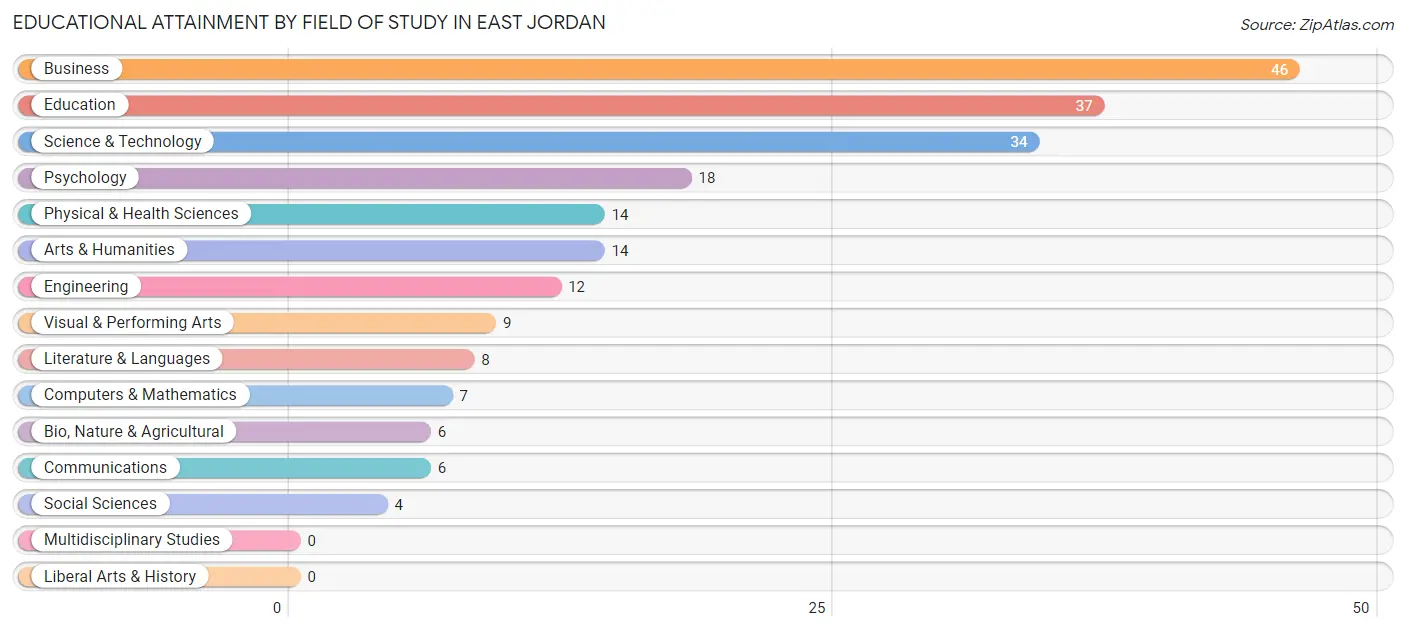
| Field of Study | # Graduates | % Graduates |
| Computers & Mathematics | 7 | 3.3% |
| Bio, Nature & Agricultural | 6 | 2.8% |
| Physical & Health Sciences | 14 | 6.5% |
| Psychology | 18 | 8.4% |
| Social Sciences | 4 | 1.9% |
| Engineering | 12 | 5.6% |
| Multidisciplinary Studies | 0 | 0.0% |
| Science & Technology | 34 | 15.8% |
| Business | 46 | 21.4% |
| Education | 37 | 17.2% |
| Literature & Languages | 8 | 3.7% |
| Liberal Arts & History | 0 | 0.0% |
| Visual & Performing Arts | 9 | 4.2% |
| Communications | 6 | 2.8% |
| Arts & Humanities | 14 | 6.5% |
| Total | 215 | 100.0% |
Transportation & Commute in East Jordan
Vehicle Availability by Sex in East Jordan
The most prevalent vehicle ownership categories in East Jordan are males with 2 vehicles (418, accounting for 64.2%) and females with 2 vehicles (198, making up 96.5%).
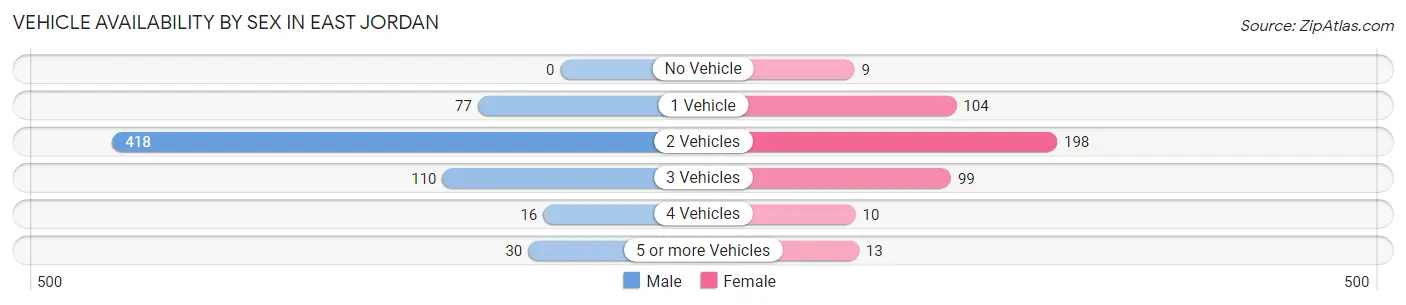
| Vehicles Available | Male | Female |
| No Vehicle | 0 (0.0%) | 9 (2.1%) |
| 1 Vehicle | 77 (11.8%) | 104 (24.0%) |
| 2 Vehicles | 418 (64.2%) | 198 (45.7%) |
| 3 Vehicles | 110 (16.9%) | 99 (22.9%) |
| 4 Vehicles | 16 (2.5%) | 10 (2.3%) |
| 5 or more Vehicles | 30 (4.6%) | 13 (3.0%) |
| Total | 651 (100.0%) | 433 (100.0%) |
Commute Time in East Jordan
The most frequently occuring commute durations in East Jordan are 20 to 24 minutes (427 commuters, 40.2%), 5 to 9 minutes (134 commuters, 12.6%), and 10 to 14 minutes (112 commuters, 10.5%).
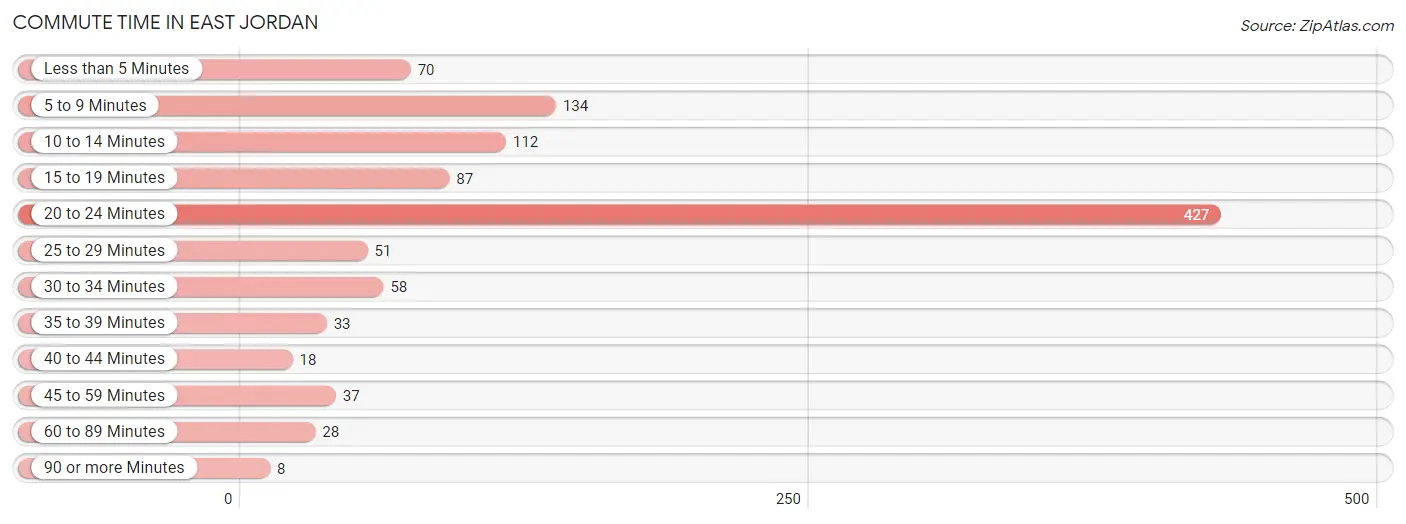
| Commute Time | # Commuters | % Commuters |
| Less than 5 Minutes | 70 | 6.6% |
| 5 to 9 Minutes | 134 | 12.6% |
| 10 to 14 Minutes | 112 | 10.5% |
| 15 to 19 Minutes | 87 | 8.2% |
| 20 to 24 Minutes | 427 | 40.2% |
| 25 to 29 Minutes | 51 | 4.8% |
| 30 to 34 Minutes | 58 | 5.5% |
| 35 to 39 Minutes | 33 | 3.1% |
| 40 to 44 Minutes | 18 | 1.7% |
| 45 to 59 Minutes | 37 | 3.5% |
| 60 to 89 Minutes | 28 | 2.6% |
| 90 or more Minutes | 8 | 0.7% |
Commute Time by Sex in East Jordan
The most common commute times in East Jordan are 20 to 24 minutes (258 commuters, 40.1%) for males and 20 to 24 minutes (169 commuters, 40.2%) for females.
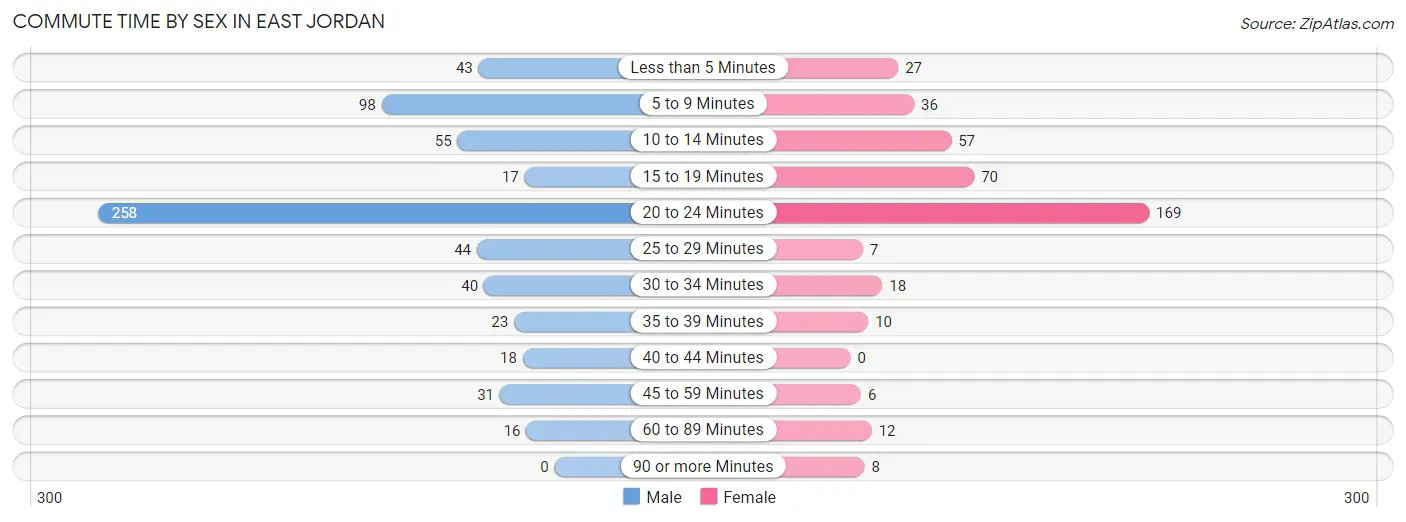
| Commute Time | Male | Female |
| Less than 5 Minutes | 43 (6.7%) | 27 (6.4%) |
| 5 to 9 Minutes | 98 (15.2%) | 36 (8.6%) |
| 10 to 14 Minutes | 55 (8.6%) | 57 (13.6%) |
| 15 to 19 Minutes | 17 (2.6%) | 70 (16.7%) |
| 20 to 24 Minutes | 258 (40.1%) | 169 (40.2%) |
| 25 to 29 Minutes | 44 (6.8%) | 7 (1.7%) |
| 30 to 34 Minutes | 40 (6.2%) | 18 (4.3%) |
| 35 to 39 Minutes | 23 (3.6%) | 10 (2.4%) |
| 40 to 44 Minutes | 18 (2.8%) | 0 (0.0%) |
| 45 to 59 Minutes | 31 (4.8%) | 6 (1.4%) |
| 60 to 89 Minutes | 16 (2.5%) | 12 (2.9%) |
| 90 or more Minutes | 0 (0.0%) | 8 (1.9%) |
Time of Departure to Work by Sex in East Jordan
The most frequent times of departure to work in East Jordan are 4:00 PM to 11:59 PM (168, 26.1%) for males and 7:00 AM to 7:29 AM (69, 16.4%) for females.
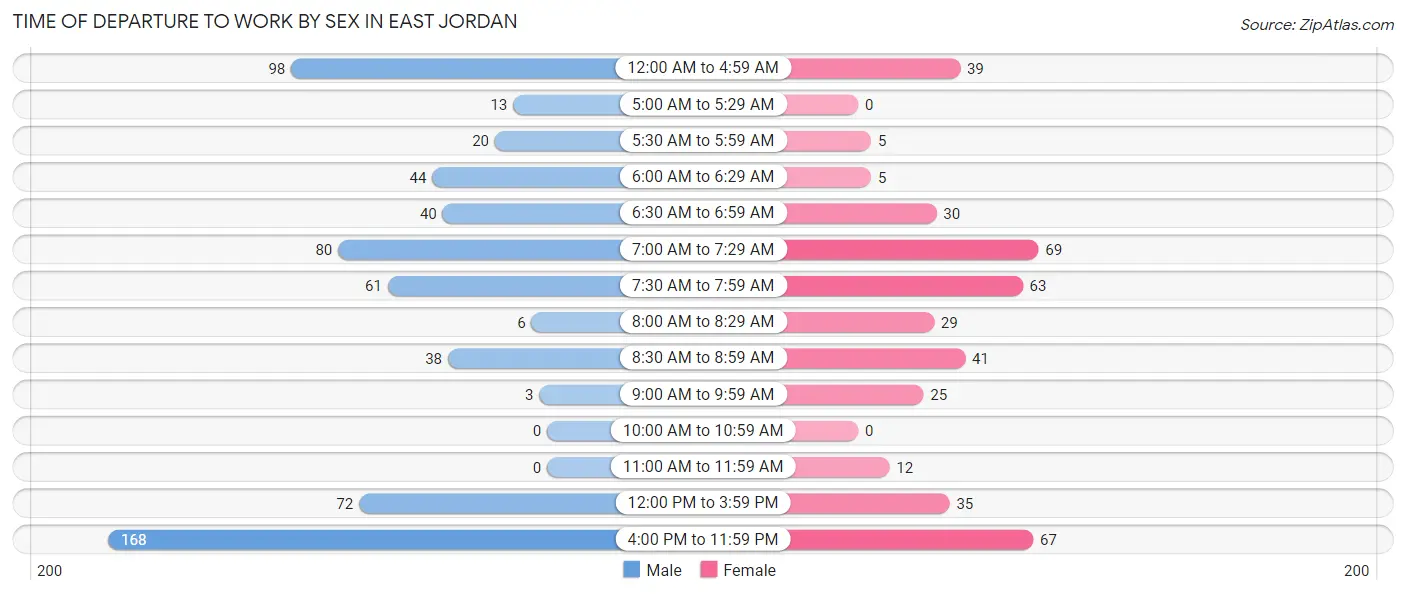
| Time of Departure | Male | Female |
| 12:00 AM to 4:59 AM | 98 (15.2%) | 39 (9.3%) |
| 5:00 AM to 5:29 AM | 13 (2.0%) | 0 (0.0%) |
| 5:30 AM to 5:59 AM | 20 (3.1%) | 5 (1.2%) |
| 6:00 AM to 6:29 AM | 44 (6.8%) | 5 (1.2%) |
| 6:30 AM to 6:59 AM | 40 (6.2%) | 30 (7.1%) |
| 7:00 AM to 7:29 AM | 80 (12.4%) | 69 (16.4%) |
| 7:30 AM to 7:59 AM | 61 (9.5%) | 63 (15.0%) |
| 8:00 AM to 8:29 AM | 6 (0.9%) | 29 (6.9%) |
| 8:30 AM to 8:59 AM | 38 (5.9%) | 41 (9.8%) |
| 9:00 AM to 9:59 AM | 3 (0.5%) | 25 (5.9%) |
| 10:00 AM to 10:59 AM | 0 (0.0%) | 0 (0.0%) |
| 11:00 AM to 11:59 AM | 0 (0.0%) | 12 (2.9%) |
| 12:00 PM to 3:59 PM | 72 (11.2%) | 35 (8.3%) |
| 4:00 PM to 11:59 PM | 168 (26.1%) | 67 (16.0%) |
| Total | 643 (100.0%) | 420 (100.0%) |
Housing Occupancy in East Jordan
Occupancy by Ownership in East Jordan
Of the total 967 dwellings in East Jordan, owner-occupied units account for 787 (81.4%), while renter-occupied units make up 180 (18.6%).
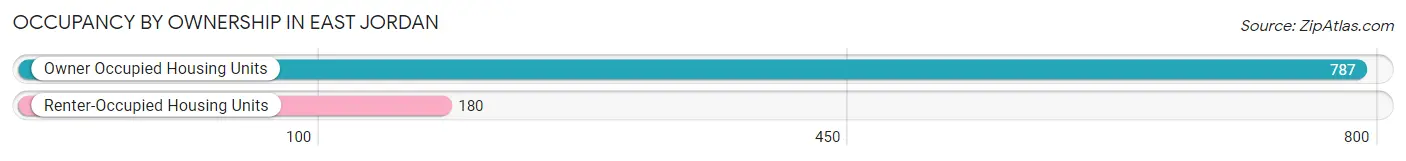
| Occupancy | # Housing Units | % Housing Units |
| Owner Occupied Housing Units | 787 | 81.4% |
| Renter-Occupied Housing Units | 180 | 18.6% |
| Total Occupied Housing Units | 967 | 100.0% |
Occupancy by Household Size in East Jordan
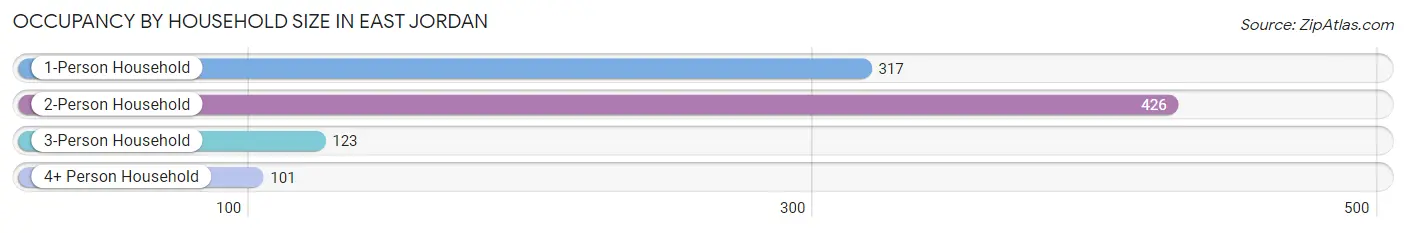
| Household Size | # Housing Units | % Housing Units |
| 1-Person Household | 317 | 32.8% |
| 2-Person Household | 426 | 44.1% |
| 3-Person Household | 123 | 12.7% |
| 4+ Person Household | 101 | 10.4% |
| Total Housing Units | 967 | 100.0% |
Occupancy by Ownership by Household Size in East Jordan
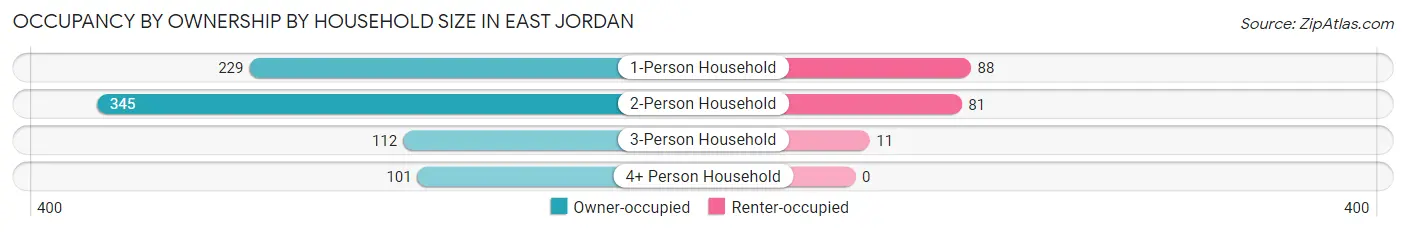
| Household Size | Owner-occupied | Renter-occupied |
| 1-Person Household | 229 (72.2%) | 88 (27.8%) |
| 2-Person Household | 345 (81.0%) | 81 (19.0%) |
| 3-Person Household | 112 (91.1%) | 11 (8.9%) |
| 4+ Person Household | 101 (100.0%) | 0 (0.0%) |
| Total Housing Units | 787 (81.4%) | 180 (18.6%) |
Occupancy by Educational Attainment in East Jordan

| Household Size | Owner-occupied | Renter-occupied |
| Less than High School | 112 (74.7%) | 38 (25.3%) |
| High School Diploma | 309 (79.4%) | 80 (20.6%) |
| College/Associate Degree | 240 (79.5%) | 62 (20.5%) |
| Bachelor's Degree or higher | 126 (100.0%) | 0 (0.0%) |
Occupancy by Age of Householder in East Jordan
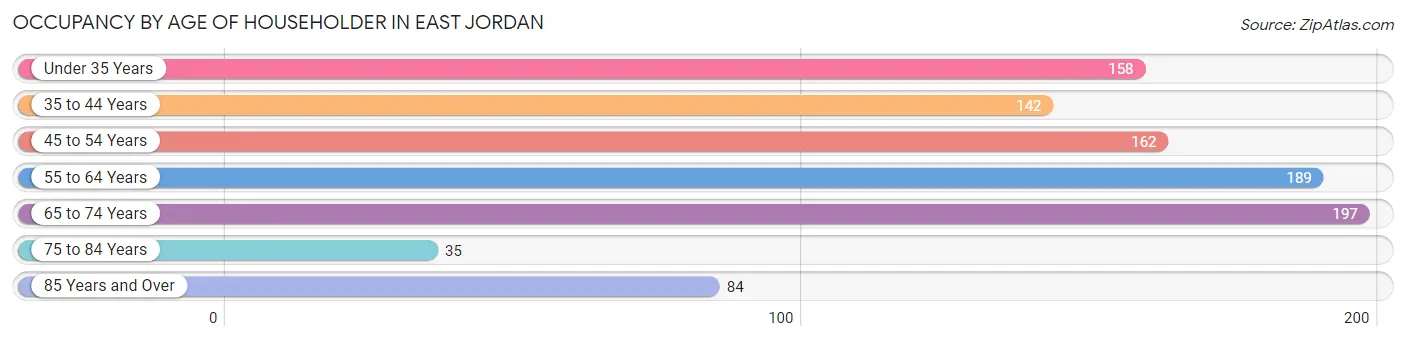
| Age Bracket | # Households | % Households |
| Under 35 Years | 158 | 16.3% |
| 35 to 44 Years | 142 | 14.7% |
| 45 to 54 Years | 162 | 16.8% |
| 55 to 64 Years | 189 | 19.5% |
| 65 to 74 Years | 197 | 20.4% |
| 75 to 84 Years | 35 | 3.6% |
| 85 Years and Over | 84 | 8.7% |
| Total | 967 | 100.0% |
Housing Finances in East Jordan
Median Income by Occupancy in East Jordan
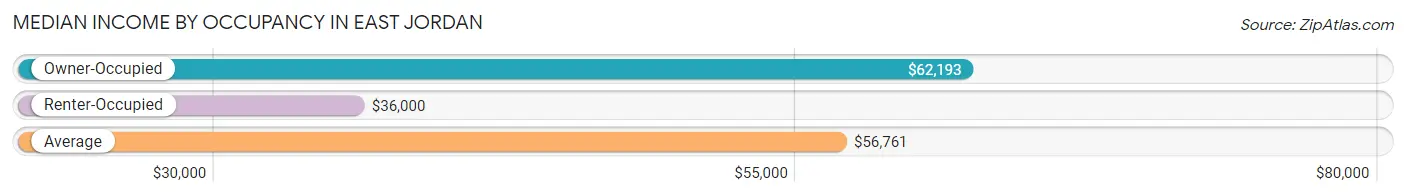
| Occupancy Type | # Households | Median Income |
| Owner-Occupied | 787 (81.4%) | $62,193 |
| Renter-Occupied | 180 (18.6%) | $36,000 |
| Average | 967 (100.0%) | $56,761 |
Occupancy by Householder Income Bracket in East Jordan
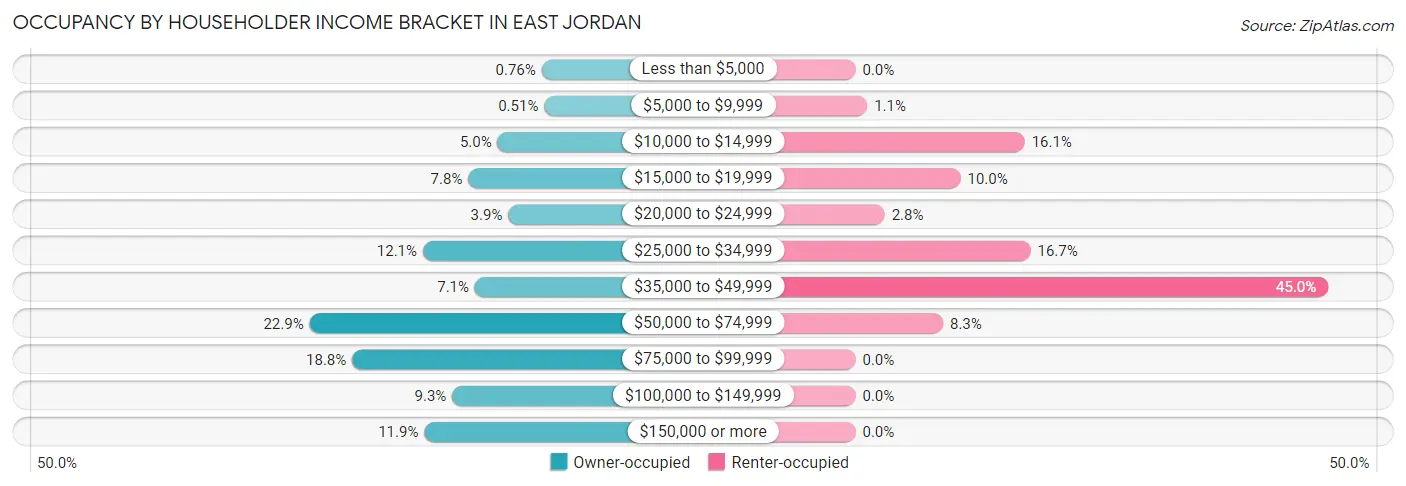
| Income Bracket | Owner-occupied | Renter-occupied |
| Less than $5,000 | 6 (0.8%) | 0 (0.0%) |
| $5,000 to $9,999 | 4 (0.5%) | 2 (1.1%) |
| $10,000 to $14,999 | 39 (5.0%) | 29 (16.1%) |
| $15,000 to $19,999 | 61 (7.7%) | 18 (10.0%) |
| $20,000 to $24,999 | 31 (3.9%) | 5 (2.8%) |
| $25,000 to $34,999 | 95 (12.1%) | 30 (16.7%) |
| $35,000 to $49,999 | 56 (7.1%) | 81 (45.0%) |
| $50,000 to $74,999 | 180 (22.9%) | 15 (8.3%) |
| $75,000 to $99,999 | 148 (18.8%) | 0 (0.0%) |
| $100,000 to $149,999 | 73 (9.3%) | 0 (0.0%) |
| $150,000 or more | 94 (11.9%) | 0 (0.0%) |
| Total | 787 (100.0%) | 180 (100.0%) |
Monthly Housing Cost Tiers in East Jordan
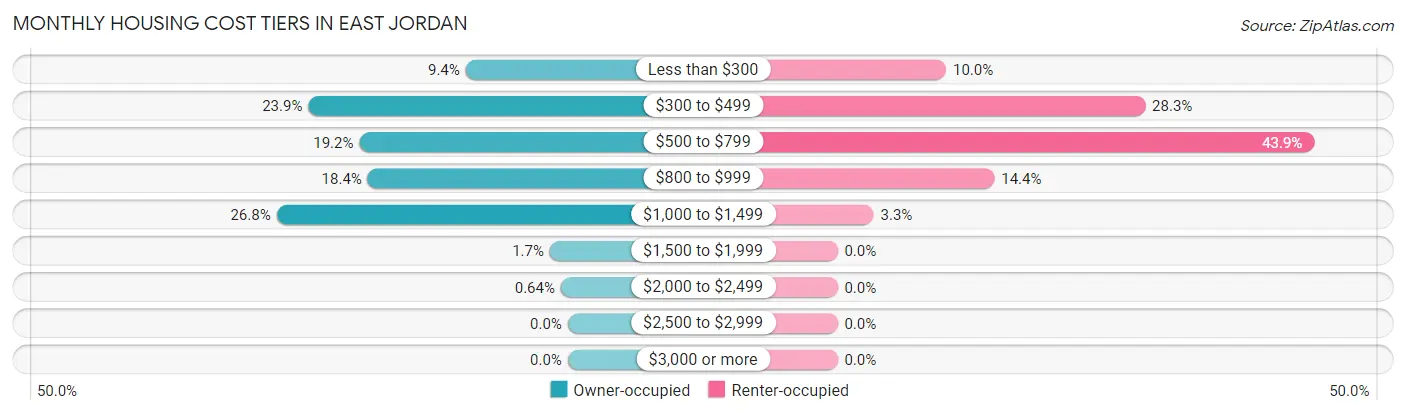
| Monthly Cost | Owner-occupied | Renter-occupied |
| Less than $300 | 74 (9.4%) | 18 (10.0%) |
| $300 to $499 | 188 (23.9%) | 51 (28.3%) |
| $500 to $799 | 151 (19.2%) | 79 (43.9%) |
| $800 to $999 | 145 (18.4%) | 26 (14.4%) |
| $1,000 to $1,499 | 211 (26.8%) | 6 (3.3%) |
| $1,500 to $1,999 | 13 (1.7%) | 0 (0.0%) |
| $2,000 to $2,499 | 5 (0.6%) | 0 (0.0%) |
| $2,500 to $2,999 | 0 (0.0%) | 0 (0.0%) |
| $3,000 or more | 0 (0.0%) | 0 (0.0%) |
| Total | 787 (100.0%) | 180 (100.0%) |
Physical Housing Characteristics in East Jordan
Housing Structures in East Jordan
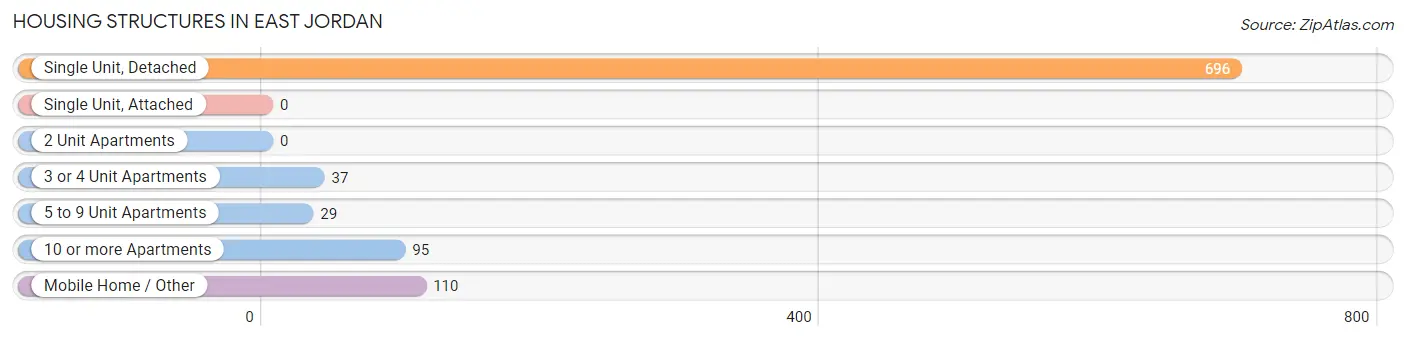
| Structure Type | # Housing Units | % Housing Units |
| Single Unit, Detached | 696 | 72.0% |
| Single Unit, Attached | 0 | 0.0% |
| 2 Unit Apartments | 0 | 0.0% |
| 3 or 4 Unit Apartments | 37 | 3.8% |
| 5 to 9 Unit Apartments | 29 | 3.0% |
| 10 or more Apartments | 95 | 9.8% |
| Mobile Home / Other | 110 | 11.4% |
| Total | 967 | 100.0% |
Housing Structures by Occupancy in East Jordan
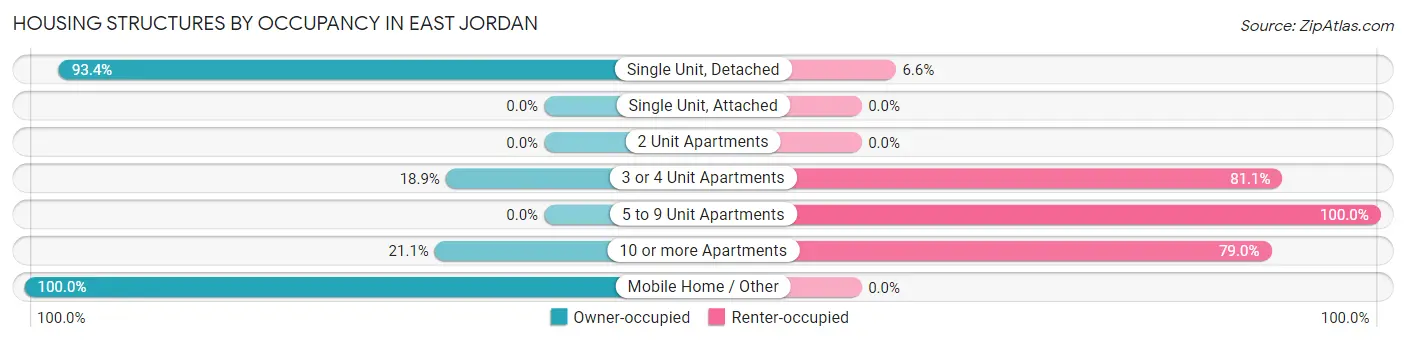
| Structure Type | Owner-occupied | Renter-occupied |
| Single Unit, Detached | 650 (93.4%) | 46 (6.6%) |
| Single Unit, Attached | 0 (0.0%) | 0 (0.0%) |
| 2 Unit Apartments | 0 (0.0%) | 0 (0.0%) |
| 3 or 4 Unit Apartments | 7 (18.9%) | 30 (81.1%) |
| 5 to 9 Unit Apartments | 0 (0.0%) | 29 (100.0%) |
| 10 or more Apartments | 20 (21.0%) | 75 (78.9%) |
| Mobile Home / Other | 110 (100.0%) | 0 (0.0%) |
| Total | 787 (81.4%) | 180 (18.6%) |
Housing Structures by Number of Rooms in East Jordan
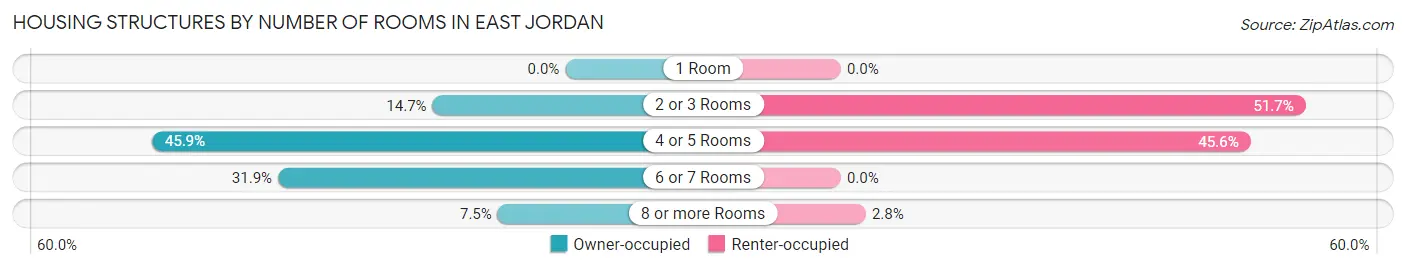
| Number of Rooms | Owner-occupied | Renter-occupied |
| 1 Room | 0 (0.0%) | 0 (0.0%) |
| 2 or 3 Rooms | 116 (14.7%) | 93 (51.7%) |
| 4 or 5 Rooms | 361 (45.9%) | 82 (45.6%) |
| 6 or 7 Rooms | 251 (31.9%) | 0 (0.0%) |
| 8 or more Rooms | 59 (7.5%) | 5 (2.8%) |
| Total | 787 (100.0%) | 180 (100.0%) |
Housing Structure by Heating Type in East Jordan
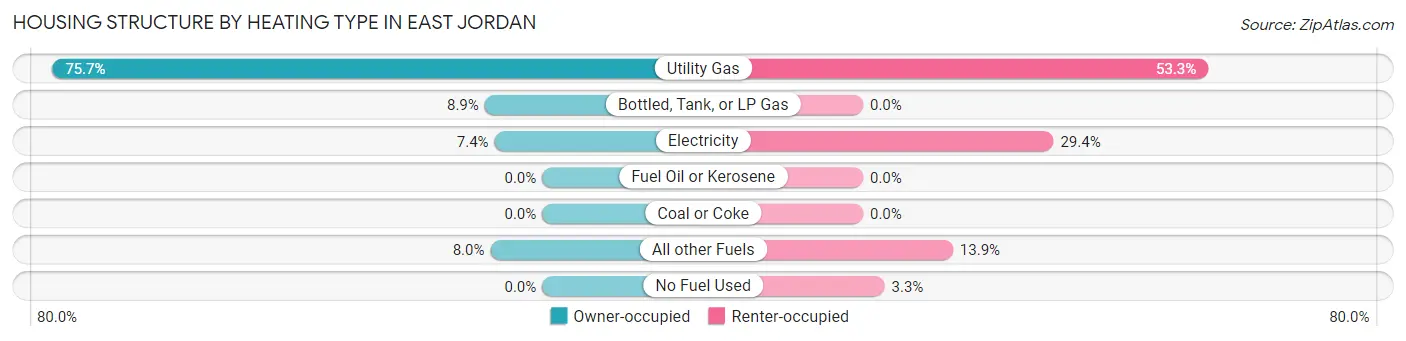
| Heating Type | Owner-occupied | Renter-occupied |
| Utility Gas | 596 (75.7%) | 96 (53.3%) |
| Bottled, Tank, or LP Gas | 70 (8.9%) | 0 (0.0%) |
| Electricity | 58 (7.4%) | 53 (29.4%) |
| Fuel Oil or Kerosene | 0 (0.0%) | 0 (0.0%) |
| Coal or Coke | 0 (0.0%) | 0 (0.0%) |
| All other Fuels | 63 (8.0%) | 25 (13.9%) |
| No Fuel Used | 0 (0.0%) | 6 (3.3%) |
| Total | 787 (100.0%) | 180 (100.0%) |
Household Vehicle Usage in East Jordan
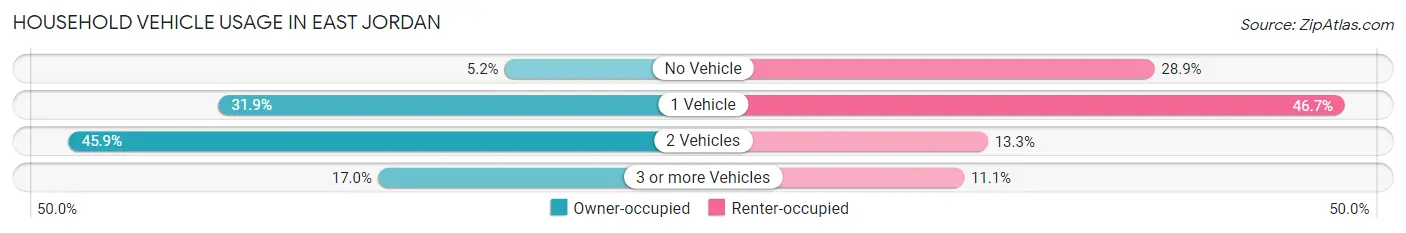
| Vehicles per Household | Owner-occupied | Renter-occupied |
| No Vehicle | 41 (5.2%) | 52 (28.9%) |
| 1 Vehicle | 251 (31.9%) | 84 (46.7%) |
| 2 Vehicles | 361 (45.9%) | 24 (13.3%) |
| 3 or more Vehicles | 134 (17.0%) | 20 (11.1%) |
| Total | 787 (100.0%) | 180 (100.0%) |
Real Estate & Mortgages in East Jordan
Real Estate and Mortgage Overview in East Jordan
| Characteristic | Without Mortgage | With Mortgage |
| Housing Units | 344 | 443 |
| Median Property Value | $149,300 | $97,500 |
| Median Household Income | $37,000 | $80 |
| Monthly Housing Costs | $399 | $0 |
| Real Estate Taxes | $1,459 | $32 |
Property Value by Mortgage Status in East Jordan
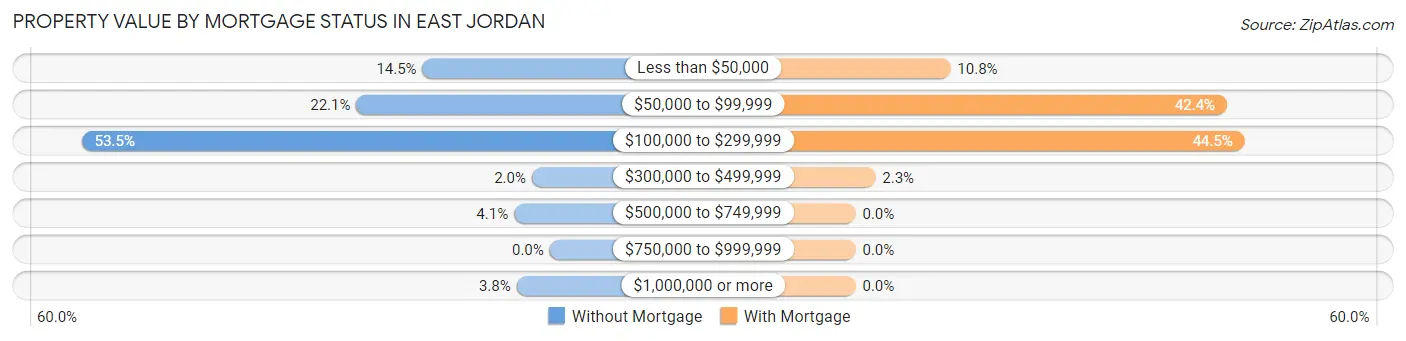
| Property Value | Without Mortgage | With Mortgage |
| Less than $50,000 | 50 (14.5%) | 48 (10.8%) |
| $50,000 to $99,999 | 76 (22.1%) | 188 (42.4%) |
| $100,000 to $299,999 | 184 (53.5%) | 197 (44.5%) |
| $300,000 to $499,999 | 7 (2.0%) | 10 (2.3%) |
| $500,000 to $749,999 | 14 (4.1%) | 0 (0.0%) |
| $750,000 to $999,999 | 0 (0.0%) | 0 (0.0%) |
| $1,000,000 or more | 13 (3.8%) | 0 (0.0%) |
| Total | 344 (100.0%) | 443 (100.0%) |
Household Income by Mortgage Status in East Jordan
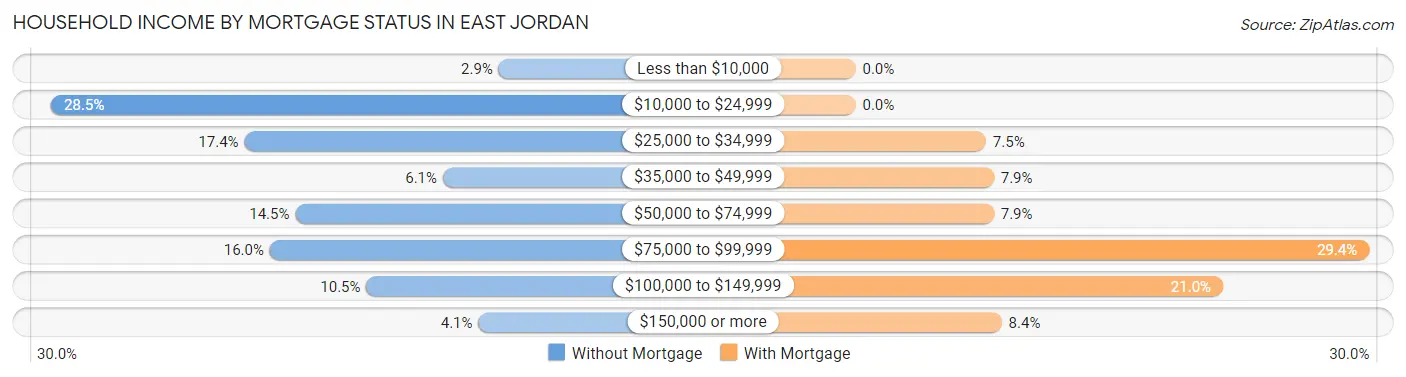
| Household Income | Without Mortgage | With Mortgage |
| Less than $10,000 | 10 (2.9%) | 0 (0.0%) |
| $10,000 to $24,999 | 98 (28.5%) | 0 (0.0%) |
| $25,000 to $34,999 | 60 (17.4%) | 33 (7.4%) |
| $35,000 to $49,999 | 21 (6.1%) | 35 (7.9%) |
| $50,000 to $74,999 | 50 (14.5%) | 35 (7.9%) |
| $75,000 to $99,999 | 55 (16.0%) | 130 (29.3%) |
| $100,000 to $149,999 | 36 (10.5%) | 93 (21.0%) |
| $150,000 or more | 14 (4.1%) | 37 (8.4%) |
| Total | 344 (100.0%) | 443 (100.0%) |
Property Value to Household Income Ratio in East Jordan
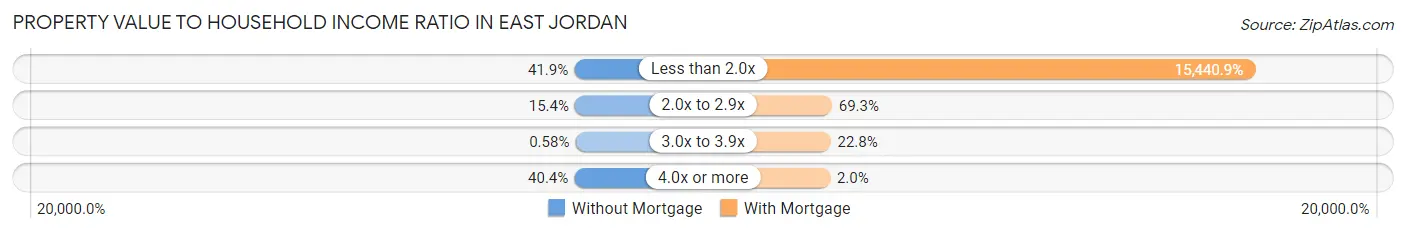
| Value-to-Income Ratio | Without Mortgage | With Mortgage |
| Less than 2.0x | 144 (41.9%) | 68,403 (15,440.9%) |
| 2.0x to 2.9x | 53 (15.4%) | 307 (69.3%) |
| 3.0x to 3.9x | 2 (0.6%) | 101 (22.8%) |
| 4.0x or more | 139 (40.4%) | 9 (2.0%) |
| Total | 344 (100.0%) | 443 (100.0%) |
Real Estate Taxes by Mortgage Status in East Jordan
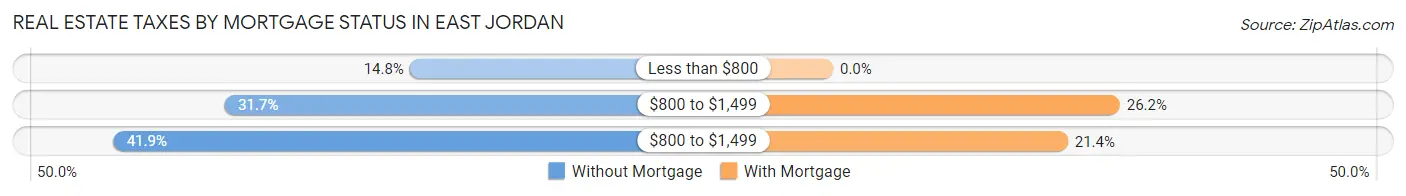
| Property Taxes | Without Mortgage | With Mortgage |
| Less than $800 | 51 (14.8%) | 0 (0.0%) |
| $800 to $1,499 | 109 (31.7%) | 116 (26.2%) |
| $800 to $1,499 | 144 (41.9%) | 95 (21.4%) |
| Total | 344 (100.0%) | 443 (100.0%) |
Health & Disability in East Jordan
Health Insurance Coverage by Age in East Jordan
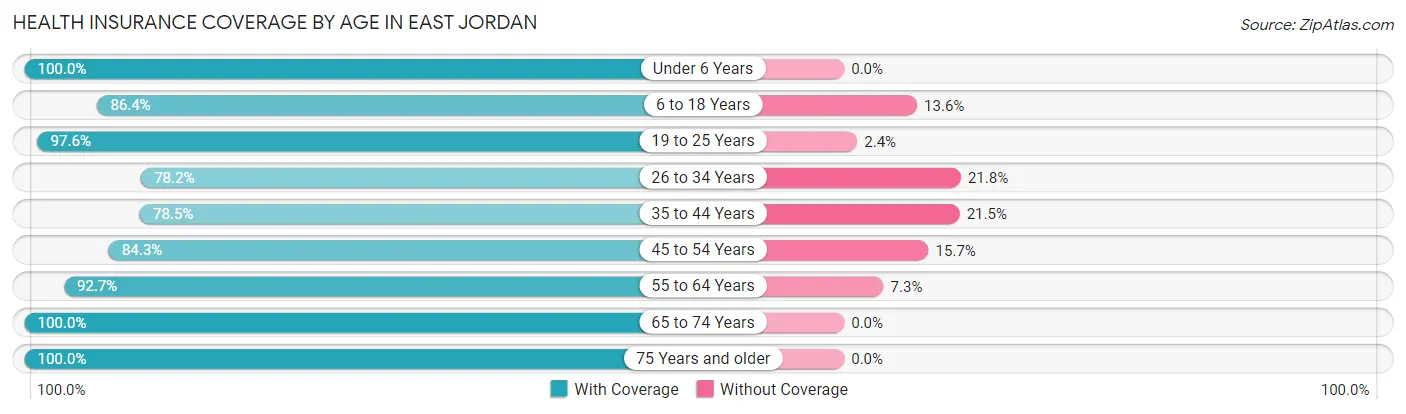
| Age Bracket | With Coverage | Without Coverage |
| Under 6 Years | 68 (100.0%) | 0 (0.0%) |
| 6 to 18 Years | 159 (86.4%) | 25 (13.6%) |
| 19 to 25 Years | 240 (97.6%) | 6 (2.4%) |
| 26 to 34 Years | 169 (78.2%) | 47 (21.8%) |
| 35 to 44 Years | 164 (78.5%) | 45 (21.5%) |
| 45 to 54 Years | 241 (84.3%) | 45 (15.7%) |
| 55 to 64 Years | 240 (92.7%) | 19 (7.3%) |
| 65 to 74 Years | 245 (100.0%) | 0 (0.0%) |
| 75 Years and older | 163 (100.0%) | 0 (0.0%) |
| Total | 1,689 (90.0%) | 187 (10.0%) |
Health Insurance Coverage by Citizenship Status in East Jordan
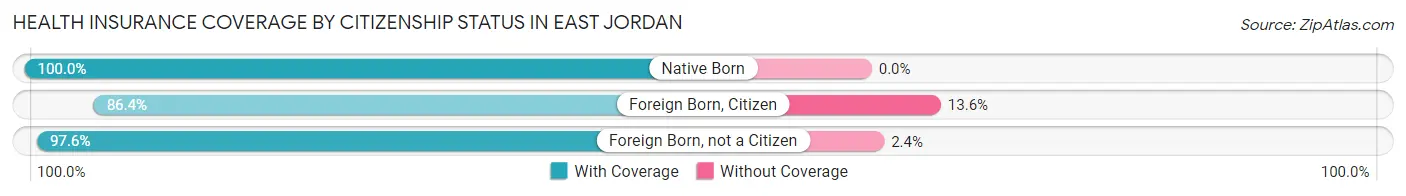
| Citizenship Status | With Coverage | Without Coverage |
| Native Born | 68 (100.0%) | 0 (0.0%) |
| Foreign Born, Citizen | 159 (86.4%) | 25 (13.6%) |
| Foreign Born, not a Citizen | 240 (97.6%) | 6 (2.4%) |
Health Insurance Coverage by Household Income in East Jordan
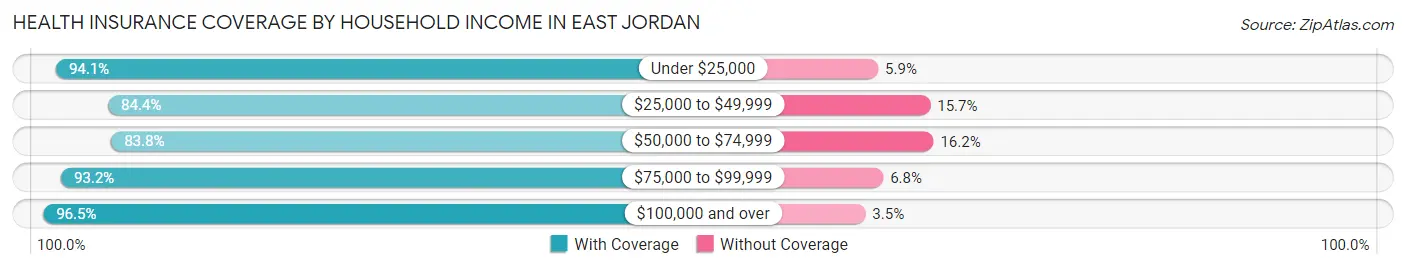
| Household Income | With Coverage | Without Coverage |
| Under $25,000 | 208 (94.1%) | 13 (5.9%) |
| $25,000 to $49,999 | 345 (84.4%) | 64 (15.7%) |
| $50,000 to $74,999 | 361 (83.8%) | 70 (16.2%) |
| $75,000 to $99,999 | 328 (93.2%) | 24 (6.8%) |
| $100,000 and over | 443 (96.5%) | 16 (3.5%) |
Public vs Private Health Insurance Coverage by Age in East Jordan
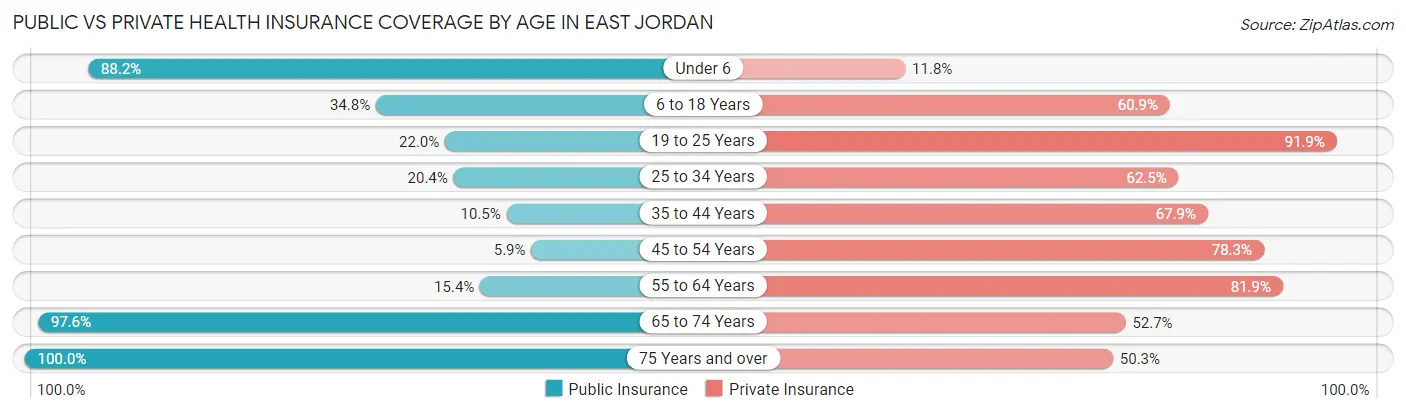
| Age Bracket | Public Insurance | Private Insurance |
| Under 6 | 60 (88.2%) | 8 (11.8%) |
| 6 to 18 Years | 64 (34.8%) | 112 (60.9%) |
| 19 to 25 Years | 54 (22.0%) | 226 (91.9%) |
| 25 to 34 Years | 44 (20.4%) | 135 (62.5%) |
| 35 to 44 Years | 22 (10.5%) | 142 (67.9%) |
| 45 to 54 Years | 17 (5.9%) | 224 (78.3%) |
| 55 to 64 Years | 40 (15.4%) | 212 (81.9%) |
| 65 to 74 Years | 239 (97.6%) | 129 (52.6%) |
| 75 Years and over | 163 (100.0%) | 82 (50.3%) |
| Total | 703 (37.5%) | 1,270 (67.7%) |
Disability Status by Sex by Age in East Jordan
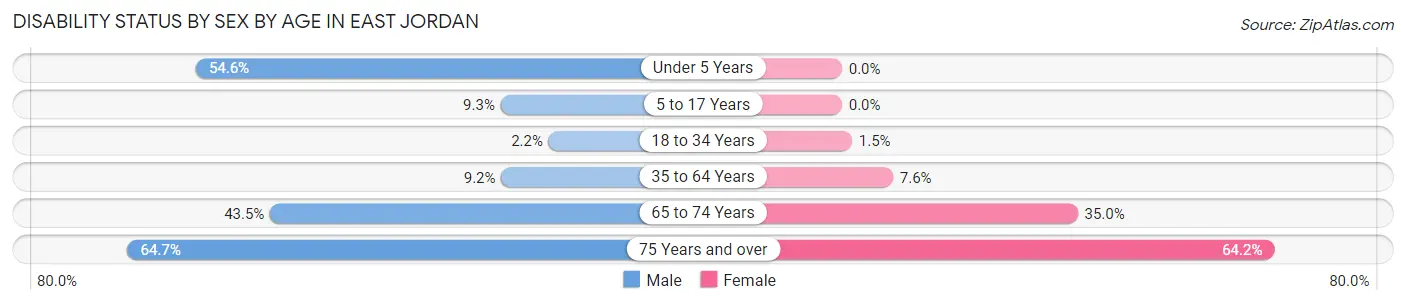
| Age Bracket | Male | Female |
| Under 5 Years | 6 (54.5%) | 0 (0.0%) |
| 5 to 17 Years | 8 (9.3%) | 0 (0.0%) |
| 18 to 34 Years | 6 (2.2%) | 3 (1.5%) |
| 35 to 64 Years | 39 (9.2%) | 25 (7.6%) |
| 65 to 74 Years | 37 (43.5%) | 56 (35.0%) |
| 75 Years and over | 44 (64.7%) | 61 (64.2%) |
Disability Class by Sex by Age in East Jordan
Disability Class: Hearing Difficulty
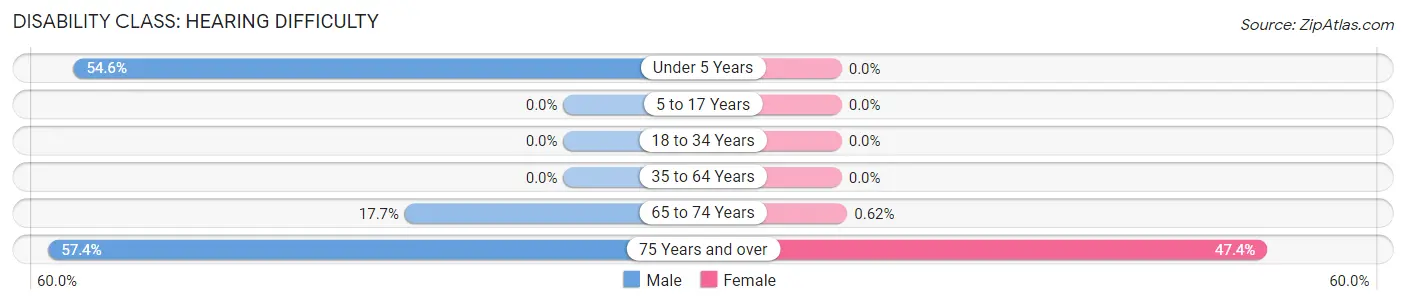
| Age Bracket | Male | Female |
| Under 5 Years | 6 (54.5%) | 0 (0.0%) |
| 5 to 17 Years | 0 (0.0%) | 0 (0.0%) |
| 18 to 34 Years | 0 (0.0%) | 0 (0.0%) |
| 35 to 64 Years | 0 (0.0%) | 0 (0.0%) |
| 65 to 74 Years | 15 (17.6%) | 1 (0.6%) |
| 75 Years and over | 39 (57.4%) | 45 (47.4%) |
Disability Class: Vision Difficulty
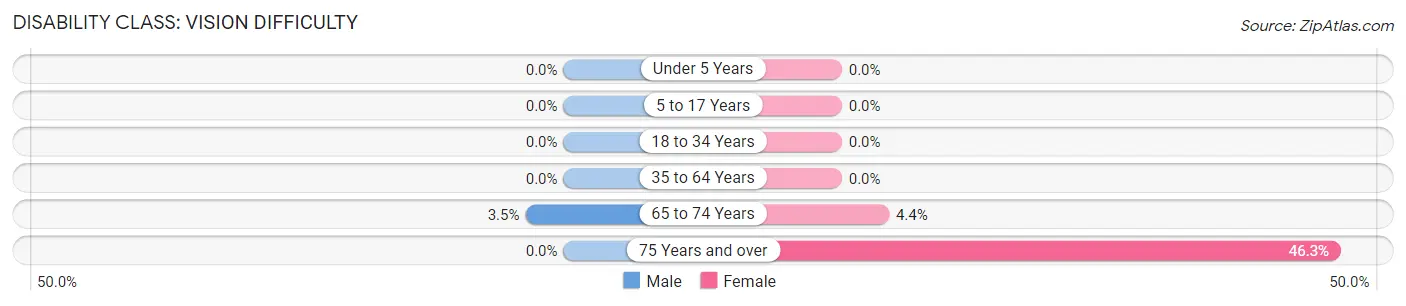
| Age Bracket | Male | Female |
| Under 5 Years | 0 (0.0%) | 0 (0.0%) |
| 5 to 17 Years | 0 (0.0%) | 0 (0.0%) |
| 18 to 34 Years | 0 (0.0%) | 0 (0.0%) |
| 35 to 64 Years | 0 (0.0%) | 0 (0.0%) |
| 65 to 74 Years | 3 (3.5%) | 7 (4.4%) |
| 75 Years and over | 0 (0.0%) | 44 (46.3%) |
Disability Class: Cognitive Difficulty
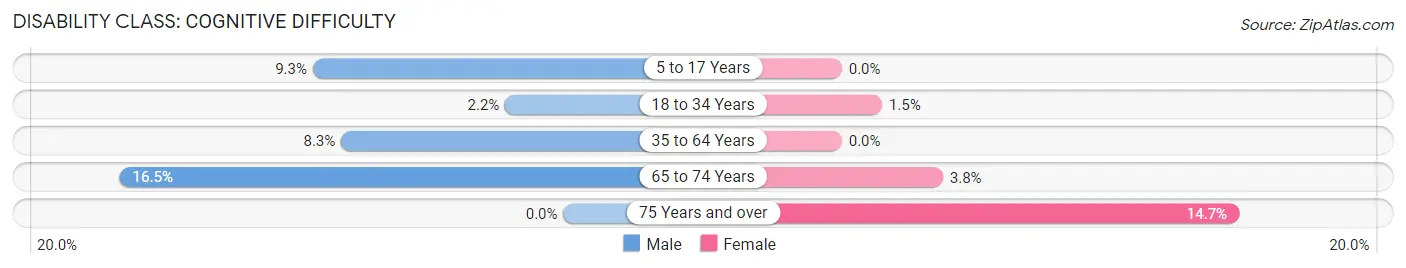
| Age Bracket | Male | Female |
| 5 to 17 Years | 8 (9.3%) | 0 (0.0%) |
| 18 to 34 Years | 6 (2.2%) | 3 (1.5%) |
| 35 to 64 Years | 35 (8.3%) | 0 (0.0%) |
| 65 to 74 Years | 14 (16.5%) | 6 (3.7%) |
| 75 Years and over | 0 (0.0%) | 14 (14.7%) |
Disability Class: Ambulatory Difficulty
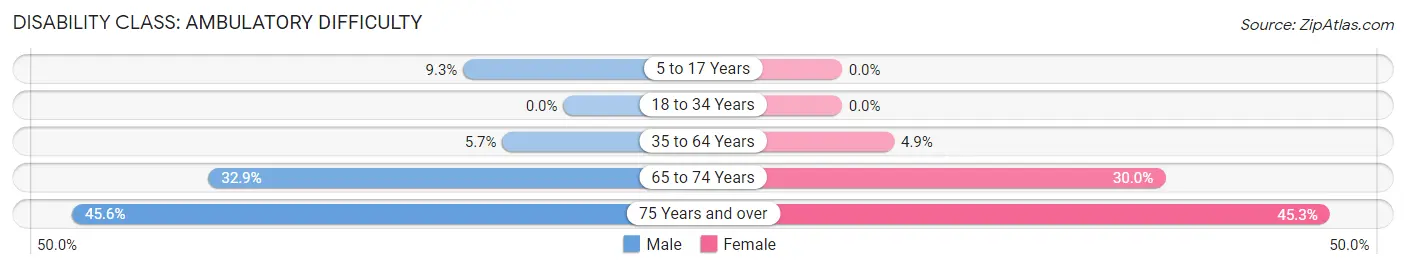
| Age Bracket | Male | Female |
| 5 to 17 Years | 8 (9.3%) | 0 (0.0%) |
| 18 to 34 Years | 0 (0.0%) | 0 (0.0%) |
| 35 to 64 Years | 24 (5.7%) | 16 (4.9%) |
| 65 to 74 Years | 28 (32.9%) | 48 (30.0%) |
| 75 Years and over | 31 (45.6%) | 43 (45.3%) |
Disability Class: Self-Care Difficulty
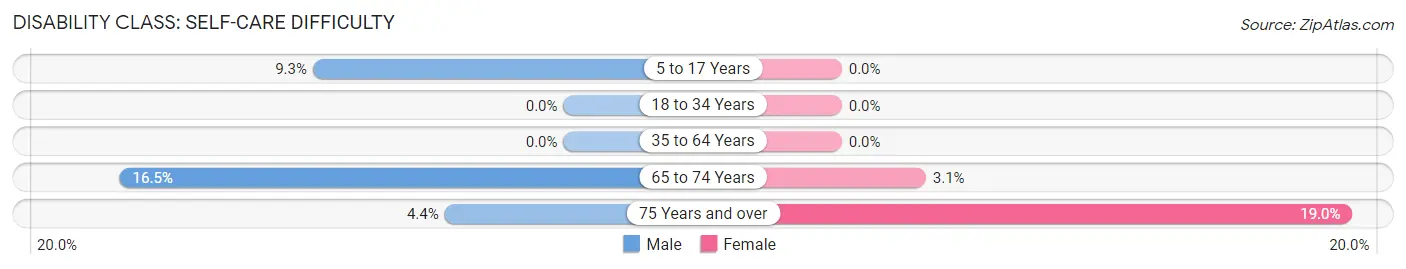
| Age Bracket | Male | Female |
| 5 to 17 Years | 8 (9.3%) | 0 (0.0%) |
| 18 to 34 Years | 0 (0.0%) | 0 (0.0%) |
| 35 to 64 Years | 0 (0.0%) | 0 (0.0%) |
| 65 to 74 Years | 14 (16.5%) | 5 (3.1%) |
| 75 Years and over | 3 (4.4%) | 18 (19.0%) |
Technology Access in East Jordan
Computing Device Access in East Jordan
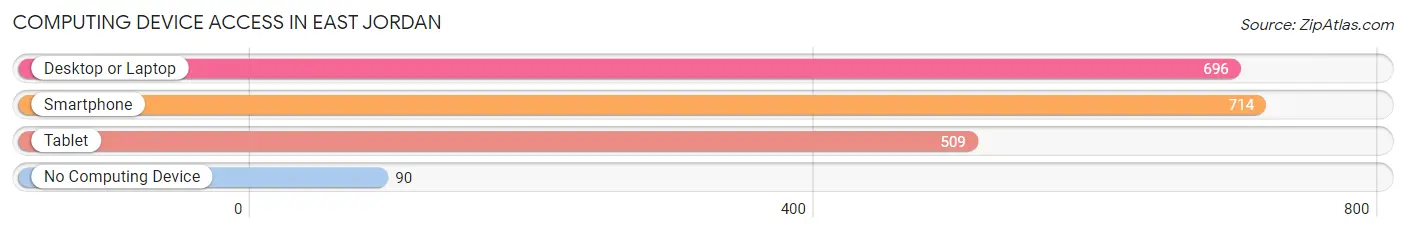
| Device Type | # Households | % Households |
| Desktop or Laptop | 696 | 72.0% |
| Smartphone | 714 | 73.8% |
| Tablet | 509 | 52.6% |
| No Computing Device | 90 | 9.3% |
| Total | 967 | 100.0% |
Internet Access in East Jordan
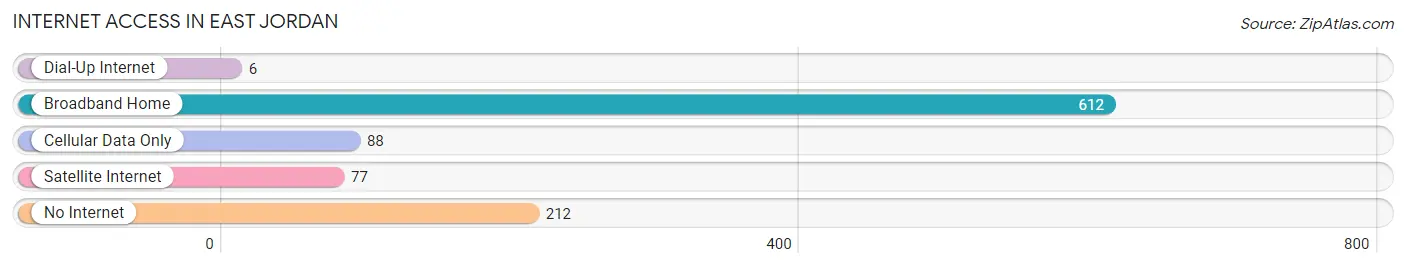
| Internet Type | # Households | % Households |
| Dial-Up Internet | 6 | 0.6% |
| Broadband Home | 612 | 63.3% |
| Cellular Data Only | 88 | 9.1% |
| Satellite Internet | 77 | 8.0% |
| No Internet | 212 | 21.9% |
| Total | 967 | 100.0% |
East Jordan Summary
History
The city of East Jordan, Michigan is located in Charlevoix County in the northern part of the Lower Peninsula. It is situated on the east side of the Jordan River, which is the source of its name. The city was founded in 1871 by a group of settlers from the nearby town of Jordan. The settlers were looking for a place to build a new town and chose the east side of the river because of its proximity to the lake.
The first settlers in East Jordan were mostly farmers and fishermen. They built a sawmill and a gristmill, and the town quickly grew. By the late 1800s, East Jordan had become a thriving community with a variety of businesses, including a hotel, a general store, a blacksmith shop, and a post office.
In the early 1900s, East Jordan began to experience a period of growth and prosperity. The town was incorporated in 1906 and the population grew to over 1,000 by 1910. The city was home to several factories, including a canning factory, a furniture factory, and a brickyard.
The Great Depression of the 1930s hit East Jordan hard, and the population declined. However, the city was able to recover and by the 1950s, the population had grown to over 2,000. The city continued to grow throughout the 20th century, and by the 2000 census, the population had reached 3,000.
Geography
East Jordan is located in the northern part of the Lower Peninsula of Michigan. It is situated on the east side of the Jordan River, which is the source of its name. The city is located about 25 miles north of Traverse City and about 30 miles east of Petoskey.
The city is situated on the east side of the Jordan River, which is the source of its name. The river is a tributary of Lake Michigan and is a popular spot for fishing and boating. The city is also home to several parks, including East Jordan City Park, which features a playground, picnic areas, and a boat launch.
The city is located in a region of rolling hills and forests. The terrain is mostly flat, with some areas of higher elevation. The climate is generally mild, with cold winters and warm summers.
Economy
East Jordan’s economy is largely based on tourism and manufacturing. The city is home to several factories, including a canning factory, a furniture factory, and a brickyard. The city is also home to several tourist attractions, including the East Jordan Historical Museum, the East Jordan Riverwalk, and the East Jordan City Park.
The city is also home to several businesses, including restaurants, retail stores, and professional services. The city is also home to several medical facilities, including a hospital and several clinics.
Demographics
As of the 2010 census, the population of East Jordan was 3,092. The racial makeup of the city was 95.3% White, 0.7% African American, 0.3% Native American, 0.7% Asian, 0.1% Pacific Islander, 0.7% from other races, and 2.1% from two or more races. Hispanic or Latino of any race were 2.3% of the population.
The median household income in East Jordan was $37,917, and the median family income was $45,938. The per capita income for the city was $20,845. About 11.3% of families and 14.2% of the population were below the poverty line, including 19.2% of those under age 18 and 8.2% of those age 65 or over.
Common Questions
What is Per Capita Income in East Jordan?
Per Capita income in East Jordan is $37,687.
What is the Median Family Income in East Jordan?
Median Family Income in East Jordan is $73,977.
What is the Median Household income in East Jordan?
Median Household Income in East Jordan is $56,761.
What is Income or Wage Gap in East Jordan?
Income or Wage Gap in East Jordan is 32.2%.
Women in East Jordan earn 67.8 cents for every dollar earned by a man.
What is Inequality or Gini Index in East Jordan?
Inequality or Gini Index in East Jordan is 0.42.
What is the Total Population of East Jordan?
Total Population of East Jordan is 1,876.
What is the Total Male Population of East Jordan?
Total Male Population of East Jordan is 952.
What is the Total Female Population of East Jordan?
Total Female Population of East Jordan is 924.
What is the Ratio of Males per 100 Females in East Jordan?
There are 103.03 Males per 100 Females in East Jordan.
What is the Ratio of Females per 100 Males in East Jordan?
There are 97.06 Females per 100 Males in East Jordan.
What is the Median Population Age in East Jordan?
Median Population Age in East Jordan is 45.4 Years.
What is the Average Family Size in East Jordan
Average Family Size in East Jordan is 2.3 People.
What is the Average Household Size in East Jordan
Average Household Size in East Jordan is 1.9 People.
How Large is the Labor Force in East Jordan?
There are 1,171 People in the Labor Forcein in East Jordan.
What is the Percentage of People in the Labor Force in East Jordan?
69.2% of People are in the Labor Force in East Jordan.
What is the Unemployment Rate in East Jordan?
Unemployment Rate in East Jordan is 3.8%.