Cities with the Lowest Poverty Level Among Families in Delaware
RELATED REPORTS & OPTIONS
Lowest Family Poverty
Delaware
Compare Cities
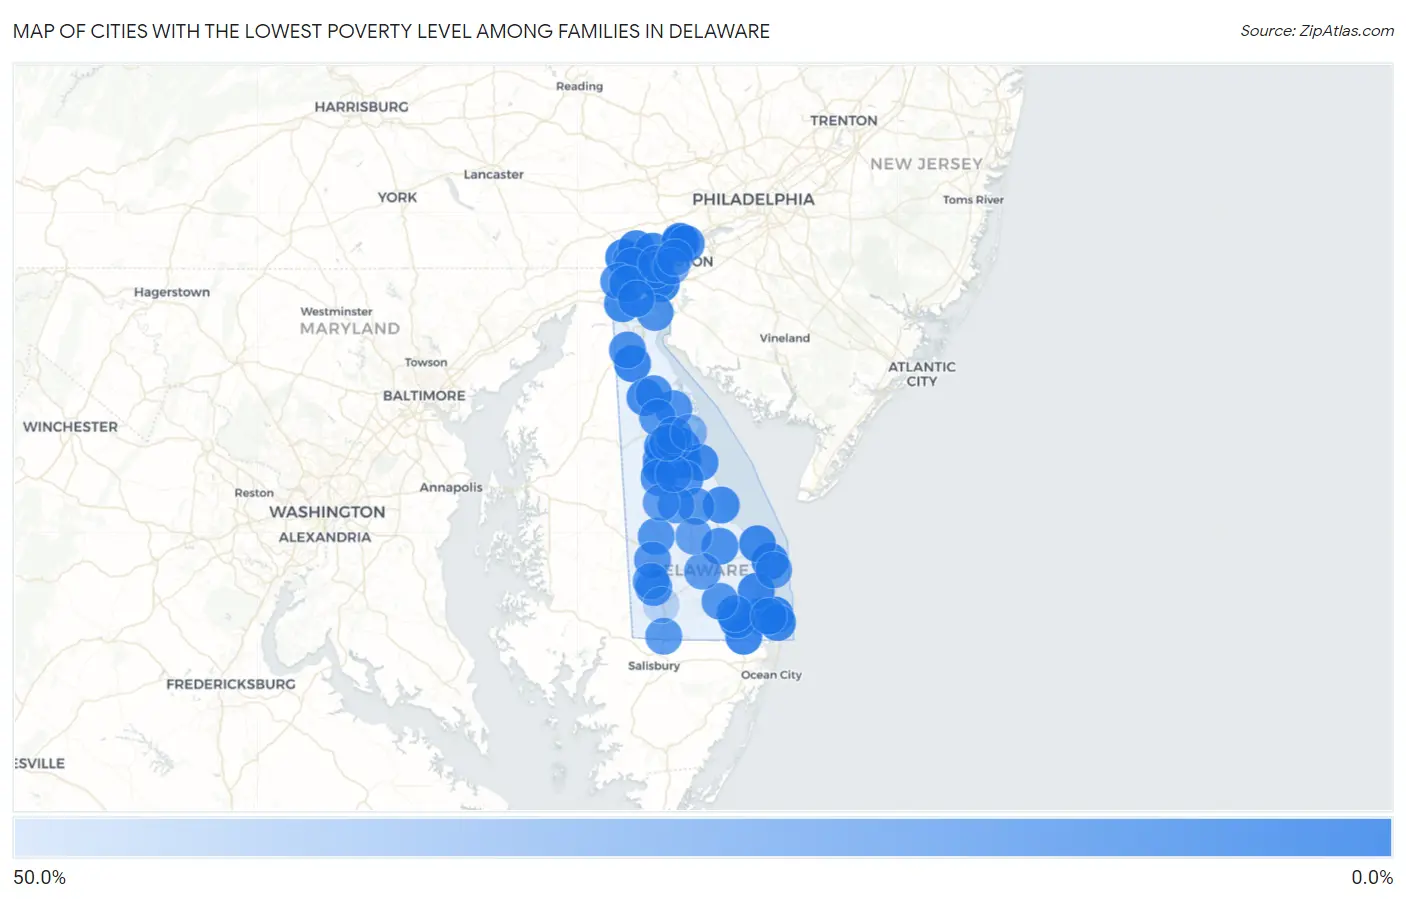
Map of Cities with the Lowest Poverty Level Among Families in Delaware
50.0%
0.0%
Cities with the Lowest Poverty Level Among Families in Delaware
| City | Family Poverty | vs State | vs National | |
| 1. | Bethany Beach | 0.60% | 7.5%(-6.91)#1 | 8.8%(-8.18)#155 |
| 2. | New Castle | 1.3% | 7.5%(-6.22)#2 | 8.8%(-7.50)#867 |
| 3. | North Star | 1.4% | 7.5%(-6.10)#3 | 8.8%(-7.38)#1,010 |
| 4. | Ardentown | 1.5% | 7.5%(-6.03)#4 | 8.8%(-7.31)#1,110 |
| 5. | Pike Creek | 1.5% | 7.5%(-5.96)#5 | 8.8%(-7.23)#1,220 |
| 6. | Woodside East | 1.7% | 7.5%(-5.76)#6 | 8.8%(-7.03)#1,507 |
| 7. | Hockessin | 1.8% | 7.5%(-5.71)#7 | 8.8%(-6.99)#1,581 |
| 8. | Townsend | 1.9% | 7.5%(-5.61)#8 | 8.8%(-6.88)#1,739 |
| 9. | Millville | 2.0% | 7.5%(-5.54)#9 | 8.8%(-6.82)#1,843 |
| 10. | Selbyville | 2.0% | 7.5%(-5.47)#10 | 8.8%(-6.75)#1,931 |
| 11. | Rehoboth Beach | 2.0% | 7.5%(-5.47)#11 | 8.8%(-6.75)#1,940 |
| 12. | Long Neck | 2.3% | 7.5%(-5.23)#12 | 8.8%(-6.50)#2,323 |
| 13. | Woodside | 2.6% | 7.5%(-4.87)#13 | 8.8%(-6.15)#2,900 |
| 14. | Ardencroft | 2.7% | 7.5%(-4.77)#14 | 8.8%(-6.04)#3,097 |
| 15. | Greenville | 3.0% | 7.5%(-4.52)#15 | 8.8%(-5.80)#3,521 |
| 16. | Lewes | 3.2% | 7.5%(-4.34)#16 | 8.8%(-5.62)#3,831 |
| 17. | Dover Base Housing | 3.3% | 7.5%(-4.25)#17 | 8.8%(-5.53)#3,961 |
| 18. | Glasgow | 3.3% | 7.5%(-4.17)#18 | 8.8%(-5.45)#4,129 |
| 19. | Highland Acres | 3.8% | 7.5%(-3.71)#19 | 8.8%(-4.98)#4,872 |
| 20. | Lincoln | 3.9% | 7.5%(-3.58)#20 | 8.8%(-4.85)#5,071 |
| 21. | Clayton | 4.0% | 7.5%(-3.50)#21 | 8.8%(-4.77)#5,203 |
| 22. | South Bethany | 4.1% | 7.5%(-3.41)#22 | 8.8%(-4.69)#5,334 |
| 23. | Rising Sun Lebanon | 4.3% | 7.5%(-3.23)#23 | 8.8%(-4.51)#5,620 |
| 24. | Magnolia | 4.3% | 7.5%(-3.16)#24 | 8.8%(-4.43)#5,749 |
| 25. | Wilmington Manor | 4.4% | 7.5%(-3.09)#25 | 8.8%(-4.36)#5,851 |
| 26. | Slaughter Beach | 4.5% | 7.5%(-3.03)#26 | 8.8%(-4.30)#5,935 |
| 27. | Newport | 4.7% | 7.5%(-2.80)#27 | 8.8%(-4.08)#6,306 |
| 28. | Bowers | 4.9% | 7.5%(-2.60)#28 | 8.8%(-3.88)#6,594 |
| 29. | Frankford | 5.7% | 7.5%(-1.81)#29 | 8.8%(-3.08)#7,843 |
| 30. | Camden | 5.9% | 7.5%(-1.58)#30 | 8.8%(-2.86)#8,192 |
| 31. | Arden | 6.1% | 7.5%(-1.36)#31 | 8.8%(-2.64)#8,505 |
| 32. | Claymont | 7.2% | 7.5%(-0.341)#32 | 8.8%(-1.62)#9,959 |
| 33. | Pike Creek Valley | 7.2% | 7.5%(-0.321)#33 | 8.8%(-1.60)#9,973 |
| 34. | Newark | 7.4% | 7.5%(-0.133)#34 | 8.8%(-1.41)#10,240 |
| 35. | Viola | 7.4% | 7.5%(-0.097)#35 | 8.8%(-1.37)#10,313 |
| 36. | Middletown | 7.6% | 7.5%(+0.095)#36 | 8.8%(-1.18)#10,531 |
| 37. | Leipsic | 7.9% | 7.5%(+0.390)#37 | 8.8%(-0.887)#10,936 |
| 38. | Milton | 7.9% | 7.5%(+0.410)#38 | 8.8%(-0.867)#10,955 |
| 39. | Blades | 7.9% | 7.5%(+0.437)#39 | 8.8%(-0.839)#10,994 |
| 40. | Wyoming | 8.1% | 7.5%(+0.637)#40 | 8.8%(-0.640)#11,242 |
| 41. | Frederica | 8.2% | 7.5%(+0.650)#41 | 8.8%(-0.627)#11,250 |
| 42. | Smyrna | 8.2% | 7.5%(+0.707)#42 | 8.8%(-0.570)#11,336 |
| 43. | Felton | 8.6% | 7.5%(+1.14)#43 | 8.8%(-0.140)#11,905 |
| 44. | Brookside | 8.9% | 7.5%(+1.43)#44 | 8.8%(+0.151)#12,234 |
| 45. | Dagsboro | 8.9% | 7.5%(+1.44)#45 | 8.8%(+0.164)#12,250 |
| 46. | Delaware City | 9.1% | 7.5%(+1.59)#46 | 8.8%(+0.309)#12,389 |
| 47. | Cheswold | 9.7% | 7.5%(+2.15)#47 | 8.8%(+0.872)#13,029 |
| 48. | Bear | 9.8% | 7.5%(+2.33)#48 | 8.8%(+1.05)#13,261 |
| 49. | Millsboro | 9.9% | 7.5%(+2.40)#49 | 8.8%(+1.13)#13,349 |
| 50. | Greenwood | 9.9% | 7.5%(+2.43)#50 | 8.8%(+1.15)#13,374 |
| 51. | Bridgeville | 10.5% | 7.5%(+2.95)#51 | 8.8%(+1.67)#13,927 |
| 52. | Milford | 11.4% | 7.5%(+3.86)#52 | 8.8%(+2.58)#14,829 |
| 53. | Kent Acres | 11.8% | 7.5%(+4.27)#53 | 8.8%(+3.00)#15,235 |
| 54. | Delmar | 12.0% | 7.5%(+4.50)#54 | 8.8%(+3.22)#15,412 |
| 55. | Dewey Beach | 12.4% | 7.5%(+4.89)#55 | 8.8%(+3.62)#15,772 |
| 56. | Ocean View | 12.9% | 7.5%(+5.38)#56 | 8.8%(+4.10)#16,157 |
| 57. | Seaford | 12.9% | 7.5%(+5.41)#57 | 8.8%(+4.13)#16,185 |
| 58. | Houston | 13.5% | 7.5%(+5.96)#58 | 8.8%(+4.68)#16,636 |
| 59. | Harrington | 13.7% | 7.5%(+6.15)#59 | 8.8%(+4.88)#16,776 |
| 60. | Georgetown | 14.3% | 7.5%(+6.83)#60 | 8.8%(+5.56)#17,320 |
| 61. | Ellendale | 15.1% | 7.5%(+7.60)#61 | 8.8%(+6.33)#17,843 |
| 62. | Dover | 16.3% | 7.5%(+8.77)#62 | 8.8%(+7.50)#18,542 |
| 63. | Riverview | 17.1% | 7.5%(+9.63)#63 | 8.8%(+8.35)#19,020 |
| 64. | Elsmere | 18.1% | 7.5%(+10.6)#64 | 8.8%(+9.33)#19,509 |
| 65. | Wilmington | 19.7% | 7.5%(+12.2)#65 | 8.8%(+10.9)#20,227 |
| 66. | Edgemoor | 20.2% | 7.5%(+12.6)#66 | 8.8%(+11.4)#20,453 |
| 67. | Rodney Village | 24.1% | 7.5%(+16.6)#67 | 8.8%(+15.3)#21,744 |
| 68. | Little Creek | 27.7% | 7.5%(+20.2)#68 | 8.8%(+18.9)#22,593 |
| 69. | Laurel | 42.9% | 7.5%(+35.4)#69 | 8.8%(+34.1)#24,227 |
1
Common Questions
What are the Top 10 Cities with the Lowest Poverty Level Among Families in Delaware?
Top 10 Cities with the Lowest Poverty Level Among Families in Delaware are:
#1
0.0%
#2
0.0%
#3
0.0%
#4
0.0%
#5
0.0%
#6
0.0%
#7
0.60%
#8
1.3%
#9
1.4%
#10
1.5%
What city has the Lowest Poverty Level Among Families in Delaware?
Bethany Beach has the Lowest Poverty Level Among Families in Delaware with 0.60%.
What is the Poverty Level Among Families in the State of Delaware?
Poverty Level Among Families in Delaware is 7.5%.
What is the Poverty Level Among Families in the United States?
Poverty Level Among Families in the United States is 8.8%.