Clinton, MI Map & Demographics
Clinton Map
Clinton Overview
$36,671
PER CAPITA INCOME
$97,721
AVG FAMILY INCOME
$78,472
AVG HOUSEHOLD INCOME
23.4%
WAGE / INCOME GAP [ % ]
76.6¢/ $1
WAGE / INCOME GAP [ $ ]
0.39
INEQUALITY / GINI INDEX
2,929
TOTAL POPULATION
1,362
MALE POPULATION
1,567
FEMALE POPULATION
86.92
MALES / 100 FEMALES
115.05
FEMALES / 100 MALES
36.6
MEDIAN AGE
3.3
AVG FAMILY SIZE
2.8
AVG HOUSEHOLD SIZE
1,755
LABOR FORCE [ PEOPLE ]
74.7%
PERCENT IN LABOR FORCE
7.4%
UNEMPLOYMENT RATE
Clinton Zip Codes
Clinton Area Codes
Income in Clinton
Income Overview in Clinton
Per Capita Income in Clinton is $36,671, while median incomes of families and households are $97,721 and $78,472 respectively.
| Characteristic | Number | Measure |
| Per Capita Income | 2,929 | $36,671 |
| Median Family Income | 749 | $97,721 |
| Mean Family Income | 749 | $111,052 |
| Median Household Income | 1,046 | $78,472 |
| Mean Household Income | 1,046 | $98,923 |
| Income Deficit | 749 | $0 |
| Wage / Income Gap (%) | 2,929 | 23.41% |
| Wage / Income Gap ($) | 2,929 | 76.59¢ per $1 |
| Gini / Inequality Index | 2,929 | 0.39 |
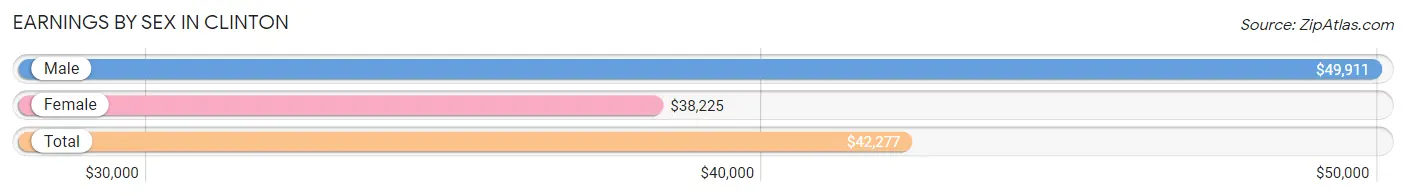
Earnings by Sex in Clinton
Average Earnings in Clinton are $42,277, $49,911 for men and $38,225 for women, a difference of 23.4%.
| Sex | Number | Average Earnings |
| Male | 890 (50.7%) | $49,911 |
| Female | 865 (49.3%) | $38,225 |
| Total | 1,755 (100.0%) | $42,277 |
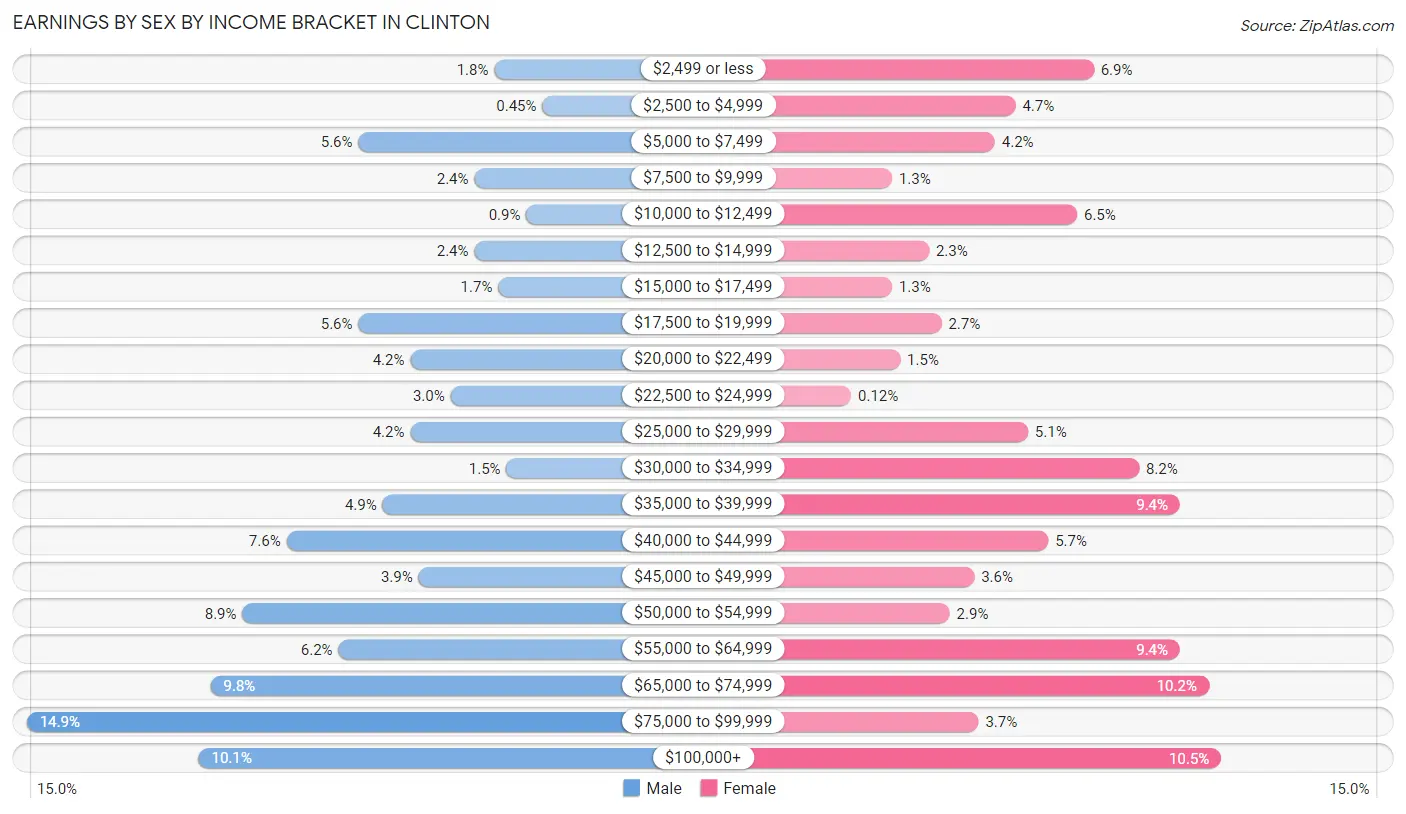
Earnings by Sex by Income Bracket in Clinton
The most common earnings brackets in Clinton are $75,000 to $99,999 for men (133 | 14.9%) and $100,000+ for women (91 | 10.5%).
| Income | Male | Female |
| $2,499 or less | 16 (1.8%) | 60 (6.9%) |
| $2,500 to $4,999 | 4 (0.4%) | 41 (4.7%) |
| $5,000 to $7,499 | 50 (5.6%) | 36 (4.2%) |
| $7,500 to $9,999 | 21 (2.4%) | 11 (1.3%) |
| $10,000 to $12,499 | 8 (0.9%) | 56 (6.5%) |
| $12,500 to $14,999 | 21 (2.4%) | 20 (2.3%) |
| $15,000 to $17,499 | 15 (1.7%) | 11 (1.3%) |
| $17,500 to $19,999 | 50 (5.6%) | 23 (2.7%) |
| $20,000 to $22,499 | 37 (4.2%) | 13 (1.5%) |
| $22,500 to $24,999 | 27 (3.0%) | 1 (0.1%) |
| $25,000 to $29,999 | 37 (4.2%) | 44 (5.1%) |
| $30,000 to $34,999 | 13 (1.5%) | 71 (8.2%) |
| $35,000 to $39,999 | 44 (4.9%) | 81 (9.4%) |
| $40,000 to $44,999 | 68 (7.6%) | 49 (5.7%) |
| $45,000 to $49,999 | 35 (3.9%) | 31 (3.6%) |
| $50,000 to $54,999 | 79 (8.9%) | 25 (2.9%) |
| $55,000 to $64,999 | 55 (6.2%) | 81 (9.4%) |
| $65,000 to $74,999 | 87 (9.8%) | 88 (10.2%) |
| $75,000 to $99,999 | 133 (14.9%) | 32 (3.7%) |
| $100,000+ | 90 (10.1%) | 91 (10.5%) |
| Total | 890 (100.0%) | 865 (100.0%) |
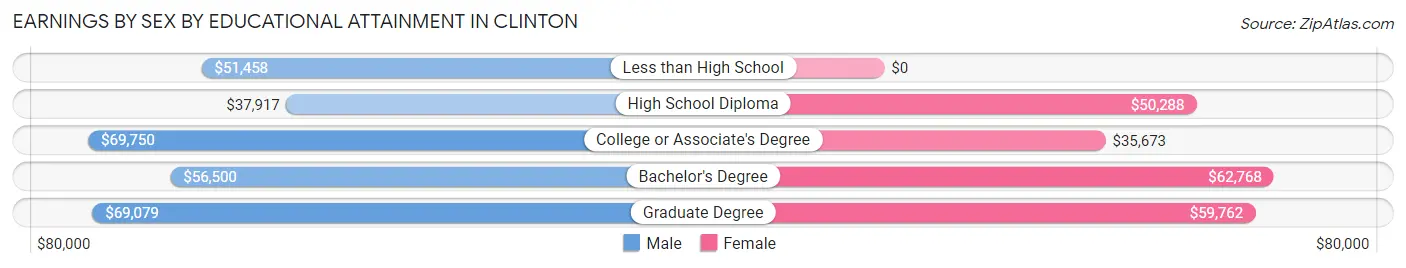
Earnings by Sex by Educational Attainment in Clinton
Average earnings in Clinton are $52,389 for men and $43,250 for women, a difference of 17.4%. Men with an educational attainment of college or associate's degree enjoy the highest average annual earnings of $69,750, while those with high school diploma education earn the least with $37,917. Women with an educational attainment of bachelor's degree earn the most with the average annual earnings of $62,768, while those with college or associate's degree education have the smallest earnings of $35,673.
| Educational Attainment | Male Income | Female Income |
| Less than High School | $51,458 | $0 |
| High School Diploma | $37,917 | $50,288 |
| College or Associate's Degree | $69,750 | $35,673 |
| Bachelor's Degree | $56,500 | $62,768 |
| Graduate Degree | $69,079 | $59,762 |
| Total | $52,389 | $43,250 |
Family Income in Clinton
Family Income Brackets in Clinton
According to the Clinton family income data, there are 182 families falling into the $100,000 to $149,999 income range, which is the most common income bracket and makes up 24.3% of all families.
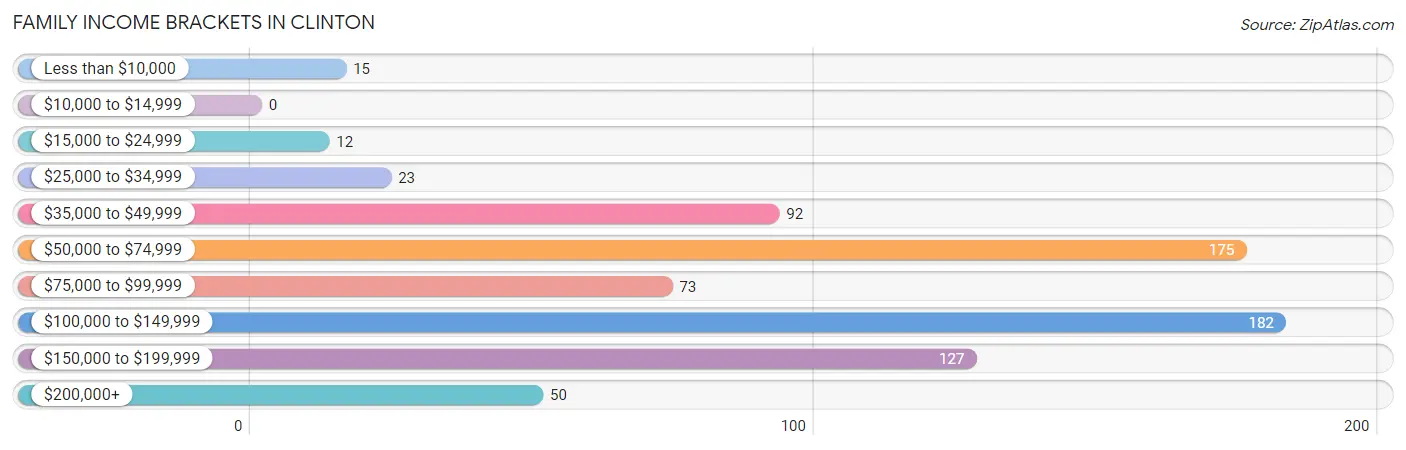
| Income Bracket | # Families | % Families |
| Less than $10,000 | 15 | 2.0% |
| $10,000 to $14,999 | 0 | 0.0% |
| $15,000 to $24,999 | 12 | 1.6% |
| $25,000 to $34,999 | 23 | 3.1% |
| $35,000 to $49,999 | 92 | 12.3% |
| $50,000 to $74,999 | 175 | 23.4% |
| $75,000 to $99,999 | 73 | 9.7% |
| $100,000 to $149,999 | 182 | 24.3% |
| $150,000 to $199,999 | 127 | 17.0% |
| $200,000+ | 50 | 6.7% |
Family Income by Famaliy Size in Clinton
6-person families (18 | 2.4%) account for the highest median family income in Clinton with $213,958 per family, while 5-person families (55 | 7.3%) have the highest median income of $38,276 per family member.
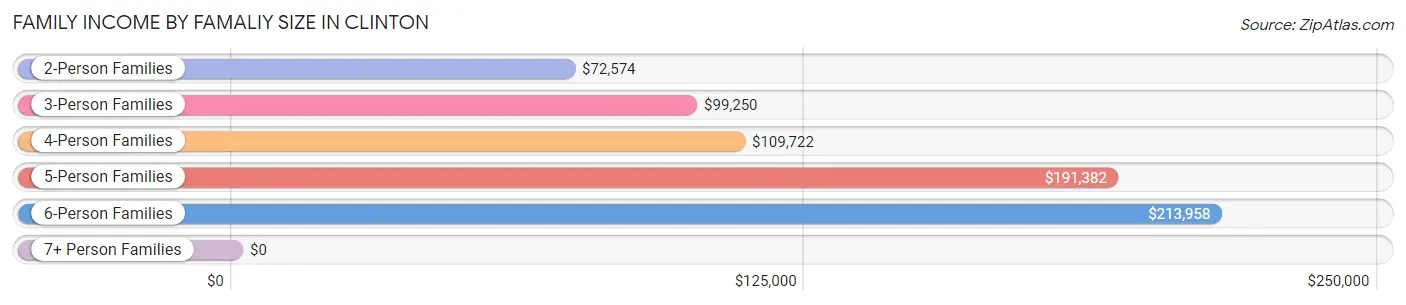
| Income Bracket | # Families | Median Income |
| 2-Person Families | 295 (39.4%) | $72,574 |
| 3-Person Families | 185 (24.7%) | $99,250 |
| 4-Person Families | 192 (25.6%) | $109,722 |
| 5-Person Families | 55 (7.3%) | $191,382 |
| 6-Person Families | 18 (2.4%) | $213,958 |
| 7+ Person Families | 4 (0.5%) | $0 |
| Total | 749 (100.0%) | $97,721 |
Family Income by Number of Earners in Clinton
The median family income in Clinton is $97,721, with families comprising 3+ earners (124) having the highest median family income of $151,630, while families with 1 earner (149) have the lowest median family income of $44,702, accounting for 16.6% and 19.9% of families, respectively.
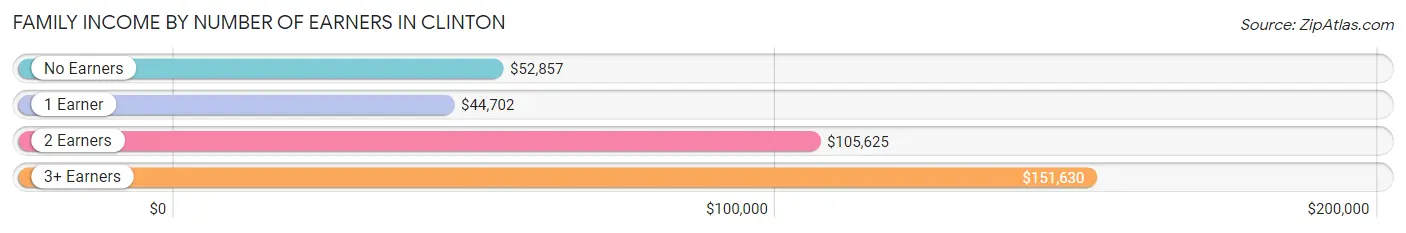
| Number of Earners | # Families | Median Income |
| No Earners | 66 (8.8%) | $52,857 |
| 1 Earner | 149 (19.9%) | $44,702 |
| 2 Earners | 410 (54.7%) | $105,625 |
| 3+ Earners | 124 (16.6%) | $151,630 |
| Total | 749 (100.0%) | $97,721 |
Household Income in Clinton
Household Income Brackets in Clinton
With 238 households falling in the category, the $50,000 to $74,999 income range is the most frequent in Clinton, accounting for 22.8% of all households.
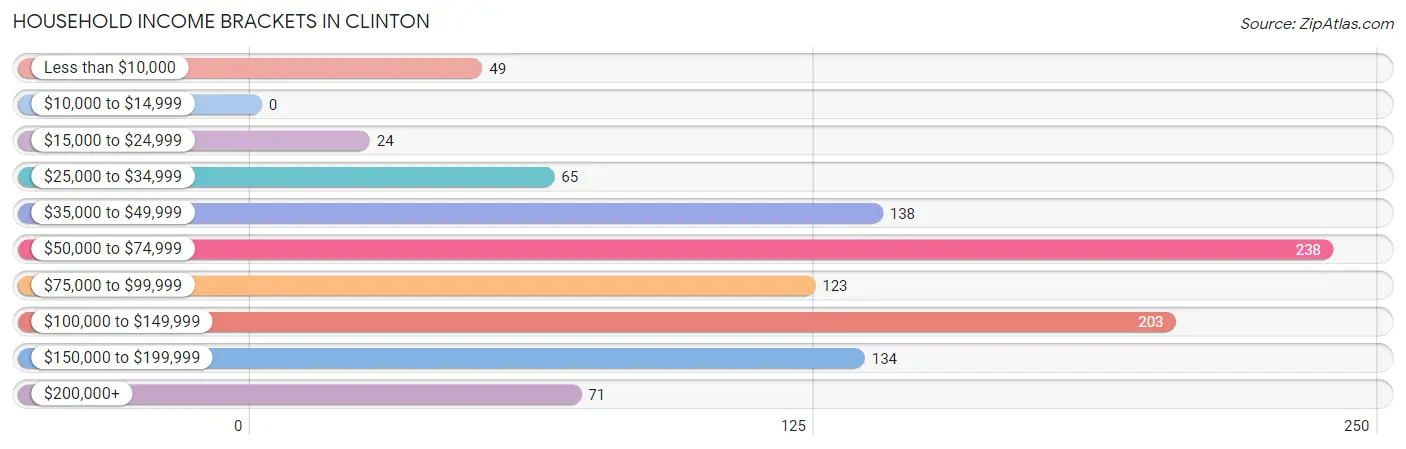
| Income Bracket | # Households | % Households |
| Less than $10,000 | 49 | 4.7% |
| $10,000 to $14,999 | 0 | 0.0% |
| $15,000 to $24,999 | 24 | 2.3% |
| $25,000 to $34,999 | 65 | 6.2% |
| $35,000 to $49,999 | 138 | 13.2% |
| $50,000 to $74,999 | 238 | 22.8% |
| $75,000 to $99,999 | 123 | 11.8% |
| $100,000 to $149,999 | 203 | 19.4% |
| $150,000 to $199,999 | 134 | 12.8% |
| $200,000+ | 71 | 6.8% |
Household Income by Householder Age in Clinton
The median household income in Clinton is $78,472, with the highest median household income of $106,484 found in the 45 to 64 years age bracket for the primary householder. A total of 553 households (52.9%) fall into this category. Meanwhile, the 15 to 24 years age bracket for the primary householder has the lowest median household income of $0, with 14 households (1.3%) in this group.
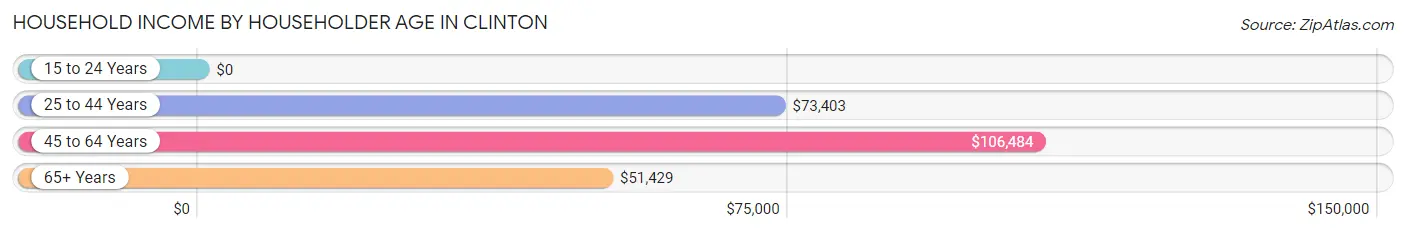
| Income Bracket | # Households | Median Income |
| 15 to 24 Years | 14 (1.3%) | $0 |
| 25 to 44 Years | 251 (24.0%) | $73,403 |
| 45 to 64 Years | 553 (52.9%) | $106,484 |
| 65+ Years | 228 (21.8%) | $51,429 |
| Total | 1,046 (100.0%) | $78,472 |
Poverty in Clinton
Income Below Poverty by Sex and Age in Clinton
With 5.7% poverty level for males and 4.5% for females among the residents of Clinton, 55 to 64 year old males and 18 to 24 year old females are the most vulnerable to poverty, with 41 males (16.0%) and 30 females (16.4%) in their respective age groups living below the poverty level.
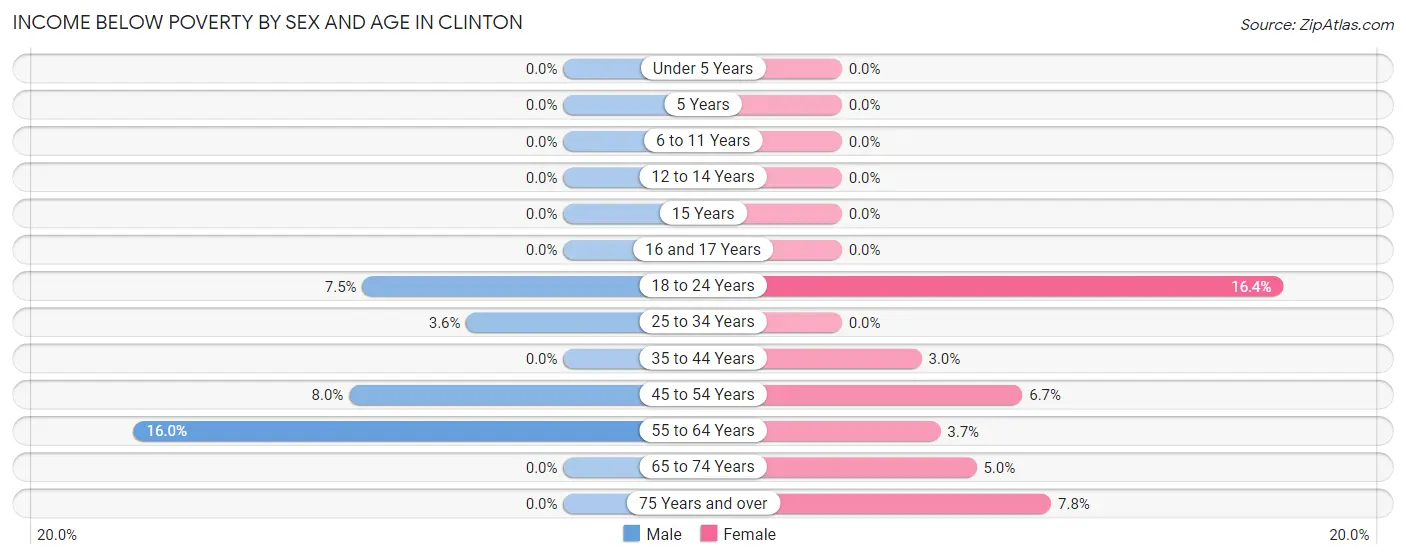
| Age Bracket | Male | Female |
| Under 5 Years | 0 (0.0%) | 0 (0.0%) |
| 5 Years | 0 (0.0%) | 0 (0.0%) |
| 6 to 11 Years | 0 (0.0%) | 0 (0.0%) |
| 12 to 14 Years | 0 (0.0%) | 0 (0.0%) |
| 15 Years | 0 (0.0%) | 0 (0.0%) |
| 16 and 17 Years | 0 (0.0%) | 0 (0.0%) |
| 18 to 24 Years | 10 (7.5%) | 30 (16.4%) |
| 25 to 34 Years | 8 (3.6%) | 0 (0.0%) |
| 35 to 44 Years | 0 (0.0%) | 4 (3.0%) |
| 45 to 54 Years | 19 (8.0%) | 13 (6.7%) |
| 55 to 64 Years | 41 (16.0%) | 9 (3.7%) |
| 65 to 74 Years | 0 (0.0%) | 7 (5.0%) |
| 75 Years and over | 0 (0.0%) | 8 (7.8%) |
| Total | 78 (5.7%) | 71 (4.5%) |
Income Above Poverty by Sex and Age in Clinton
According to the poverty statistics in Clinton, males aged under 5 years and females aged under 5 years are the age groups that are most secure financially, with 100.0% of males and 100.0% of females in these age groups living above the poverty line.
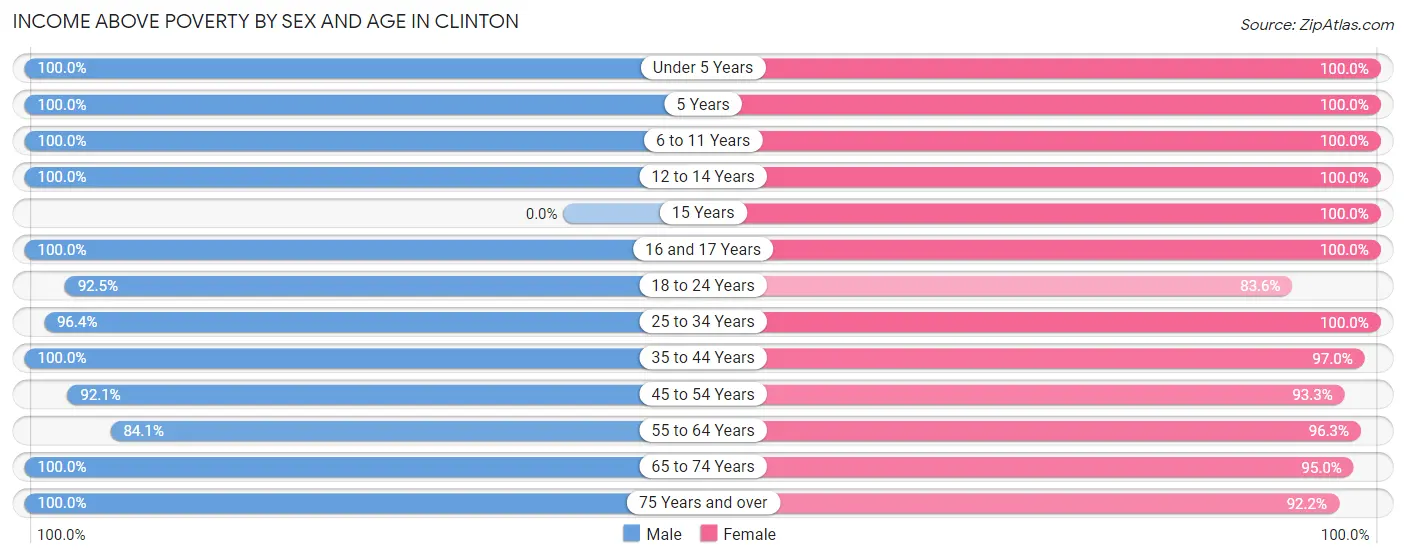
| Age Bracket | Male | Female |
| Under 5 Years | 100 (100.0%) | 100 (100.0%) |
| 5 Years | 12 (100.0%) | 8 (100.0%) |
| 6 to 11 Years | 84 (100.0%) | 146 (100.0%) |
| 12 to 14 Years | 72 (100.0%) | 40 (100.0%) |
| 15 Years | 0 (0.0%) | 18 (100.0%) |
| 16 and 17 Years | 19 (100.0%) | 11 (100.0%) |
| 18 to 24 Years | 124 (92.5%) | 153 (83.6%) |
| 25 to 34 Years | 214 (96.4%) | 243 (100.0%) |
| 35 to 44 Years | 118 (100.0%) | 131 (97.0%) |
| 45 to 54 Years | 220 (92.0%) | 181 (93.3%) |
| 55 to 64 Years | 216 (84.1%) | 237 (96.3%) |
| 65 to 74 Years | 62 (100.0%) | 133 (95.0%) |
| 75 Years and over | 43 (100.0%) | 95 (92.2%) |
| Total | 1,284 (94.3%) | 1,496 (95.5%) |
Income Below Poverty Among Married-Couple Families in Clinton
The poverty statistics for married-couple families in Clinton show that 1.2% or 7 of the total 566 families live below the poverty line. Families with no children have the highest poverty rate of 2.3%, comprising of 7 families. On the other hand, families with 1 or 2 children have the lowest poverty rate of 0.0%, which includes 0 families.
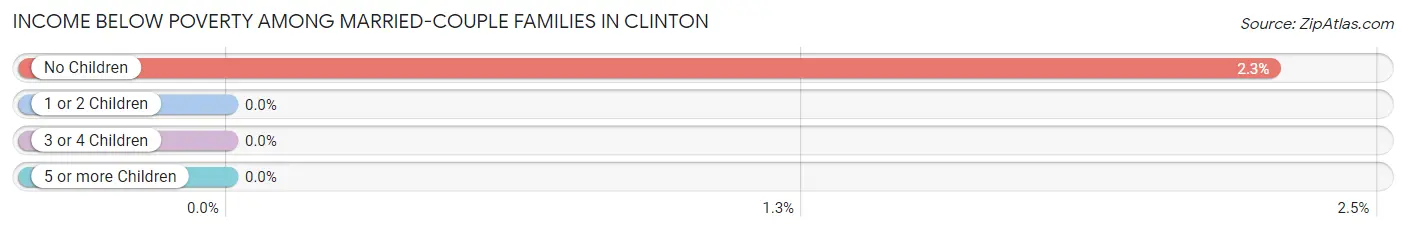
| Children | Above Poverty | Below Poverty |
| No Children | 301 (97.7%) | 7 (2.3%) |
| 1 or 2 Children | 242 (100.0%) | 0 (0.0%) |
| 3 or 4 Children | 16 (100.0%) | 0 (0.0%) |
| 5 or more Children | 0 (0.0%) | 0 (0.0%) |
| Total | 559 (98.8%) | 7 (1.2%) |
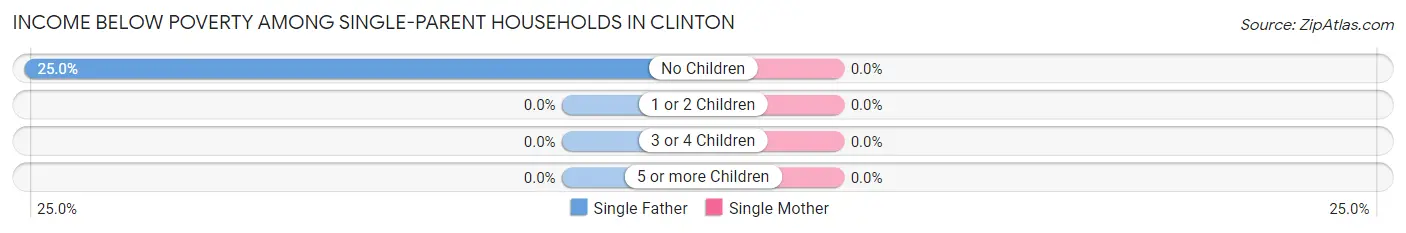
Income Below Poverty Among Single-Parent Households in Clinton
| Children | Single Father | Single Mother |
| No Children | 8 (25.0%) | 0 (0.0%) |
| 1 or 2 Children | 0 (0.0%) | 0 (0.0%) |
| 3 or 4 Children | 0 (0.0%) | 0 (0.0%) |
| 5 or more Children | 0 (0.0%) | 0 (0.0%) |
| Total | 8 (19.1%) | 0 (0.0%) |
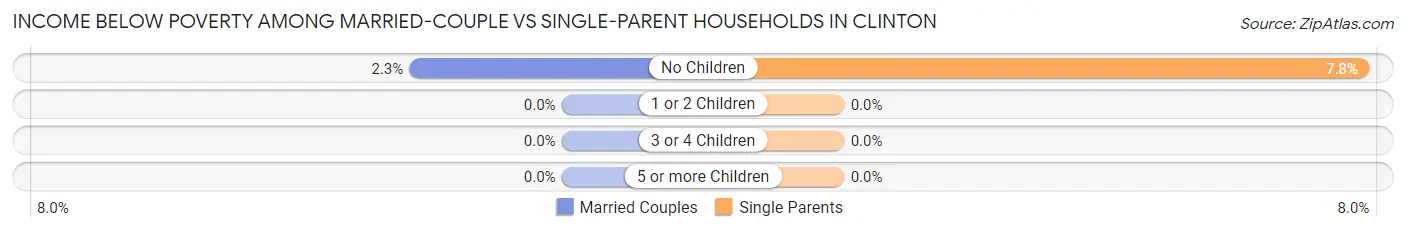
Income Below Poverty Among Married-Couple vs Single-Parent Households in Clinton
The poverty data for Clinton shows that 7 of the married-couple family households (1.2%) and 8 of the single-parent households (4.4%) are living below the poverty level. Within the married-couple family households, those with no children have the highest poverty rate, with 7 households (2.3%) falling below the poverty line. Among the single-parent households, those with no children have the highest poverty rate, with 8 household (7.8%) living below poverty.
| Children | Married-Couple Families | Single-Parent Households |
| No Children | 7 (2.3%) | 8 (7.8%) |
| 1 or 2 Children | 0 (0.0%) | 0 (0.0%) |
| 3 or 4 Children | 0 (0.0%) | 0 (0.0%) |
| 5 or more Children | 0 (0.0%) | 0 (0.0%) |
| Total | 7 (1.2%) | 8 (4.4%) |
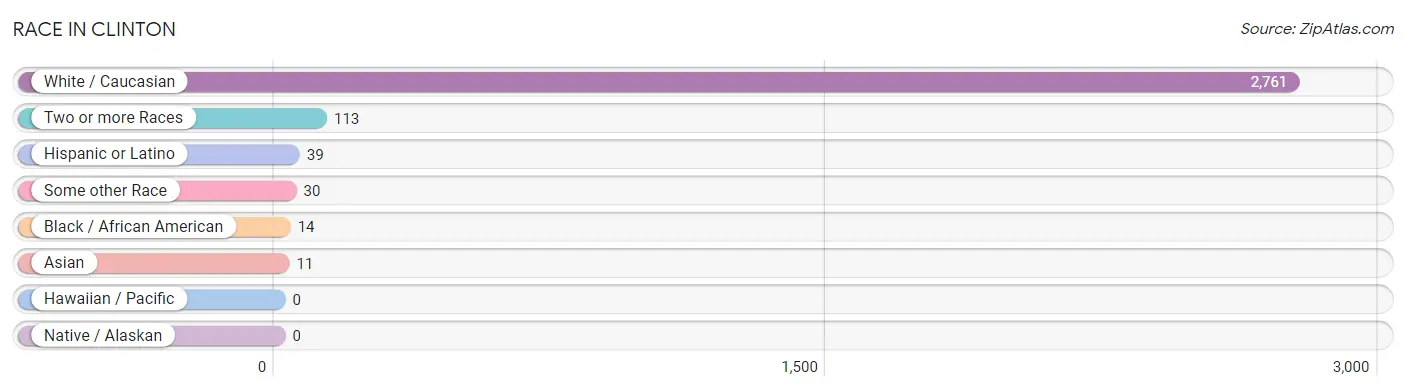
Race in Clinton
The most populous races in Clinton are White / Caucasian (2,761 | 94.3%), Two or more Races (113 | 3.9%), and Hispanic or Latino (39 | 1.3%).
| Race | # Population | % Population |
| Asian | 11 | 0.4% |
| Black / African American | 14 | 0.5% |
| Hawaiian / Pacific | 0 | 0.0% |
| Hispanic or Latino | 39 | 1.3% |
| Native / Alaskan | 0 | 0.0% |
| White / Caucasian | 2,761 | 94.3% |
| Two or more Races | 113 | 3.9% |
| Some other Race | 30 | 1.0% |
| Total | 2,929 | 100.0% |
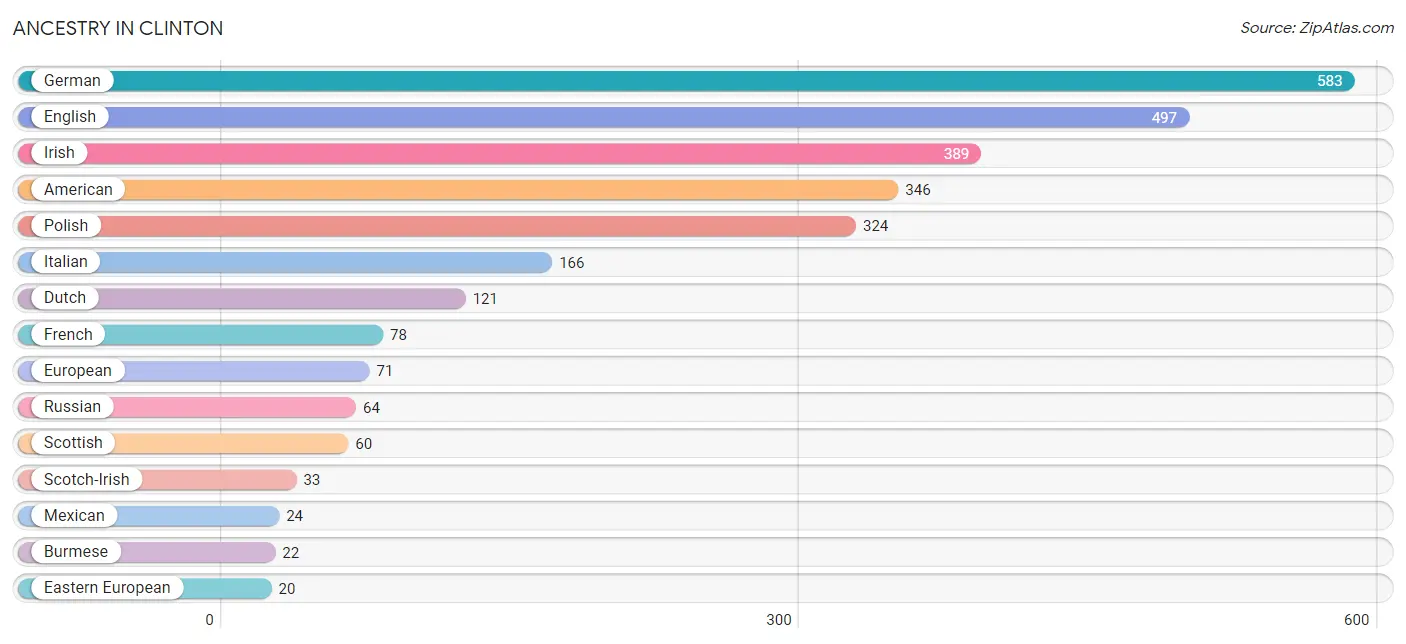
Ancestry in Clinton
The most populous ancestries reported in Clinton are German (583 | 19.9%), English (497 | 17.0%), Irish (389 | 13.3%), American (346 | 11.8%), and Polish (324 | 11.1%), together accounting for 73.0% of all Clinton residents.
| Ancestry | # Population | % Population |
| African | 17 | 0.6% |
| American | 346 | 11.8% |
| Basque | 11 | 0.4% |
| Bhutanese | 5 | 0.2% |
| British | 5 | 0.2% |
| Burmese | 22 | 0.7% |
| Canadian | 5 | 0.2% |
| Cherokee | 19 | 0.6% |
| Czechoslovakian | 5 | 0.2% |
| Dutch | 121 | 4.1% |
| Eastern European | 20 | 0.7% |
| English | 497 | 17.0% |
| Ethiopian | 9 | 0.3% |
| European | 71 | 2.4% |
| Finnish | 13 | 0.4% |
| French | 78 | 2.7% |
| French Canadian | 16 | 0.5% |
| German | 583 | 19.9% |
| Greek | 2 | 0.1% |
| Hungarian | 13 | 0.4% |
| Irish | 389 | 13.3% |
| Italian | 166 | 5.7% |
| Korean | 6 | 0.2% |
| Lithuanian | 16 | 0.5% |
| Mexican | 24 | 0.8% |
| Mexican American Indian | 2 | 0.1% |
| New Zealander | 6 | 0.2% |
| Ottawa | 5 | 0.2% |
| Polish | 324 | 11.1% |
| Puerto Rican | 9 | 0.3% |
| Russian | 64 | 2.2% |
| Scotch-Irish | 33 | 1.1% |
| Scottish | 60 | 2.1% |
| Subsaharan African | 17 | 0.6% |
| Swedish | 11 | 0.4% |
| Ukrainian | 17 | 0.6% |
| Welsh | 8 | 0.3% | View All 37 Rows |
Immigrants in Clinton
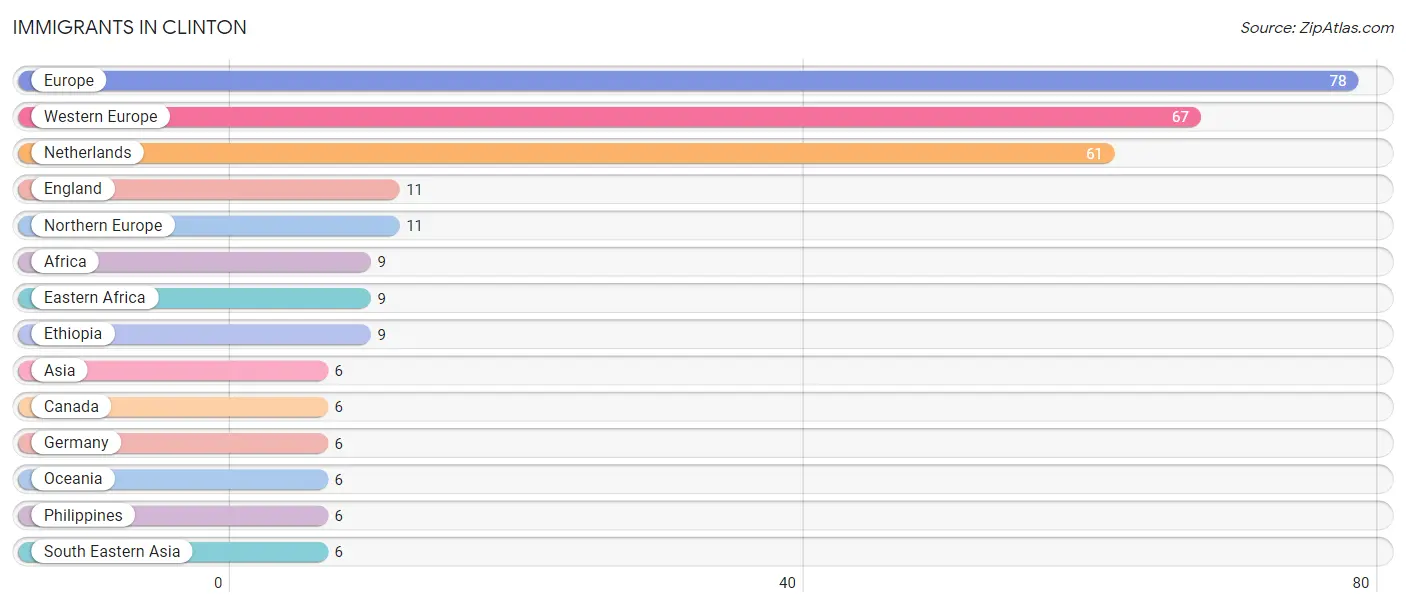
The most numerous immigrant groups reported in Clinton came from Europe (78 | 2.7%), Western Europe (67 | 2.3%), Netherlands (61 | 2.1%), England (11 | 0.4%), and Northern Europe (11 | 0.4%), together accounting for 7.8% of all Clinton residents.
| Immigration Origin | # Population | % Population |
| Africa | 9 | 0.3% |
| Asia | 6 | 0.2% |
| Canada | 6 | 0.2% |
| Eastern Africa | 9 | 0.3% |
| England | 11 | 0.4% |
| Ethiopia | 9 | 0.3% |
| Europe | 78 | 2.7% |
| Germany | 6 | 0.2% |
| Netherlands | 61 | 2.1% |
| Northern Europe | 11 | 0.4% |
| Oceania | 6 | 0.2% |
| Philippines | 6 | 0.2% |
| South Eastern Asia | 6 | 0.2% |
| Western Europe | 67 | 2.3% | View All 14 Rows |
Sex and Age in Clinton
Sex and Age in Clinton
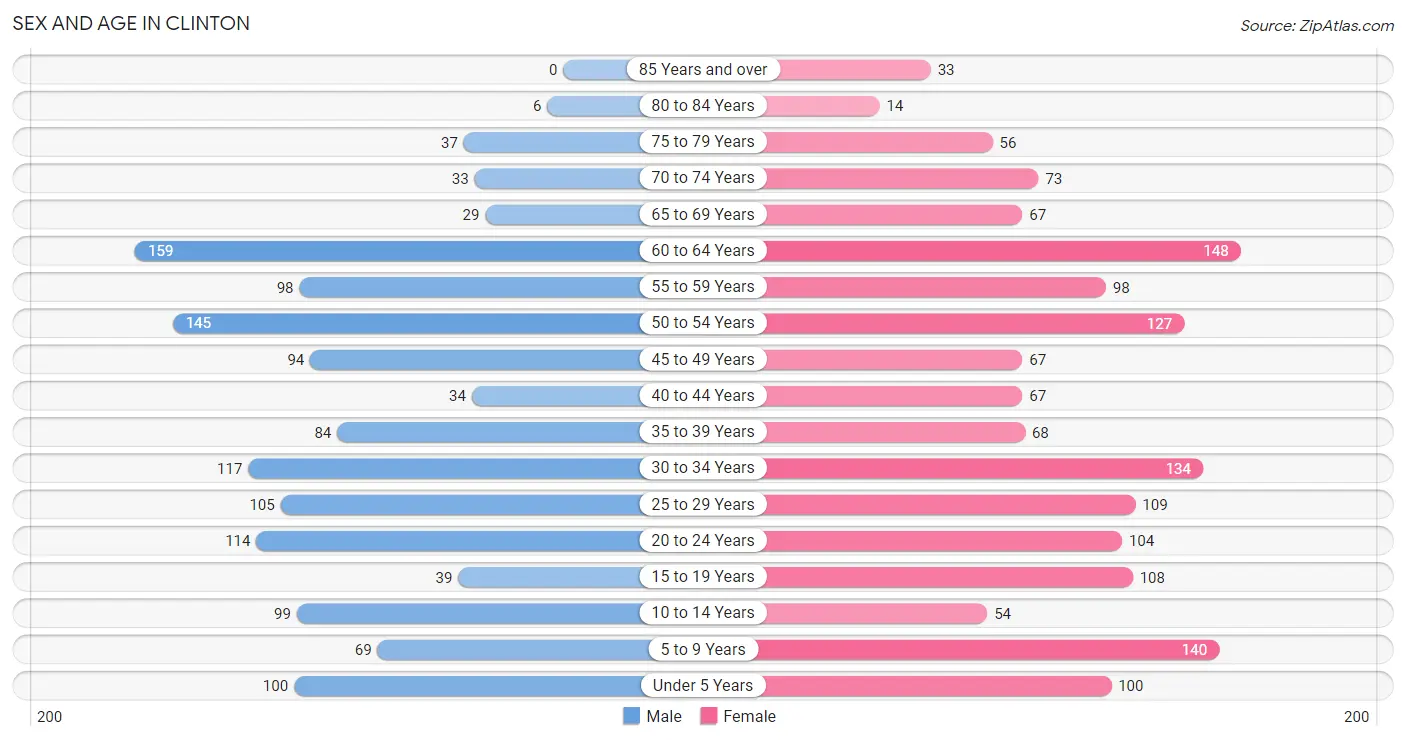
The most populous age groups in Clinton are 60 to 64 Years (159 | 11.7%) for men and 60 to 64 Years (148 | 9.4%) for women.
| Age Bracket | Male | Female |
| Under 5 Years | 100 (7.3%) | 100 (6.4%) |
| 5 to 9 Years | 69 (5.1%) | 140 (8.9%) |
| 10 to 14 Years | 99 (7.3%) | 54 (3.5%) |
| 15 to 19 Years | 39 (2.9%) | 108 (6.9%) |
| 20 to 24 Years | 114 (8.4%) | 104 (6.6%) |
| 25 to 29 Years | 105 (7.7%) | 109 (7.0%) |
| 30 to 34 Years | 117 (8.6%) | 134 (8.6%) |
| 35 to 39 Years | 84 (6.2%) | 68 (4.3%) |
| 40 to 44 Years | 34 (2.5%) | 67 (4.3%) |
| 45 to 49 Years | 94 (6.9%) | 67 (4.3%) |
| 50 to 54 Years | 145 (10.6%) | 127 (8.1%) |
| 55 to 59 Years | 98 (7.2%) | 98 (6.2%) |
| 60 to 64 Years | 159 (11.7%) | 148 (9.4%) |
| 65 to 69 Years | 29 (2.1%) | 67 (4.3%) |
| 70 to 74 Years | 33 (2.4%) | 73 (4.7%) |
| 75 to 79 Years | 37 (2.7%) | 56 (3.6%) |
| 80 to 84 Years | 6 (0.4%) | 14 (0.9%) |
| 85 Years and over | 0 (0.0%) | 33 (2.1%) |
| Total | 1,362 (100.0%) | 1,567 (100.0%) |
Families and Households in Clinton
Median Family Size in Clinton
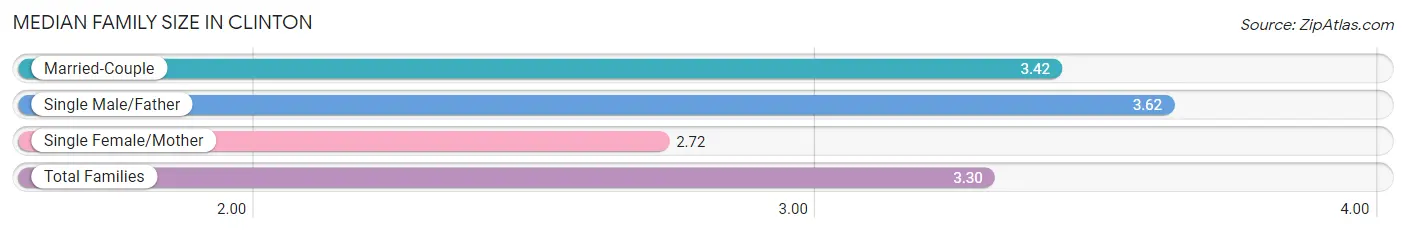
The median family size in Clinton is 3.30 persons per family, with single male/father families (42 | 5.6%) accounting for the largest median family size of 3.62 persons per family. On the other hand, single female/mother families (141 | 18.8%) represent the smallest median family size with 2.72 persons per family.
| Family Type | # Families | Family Size |
| Married-Couple | 566 (75.6%) | 3.42 |
| Single Male/Father | 42 (5.6%) | 3.62 |
| Single Female/Mother | 141 (18.8%) | 2.72 |
| Total Families | 749 (100.0%) | 3.30 |
Median Household Size in Clinton
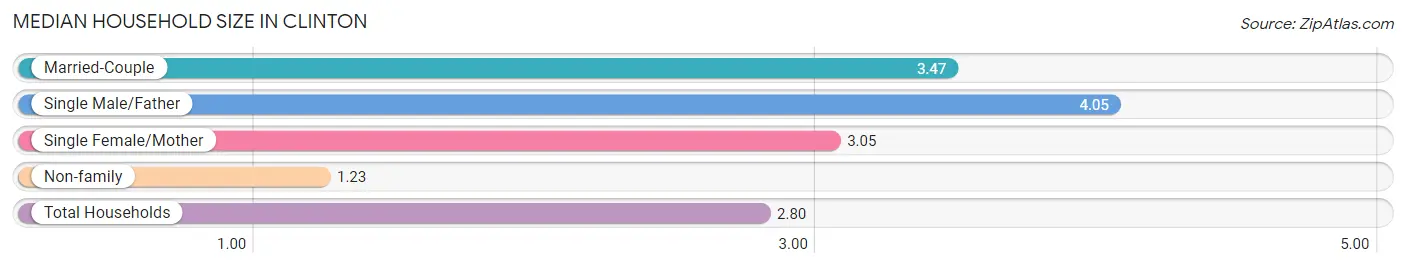
The median household size in Clinton is 2.80 persons per household, with single male/father households (42 | 4.0%) accounting for the largest median household size of 4.05 persons per household. non-family households (297 | 28.4%) represent the smallest median household size with 1.23 persons per household.
| Household Type | # Households | Household Size |
| Married-Couple | 566 (54.1%) | 3.47 |
| Single Male/Father | 42 (4.0%) | 4.05 |
| Single Female/Mother | 141 (13.5%) | 3.05 |
| Non-family | 297 (28.4%) | 1.23 |
| Total Households | 1,046 (100.0%) | 2.80 |
Household Size by Marriage Status in Clinton
Out of a total of 1,046 households in Clinton, 749 (71.6%) are family households, while 297 (28.4%) are nonfamily households. The most numerous type of family households are 2-person households, comprising 283, and the most common type of nonfamily households are 1-person households, comprising 227.
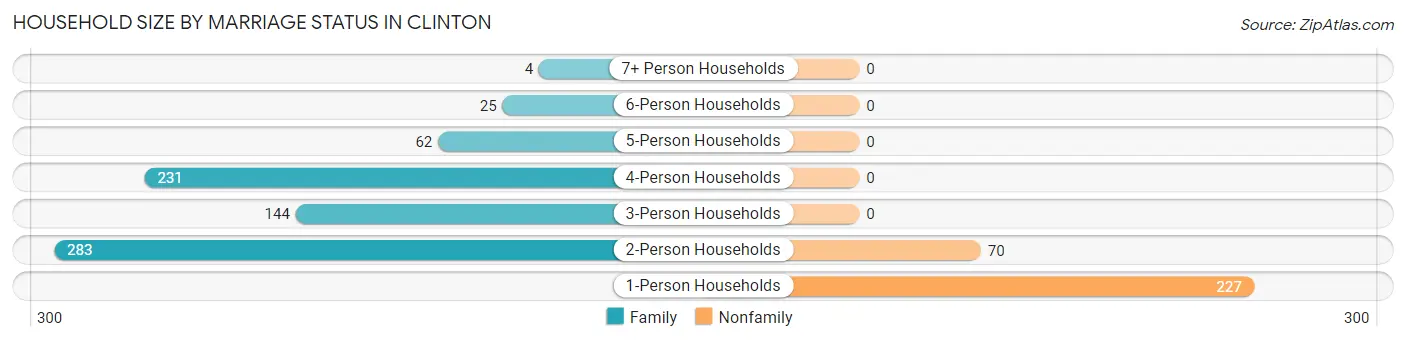
| Household Size | Family Households | Nonfamily Households |
| 1-Person Households | - | 227 (21.7%) |
| 2-Person Households | 283 (27.1%) | 70 (6.7%) |
| 3-Person Households | 144 (13.8%) | 0 (0.0%) |
| 4-Person Households | 231 (22.1%) | 0 (0.0%) |
| 5-Person Households | 62 (5.9%) | 0 (0.0%) |
| 6-Person Households | 25 (2.4%) | 0 (0.0%) |
| 7+ Person Households | 4 (0.4%) | 0 (0.0%) |
| Total | 749 (71.6%) | 297 (28.4%) |
Female Fertility in Clinton
Fertility by Age in Clinton
Average fertility rate in Clinton is 81.0 births per 1,000 women. Women in the age bracket of 20 to 34 years have the highest fertility rate with 110.0 births per 1,000 women. Women in the age bracket of 20 to 34 years acount for 70.4% of all women with births.
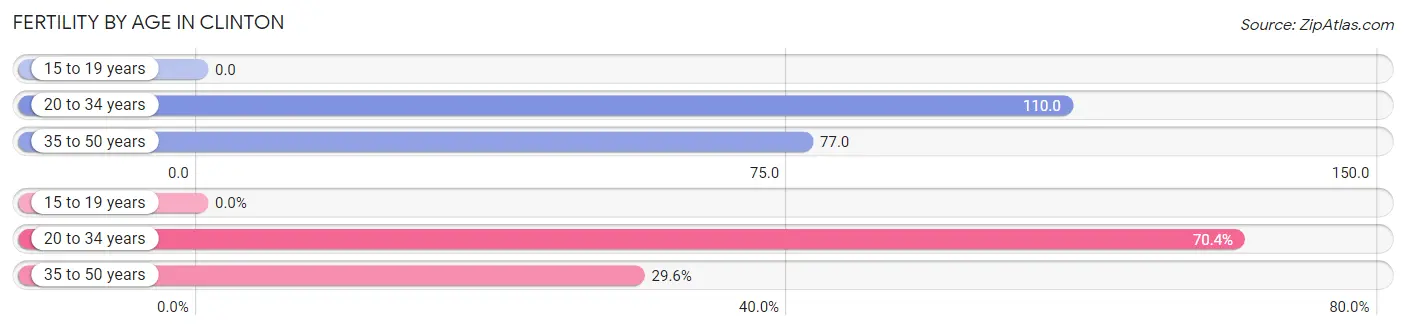
| Age Bracket | Women with Births | Births / 1,000 Women |
| 15 to 19 years | 0 (0.0%) | 0.0 |
| 20 to 34 years | 38 (70.4%) | 110.0 |
| 35 to 50 years | 16 (29.6%) | 77.0 |
| Total | 54 (100.0%) | 81.0 |
Fertility by Age by Marriage Status in Clinton
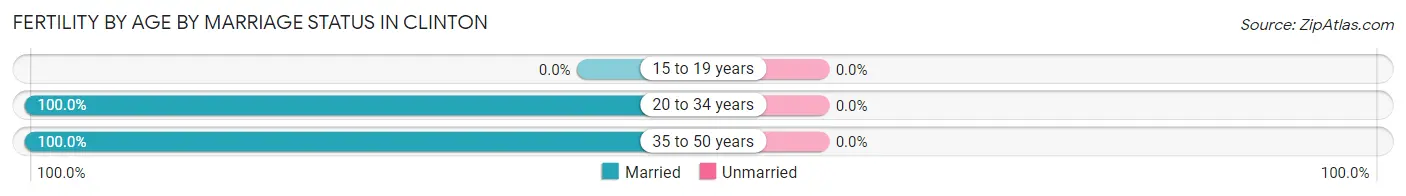
| Age Bracket | Married | Unmarried |
| 15 to 19 years | 0 (0.0%) | 0 (0.0%) |
| 20 to 34 years | 38 (100.0%) | 0 (0.0%) |
| 35 to 50 years | 16 (100.0%) | 0 (0.0%) |
| Total | 54 (100.0%) | 0 (0.0%) |
Fertility by Education in Clinton
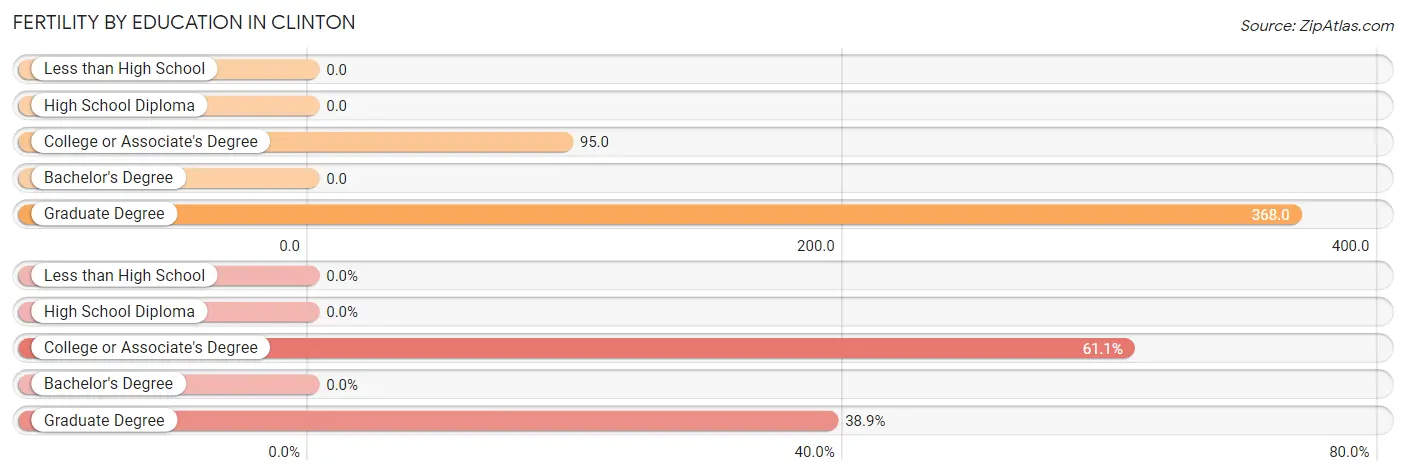
| Educational Attainment | Women with Births | Births / 1,000 Women |
| Less than High School | 0 (0.0%) | 0.0 |
| High School Diploma | 0 (0.0%) | 0.0 |
| College or Associate's Degree | 33 (61.1%) | 95.0 |
| Bachelor's Degree | 0 (0.0%) | 0.0 |
| Graduate Degree | 21 (38.9%) | 368.0 |
| Total | 54 (100.0%) | 81.0 |
Fertility by Education by Marriage Status in Clinton
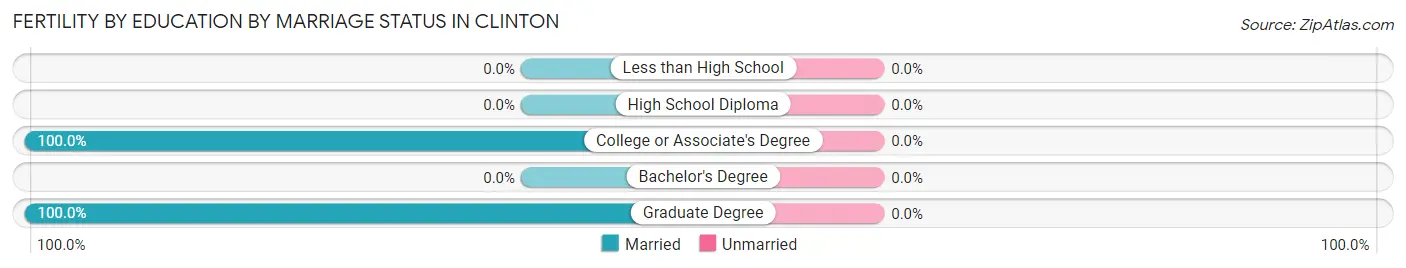
| Educational Attainment | Married | Unmarried |
| Less than High School | 0 (0.0%) | 0 (0.0%) |
| High School Diploma | 0 (0.0%) | 0 (0.0%) |
| College or Associate's Degree | 33 (100.0%) | 0 (0.0%) |
| Bachelor's Degree | 0 (0.0%) | 0 (0.0%) |
| Graduate Degree | 21 (100.0%) | 0 (0.0%) |
| Total | 54 (100.0%) | 0 (0.0%) |
Employment Characteristics in Clinton
Employment by Class of Employer in Clinton
Among the 1,570 employed individuals in Clinton, private company employees (1,082 | 68.9%), not-for-profit organizations (148 | 9.4%), and local government employees (132 | 8.4%) make up the most common classes of employment.
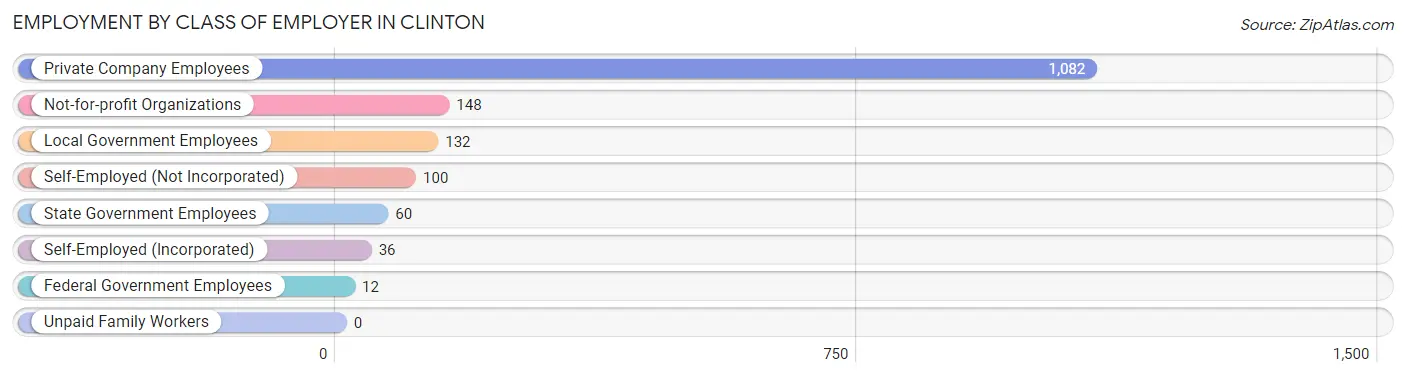
| Employer Class | # Employees | % Employees |
| Private Company Employees | 1,082 | 68.9% |
| Self-Employed (Incorporated) | 36 | 2.3% |
| Self-Employed (Not Incorporated) | 100 | 6.4% |
| Not-for-profit Organizations | 148 | 9.4% |
| Local Government Employees | 132 | 8.4% |
| State Government Employees | 60 | 3.8% |
| Federal Government Employees | 12 | 0.8% |
| Unpaid Family Workers | 0 | 0.0% |
| Total | 1,570 | 100.0% |
Employment Status by Age in Clinton
According to the labor force statistics for Clinton, out of the total population over 16 years of age (2,349), 74.7% or 1,755 individuals are in the labor force, with 7.4% or 130 of them unemployed. The age group with the highest labor force participation rate is 35 to 44 years, with 94.9% or 240 individuals in the labor force. Within the labor force, the 75 years and over age range has the highest percentage of unemployed individuals, with 36.8% or 7 of them being unemployed.
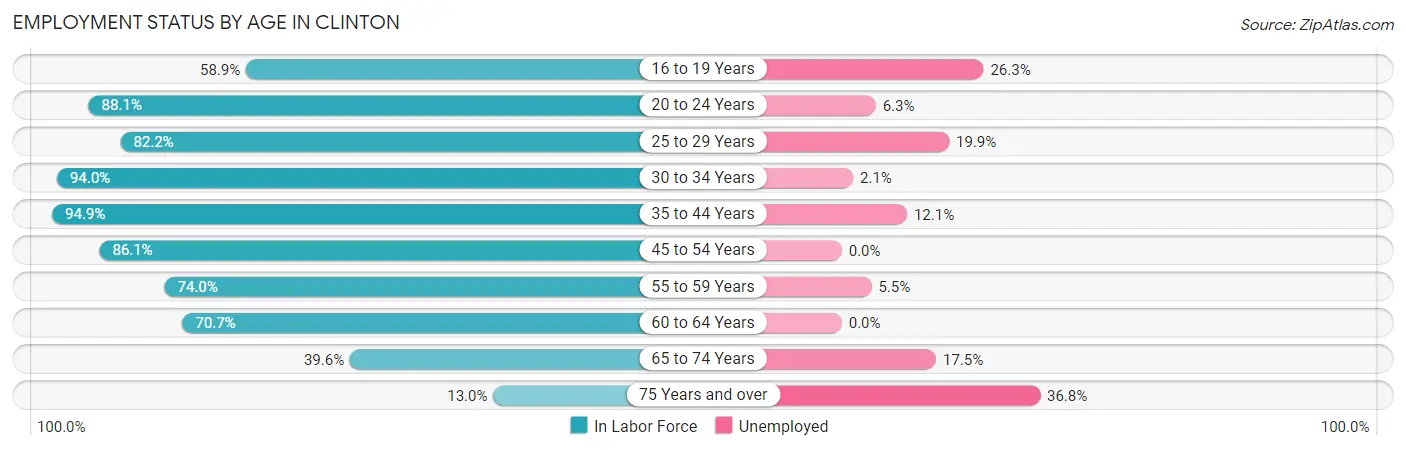
| Age Bracket | In Labor Force | Unemployed |
| 16 to 19 Years | 76 (58.9%) | 20 (26.3%) |
| 20 to 24 Years | 192 (88.1%) | 12 (6.3%) |
| 25 to 29 Years | 176 (82.2%) | 35 (19.9%) |
| 30 to 34 Years | 236 (94.0%) | 5 (2.1%) |
| 35 to 44 Years | 240 (94.9%) | 29 (12.1%) |
| 45 to 54 Years | 373 (86.1%) | 0 (0.0%) |
| 55 to 59 Years | 145 (74.0%) | 8 (5.5%) |
| 60 to 64 Years | 217 (70.7%) | 0 (0.0%) |
| 65 to 74 Years | 80 (39.6%) | 14 (17.5%) |
| 75 Years and over | 19 (13.0%) | 7 (36.8%) |
| Total | 1,755 (74.7%) | 130 (7.4%) |
Employment Status by Educational Attainment in Clinton
According to labor force statistics for Clinton, 83.9% of individuals (1,388) out of the total population between 25 and 64 years of age (1,654) are in the labor force, with 5.6% or 78 of them being unemployed. The group with the highest labor force participation rate are those with the educational attainment of bachelor's degree or higher, with 92.0% or 451 individuals in the labor force. Within the labor force, individuals with high school diploma education have the highest percentage of unemployment, with 14.5% or 56 of them being unemployed.
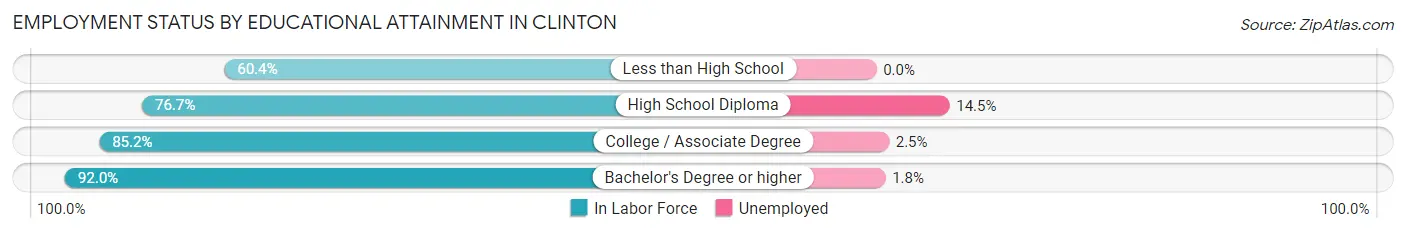
| Educational Attainment | In Labor Force | Unemployed |
| Less than High School | 32 (60.4%) | 0 (0.0%) |
| High School Diploma | 385 (76.7%) | 73 (14.5%) |
| College / Associate Degree | 519 (85.2%) | 15 (2.5%) |
| Bachelor's Degree or higher | 451 (92.0%) | 9 (1.8%) |
| Total | 1,388 (83.9%) | 93 (5.6%) |
Employment Occupations by Sex in Clinton
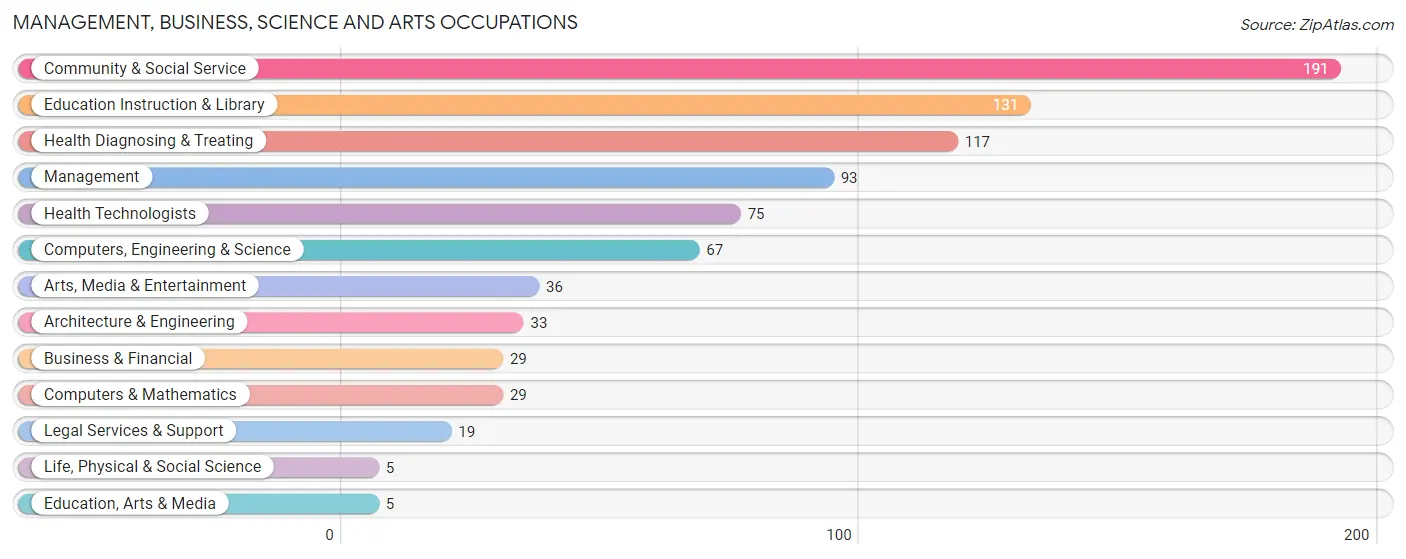
Management, Business, Science and Arts Occupations
The most common Management, Business, Science and Arts occupations in Clinton are Community & Social Service (191 | 11.8%), Education Instruction & Library (131 | 8.1%), Health Diagnosing & Treating (117 | 7.2%), Management (93 | 5.7%), and Health Technologists (75 | 4.6%).
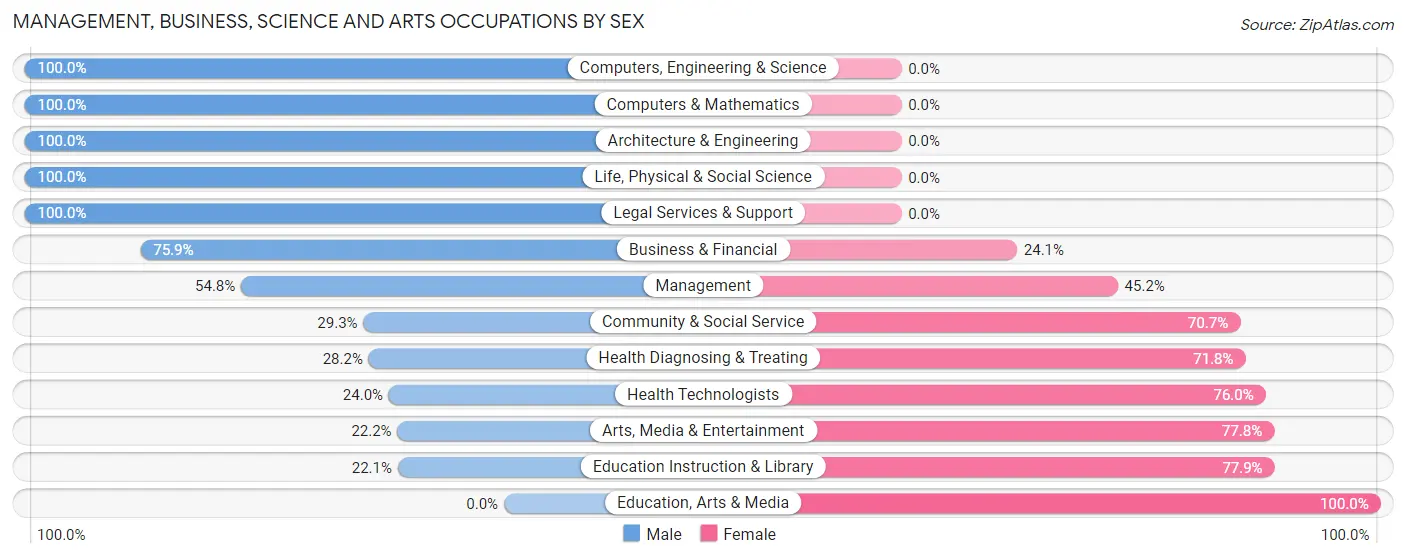
Management, Business, Science and Arts Occupations by Sex
Within the Management, Business, Science and Arts occupations in Clinton, the most male-oriented occupations are Computers, Engineering & Science (100.0%), Computers & Mathematics (100.0%), and Architecture & Engineering (100.0%), while the most female-oriented occupations are Education, Arts & Media (100.0%), Education Instruction & Library (77.9%), and Arts, Media & Entertainment (77.8%).
| Occupation | Male | Female |
| Management | 51 (54.8%) | 42 (45.2%) |
| Business & Financial | 22 (75.9%) | 7 (24.1%) |
| Computers, Engineering & Science | 67 (100.0%) | 0 (0.0%) |
| Computers & Mathematics | 29 (100.0%) | 0 (0.0%) |
| Architecture & Engineering | 33 (100.0%) | 0 (0.0%) |
| Life, Physical & Social Science | 5 (100.0%) | 0 (0.0%) |
| Community & Social Service | 56 (29.3%) | 135 (70.7%) |
| Education, Arts & Media | 0 (0.0%) | 5 (100.0%) |
| Legal Services & Support | 19 (100.0%) | 0 (0.0%) |
| Education Instruction & Library | 29 (22.1%) | 102 (77.9%) |
| Arts, Media & Entertainment | 8 (22.2%) | 28 (77.8%) |
| Health Diagnosing & Treating | 33 (28.2%) | 84 (71.8%) |
| Health Technologists | 18 (24.0%) | 57 (76.0%) |
| Total (Category) | 229 (46.1%) | 268 (53.9%) |
| Total (Overall) | 823 (50.7%) | 801 (49.3%) |
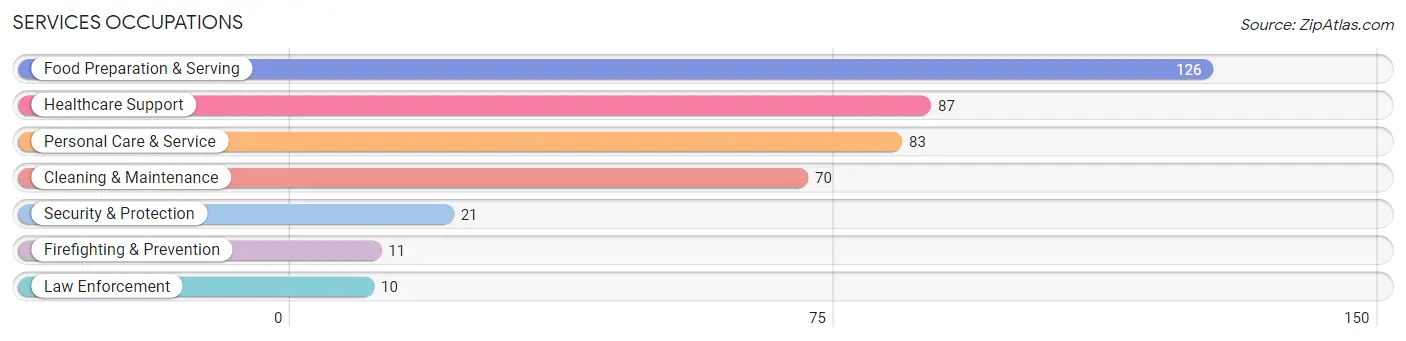
Services Occupations
The most common Services occupations in Clinton are Food Preparation & Serving (126 | 7.8%), Healthcare Support (87 | 5.4%), Personal Care & Service (83 | 5.1%), Cleaning & Maintenance (70 | 4.3%), and Security & Protection (21 | 1.3%).
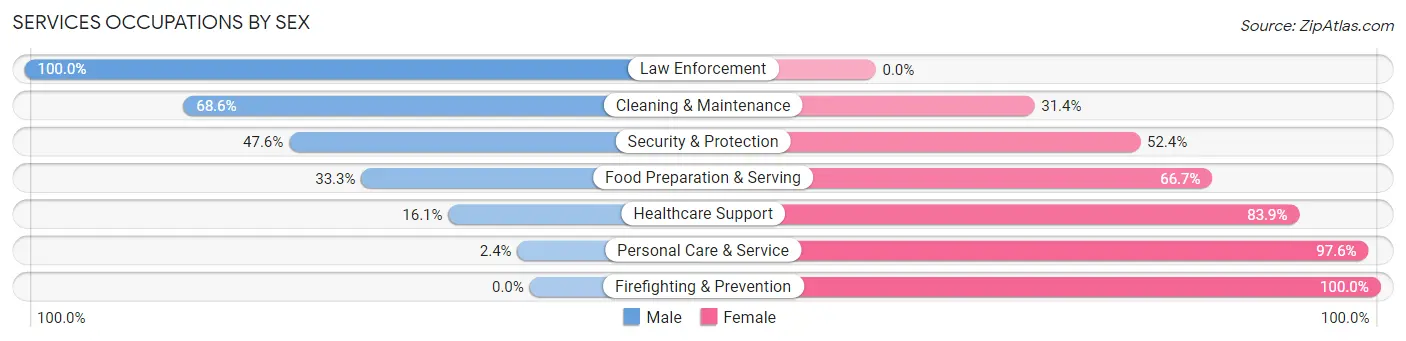
Services Occupations by Sex
Within the Services occupations in Clinton, the most male-oriented occupations are Law Enforcement (100.0%), Cleaning & Maintenance (68.6%), and Security & Protection (47.6%), while the most female-oriented occupations are Firefighting & Prevention (100.0%), Personal Care & Service (97.6%), and Healthcare Support (83.9%).
| Occupation | Male | Female |
| Healthcare Support | 14 (16.1%) | 73 (83.9%) |
| Security & Protection | 10 (47.6%) | 11 (52.4%) |
| Firefighting & Prevention | 0 (0.0%) | 11 (100.0%) |
| Law Enforcement | 10 (100.0%) | 0 (0.0%) |
| Food Preparation & Serving | 42 (33.3%) | 84 (66.7%) |
| Cleaning & Maintenance | 48 (68.6%) | 22 (31.4%) |
| Personal Care & Service | 2 (2.4%) | 81 (97.6%) |
| Total (Category) | 116 (30.0%) | 271 (70.0%) |
| Total (Overall) | 823 (50.7%) | 801 (49.3%) |
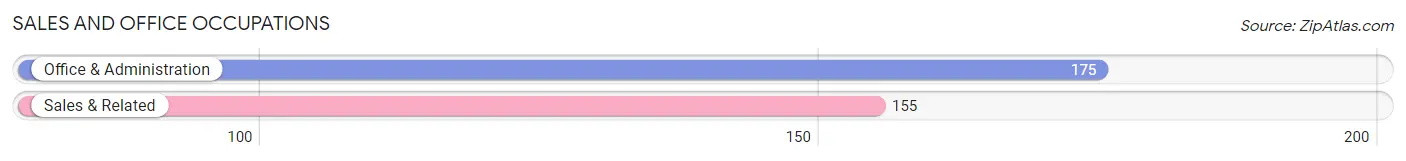
Sales and Office Occupations
The most common Sales and Office occupations in Clinton are Office & Administration (175 | 10.8%), and Sales & Related (155 | 9.5%).
Sales and Office Occupations by Sex
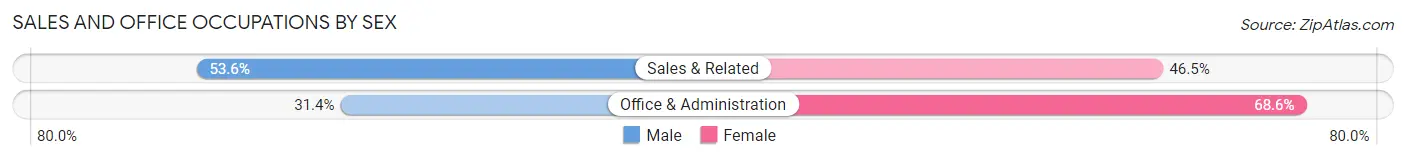
| Occupation | Male | Female |
| Sales & Related | 83 (53.5%) | 72 (46.5%) |
| Office & Administration | 55 (31.4%) | 120 (68.6%) |
| Total (Category) | 138 (41.8%) | 192 (58.2%) |
| Total (Overall) | 823 (50.7%) | 801 (49.3%) |
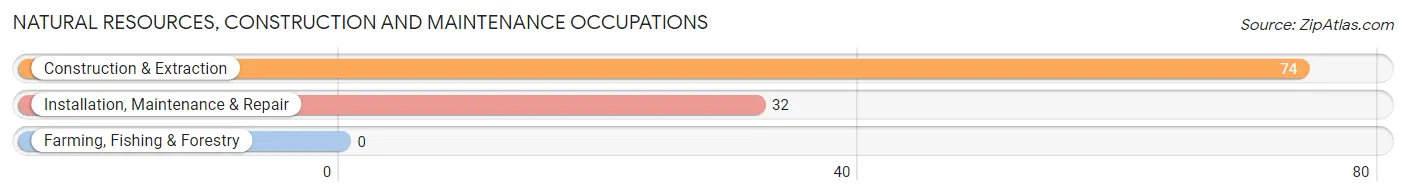
Natural Resources, Construction and Maintenance Occupations
The most common Natural Resources, Construction and Maintenance occupations in Clinton are Construction & Extraction (74 | 4.6%), and Installation, Maintenance & Repair (32 | 2.0%).
Natural Resources, Construction and Maintenance Occupations by Sex
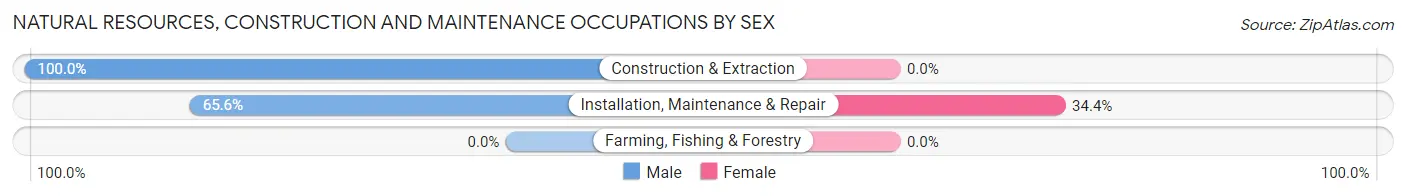
| Occupation | Male | Female |
| Farming, Fishing & Forestry | 0 (0.0%) | 0 (0.0%) |
| Construction & Extraction | 74 (100.0%) | 0 (0.0%) |
| Installation, Maintenance & Repair | 21 (65.6%) | 11 (34.4%) |
| Total (Category) | 95 (89.6%) | 11 (10.4%) |
| Total (Overall) | 823 (50.7%) | 801 (49.3%) |
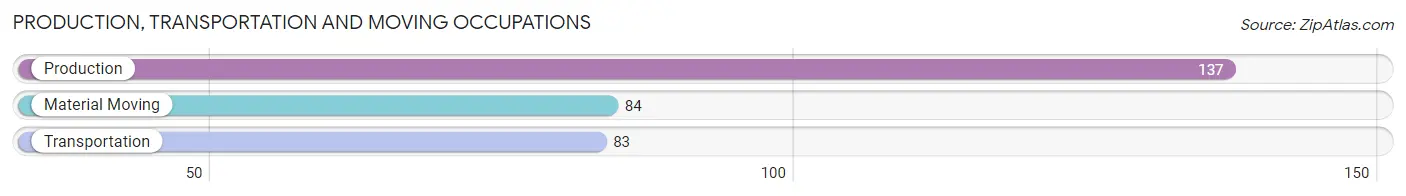
Production, Transportation and Moving Occupations
The most common Production, Transportation and Moving occupations in Clinton are Production (137 | 8.4%), Material Moving (84 | 5.2%), and Transportation (83 | 5.1%).
Production, Transportation and Moving Occupations by Sex
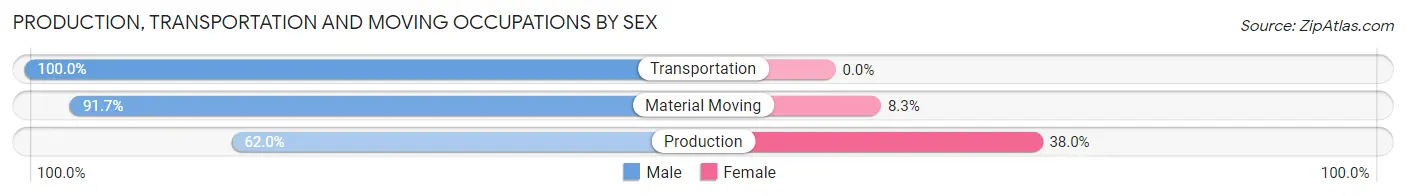
| Occupation | Male | Female |
| Production | 85 (62.0%) | 52 (38.0%) |
| Transportation | 83 (100.0%) | 0 (0.0%) |
| Material Moving | 77 (91.7%) | 7 (8.3%) |
| Total (Category) | 245 (80.6%) | 59 (19.4%) |
| Total (Overall) | 823 (50.7%) | 801 (49.3%) |
Employment Industries by Sex in Clinton
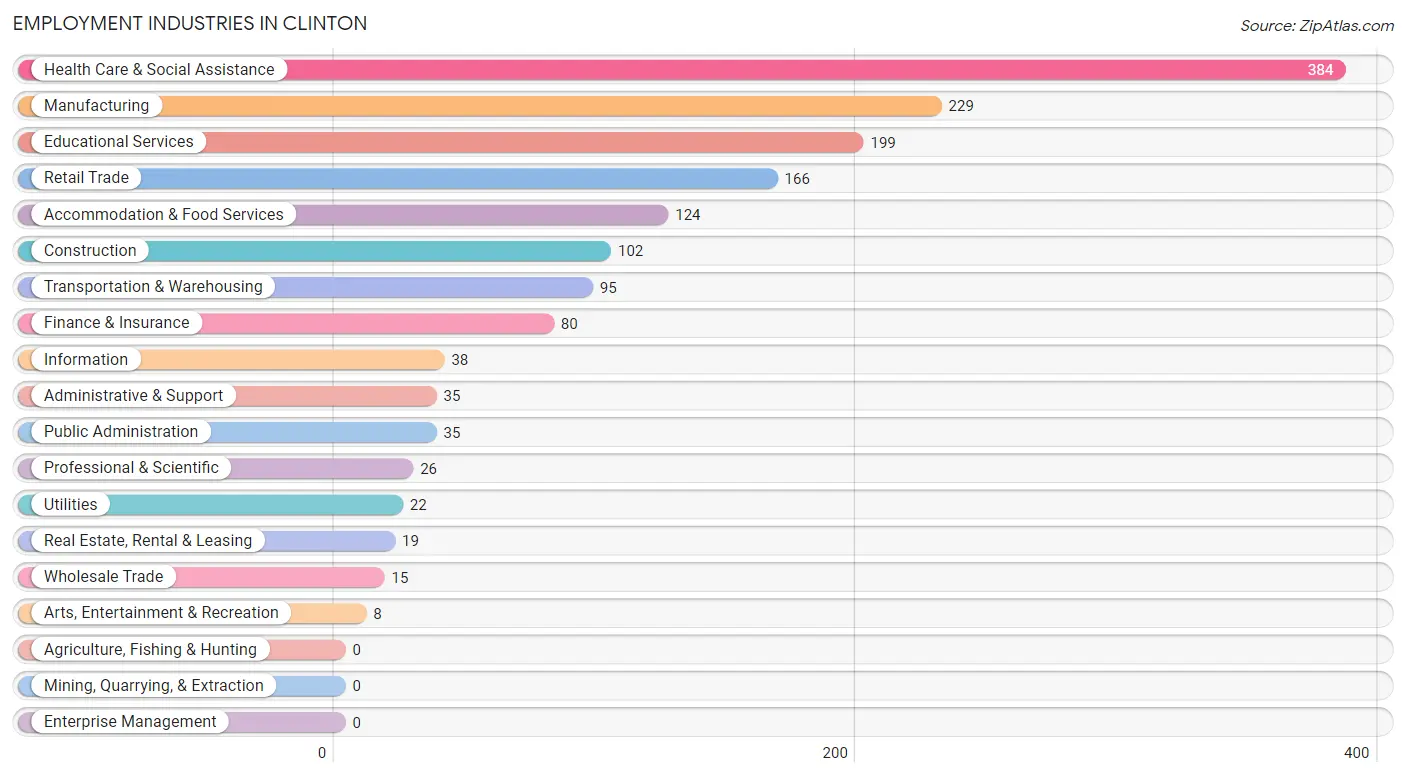
Employment Industries in Clinton
The major employment industries in Clinton include Health Care & Social Assistance (384 | 23.6%), Manufacturing (229 | 14.1%), Educational Services (199 | 12.2%), Retail Trade (166 | 10.2%), and Accommodation & Food Services (124 | 7.6%).
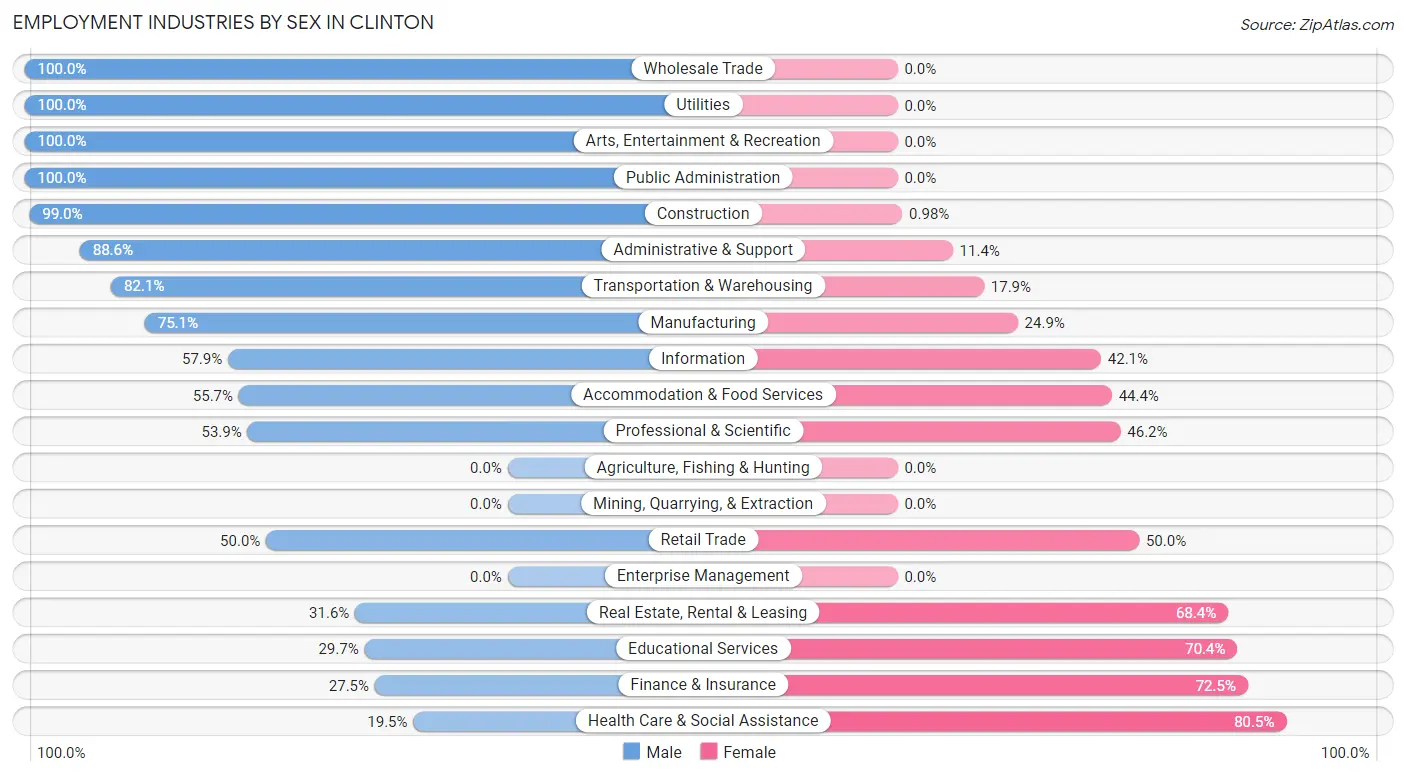
Employment Industries by Sex in Clinton
The Clinton industries that see more men than women are Wholesale Trade (100.0%), Utilities (100.0%), and Arts, Entertainment & Recreation (100.0%), whereas the industries that tend to have a higher number of women are Health Care & Social Assistance (80.5%), Finance & Insurance (72.5%), and Educational Services (70.4%).
| Industry | Male | Female |
| Agriculture, Fishing & Hunting | 0 (0.0%) | 0 (0.0%) |
| Mining, Quarrying, & Extraction | 0 (0.0%) | 0 (0.0%) |
| Construction | 101 (99.0%) | 1 (1.0%) |
| Manufacturing | 172 (75.1%) | 57 (24.9%) |
| Wholesale Trade | 15 (100.0%) | 0 (0.0%) |
| Retail Trade | 83 (50.0%) | 83 (50.0%) |
| Transportation & Warehousing | 78 (82.1%) | 17 (17.9%) |
| Utilities | 22 (100.0%) | 0 (0.0%) |
| Information | 22 (57.9%) | 16 (42.1%) |
| Finance & Insurance | 22 (27.5%) | 58 (72.5%) |
| Real Estate, Rental & Leasing | 6 (31.6%) | 13 (68.4%) |
| Professional & Scientific | 14 (53.8%) | 12 (46.2%) |
| Enterprise Management | 0 (0.0%) | 0 (0.0%) |
| Administrative & Support | 31 (88.6%) | 4 (11.4%) |
| Educational Services | 59 (29.6%) | 140 (70.4%) |
| Health Care & Social Assistance | 75 (19.5%) | 309 (80.5%) |
| Arts, Entertainment & Recreation | 8 (100.0%) | 0 (0.0%) |
| Accommodation & Food Services | 69 (55.6%) | 55 (44.4%) |
| Public Administration | 35 (100.0%) | 0 (0.0%) |
| Total | 823 (50.7%) | 801 (49.3%) |
Education in Clinton
School Enrollment in Clinton
The most common levels of schooling among the 679 students in Clinton are elementary school (173 | 25.5%), college / undergraduate (147 | 21.6%), and middle school (124 | 18.3%).
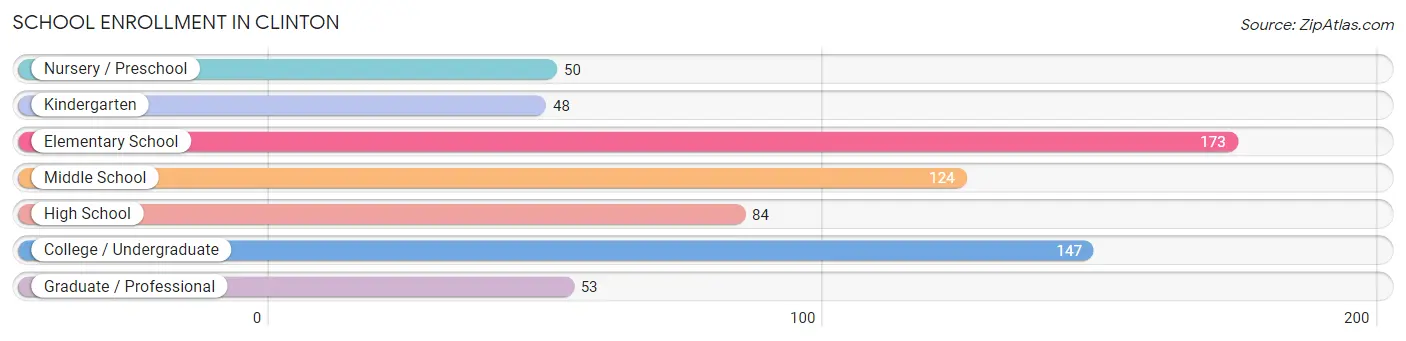
| School Level | # Students | % Students |
| Nursery / Preschool | 50 | 7.4% |
| Kindergarten | 48 | 7.1% |
| Elementary School | 173 | 25.5% |
| Middle School | 124 | 18.3% |
| High School | 84 | 12.4% |
| College / Undergraduate | 147 | 21.6% |
| Graduate / Professional | 53 | 7.8% |
| Total | 679 | 100.0% |
School Enrollment by Age by Funding Source in Clinton
Out of a total of 679 students who are enrolled in schools in Clinton, 75 (11.0%) attend a private institution, while the remaining 604 (89.0%) are enrolled in public schools. The age group of 15 to 17 year olds has the highest likelihood of being enrolled in private schools, with 10 (25.0% in the age bracket) enrolled. Conversely, the age group of 18 to 19 year olds has the lowest likelihood of being enrolled in a private school, with 84 (100.0% in the age bracket) attending a public institution.
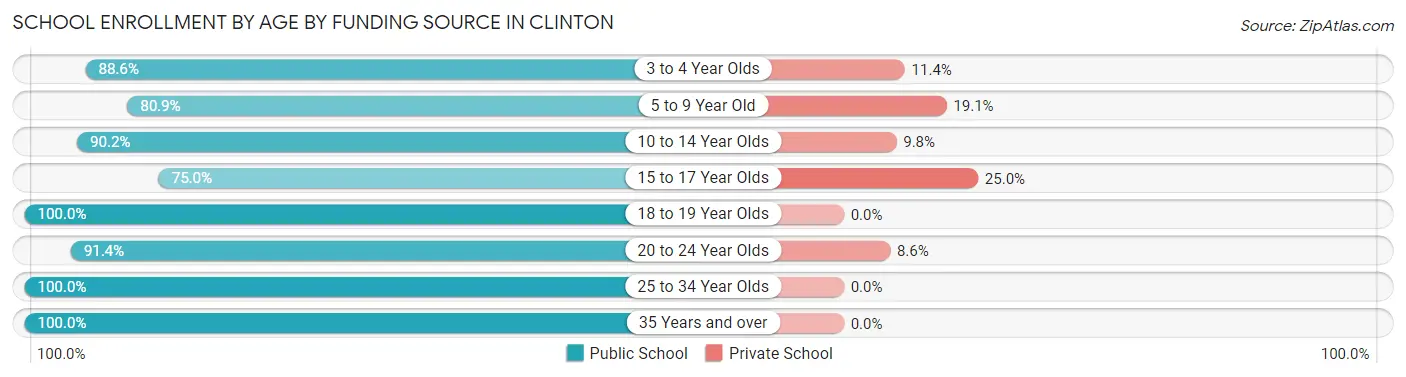
| Age Bracket | Public School | Private School |
| 3 to 4 Year Olds | 39 (88.6%) | 5 (11.4%) |
| 5 to 9 Year Old | 169 (80.9%) | 40 (19.1%) |
| 10 to 14 Year Olds | 138 (90.2%) | 15 (9.8%) |
| 15 to 17 Year Olds | 30 (75.0%) | 10 (25.0%) |
| 18 to 19 Year Olds | 84 (100.0%) | 0 (0.0%) |
| 20 to 24 Year Olds | 53 (91.4%) | 5 (8.6%) |
| 25 to 34 Year Olds | 63 (100.0%) | 0 (0.0%) |
| 35 Years and over | 28 (100.0%) | 0 (0.0%) |
| Total | 604 (89.0%) | 75 (11.0%) |
Educational Attainment by Field of Study in Clinton
Education (118 | 21.1%), business (106 | 18.9%), science & technology (89 | 15.9%), engineering (43 | 7.7%), and arts & humanities (42 | 7.5%) are the most common fields of study among 560 individuals in Clinton who have obtained a bachelor's degree or higher.

| Field of Study | # Graduates | % Graduates |
| Computers & Mathematics | 20 | 3.6% |
| Bio, Nature & Agricultural | 7 | 1.3% |
| Physical & Health Sciences | 13 | 2.3% |
| Psychology | 12 | 2.1% |
| Social Sciences | 30 | 5.4% |
| Engineering | 43 | 7.7% |
| Multidisciplinary Studies | 0 | 0.0% |
| Science & Technology | 89 | 15.9% |
| Business | 106 | 18.9% |
| Education | 118 | 21.1% |
| Literature & Languages | 40 | 7.1% |
| Liberal Arts & History | 34 | 6.1% |
| Visual & Performing Arts | 0 | 0.0% |
| Communications | 6 | 1.1% |
| Arts & Humanities | 42 | 7.5% |
| Total | 560 | 100.0% |
Transportation & Commute in Clinton
Vehicle Availability by Sex in Clinton
The most prevalent vehicle ownership categories in Clinton are males with 2 vehicles (396, accounting for 49.7%) and females with 2 vehicles (331, making up 51.2%).
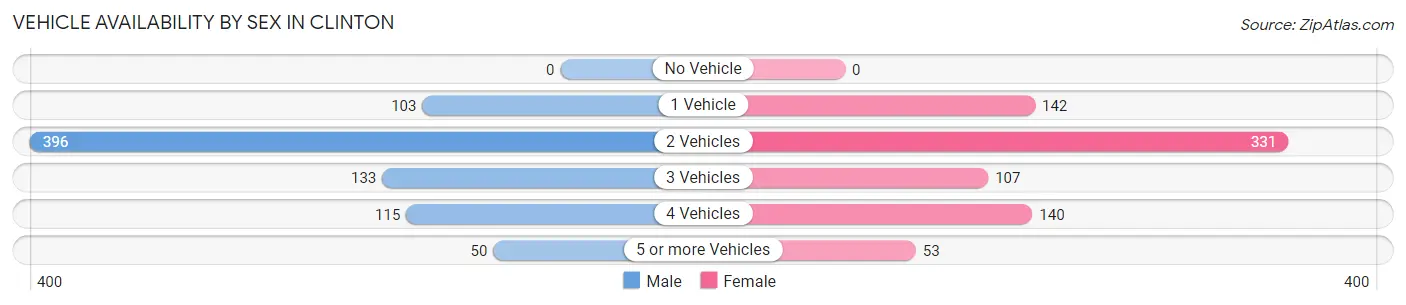
| Vehicles Available | Male | Female |
| No Vehicle | 0 (0.0%) | 0 (0.0%) |
| 1 Vehicle | 103 (12.9%) | 142 (18.4%) |
| 2 Vehicles | 396 (49.7%) | 331 (42.8%) |
| 3 Vehicles | 133 (16.7%) | 107 (13.8%) |
| 4 Vehicles | 115 (14.4%) | 140 (18.1%) |
| 5 or more Vehicles | 50 (6.3%) | 53 (6.9%) |
| Total | 797 (100.0%) | 773 (100.0%) |
Commute Time in Clinton
The most frequently occuring commute durations in Clinton are 45 to 59 minutes (280 commuters, 18.8%), 30 to 34 minutes (221 commuters, 14.9%), and 40 to 44 minutes (183 commuters, 12.3%).
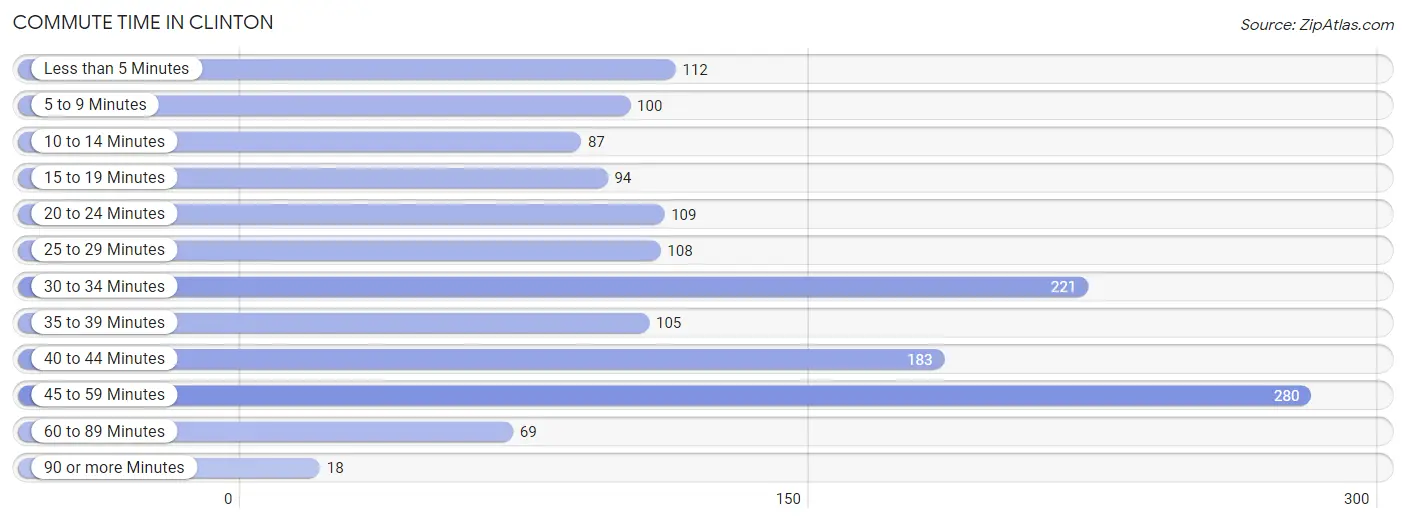
| Commute Time | # Commuters | % Commuters |
| Less than 5 Minutes | 112 | 7.5% |
| 5 to 9 Minutes | 100 | 6.7% |
| 10 to 14 Minutes | 87 | 5.9% |
| 15 to 19 Minutes | 94 | 6.3% |
| 20 to 24 Minutes | 109 | 7.3% |
| 25 to 29 Minutes | 108 | 7.3% |
| 30 to 34 Minutes | 221 | 14.9% |
| 35 to 39 Minutes | 105 | 7.1% |
| 40 to 44 Minutes | 183 | 12.3% |
| 45 to 59 Minutes | 280 | 18.8% |
| 60 to 89 Minutes | 69 | 4.6% |
| 90 or more Minutes | 18 | 1.2% |
Commute Time by Sex in Clinton
The most common commute times in Clinton are 45 to 59 minutes (182 commuters, 24.1%) for males and 40 to 44 minutes (130 commuters, 17.8%) for females.
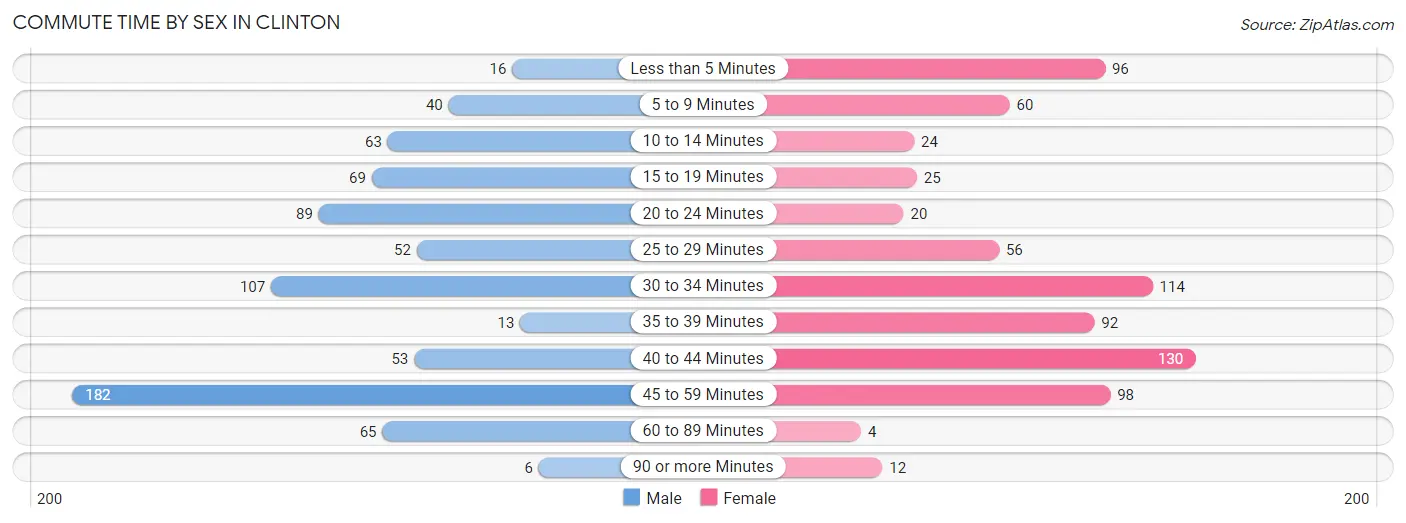
| Commute Time | Male | Female |
| Less than 5 Minutes | 16 (2.1%) | 96 (13.1%) |
| 5 to 9 Minutes | 40 (5.3%) | 60 (8.2%) |
| 10 to 14 Minutes | 63 (8.3%) | 24 (3.3%) |
| 15 to 19 Minutes | 69 (9.1%) | 25 (3.4%) |
| 20 to 24 Minutes | 89 (11.8%) | 20 (2.7%) |
| 25 to 29 Minutes | 52 (6.9%) | 56 (7.7%) |
| 30 to 34 Minutes | 107 (14.2%) | 114 (15.6%) |
| 35 to 39 Minutes | 13 (1.7%) | 92 (12.6%) |
| 40 to 44 Minutes | 53 (7.0%) | 130 (17.8%) |
| 45 to 59 Minutes | 182 (24.1%) | 98 (13.4%) |
| 60 to 89 Minutes | 65 (8.6%) | 4 (0.5%) |
| 90 or more Minutes | 6 (0.8%) | 12 (1.6%) |
Time of Departure to Work by Sex in Clinton
The most frequent times of departure to work in Clinton are 5:30 AM to 5:59 AM (115, 15.2%) for males and 7:00 AM to 7:29 AM (122, 16.7%) for females.
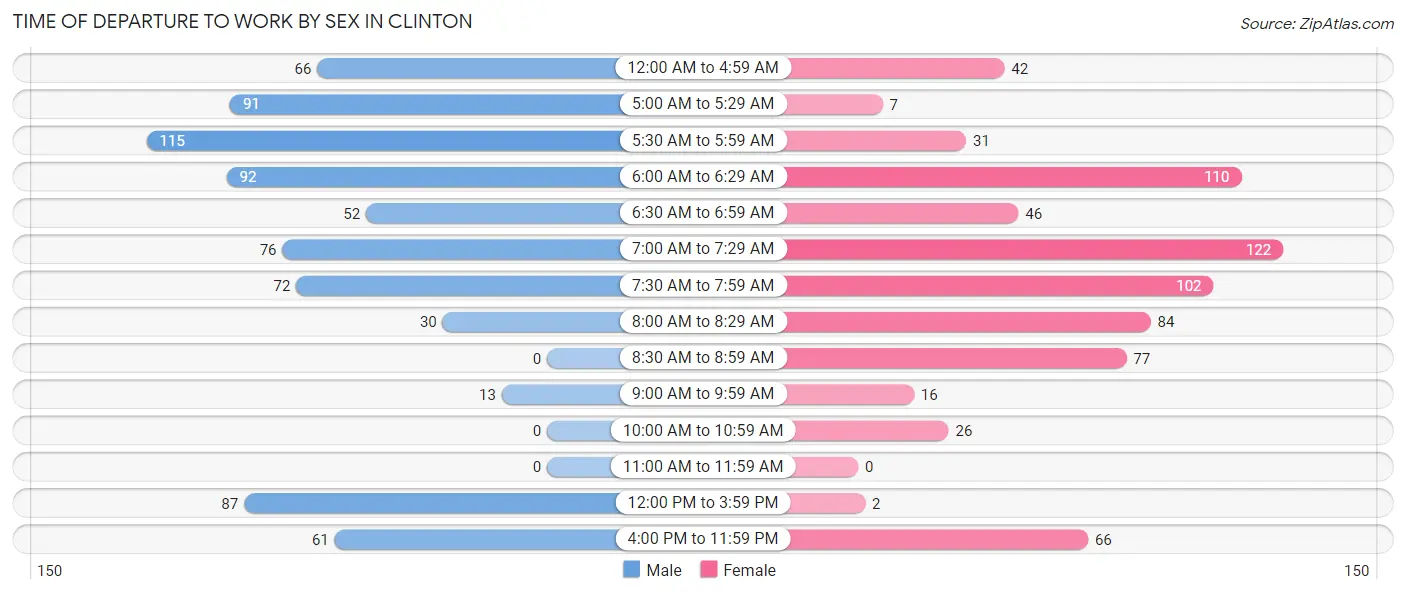
| Time of Departure | Male | Female |
| 12:00 AM to 4:59 AM | 66 (8.7%) | 42 (5.8%) |
| 5:00 AM to 5:29 AM | 91 (12.0%) | 7 (1.0%) |
| 5:30 AM to 5:59 AM | 115 (15.2%) | 31 (4.2%) |
| 6:00 AM to 6:29 AM | 92 (12.2%) | 110 (15.0%) |
| 6:30 AM to 6:59 AM | 52 (6.9%) | 46 (6.3%) |
| 7:00 AM to 7:29 AM | 76 (10.1%) | 122 (16.7%) |
| 7:30 AM to 7:59 AM | 72 (9.5%) | 102 (14.0%) |
| 8:00 AM to 8:29 AM | 30 (4.0%) | 84 (11.5%) |
| 8:30 AM to 8:59 AM | 0 (0.0%) | 77 (10.5%) |
| 9:00 AM to 9:59 AM | 13 (1.7%) | 16 (2.2%) |
| 10:00 AM to 10:59 AM | 0 (0.0%) | 26 (3.6%) |
| 11:00 AM to 11:59 AM | 0 (0.0%) | 0 (0.0%) |
| 12:00 PM to 3:59 PM | 87 (11.5%) | 2 (0.3%) |
| 4:00 PM to 11:59 PM | 61 (8.1%) | 66 (9.0%) |
| Total | 755 (100.0%) | 731 (100.0%) |
Housing Occupancy in Clinton
Occupancy by Ownership in Clinton
Of the total 1,046 dwellings in Clinton, owner-occupied units account for 896 (85.7%), while renter-occupied units make up 150 (14.3%).
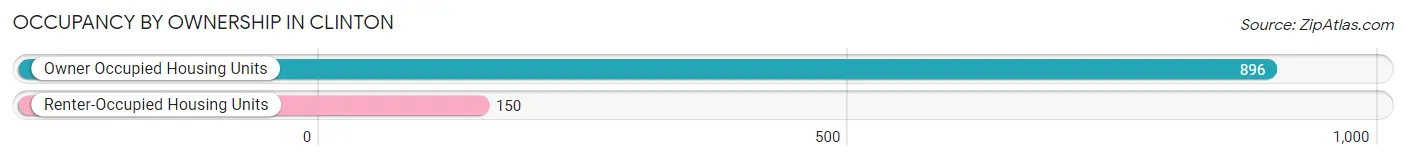
| Occupancy | # Housing Units | % Housing Units |
| Owner Occupied Housing Units | 896 | 85.7% |
| Renter-Occupied Housing Units | 150 | 14.3% |
| Total Occupied Housing Units | 1,046 | 100.0% |
Occupancy by Household Size in Clinton
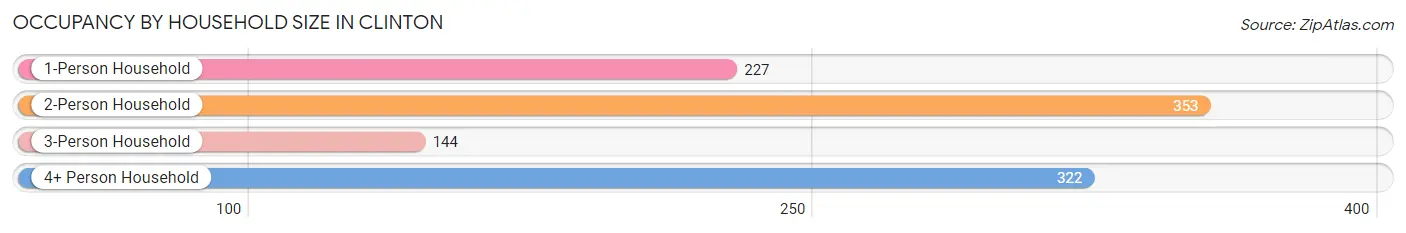
| Household Size | # Housing Units | % Housing Units |
| 1-Person Household | 227 | 21.7% |
| 2-Person Household | 353 | 33.8% |
| 3-Person Household | 144 | 13.8% |
| 4+ Person Household | 322 | 30.8% |
| Total Housing Units | 1,046 | 100.0% |
Occupancy by Ownership by Household Size in Clinton
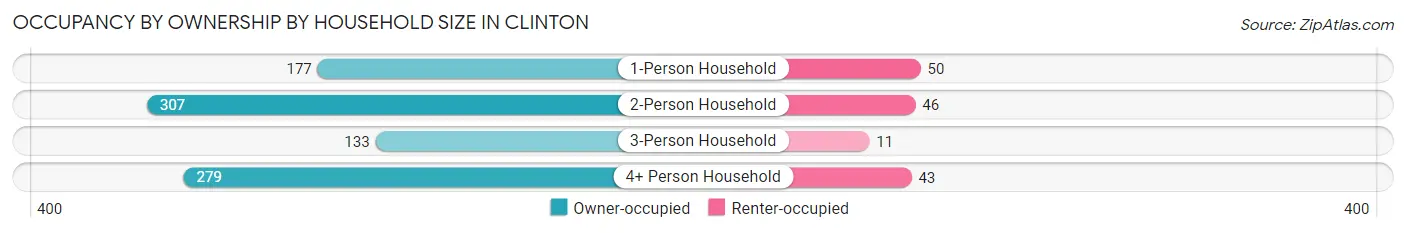
| Household Size | Owner-occupied | Renter-occupied |
| 1-Person Household | 177 (78.0%) | 50 (22.0%) |
| 2-Person Household | 307 (87.0%) | 46 (13.0%) |
| 3-Person Household | 133 (92.4%) | 11 (7.6%) |
| 4+ Person Household | 279 (86.7%) | 43 (13.4%) |
| Total Housing Units | 896 (85.7%) | 150 (14.3%) |
Occupancy by Educational Attainment in Clinton
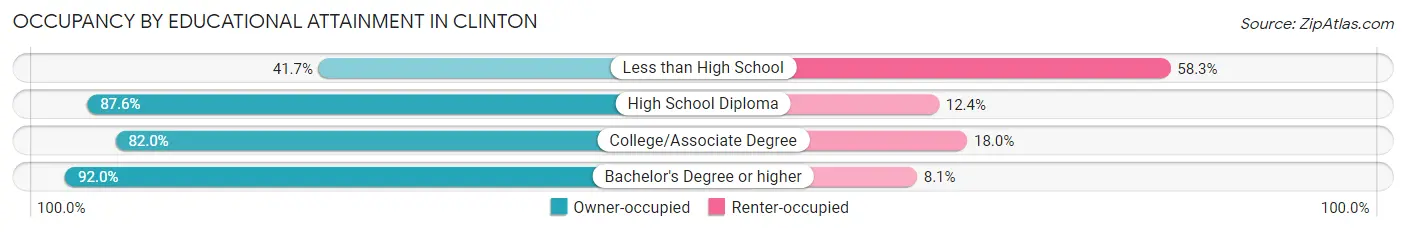
| Household Size | Owner-occupied | Renter-occupied |
| Less than High School | 10 (41.7%) | 14 (58.3%) |
| High School Diploma | 289 (87.6%) | 41 (12.4%) |
| College/Associate Degree | 323 (82.0%) | 71 (18.0%) |
| Bachelor's Degree or higher | 274 (91.9%) | 24 (8.1%) |
Occupancy by Age of Householder in Clinton
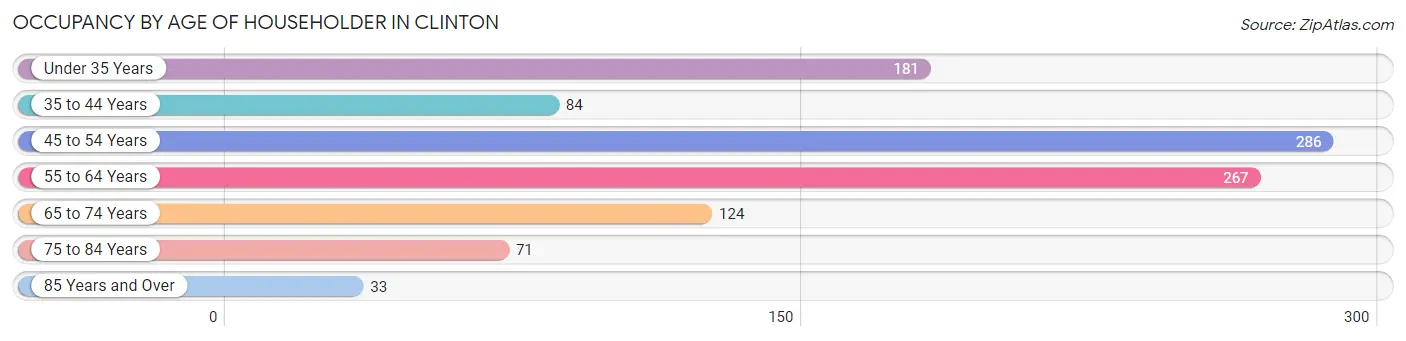
| Age Bracket | # Households | % Households |
| Under 35 Years | 181 | 17.3% |
| 35 to 44 Years | 84 | 8.0% |
| 45 to 54 Years | 286 | 27.3% |
| 55 to 64 Years | 267 | 25.5% |
| 65 to 74 Years | 124 | 11.8% |
| 75 to 84 Years | 71 | 6.8% |
| 85 Years and Over | 33 | 3.2% |
| Total | 1,046 | 100.0% |
Housing Finances in Clinton
Median Income by Occupancy in Clinton
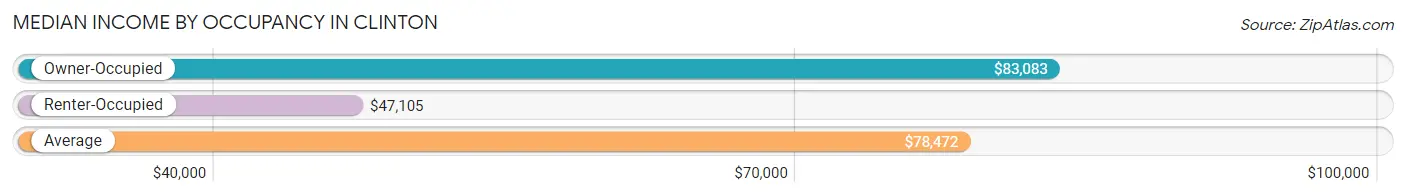
| Occupancy Type | # Households | Median Income |
| Owner-Occupied | 896 (85.7%) | $83,083 |
| Renter-Occupied | 150 (14.3%) | $47,105 |
| Average | 1,046 (100.0%) | $78,472 |
Occupancy by Householder Income Bracket in Clinton
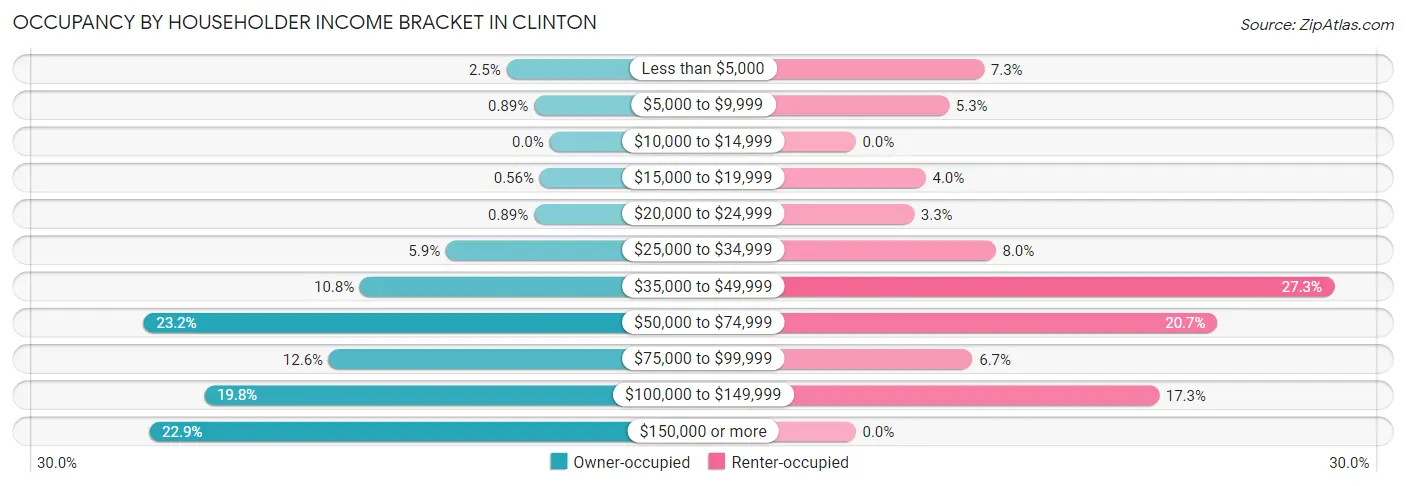
| Income Bracket | Owner-occupied | Renter-occupied |
| Less than $5,000 | 22 (2.5%) | 11 (7.3%) |
| $5,000 to $9,999 | 8 (0.9%) | 8 (5.3%) |
| $10,000 to $14,999 | 0 (0.0%) | 0 (0.0%) |
| $15,000 to $19,999 | 5 (0.6%) | 6 (4.0%) |
| $20,000 to $24,999 | 8 (0.9%) | 5 (3.3%) |
| $25,000 to $34,999 | 53 (5.9%) | 12 (8.0%) |
| $35,000 to $49,999 | 97 (10.8%) | 41 (27.3%) |
| $50,000 to $74,999 | 208 (23.2%) | 31 (20.7%) |
| $75,000 to $99,999 | 113 (12.6%) | 10 (6.7%) |
| $100,000 to $149,999 | 177 (19.8%) | 26 (17.3%) |
| $150,000 or more | 205 (22.9%) | 0 (0.0%) |
| Total | 896 (100.0%) | 150 (100.0%) |
Monthly Housing Cost Tiers in Clinton
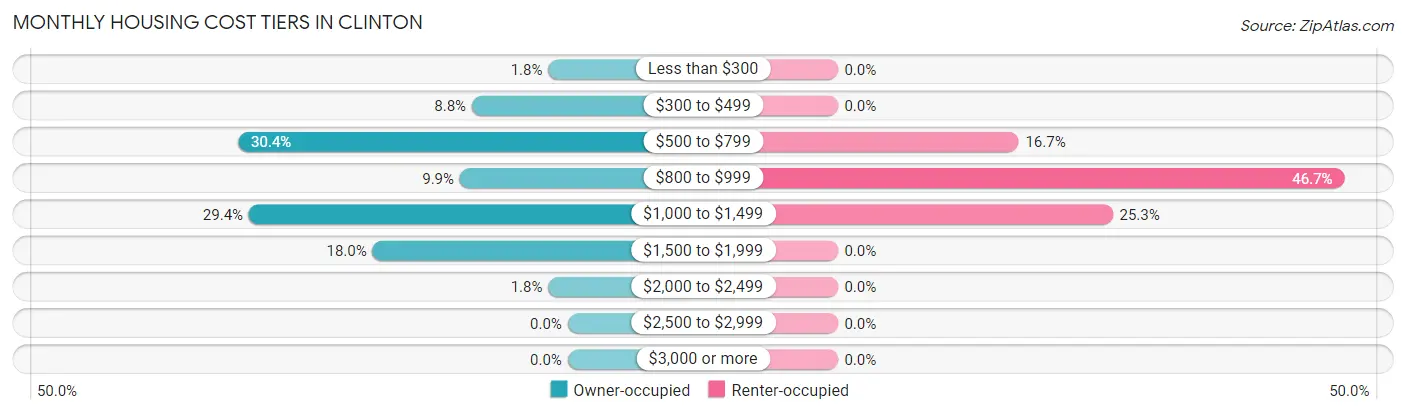
| Monthly Cost | Owner-occupied | Renter-occupied |
| Less than $300 | 16 (1.8%) | 0 (0.0%) |
| $300 to $499 | 79 (8.8%) | 0 (0.0%) |
| $500 to $799 | 272 (30.4%) | 25 (16.7%) |
| $800 to $999 | 89 (9.9%) | 70 (46.7%) |
| $1,000 to $1,499 | 263 (29.3%) | 38 (25.3%) |
| $1,500 to $1,999 | 161 (18.0%) | 0 (0.0%) |
| $2,000 to $2,499 | 16 (1.8%) | 0 (0.0%) |
| $2,500 to $2,999 | 0 (0.0%) | 0 (0.0%) |
| $3,000 or more | 0 (0.0%) | 0 (0.0%) |
| Total | 896 (100.0%) | 150 (100.0%) |
Physical Housing Characteristics in Clinton
Housing Structures in Clinton
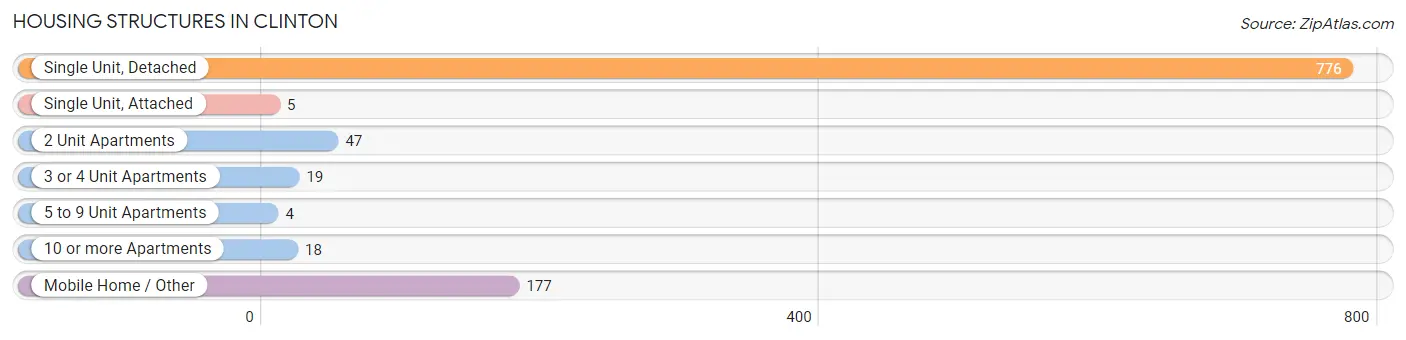
| Structure Type | # Housing Units | % Housing Units |
| Single Unit, Detached | 776 | 74.2% |
| Single Unit, Attached | 5 | 0.5% |
| 2 Unit Apartments | 47 | 4.5% |
| 3 or 4 Unit Apartments | 19 | 1.8% |
| 5 to 9 Unit Apartments | 4 | 0.4% |
| 10 or more Apartments | 18 | 1.7% |
| Mobile Home / Other | 177 | 16.9% |
| Total | 1,046 | 100.0% |
Housing Structures by Occupancy in Clinton
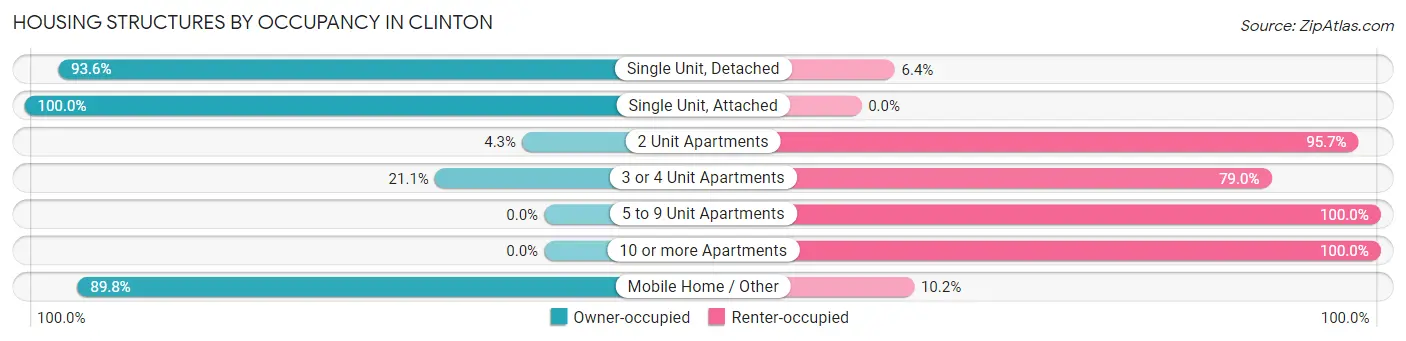
| Structure Type | Owner-occupied | Renter-occupied |
| Single Unit, Detached | 726 (93.6%) | 50 (6.4%) |
| Single Unit, Attached | 5 (100.0%) | 0 (0.0%) |
| 2 Unit Apartments | 2 (4.3%) | 45 (95.7%) |
| 3 or 4 Unit Apartments | 4 (21.0%) | 15 (78.9%) |
| 5 to 9 Unit Apartments | 0 (0.0%) | 4 (100.0%) |
| 10 or more Apartments | 0 (0.0%) | 18 (100.0%) |
| Mobile Home / Other | 159 (89.8%) | 18 (10.2%) |
| Total | 896 (85.7%) | 150 (14.3%) |
Housing Structures by Number of Rooms in Clinton
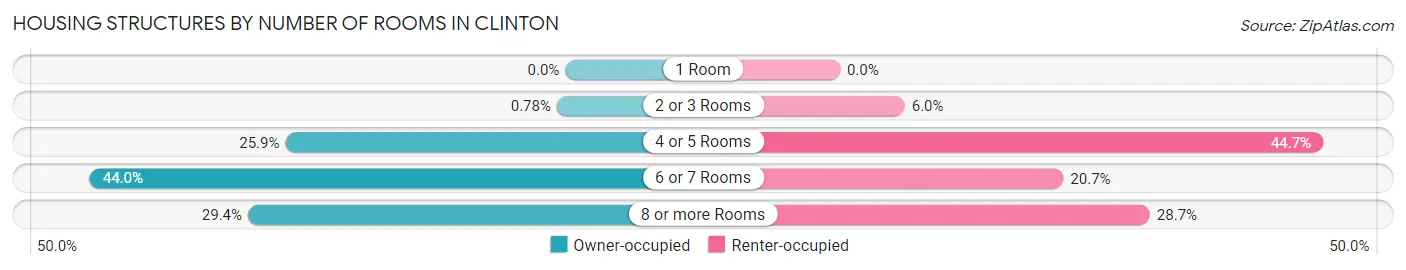
| Number of Rooms | Owner-occupied | Renter-occupied |
| 1 Room | 0 (0.0%) | 0 (0.0%) |
| 2 or 3 Rooms | 7 (0.8%) | 9 (6.0%) |
| 4 or 5 Rooms | 232 (25.9%) | 67 (44.7%) |
| 6 or 7 Rooms | 394 (44.0%) | 31 (20.7%) |
| 8 or more Rooms | 263 (29.3%) | 43 (28.7%) |
| Total | 896 (100.0%) | 150 (100.0%) |
Housing Structure by Heating Type in Clinton
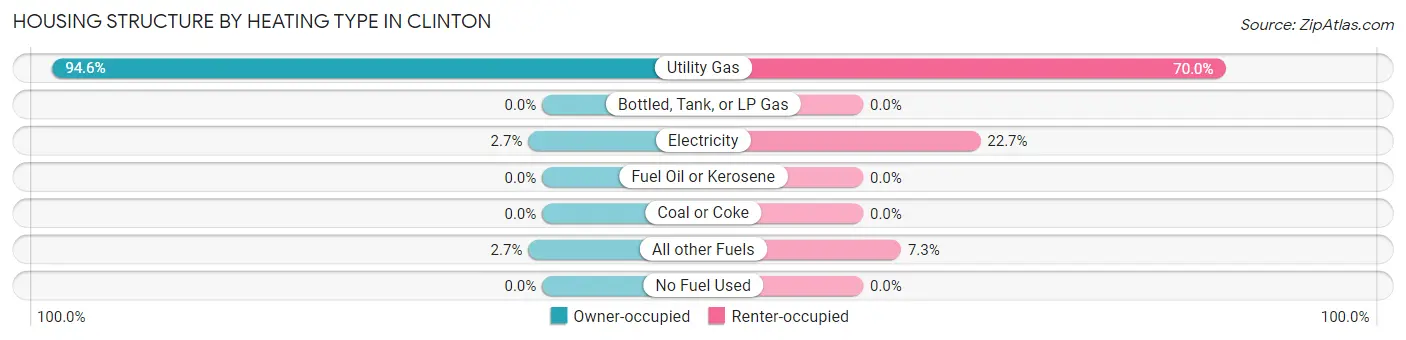
| Heating Type | Owner-occupied | Renter-occupied |
| Utility Gas | 848 (94.6%) | 105 (70.0%) |
| Bottled, Tank, or LP Gas | 0 (0.0%) | 0 (0.0%) |
| Electricity | 24 (2.7%) | 34 (22.7%) |
| Fuel Oil or Kerosene | 0 (0.0%) | 0 (0.0%) |
| Coal or Coke | 0 (0.0%) | 0 (0.0%) |
| All other Fuels | 24 (2.7%) | 11 (7.3%) |
| No Fuel Used | 0 (0.0%) | 0 (0.0%) |
| Total | 896 (100.0%) | 150 (100.0%) |
Household Vehicle Usage in Clinton
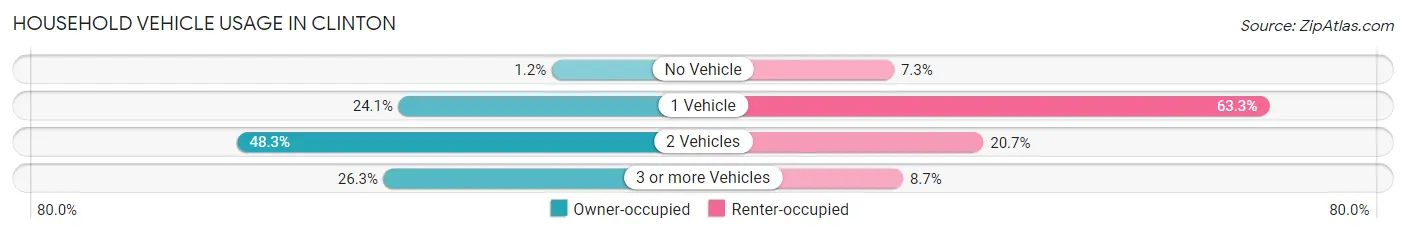
| Vehicles per Household | Owner-occupied | Renter-occupied |
| No Vehicle | 11 (1.2%) | 11 (7.3%) |
| 1 Vehicle | 216 (24.1%) | 95 (63.3%) |
| 2 Vehicles | 433 (48.3%) | 31 (20.7%) |
| 3 or more Vehicles | 236 (26.3%) | 13 (8.7%) |
| Total | 896 (100.0%) | 150 (100.0%) |
Real Estate & Mortgages in Clinton
Real Estate and Mortgage Overview in Clinton
| Characteristic | Without Mortgage | With Mortgage |
| Housing Units | 343 | 553 |
| Median Property Value | $140,800 | $177,600 |
| Median Household Income | $64,250 | $154 |
| Monthly Housing Costs | $573 | $0 |
| Real Estate Taxes | $2,515 | $69 |
Property Value by Mortgage Status in Clinton
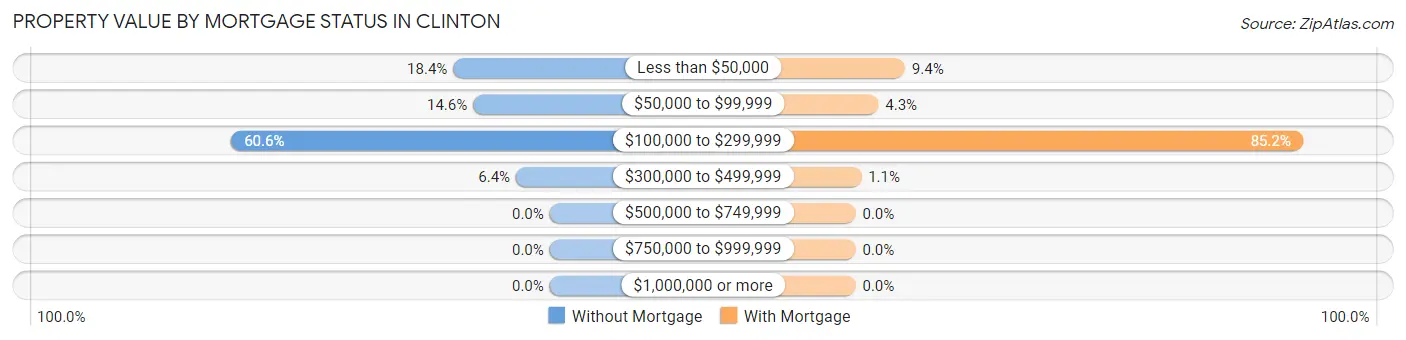
| Property Value | Without Mortgage | With Mortgage |
| Less than $50,000 | 63 (18.4%) | 52 (9.4%) |
| $50,000 to $99,999 | 50 (14.6%) | 24 (4.3%) |
| $100,000 to $299,999 | 208 (60.6%) | 471 (85.2%) |
| $300,000 to $499,999 | 22 (6.4%) | 6 (1.1%) |
| $500,000 to $749,999 | 0 (0.0%) | 0 (0.0%) |
| $750,000 to $999,999 | 0 (0.0%) | 0 (0.0%) |
| $1,000,000 or more | 0 (0.0%) | 0 (0.0%) |
| Total | 343 (100.0%) | 553 (100.0%) |
Household Income by Mortgage Status in Clinton
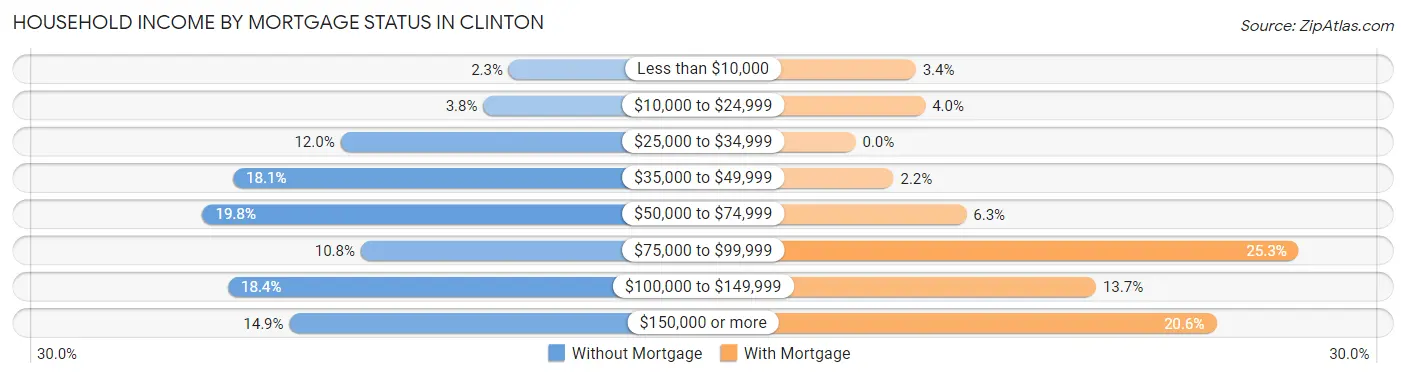
| Household Income | Without Mortgage | With Mortgage |
| Less than $10,000 | 8 (2.3%) | 19 (3.4%) |
| $10,000 to $24,999 | 13 (3.8%) | 22 (4.0%) |
| $25,000 to $34,999 | 41 (11.9%) | 0 (0.0%) |
| $35,000 to $49,999 | 62 (18.1%) | 12 (2.2%) |
| $50,000 to $74,999 | 68 (19.8%) | 35 (6.3%) |
| $75,000 to $99,999 | 37 (10.8%) | 140 (25.3%) |
| $100,000 to $149,999 | 63 (18.4%) | 76 (13.7%) |
| $150,000 or more | 51 (14.9%) | 114 (20.6%) |
| Total | 343 (100.0%) | 553 (100.0%) |
Property Value to Household Income Ratio in Clinton
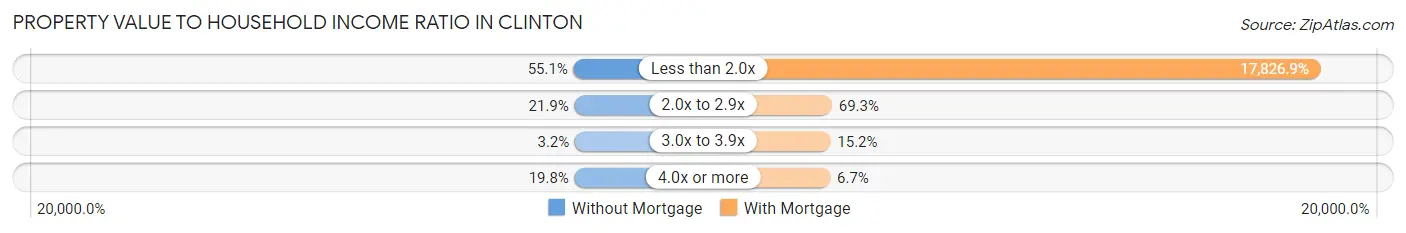
| Value-to-Income Ratio | Without Mortgage | With Mortgage |
| Less than 2.0x | 189 (55.1%) | 98,583 (17,826.9%) |
| 2.0x to 2.9x | 75 (21.9%) | 383 (69.3%) |
| 3.0x to 3.9x | 11 (3.2%) | 84 (15.2%) |
| 4.0x or more | 68 (19.8%) | 37 (6.7%) |
| Total | 343 (100.0%) | 553 (100.0%) |
Real Estate Taxes by Mortgage Status in Clinton
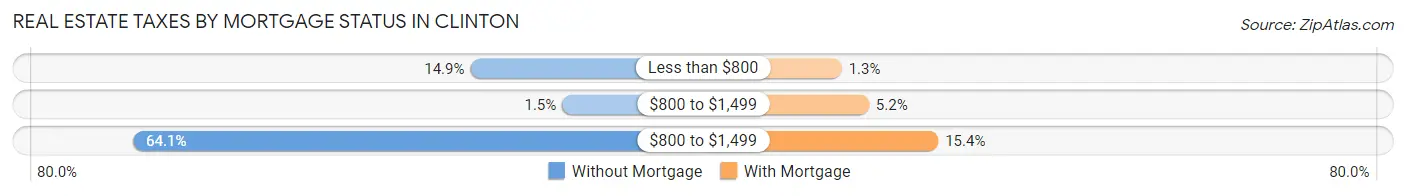
| Property Taxes | Without Mortgage | With Mortgage |
| Less than $800 | 51 (14.9%) | 7 (1.3%) |
| $800 to $1,499 | 5 (1.5%) | 29 (5.2%) |
| $800 to $1,499 | 220 (64.1%) | 85 (15.4%) |
| Total | 343 (100.0%) | 553 (100.0%) |
Health & Disability in Clinton
Health Insurance Coverage by Age in Clinton
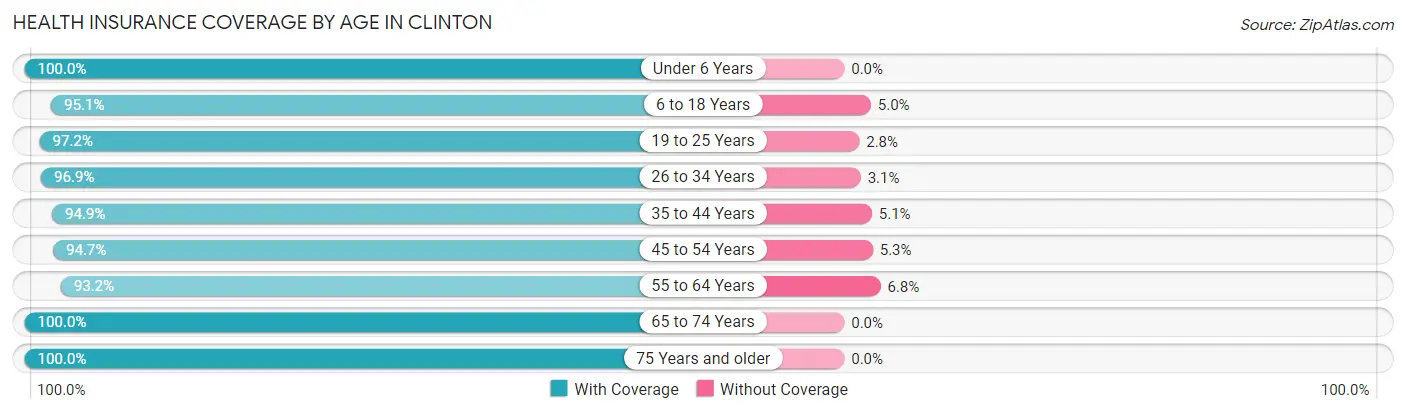
| Age Bracket | With Coverage | Without Coverage |
| Under 6 Years | 220 (100.0%) | 0 (0.0%) |
| 6 to 18 Years | 442 (95.1%) | 23 (5.0%) |
| 19 to 25 Years | 244 (97.2%) | 7 (2.8%) |
| 26 to 34 Years | 442 (96.9%) | 14 (3.1%) |
| 35 to 44 Years | 240 (94.9%) | 13 (5.1%) |
| 45 to 54 Years | 410 (94.7%) | 23 (5.3%) |
| 55 to 64 Years | 469 (93.2%) | 34 (6.8%) |
| 65 to 74 Years | 202 (100.0%) | 0 (0.0%) |
| 75 Years and older | 146 (100.0%) | 0 (0.0%) |
| Total | 2,815 (96.1%) | 114 (3.9%) |
Health Insurance Coverage by Citizenship Status in Clinton
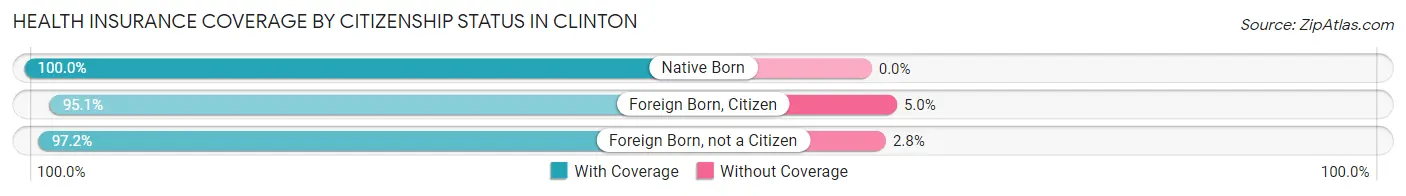
| Citizenship Status | With Coverage | Without Coverage |
| Native Born | 220 (100.0%) | 0 (0.0%) |
| Foreign Born, Citizen | 442 (95.1%) | 23 (5.0%) |
| Foreign Born, not a Citizen | 244 (97.2%) | 7 (2.8%) |
Health Insurance Coverage by Household Income in Clinton
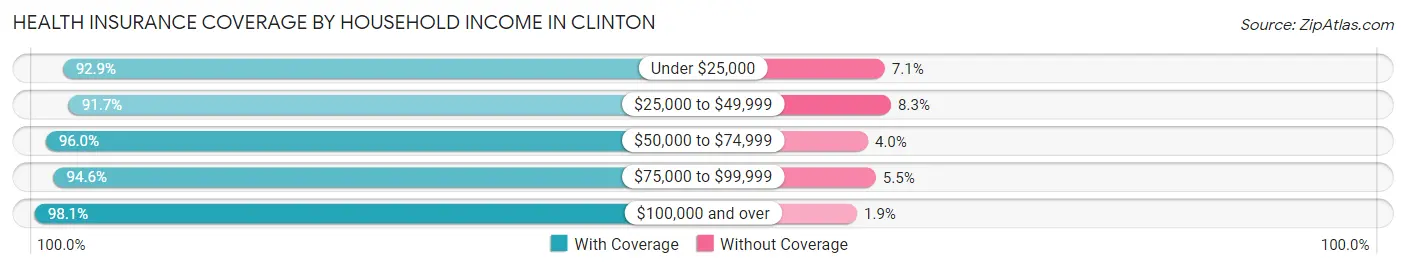
| Household Income | With Coverage | Without Coverage |
| Under $25,000 | 104 (92.9%) | 8 (7.1%) |
| $25,000 to $49,999 | 397 (91.7%) | 36 (8.3%) |
| $50,000 to $74,999 | 579 (96.0%) | 24 (4.0%) |
| $75,000 to $99,999 | 312 (94.6%) | 18 (5.4%) |
| $100,000 and over | 1,423 (98.1%) | 28 (1.9%) |
Public vs Private Health Insurance Coverage by Age in Clinton
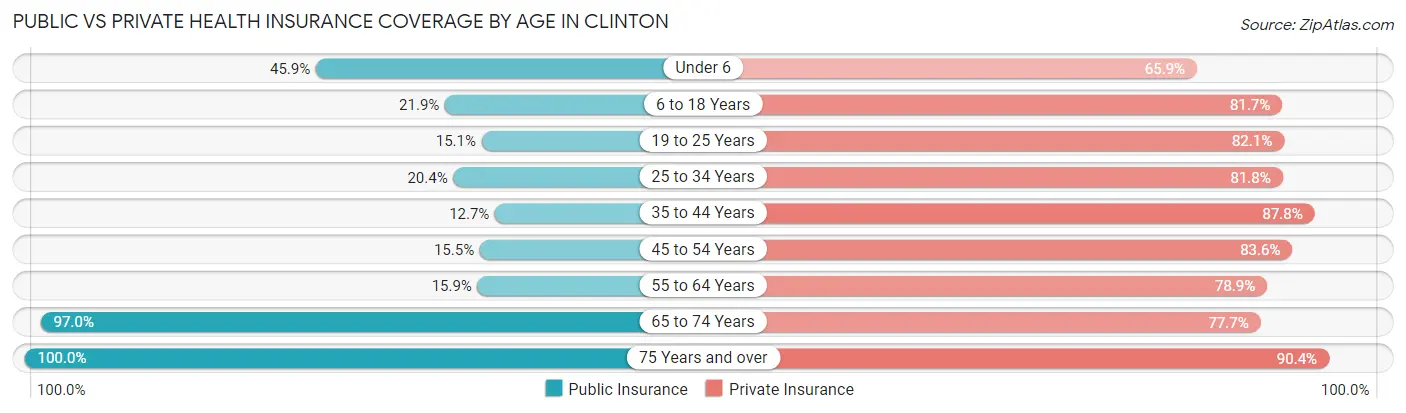
| Age Bracket | Public Insurance | Private Insurance |
| Under 6 | 101 (45.9%) | 145 (65.9%) |
| 6 to 18 Years | 102 (21.9%) | 380 (81.7%) |
| 19 to 25 Years | 38 (15.1%) | 206 (82.1%) |
| 25 to 34 Years | 93 (20.4%) | 373 (81.8%) |
| 35 to 44 Years | 32 (12.7%) | 222 (87.7%) |
| 45 to 54 Years | 67 (15.5%) | 362 (83.6%) |
| 55 to 64 Years | 80 (15.9%) | 397 (78.9%) |
| 65 to 74 Years | 196 (97.0%) | 157 (77.7%) |
| 75 Years and over | 146 (100.0%) | 132 (90.4%) |
| Total | 855 (29.2%) | 2,374 (81.0%) |
Disability Status by Sex by Age in Clinton
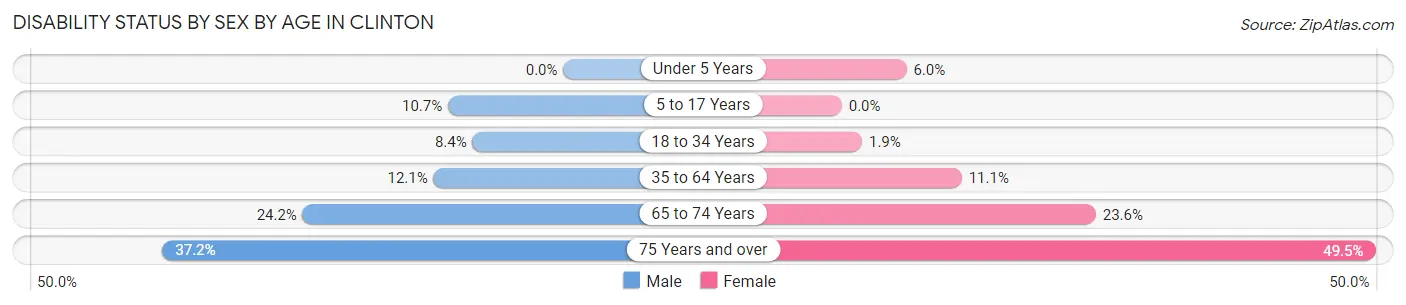
| Age Bracket | Male | Female |
| Under 5 Years | 0 (0.0%) | 6 (6.0%) |
| 5 to 17 Years | 20 (10.7%) | 0 (0.0%) |
| 18 to 34 Years | 30 (8.4%) | 8 (1.9%) |
| 35 to 64 Years | 74 (12.0%) | 64 (11.1%) |
| 65 to 74 Years | 15 (24.2%) | 33 (23.6%) |
| 75 Years and over | 16 (37.2%) | 51 (49.5%) |
Disability Class by Sex by Age in Clinton
Disability Class: Hearing Difficulty
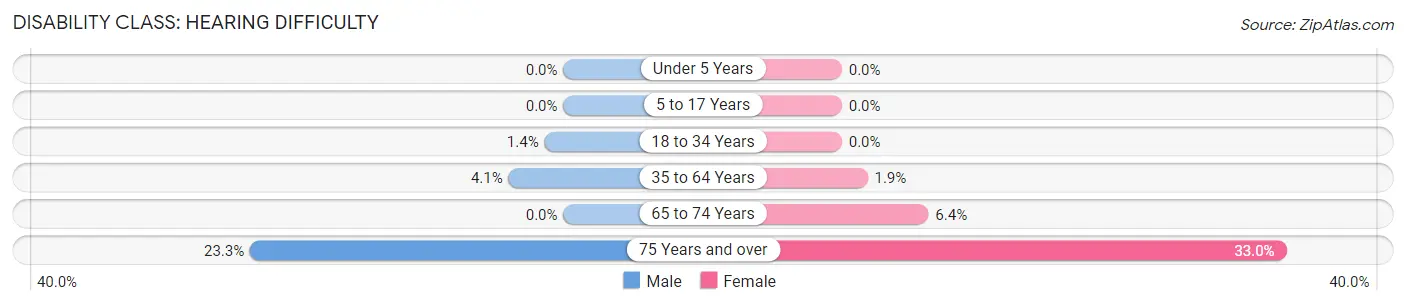
| Age Bracket | Male | Female |
| Under 5 Years | 0 (0.0%) | 0 (0.0%) |
| 5 to 17 Years | 0 (0.0%) | 0 (0.0%) |
| 18 to 34 Years | 5 (1.4%) | 0 (0.0%) |
| 35 to 64 Years | 25 (4.1%) | 11 (1.9%) |
| 65 to 74 Years | 0 (0.0%) | 9 (6.4%) |
| 75 Years and over | 10 (23.3%) | 34 (33.0%) |
Disability Class: Vision Difficulty
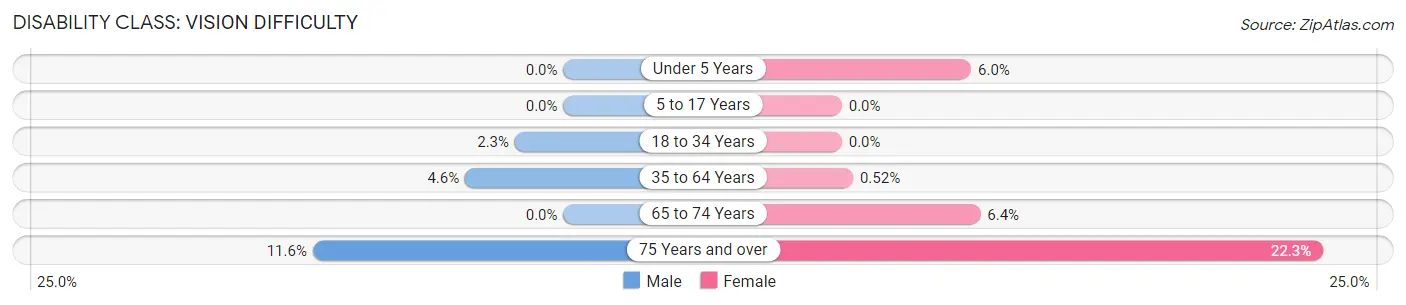
| Age Bracket | Male | Female |
| Under 5 Years | 0 (0.0%) | 6 (6.0%) |
| 5 to 17 Years | 0 (0.0%) | 0 (0.0%) |
| 18 to 34 Years | 8 (2.2%) | 0 (0.0%) |
| 35 to 64 Years | 28 (4.6%) | 3 (0.5%) |
| 65 to 74 Years | 0 (0.0%) | 9 (6.4%) |
| 75 Years and over | 5 (11.6%) | 23 (22.3%) |
Disability Class: Cognitive Difficulty
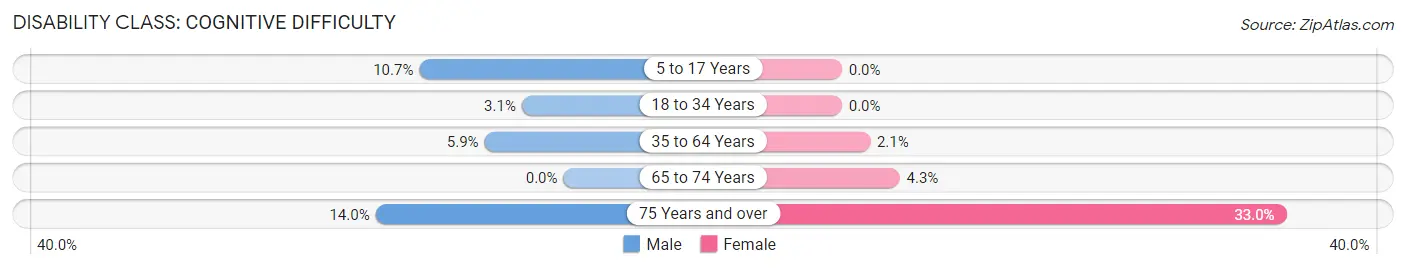
| Age Bracket | Male | Female |
| 5 to 17 Years | 20 (10.7%) | 0 (0.0%) |
| 18 to 34 Years | 11 (3.1%) | 0 (0.0%) |
| 35 to 64 Years | 36 (5.9%) | 12 (2.1%) |
| 65 to 74 Years | 0 (0.0%) | 6 (4.3%) |
| 75 Years and over | 6 (14.0%) | 34 (33.0%) |
Disability Class: Ambulatory Difficulty
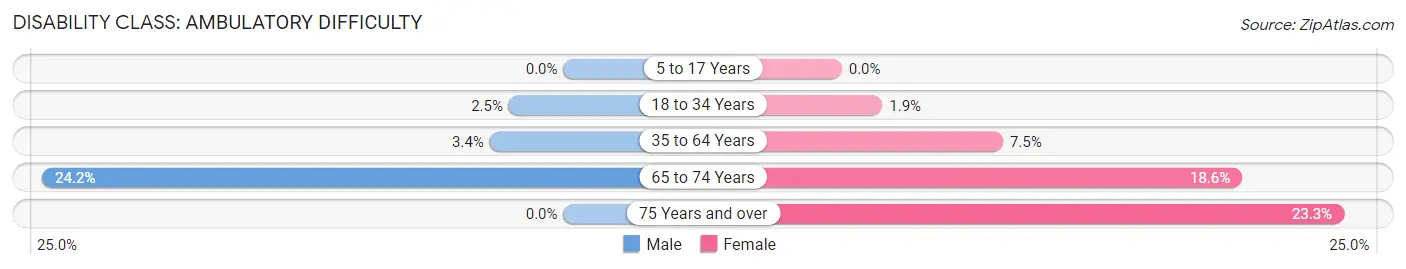
| Age Bracket | Male | Female |
| 5 to 17 Years | 0 (0.0%) | 0 (0.0%) |
| 18 to 34 Years | 9 (2.5%) | 8 (1.9%) |
| 35 to 64 Years | 21 (3.4%) | 43 (7.5%) |
| 65 to 74 Years | 15 (24.2%) | 26 (18.6%) |
| 75 Years and over | 0 (0.0%) | 24 (23.3%) |
Disability Class: Self-Care Difficulty
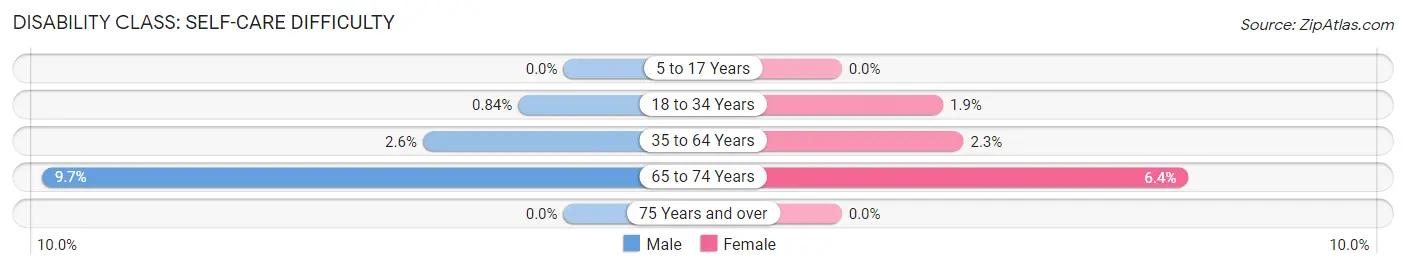
| Age Bracket | Male | Female |
| 5 to 17 Years | 0 (0.0%) | 0 (0.0%) |
| 18 to 34 Years | 3 (0.8%) | 8 (1.9%) |
| 35 to 64 Years | 16 (2.6%) | 13 (2.3%) |
| 65 to 74 Years | 6 (9.7%) | 9 (6.4%) |
| 75 Years and over | 0 (0.0%) | 0 (0.0%) |
Technology Access in Clinton
Computing Device Access in Clinton
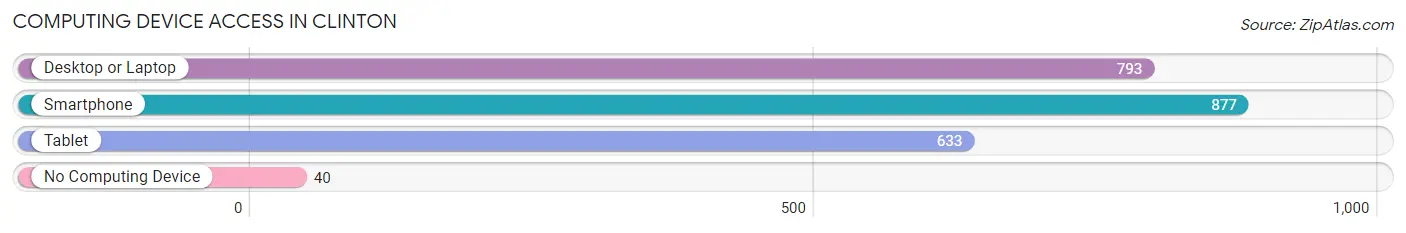
| Device Type | # Households | % Households |
| Desktop or Laptop | 793 | 75.8% |
| Smartphone | 877 | 83.8% |
| Tablet | 633 | 60.5% |
| No Computing Device | 40 | 3.8% |
| Total | 1,046 | 100.0% |
Internet Access in Clinton
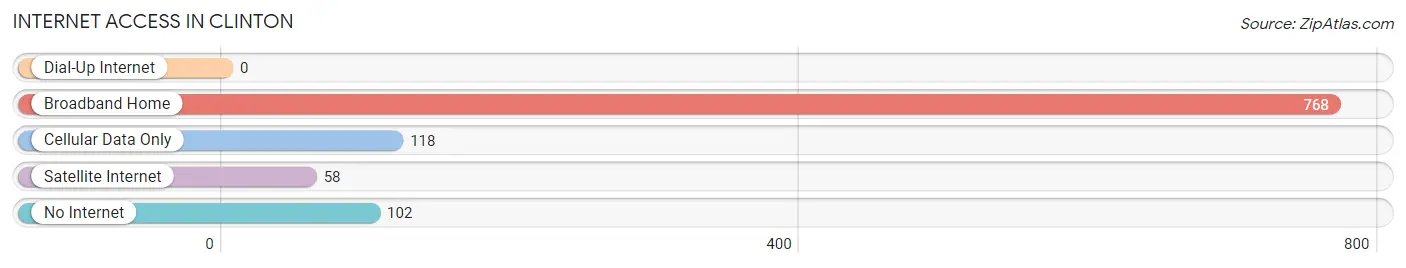
| Internet Type | # Households | % Households |
| Dial-Up Internet | 0 | 0.0% |
| Broadband Home | 768 | 73.4% |
| Cellular Data Only | 118 | 11.3% |
| Satellite Internet | 58 | 5.5% |
| No Internet | 102 | 9.8% |
| Total | 1,046 | 100.0% |
Clinton Summary
Clinton, Michigan is a small city located in Macomb County, Michigan. It is situated on the Clinton River, approximately 25 miles north of Detroit. The city has a population of approximately 10,000 people and is part of the Metro Detroit area.
History
The area that is now Clinton was first settled in 1825 by a group of settlers from New York. The settlement was originally called New York Corners, but was later renamed Clinton in 1829 after DeWitt Clinton, the former governor of New York. The city was officially incorporated in 1838.
In the late 19th century, Clinton was a major center for the lumber industry. The city was home to several sawmills and lumber yards, and the lumber industry was the primary source of employment for the city’s residents.
In the early 20th century, Clinton began to transition away from the lumber industry and towards manufacturing. The city was home to several factories, including the Clinton Machine Company, which produced automobile parts.
Geography
Clinton is located in Macomb County, Michigan. It is situated on the Clinton River, approximately 25 miles north of Detroit. The city has a total area of 4.2 square miles, all of which is land.
The city is located in a humid continental climate zone, with hot, humid summers and cold, snowy winters. The average annual temperature is approximately 48 degrees Fahrenheit.
Economy
The economy of Clinton is largely based on manufacturing. The city is home to several factories, including the Clinton Machine Company, which produces automobile parts. Other major employers in the city include the Clinton Township School District, the Macomb County government, and the Macomb County Sheriff’s Office.
The city also has a thriving retail sector, with several shopping centers and malls located in the city.
Demographics
As of the 2010 census, the population of Clinton was 9,841. The racial makeup of the city was 87.3% White, 8.2% African American, 0.7% Native American, 0.7% Asian, 0.1% Pacific Islander, and 2.1% from other races. Hispanic or Latino of any race were 3.2% of the population.
The median household income in Clinton was $50,945, and the median family income was $60,945. The per capita income for the city was $25,945. Approximately 8.3% of the population was below the poverty line.
The city is served by the Clinton Township School District, which consists of four elementary schools, one middle school, and one high school. The city is also home to several private schools, including St. Mary’s Catholic School and Clinton Christian Academy.
Common Questions
What is Per Capita Income in Clinton?
Per Capita income in Clinton is $36,671.
What is the Median Family Income in Clinton?
Median Family Income in Clinton is $97,721.
What is the Median Household income in Clinton?
Median Household Income in Clinton is $78,472.
What is Income or Wage Gap in Clinton?
Income or Wage Gap in Clinton is 23.4%.
Women in Clinton earn 76.6 cents for every dollar earned by a man.
What is Inequality or Gini Index in Clinton?
Inequality or Gini Index in Clinton is 0.39.
What is the Total Population of Clinton?
Total Population of Clinton is 2,929.
What is the Total Male Population of Clinton?
Total Male Population of Clinton is 1,362.
What is the Total Female Population of Clinton?
Total Female Population of Clinton is 1,567.
What is the Ratio of Males per 100 Females in Clinton?
There are 86.92 Males per 100 Females in Clinton.
What is the Ratio of Females per 100 Males in Clinton?
There are 115.05 Females per 100 Males in Clinton.
What is the Median Population Age in Clinton?
Median Population Age in Clinton is 36.6 Years.
What is the Average Family Size in Clinton
Average Family Size in Clinton is 3.3 People.
What is the Average Household Size in Clinton
Average Household Size in Clinton is 2.8 People.
How Large is the Labor Force in Clinton?
There are 1,755 People in the Labor Forcein in Clinton.
What is the Percentage of People in the Labor Force in Clinton?
74.7% of People are in the Labor Force in Clinton.
What is the Unemployment Rate in Clinton?
Unemployment Rate in Clinton is 7.4%.