Ossineke, MI Map & Demographics
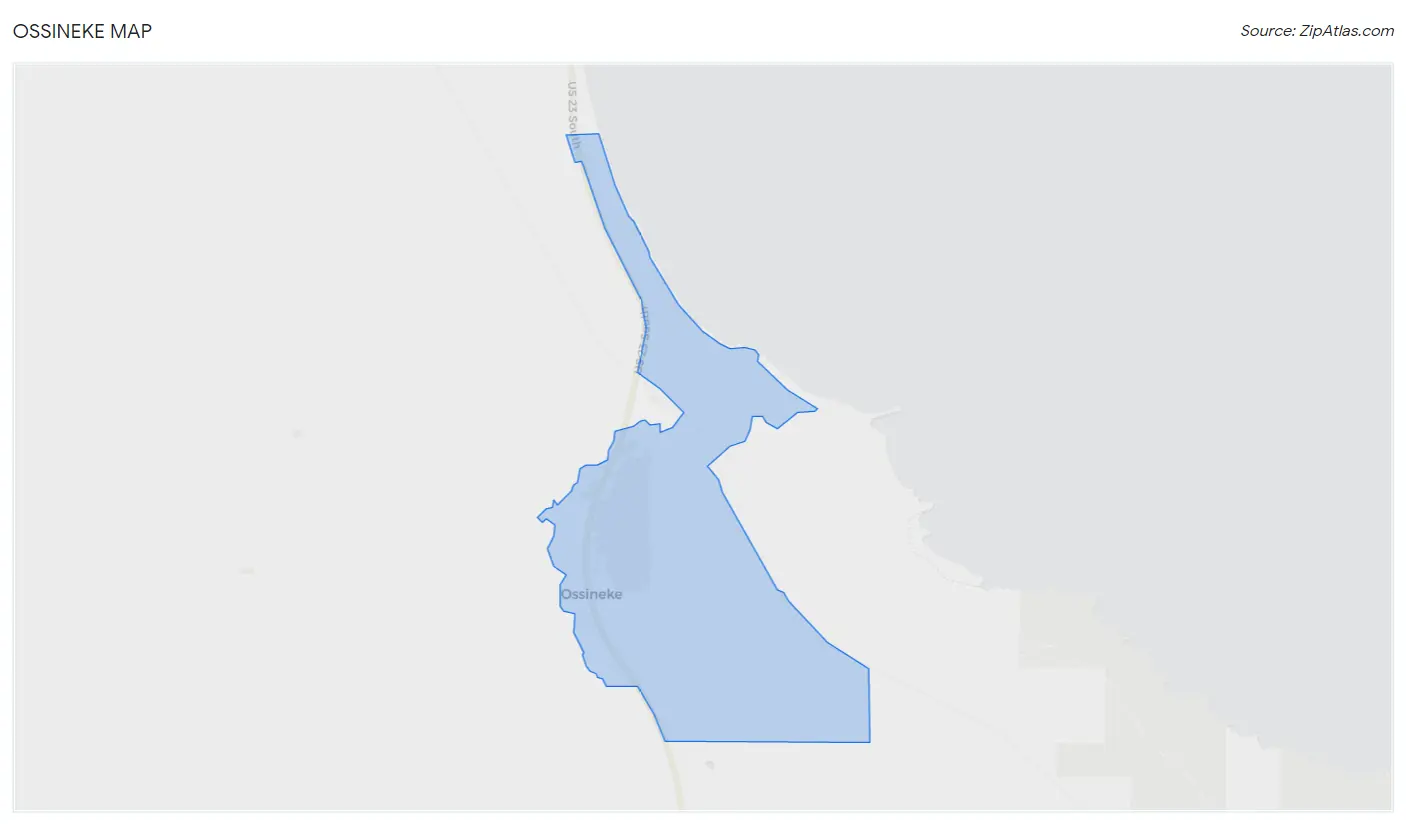
Ossineke Map
Ossineke Overview
$32,473
PER CAPITA INCOME
$80,417
AVG FAMILY INCOME
$49,340
AVG HOUSEHOLD INCOME
0.41
INEQUALITY / GINI INDEX
852
TOTAL POPULATION
432
MALE POPULATION
420
FEMALE POPULATION
102.86
MALES / 100 FEMALES
97.22
FEMALES / 100 MALES
56.3
MEDIAN AGE
2.5
AVG FAMILY SIZE
2.2
AVG HOUSEHOLD SIZE
421
LABOR FORCE [ PEOPLE ]
53.3%
PERCENT IN LABOR FORCE
13.3%
UNEMPLOYMENT RATE
Ossineke Zip Codes
Ossineke Area Codes
Income in Ossineke
Income Overview in Ossineke
Per Capita Income in Ossineke is $32,473, while median incomes of families and households are $80,417 and $49,340 respectively.
| Characteristic | Number | Measure |
| Per Capita Income | 852 | $32,473 |
| Median Family Income | 252 | $80,417 |
| Mean Family Income | 252 | $91,233 |
| Median Household Income | 392 | $49,340 |
| Mean Household Income | 392 | $71,348 |
| Income Deficit | 252 | $0 |
| Wage / Income Gap (%) | 852 | 0.00% |
| Wage / Income Gap ($) | 852 | 100.00¢ per $1 |
| Gini / Inequality Index | 852 | 0.41 |
Earnings by Sex in Ossineke
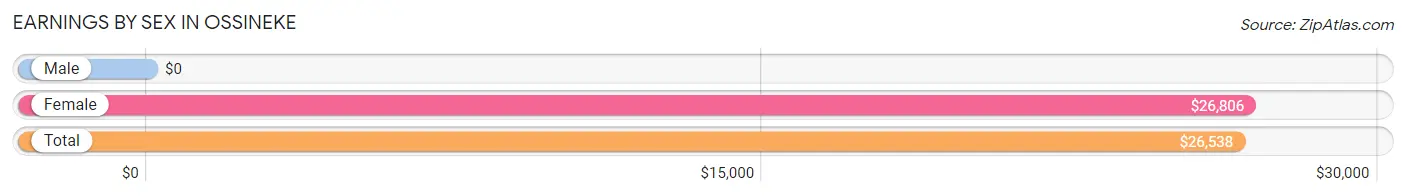
| Sex | Number | Average Earnings |
| Male | 262 (59.0%) | $0 |
| Female | 182 (41.0%) | $26,806 |
| Total | 444 (100.0%) | $26,538 |
Earnings by Sex by Income Bracket in Ossineke
The most common earnings brackets in Ossineke are $2,499 or less for men (52 | 19.9%) and $15,000 to $17,499 for women (35 | 19.2%).
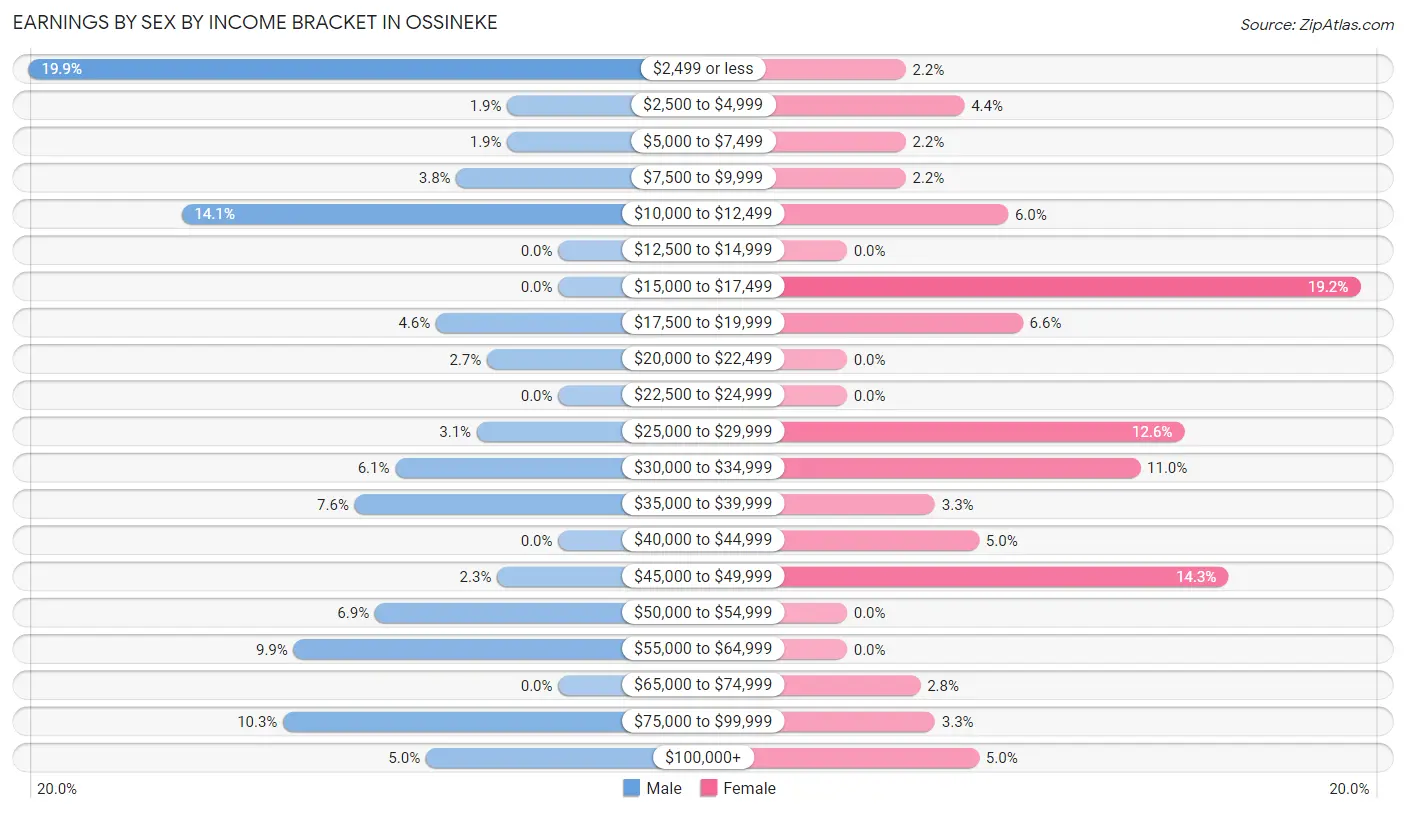
| Income | Male | Female |
| $2,499 or less | 52 (19.9%) | 4 (2.2%) |
| $2,500 to $4,999 | 5 (1.9%) | 8 (4.4%) |
| $5,000 to $7,499 | 5 (1.9%) | 4 (2.2%) |
| $7,500 to $9,999 | 10 (3.8%) | 4 (2.2%) |
| $10,000 to $12,499 | 37 (14.1%) | 11 (6.0%) |
| $12,500 to $14,999 | 0 (0.0%) | 0 (0.0%) |
| $15,000 to $17,499 | 0 (0.0%) | 35 (19.2%) |
| $17,500 to $19,999 | 12 (4.6%) | 12 (6.6%) |
| $20,000 to $22,499 | 7 (2.7%) | 0 (0.0%) |
| $22,500 to $24,999 | 0 (0.0%) | 0 (0.0%) |
| $25,000 to $29,999 | 8 (3.0%) | 23 (12.6%) |
| $30,000 to $34,999 | 16 (6.1%) | 20 (11.0%) |
| $35,000 to $39,999 | 20 (7.6%) | 6 (3.3%) |
| $40,000 to $44,999 | 0 (0.0%) | 9 (5.0%) |
| $45,000 to $49,999 | 6 (2.3%) | 26 (14.3%) |
| $50,000 to $54,999 | 18 (6.9%) | 0 (0.0%) |
| $55,000 to $64,999 | 26 (9.9%) | 0 (0.0%) |
| $65,000 to $74,999 | 0 (0.0%) | 5 (2.8%) |
| $75,000 to $99,999 | 27 (10.3%) | 6 (3.3%) |
| $100,000+ | 13 (5.0%) | 9 (5.0%) |
| Total | 262 (100.0%) | 182 (100.0%) |
Earnings by Sex by Educational Attainment in Ossineke
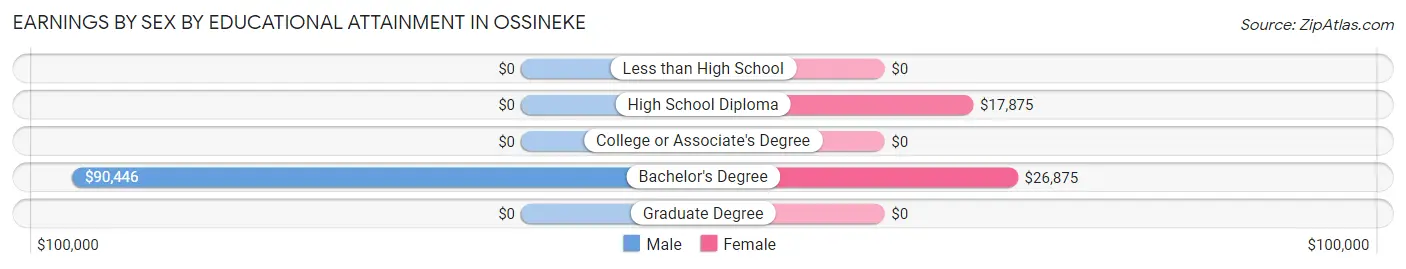
| Educational Attainment | Male Income | Female Income |
| Less than High School | - | - |
| High School Diploma | - | - |
| College or Associate's Degree | - | - |
| Bachelor's Degree | $90,446 | $26,875 |
| Graduate Degree | - | - |
| Total | - | - |
Family Income in Ossineke
Family Income Brackets in Ossineke
According to the Ossineke family income data, there are 87 families falling into the $75,000 to $99,999 income range, which is the most common income bracket and makes up 34.5% of all families.
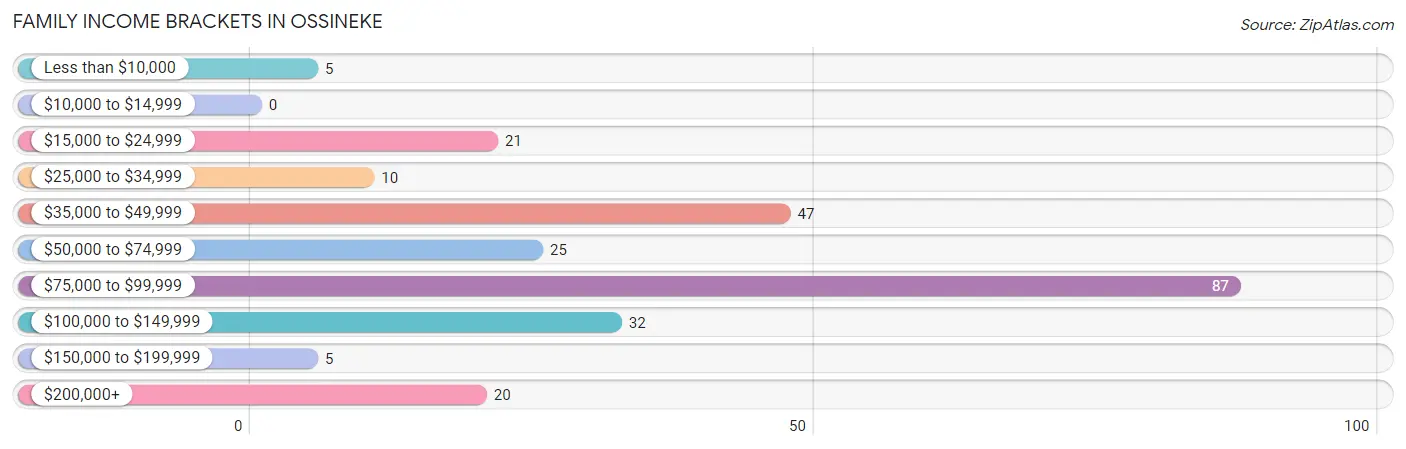
| Income Bracket | # Families | % Families |
| Less than $10,000 | 5 | 2.0% |
| $10,000 to $14,999 | 0 | 0.0% |
| $15,000 to $24,999 | 21 | 8.3% |
| $25,000 to $34,999 | 10 | 4.0% |
| $35,000 to $49,999 | 47 | 18.7% |
| $50,000 to $74,999 | 25 | 9.9% |
| $75,000 to $99,999 | 87 | 34.5% |
| $100,000 to $149,999 | 32 | 12.7% |
| $150,000 to $199,999 | 5 | 2.0% |
| $200,000+ | 20 | 7.9% |
Family Income by Famaliy Size in Ossineke
4-person families (41 | 16.3%) account for the highest median family income in Ossineke with $105,114 per family, while 2-person families (176 | 69.8%) have the highest median income of $30,500 per family member.
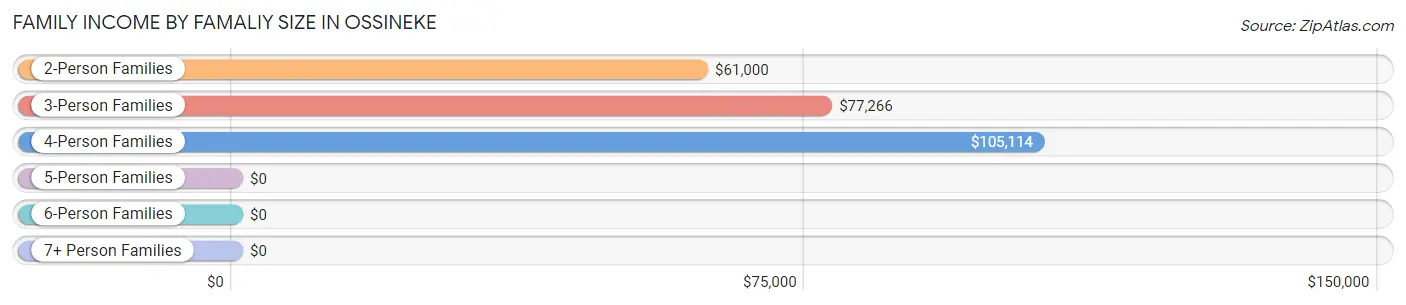
| Income Bracket | # Families | Median Income |
| 2-Person Families | 176 (69.8%) | $61,000 |
| 3-Person Families | 35 (13.9%) | $77,266 |
| 4-Person Families | 41 (16.3%) | $105,114 |
| 5-Person Families | 0 (0.0%) | $0 |
| 6-Person Families | 0 (0.0%) | $0 |
| 7+ Person Families | 0 (0.0%) | $0 |
| Total | 252 (100.0%) | $80,417 |
Family Income by Number of Earners in Ossineke
The median family income in Ossineke is $80,417, with families comprising 2 earners (67) having the highest median family income of $97,813, while families with no earners (74) have the lowest median family income of $48,173, accounting for 26.6% and 29.4% of families, respectively.
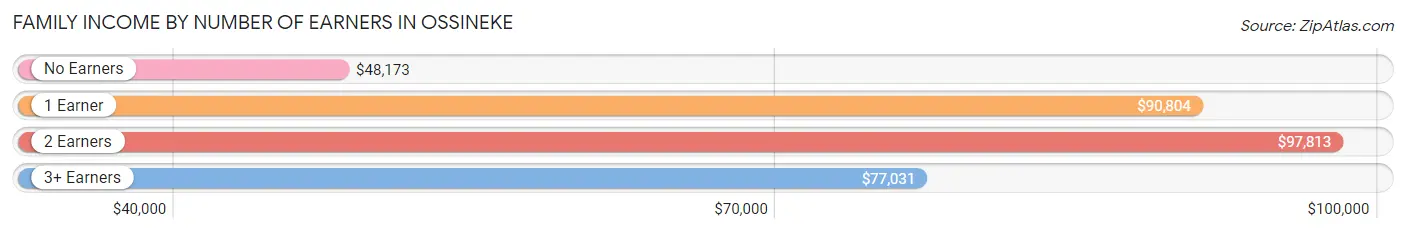
| Number of Earners | # Families | Median Income |
| No Earners | 74 (29.4%) | $48,173 |
| 1 Earner | 85 (33.7%) | $90,804 |
| 2 Earners | 67 (26.6%) | $97,813 |
| 3+ Earners | 26 (10.3%) | $77,031 |
| Total | 252 (100.0%) | $80,417 |
Household Income in Ossineke
Household Income Brackets in Ossineke
With 91 households falling in the category, the $35,000 to $49,999 income range is the most frequent in Ossineke, accounting for 23.2% of all households.
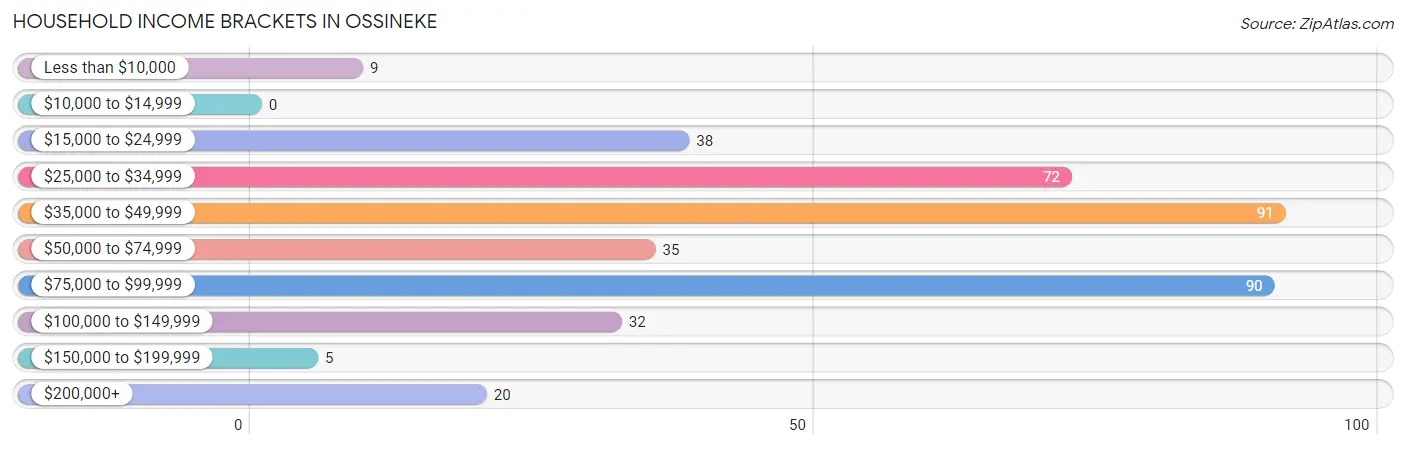
| Income Bracket | # Households | % Households |
| Less than $10,000 | 9 | 2.3% |
| $10,000 to $14,999 | 0 | 0.0% |
| $15,000 to $24,999 | 38 | 9.7% |
| $25,000 to $34,999 | 72 | 18.4% |
| $35,000 to $49,999 | 91 | 23.2% |
| $50,000 to $74,999 | 35 | 8.9% |
| $75,000 to $99,999 | 90 | 23.0% |
| $100,000 to $149,999 | 32 | 8.2% |
| $150,000 to $199,999 | 5 | 1.3% |
| $200,000+ | 20 | 5.1% |
Household Income by Householder Age in Ossineke
The median household income in Ossineke is $49,340, with the highest median household income of $82,500 found in the 25 to 44 years age bracket for the primary householder. A total of 88 households (22.5%) fall into this category. Meanwhile, the 15 to 24 years age bracket for the primary householder has the lowest median household income of $0, with 20 households (5.1%) in this group.
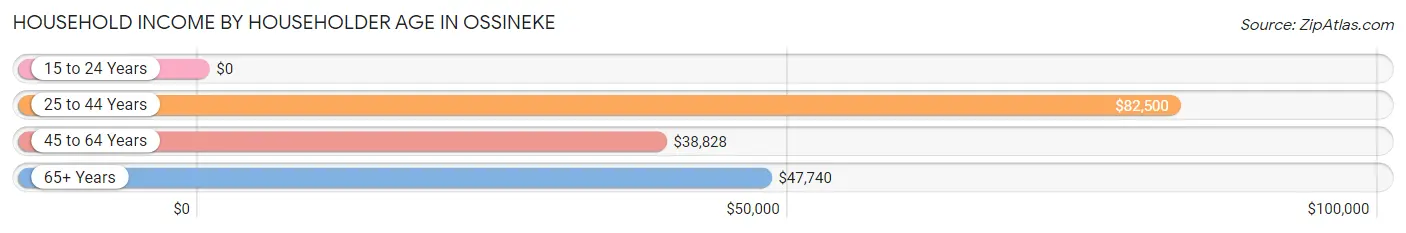
| Income Bracket | # Households | Median Income |
| 15 to 24 Years | 20 (5.1%) | $0 |
| 25 to 44 Years | 88 (22.5%) | $82,500 |
| 45 to 64 Years | 115 (29.3%) | $38,828 |
| 65+ Years | 169 (43.1%) | $47,740 |
| Total | 392 (100.0%) | $49,340 |
Poverty in Ossineke
Income Below Poverty by Sex and Age in Ossineke
With 19.0% poverty level for males and 3.3% for females among the residents of Ossineke, 55 to 64 year old males and 65 to 74 year old females are the most vulnerable to poverty, with 77 males (62.1%) and 5 females (7.5%) in their respective age groups living below the poverty level.
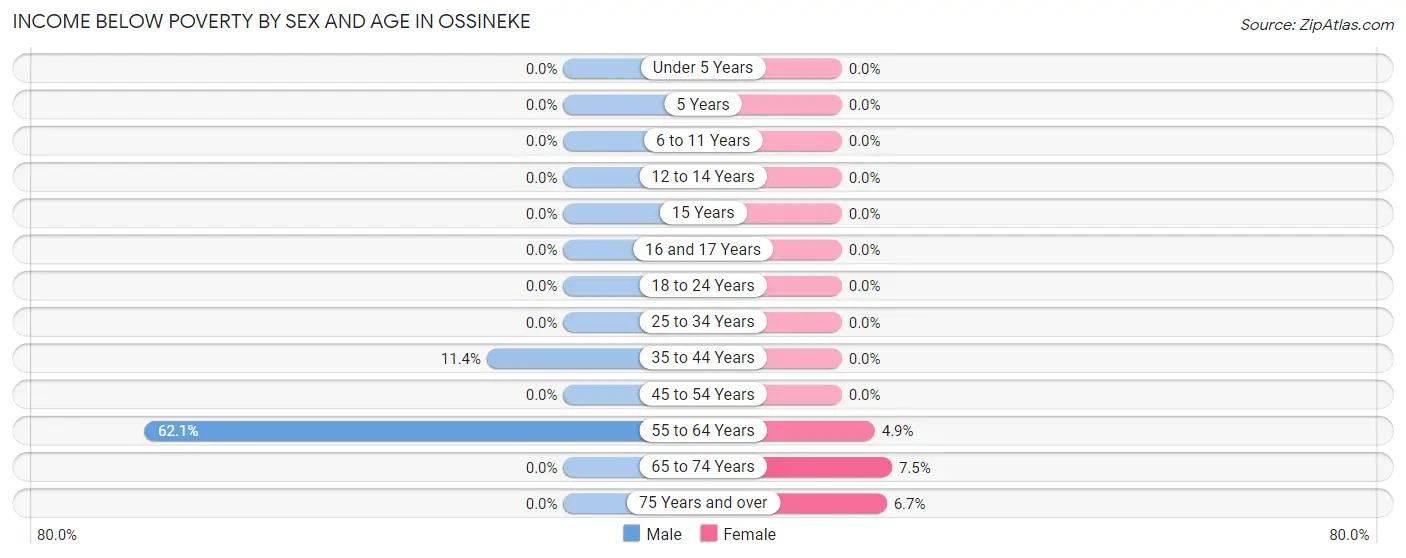
| Age Bracket | Male | Female |
| Under 5 Years | 0 (0.0%) | 0 (0.0%) |
| 5 Years | 0 (0.0%) | 0 (0.0%) |
| 6 to 11 Years | 0 (0.0%) | 0 (0.0%) |
| 12 to 14 Years | 0 (0.0%) | 0 (0.0%) |
| 15 Years | 0 (0.0%) | 0 (0.0%) |
| 16 and 17 Years | 0 (0.0%) | 0 (0.0%) |
| 18 to 24 Years | 0 (0.0%) | 0 (0.0%) |
| 25 to 34 Years | 0 (0.0%) | 0 (0.0%) |
| 35 to 44 Years | 5 (11.4%) | 0 (0.0%) |
| 45 to 54 Years | 0 (0.0%) | 0 (0.0%) |
| 55 to 64 Years | 77 (62.1%) | 5 (4.9%) |
| 65 to 74 Years | 0 (0.0%) | 5 (7.5%) |
| 75 Years and over | 0 (0.0%) | 4 (6.7%) |
| Total | 82 (19.0%) | 14 (3.3%) |
Income Above Poverty by Sex and Age in Ossineke
According to the poverty statistics in Ossineke, males aged under 5 years and females aged under 5 years are the age groups that are most secure financially, with 100.0% of males and 100.0% of females in these age groups living above the poverty line.
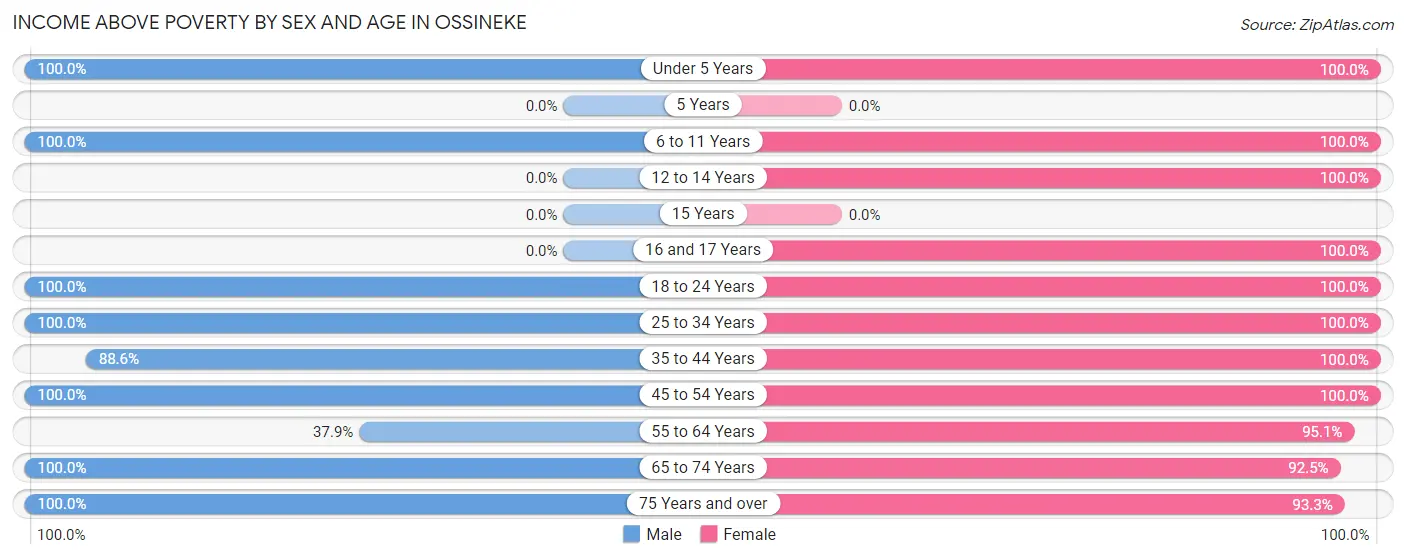
| Age Bracket | Male | Female |
| Under 5 Years | 18 (100.0%) | 3 (100.0%) |
| 5 Years | 0 (0.0%) | 0 (0.0%) |
| 6 to 11 Years | 11 (100.0%) | 19 (100.0%) |
| 12 to 14 Years | 0 (0.0%) | 11 (100.0%) |
| 15 Years | 0 (0.0%) | 0 (0.0%) |
| 16 and 17 Years | 0 (0.0%) | 12 (100.0%) |
| 18 to 24 Years | 62 (100.0%) | 31 (100.0%) |
| 25 to 34 Years | 41 (100.0%) | 58 (100.0%) |
| 35 to 44 Years | 39 (88.6%) | 46 (100.0%) |
| 45 to 54 Years | 32 (100.0%) | 11 (100.0%) |
| 55 to 64 Years | 47 (37.9%) | 97 (95.1%) |
| 65 to 74 Years | 59 (100.0%) | 62 (92.5%) |
| 75 Years and over | 41 (100.0%) | 56 (93.3%) |
| Total | 350 (81.0%) | 406 (96.7%) |
Income Below Poverty Among Married-Couple Families in Ossineke
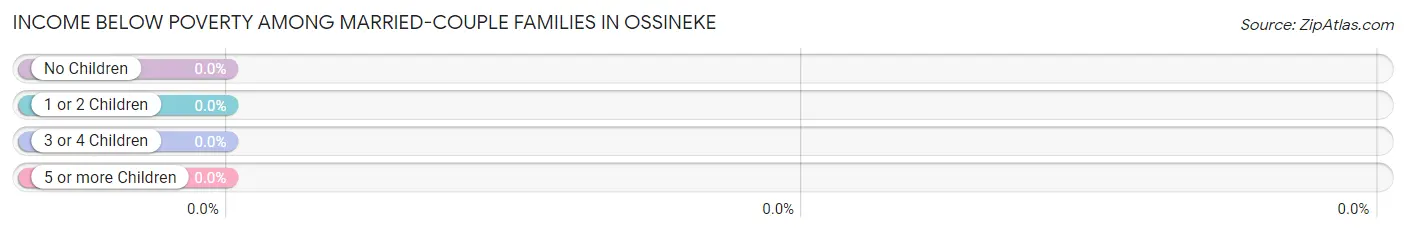
| Children | Above Poverty | Below Poverty |
| No Children | 159 (100.0%) | 0 (0.0%) |
| 1 or 2 Children | 36 (100.0%) | 0 (0.0%) |
| 3 or 4 Children | 0 (0.0%) | 0 (0.0%) |
| 5 or more Children | 0 (0.0%) | 0 (0.0%) |
| Total | 195 (100.0%) | 0 (0.0%) |
Income Below Poverty Among Single-Parent Households in Ossineke
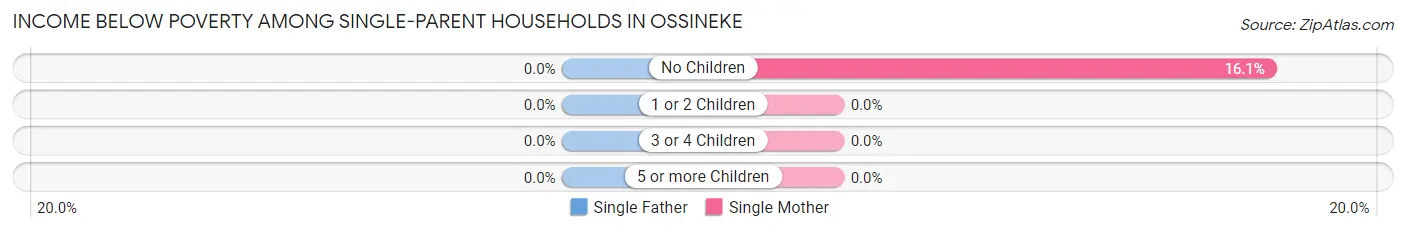
| Children | Single Father | Single Mother |
| No Children | 0 (0.0%) | 5 (16.1%) |
| 1 or 2 Children | 0 (0.0%) | 0 (0.0%) |
| 3 or 4 Children | 0 (0.0%) | 0 (0.0%) |
| 5 or more Children | 0 (0.0%) | 0 (0.0%) |
| Total | 0 (0.0%) | 5 (13.9%) |
Income Below Poverty Among Married-Couple vs Single-Parent Households in Ossineke
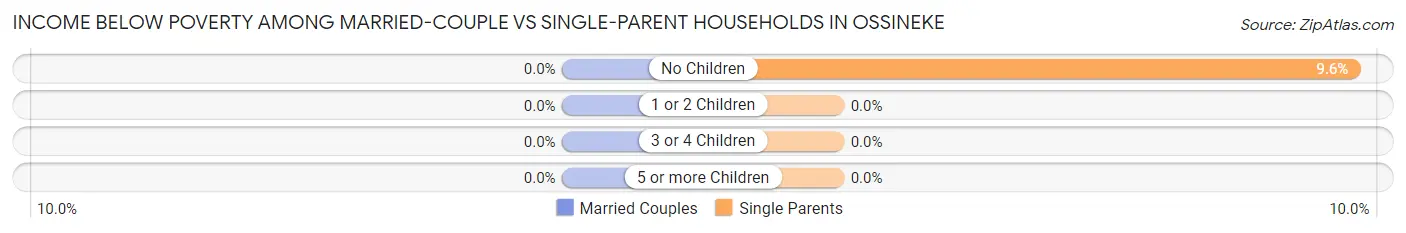
| Children | Married-Couple Families | Single-Parent Households |
| No Children | 0 (0.0%) | 5 (9.6%) |
| 1 or 2 Children | 0 (0.0%) | 0 (0.0%) |
| 3 or 4 Children | 0 (0.0%) | 0 (0.0%) |
| 5 or more Children | 0 (0.0%) | 0 (0.0%) |
| Total | 0 (0.0%) | 5 (8.8%) |
Race in Ossineke
The most populous races in Ossineke are White / Caucasian (833 | 97.8%), Black / African American (10 | 1.2%), and Two or more Races (9 | 1.1%).
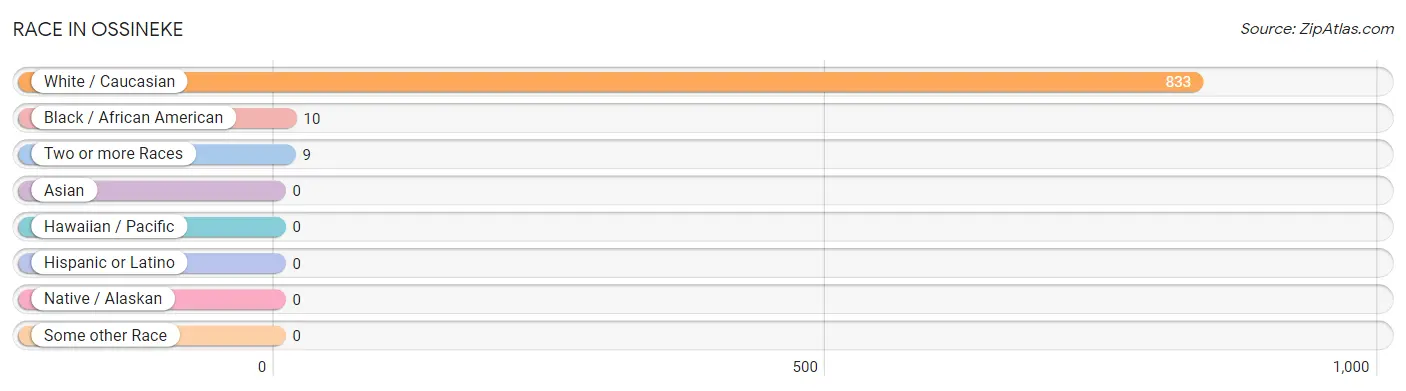
| Race | # Population | % Population |
| Asian | 0 | 0.0% |
| Black / African American | 10 | 1.2% |
| Hawaiian / Pacific | 0 | 0.0% |
| Hispanic or Latino | 0 | 0.0% |
| Native / Alaskan | 0 | 0.0% |
| White / Caucasian | 833 | 97.8% |
| Two or more Races | 9 | 1.1% |
| Some other Race | 0 | 0.0% |
| Total | 852 | 100.0% |
Ancestry in Ossineke
The most populous ancestries reported in Ossineke are German (227 | 26.6%), Polish (89 | 10.4%), English (58 | 6.8%), Irish (58 | 6.8%), and French (54 | 6.3%), together accounting for 57.1% of all Ossineke residents.
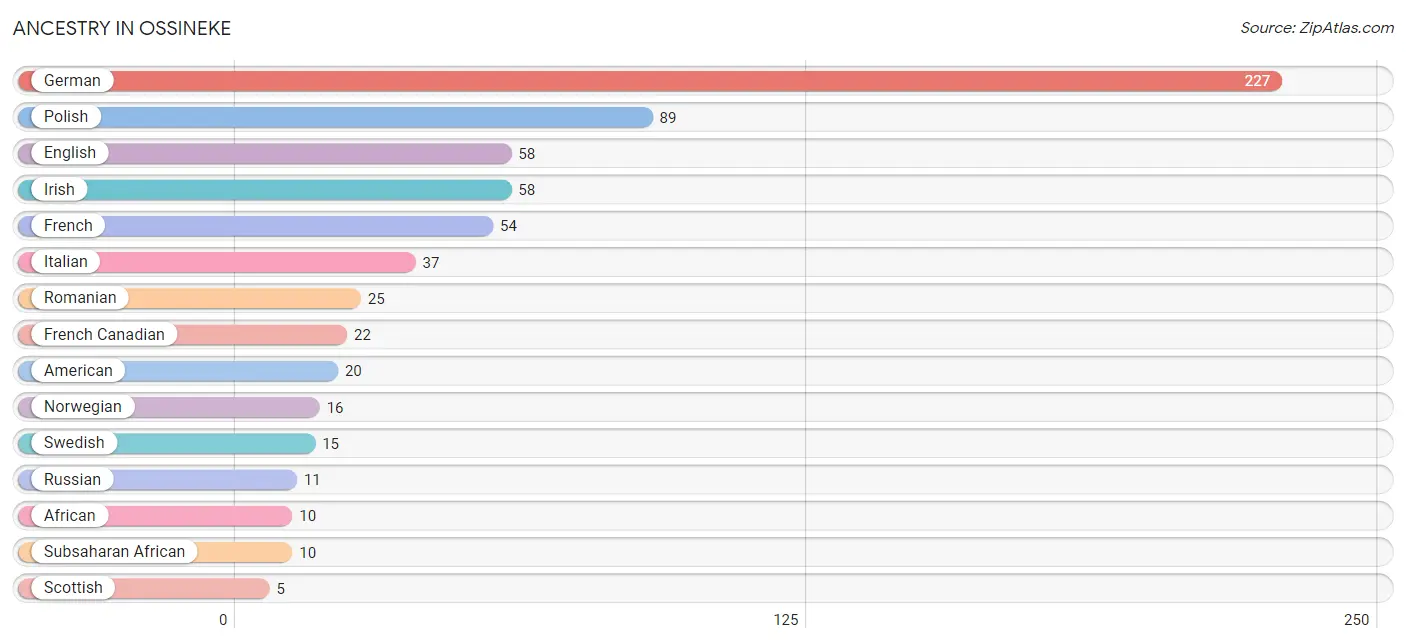
| Ancestry | # Population | % Population |
| African | 10 | 1.2% |
| American | 20 | 2.4% |
| Armenian | 4 | 0.5% |
| Canadian | 2 | 0.2% |
| English | 58 | 6.8% |
| French | 54 | 6.3% |
| French Canadian | 22 | 2.6% |
| German | 227 | 26.6% |
| Irish | 58 | 6.8% |
| Italian | 37 | 4.3% |
| Norwegian | 16 | 1.9% |
| Polish | 89 | 10.4% |
| Romanian | 25 | 2.9% |
| Russian | 11 | 1.3% |
| Scandinavian | 3 | 0.4% |
| Scotch-Irish | 4 | 0.5% |
| Scottish | 5 | 0.6% |
| Slovak | 4 | 0.5% |
| Subsaharan African | 10 | 1.2% |
| Swedish | 15 | 1.8% |
| Welsh | 4 | 0.5% | View All 21 Rows |
Immigrants in Ossineke
The most numerous immigrant groups reported in Ossineke came from Europe (38 | 4.5%), Eastern Europe (25 | 2.9%), Romania (25 | 2.9%), Germany (13 | 1.5%), and Western Europe (13 | 1.5%), together accounting for 13.4% of all Ossineke residents.
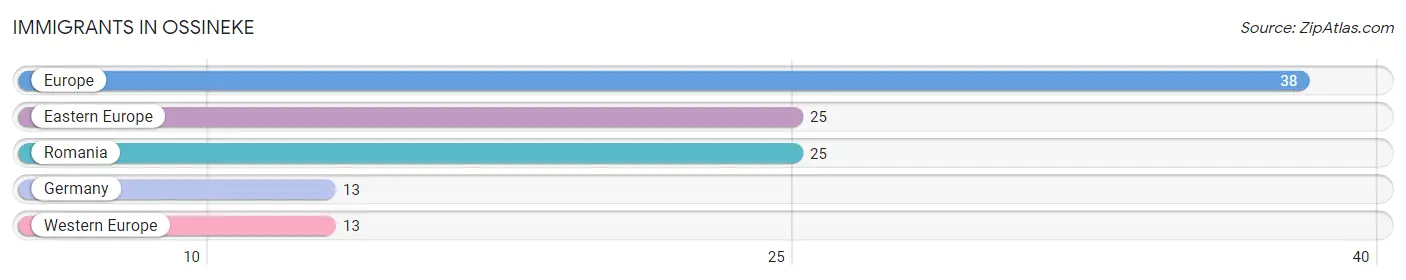
| Immigration Origin | # Population | % Population |
| Eastern Europe | 25 | 2.9% |
| Europe | 38 | 4.5% |
| Germany | 13 | 1.5% |
| Romania | 25 | 2.9% |
| Western Europe | 13 | 1.5% | View All 5 Rows |
Sex and Age in Ossineke
Sex and Age in Ossineke
The most populous age groups in Ossineke are 55 to 59 Years (101 | 23.4%) for men and 55 to 59 Years (69 | 16.4%) for women.
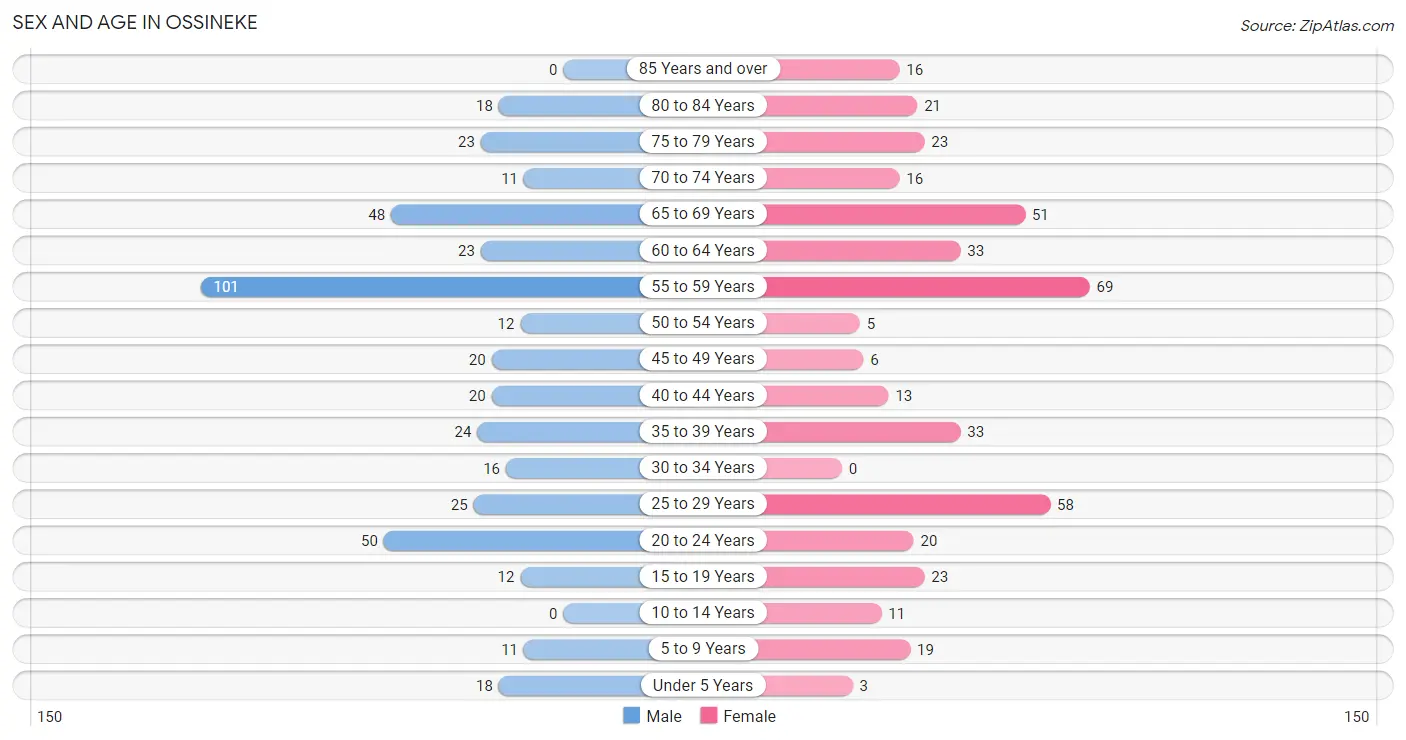
| Age Bracket | Male | Female |
| Under 5 Years | 18 (4.2%) | 3 (0.7%) |
| 5 to 9 Years | 11 (2.5%) | 19 (4.5%) |
| 10 to 14 Years | 0 (0.0%) | 11 (2.6%) |
| 15 to 19 Years | 12 (2.8%) | 23 (5.5%) |
| 20 to 24 Years | 50 (11.6%) | 20 (4.8%) |
| 25 to 29 Years | 25 (5.8%) | 58 (13.8%) |
| 30 to 34 Years | 16 (3.7%) | 0 (0.0%) |
| 35 to 39 Years | 24 (5.6%) | 33 (7.9%) |
| 40 to 44 Years | 20 (4.6%) | 13 (3.1%) |
| 45 to 49 Years | 20 (4.6%) | 6 (1.4%) |
| 50 to 54 Years | 12 (2.8%) | 5 (1.2%) |
| 55 to 59 Years | 101 (23.4%) | 69 (16.4%) |
| 60 to 64 Years | 23 (5.3%) | 33 (7.9%) |
| 65 to 69 Years | 48 (11.1%) | 51 (12.1%) |
| 70 to 74 Years | 11 (2.5%) | 16 (3.8%) |
| 75 to 79 Years | 23 (5.3%) | 23 (5.5%) |
| 80 to 84 Years | 18 (4.2%) | 21 (5.0%) |
| 85 Years and over | 0 (0.0%) | 16 (3.8%) |
| Total | 432 (100.0%) | 420 (100.0%) |
Families and Households in Ossineke
Median Family Size in Ossineke
The median family size in Ossineke is 2.52 persons per family, with single male/father families (21 | 8.3%) accounting for the largest median family size of 2.95 persons per family. On the other hand, single female/mother families (36 | 14.3%) represent the smallest median family size with 2.28 persons per family.
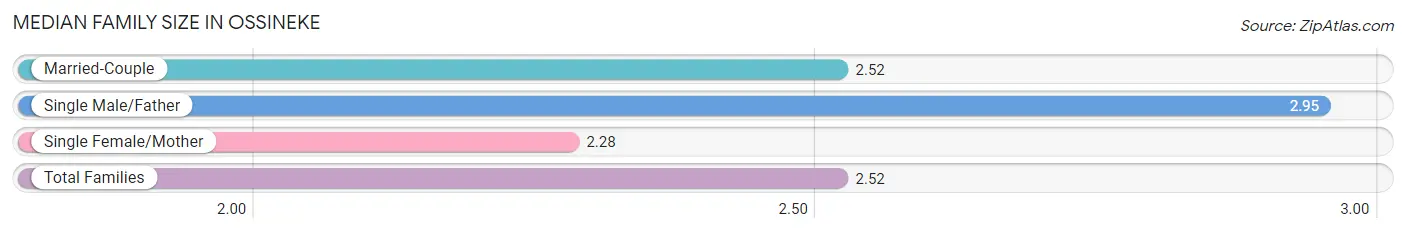
| Family Type | # Families | Family Size |
| Married-Couple | 195 (77.4%) | 2.52 |
| Single Male/Father | 21 (8.3%) | 2.95 |
| Single Female/Mother | 36 (14.3%) | 2.28 |
| Total Families | 252 (100.0%) | 2.52 |
Median Household Size in Ossineke
The median household size in Ossineke is 2.17 persons per household, with single male/father households (21 | 5.4%) accounting for the largest median household size of 2.95 persons per household. non-family households (140 | 35.7%) represent the smallest median household size with 1.55 persons per household.
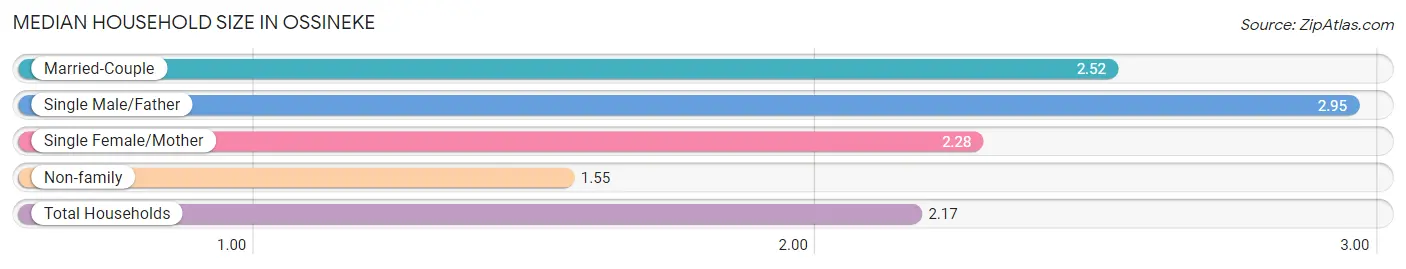
| Household Type | # Households | Household Size |
| Married-Couple | 195 (49.7%) | 2.52 |
| Single Male/Father | 21 (5.4%) | 2.95 |
| Single Female/Mother | 36 (9.2%) | 2.28 |
| Non-family | 140 (35.7%) | 1.55 |
| Total Households | 392 (100.0%) | 2.17 |
Household Size by Marriage Status in Ossineke
Out of a total of 392 households in Ossineke, 252 (64.3%) are family households, while 140 (35.7%) are nonfamily households. The most numerous type of family households are 2-person households, comprising 176, and the most common type of nonfamily households are 1-person households, comprising 114.
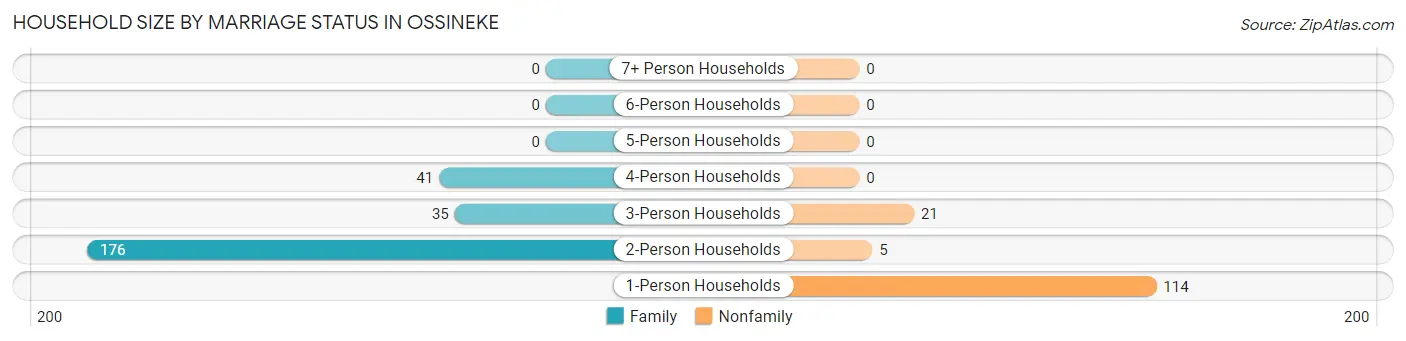
| Household Size | Family Households | Nonfamily Households |
| 1-Person Households | - | 114 (29.1%) |
| 2-Person Households | 176 (44.9%) | 5 (1.3%) |
| 3-Person Households | 35 (8.9%) | 21 (5.4%) |
| 4-Person Households | 41 (10.5%) | 0 (0.0%) |
| 5-Person Households | 0 (0.0%) | 0 (0.0%) |
| 6-Person Households | 0 (0.0%) | 0 (0.0%) |
| 7+ Person Households | 0 (0.0%) | 0 (0.0%) |
| Total | 252 (64.3%) | 140 (35.7%) |
Female Fertility in Ossineke
Fertility by Age in Ossineke
Average fertility rate in Ossineke is 13.0 births per 1,000 women. Women in the age bracket of 35 to 50 years have the highest fertility rate with 38.0 births per 1,000 women. Women in the age bracket of 35 to 50 years acount for 100.0% of all women with births.
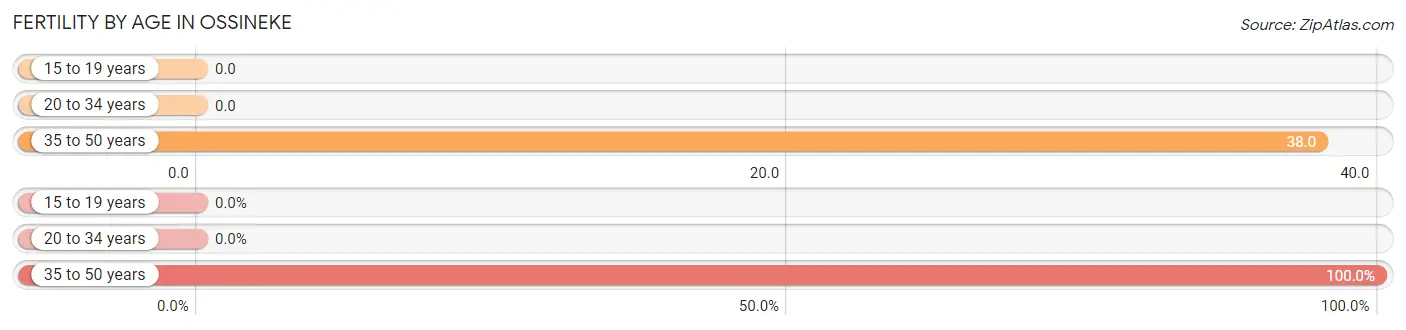
| Age Bracket | Women with Births | Births / 1,000 Women |
| 15 to 19 years | 0 (0.0%) | 0.0 |
| 20 to 34 years | 0 (0.0%) | 0.0 |
| 35 to 50 years | 2 (100.0%) | 38.0 |
| Total | 2 (100.0%) | 13.0 |
Fertility by Age by Marriage Status in Ossineke
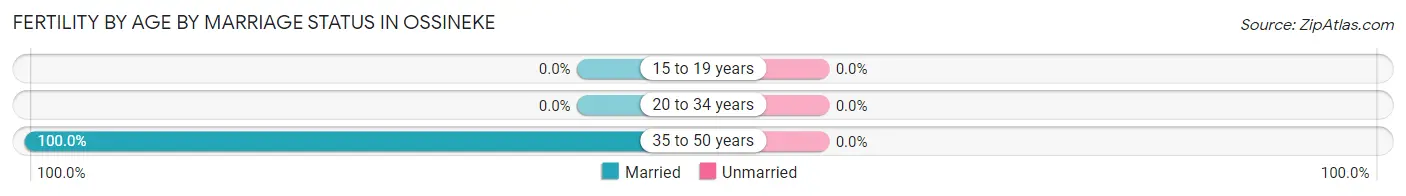
| Age Bracket | Married | Unmarried |
| 15 to 19 years | 0 (0.0%) | 0 (0.0%) |
| 20 to 34 years | 0 (0.0%) | 0 (0.0%) |
| 35 to 50 years | 2 (100.0%) | 0 (0.0%) |
| Total | 2 (100.0%) | 0 (0.0%) |
Fertility by Education in Ossineke
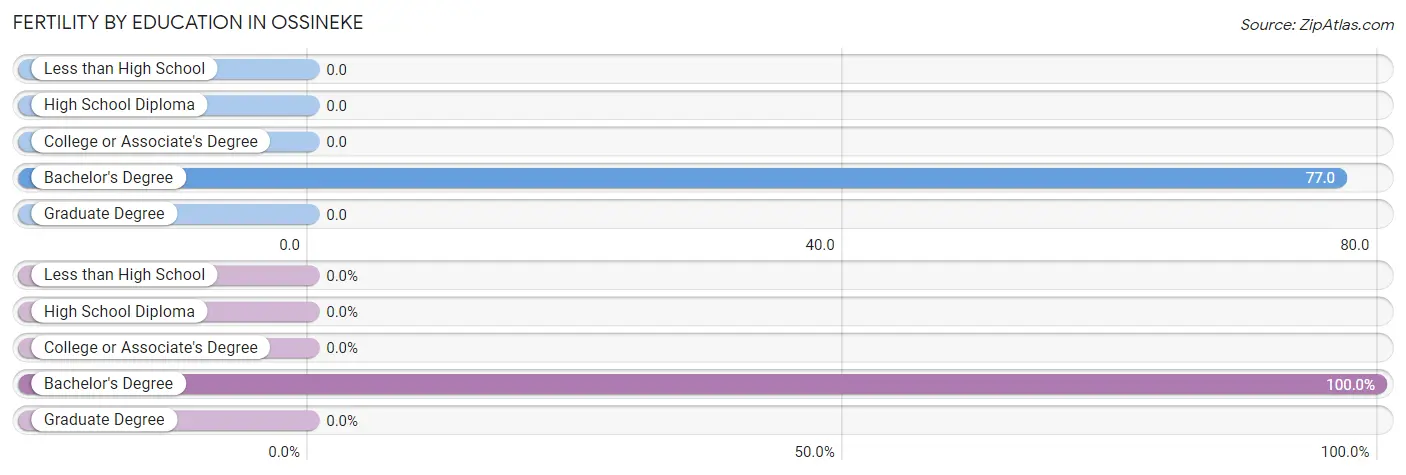
| Educational Attainment | Women with Births | Births / 1,000 Women |
| Less than High School | 0 (0.0%) | 0.0 |
| High School Diploma | 0 (0.0%) | 0.0 |
| College or Associate's Degree | 0 (0.0%) | 0.0 |
| Bachelor's Degree | 2 (100.0%) | 77.0 |
| Graduate Degree | 0 (0.0%) | 0.0 |
| Total | 2 (100.0%) | 13.0 |
Fertility by Education by Marriage Status in Ossineke
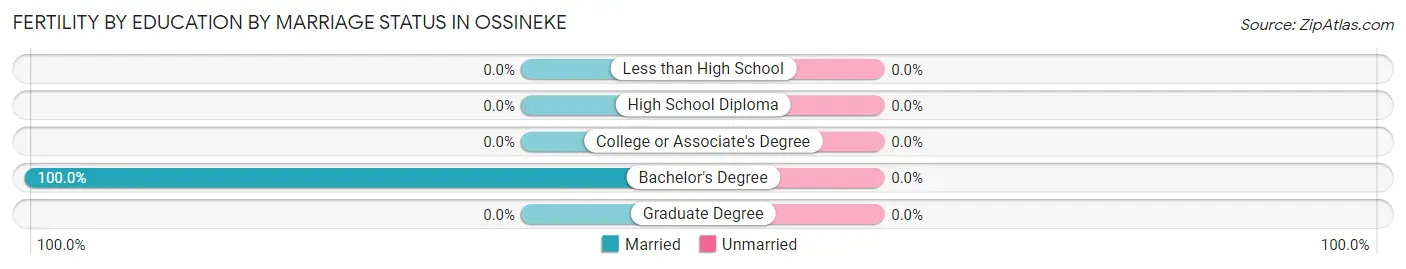
| Educational Attainment | Married | Unmarried |
| Less than High School | 0 (0.0%) | 0 (0.0%) |
| High School Diploma | 0 (0.0%) | 0 (0.0%) |
| College or Associate's Degree | 0 (0.0%) | 0 (0.0%) |
| Bachelor's Degree | 2 (100.0%) | 0 (0.0%) |
| Graduate Degree | 0 (0.0%) | 0 (0.0%) |
| Total | 2 (100.0%) | 0 (0.0%) |
Employment Characteristics in Ossineke
Employment by Class of Employer in Ossineke
Among the 365 employed individuals in Ossineke, private company employees (275 | 75.3%), self-employed (not incorporated) (37 | 10.1%), and federal government employees (25 | 6.9%) make up the most common classes of employment.
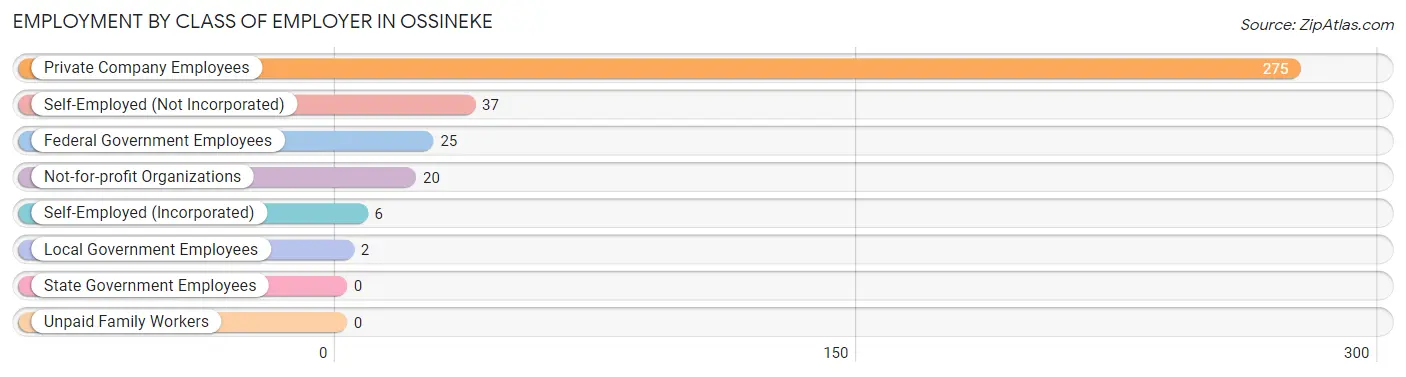
| Employer Class | # Employees | % Employees |
| Private Company Employees | 275 | 75.3% |
| Self-Employed (Incorporated) | 6 | 1.6% |
| Self-Employed (Not Incorporated) | 37 | 10.1% |
| Not-for-profit Organizations | 20 | 5.5% |
| Local Government Employees | 2 | 0.5% |
| State Government Employees | 0 | 0.0% |
| Federal Government Employees | 25 | 6.9% |
| Unpaid Family Workers | 0 | 0.0% |
| Total | 365 | 100.0% |
Employment Status by Age in Ossineke
According to the labor force statistics for Ossineke, out of the total population over 16 years of age (790), 53.3% or 421 individuals are in the labor force, with 13.3% or 56 of them unemployed. The age group with the highest labor force participation rate is 30 to 34 years, with 100.0% or 16 individuals in the labor force. Within the labor force, the 55 to 59 years age range has the highest percentage of unemployed individuals, with 30.1% or 34 of them being unemployed.
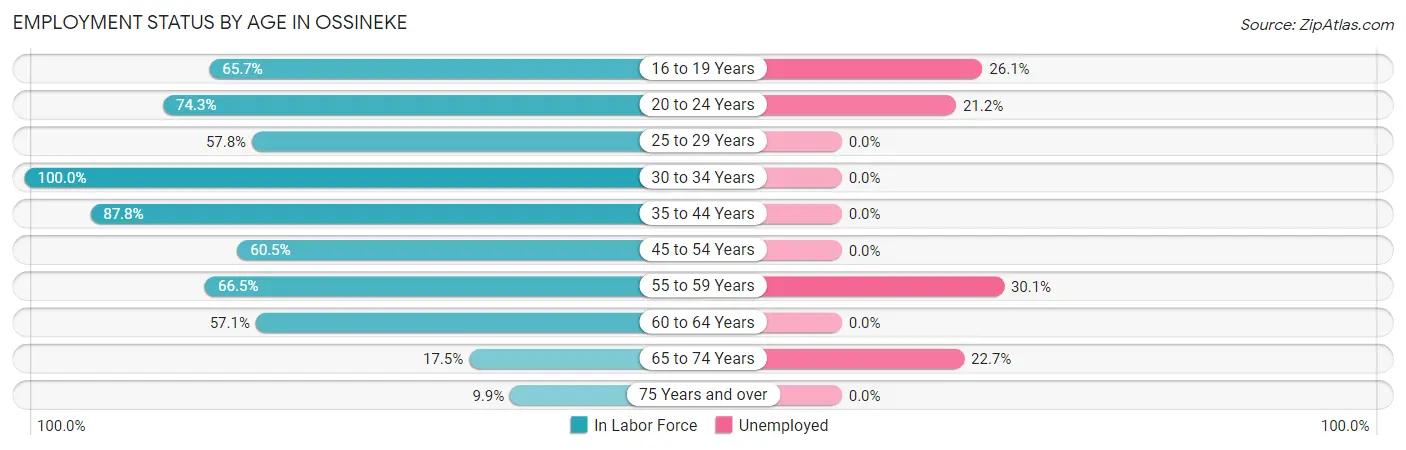
| Age Bracket | In Labor Force | Unemployed |
| 16 to 19 Years | 23 (65.7%) | 6 (26.1%) |
| 20 to 24 Years | 52 (74.3%) | 11 (21.2%) |
| 25 to 29 Years | 48 (57.8%) | 0 (0.0%) |
| 30 to 34 Years | 16 (100.0%) | 0 (0.0%) |
| 35 to 44 Years | 79 (87.8%) | 0 (0.0%) |
| 45 to 54 Years | 26 (60.5%) | 0 (0.0%) |
| 55 to 59 Years | 113 (66.5%) | 34 (30.1%) |
| 60 to 64 Years | 32 (57.1%) | 0 (0.0%) |
| 65 to 74 Years | 22 (17.5%) | 5 (22.7%) |
| 75 Years and over | 10 (9.9%) | 0 (0.0%) |
| Total | 421 (53.3%) | 56 (13.3%) |
Employment Status by Educational Attainment in Ossineke
According to labor force statistics for Ossineke, 68.6% of individuals (314) out of the total population between 25 and 64 years of age (458) are in the labor force, with 10.8% or 34 of them being unemployed. The group with the highest labor force participation rate are those with the educational attainment of bachelor's degree or higher, with 85.5% or 53 individuals in the labor force. Within the labor force, individuals with college / associate degree education have the highest percentage of unemployment, with 25.8% or 34 of them being unemployed.
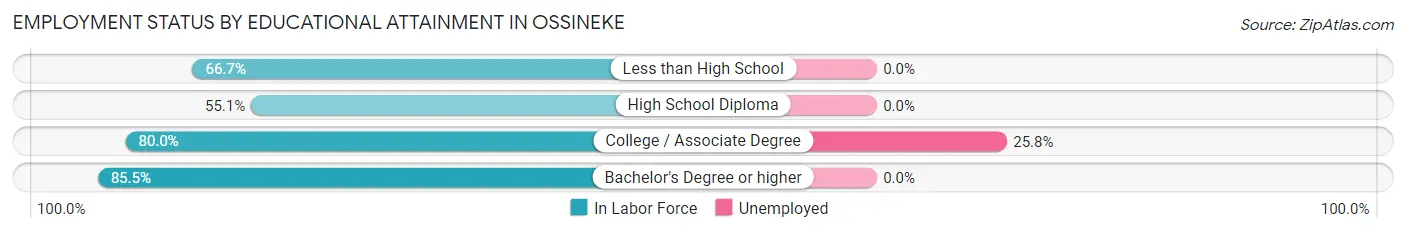
| Educational Attainment | In Labor Force | Unemployed |
| Less than High School | 10 (66.7%) | 0 (0.0%) |
| High School Diploma | 119 (55.1%) | 0 (0.0%) |
| College / Associate Degree | 132 (80.0%) | 43 (25.8%) |
| Bachelor's Degree or higher | 53 (85.5%) | 0 (0.0%) |
| Total | 314 (68.6%) | 49 (10.8%) |
Employment Occupations by Sex in Ossineke
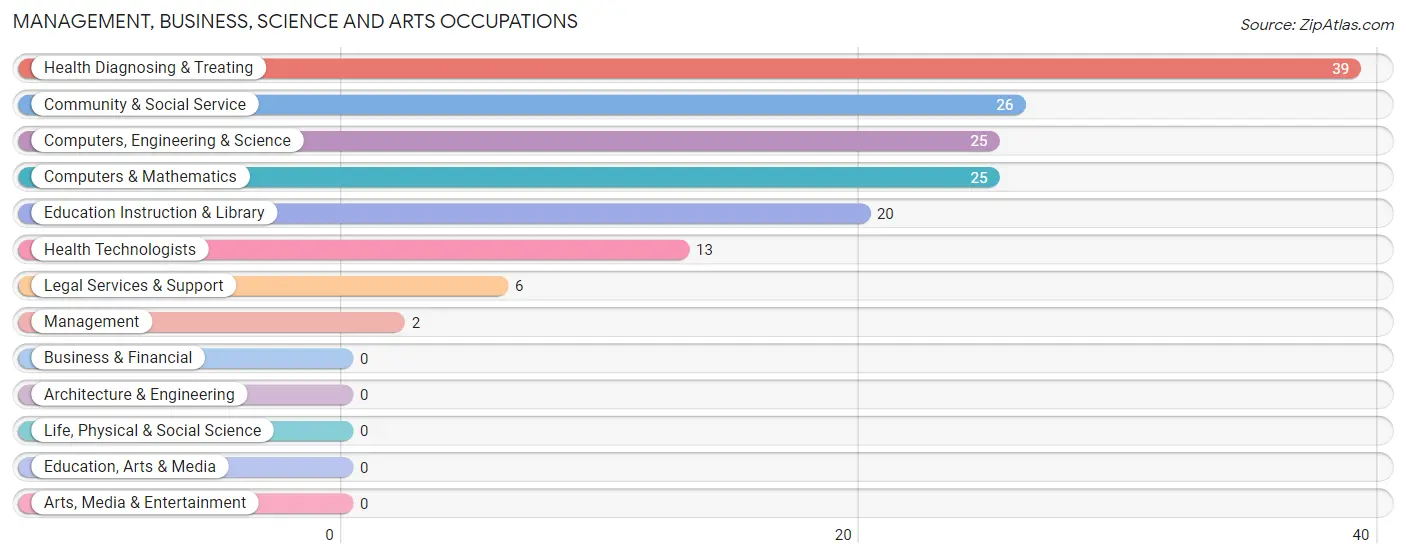
Management, Business, Science and Arts Occupations
The most common Management, Business, Science and Arts occupations in Ossineke are Health Diagnosing & Treating (39 | 10.7%), Community & Social Service (26 | 7.1%), Computers, Engineering & Science (25 | 6.9%), Computers & Mathematics (25 | 6.9%), and Education Instruction & Library (20 | 5.5%).
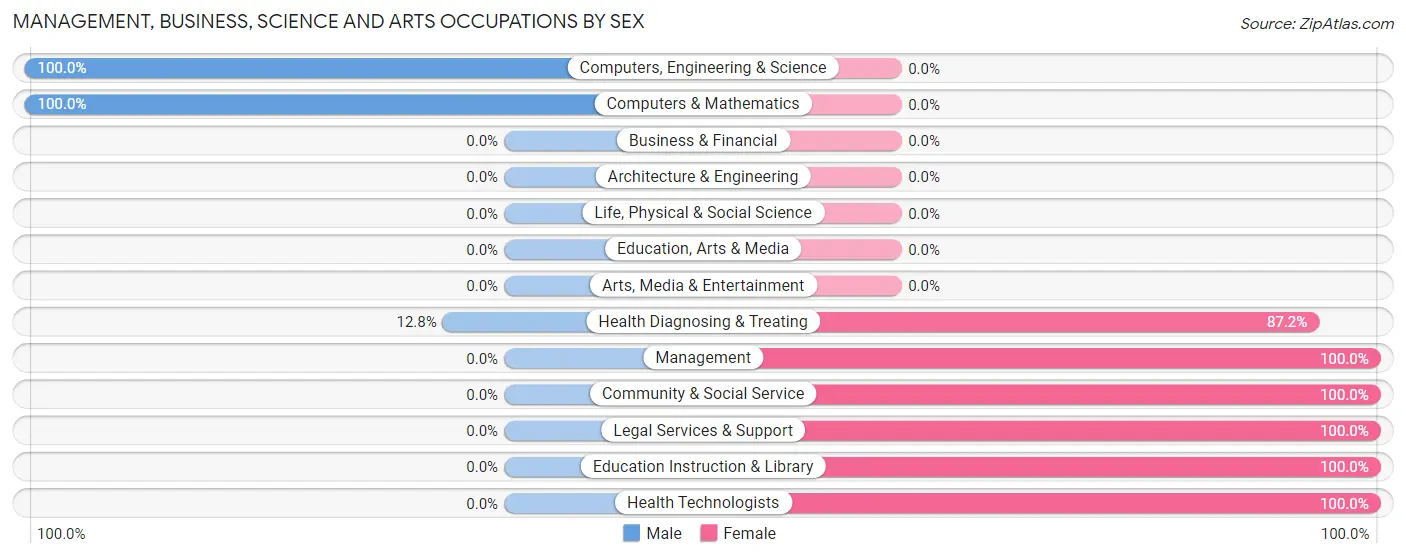
Management, Business, Science and Arts Occupations by Sex
Within the Management, Business, Science and Arts occupations in Ossineke, the most male-oriented occupations are Computers, Engineering & Science (100.0%), Computers & Mathematics (100.0%), and Health Diagnosing & Treating (12.8%), while the most female-oriented occupations are Management (100.0%), Community & Social Service (100.0%), and Legal Services & Support (100.0%).
| Occupation | Male | Female |
| Management | 0 (0.0%) | 2 (100.0%) |
| Business & Financial | 0 (0.0%) | 0 (0.0%) |
| Computers, Engineering & Science | 25 (100.0%) | 0 (0.0%) |
| Computers & Mathematics | 25 (100.0%) | 0 (0.0%) |
| Architecture & Engineering | 0 (0.0%) | 0 (0.0%) |
| Life, Physical & Social Science | 0 (0.0%) | 0 (0.0%) |
| Community & Social Service | 0 (0.0%) | 26 (100.0%) |
| Education, Arts & Media | 0 (0.0%) | 0 (0.0%) |
| Legal Services & Support | 0 (0.0%) | 6 (100.0%) |
| Education Instruction & Library | 0 (0.0%) | 20 (100.0%) |
| Arts, Media & Entertainment | 0 (0.0%) | 0 (0.0%) |
| Health Diagnosing & Treating | 5 (12.8%) | 34 (87.2%) |
| Health Technologists | 0 (0.0%) | 13 (100.0%) |
| Total (Category) | 30 (32.6%) | 62 (67.4%) |
| Total (Overall) | 187 (51.2%) | 178 (48.8%) |
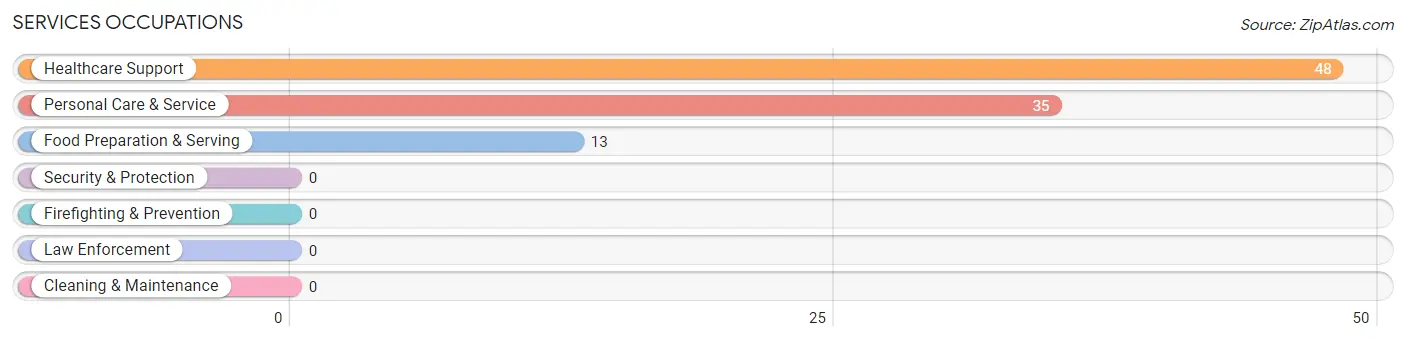
Services Occupations
The most common Services occupations in Ossineke are Healthcare Support (48 | 13.2%), Personal Care & Service (35 | 9.6%), and Food Preparation & Serving (13 | 3.6%).
Services Occupations by Sex
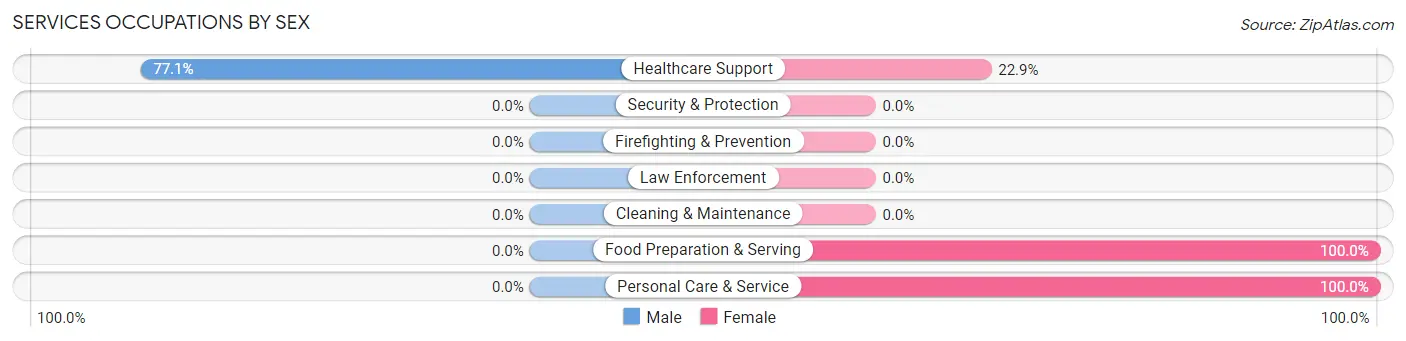
| Occupation | Male | Female |
| Healthcare Support | 37 (77.1%) | 11 (22.9%) |
| Security & Protection | 0 (0.0%) | 0 (0.0%) |
| Firefighting & Prevention | 0 (0.0%) | 0 (0.0%) |
| Law Enforcement | 0 (0.0%) | 0 (0.0%) |
| Food Preparation & Serving | 0 (0.0%) | 13 (100.0%) |
| Cleaning & Maintenance | 0 (0.0%) | 0 (0.0%) |
| Personal Care & Service | 0 (0.0%) | 35 (100.0%) |
| Total (Category) | 37 (38.5%) | 59 (61.5%) |
| Total (Overall) | 187 (51.2%) | 178 (48.8%) |
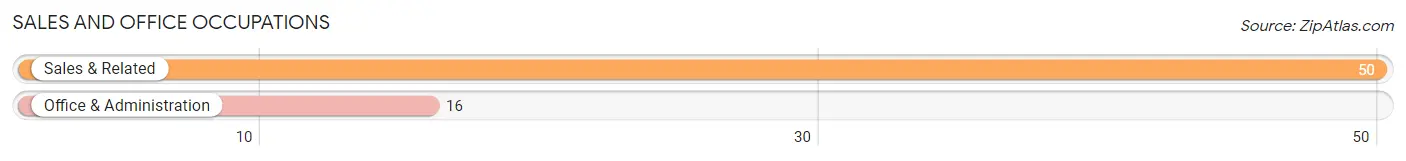
Sales and Office Occupations
The most common Sales and Office occupations in Ossineke are Sales & Related (50 | 13.7%), and Office & Administration (16 | 4.4%).
Sales and Office Occupations by Sex
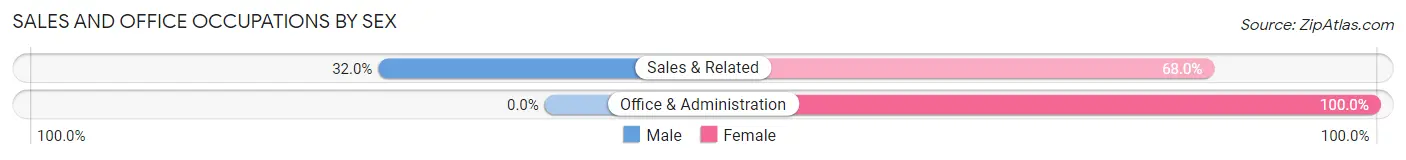
| Occupation | Male | Female |
| Sales & Related | 16 (32.0%) | 34 (68.0%) |
| Office & Administration | 0 (0.0%) | 16 (100.0%) |
| Total (Category) | 16 (24.2%) | 50 (75.8%) |
| Total (Overall) | 187 (51.2%) | 178 (48.8%) |
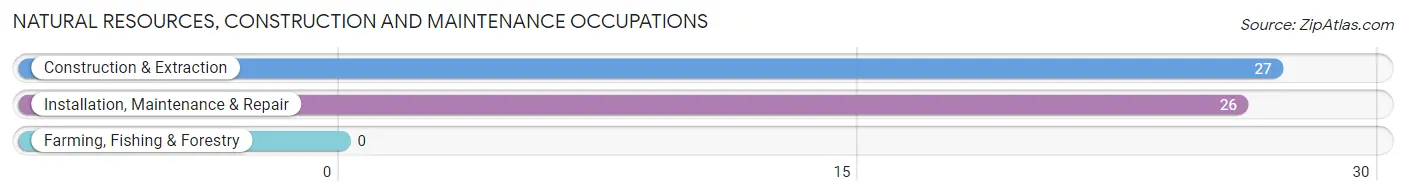
Natural Resources, Construction and Maintenance Occupations
The most common Natural Resources, Construction and Maintenance occupations in Ossineke are Construction & Extraction (27 | 7.4%), and Installation, Maintenance & Repair (26 | 7.1%).
Natural Resources, Construction and Maintenance Occupations by Sex
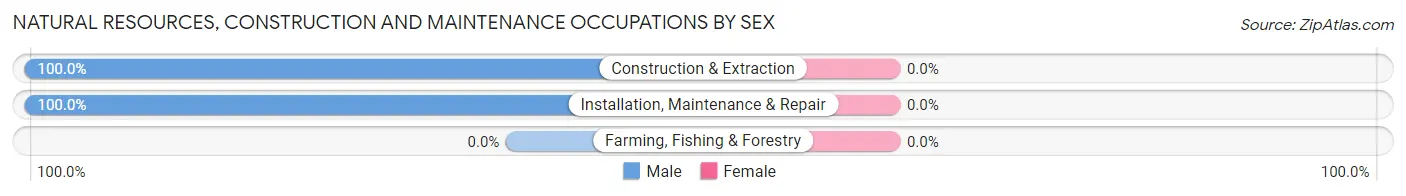
| Occupation | Male | Female |
| Farming, Fishing & Forestry | 0 (0.0%) | 0 (0.0%) |
| Construction & Extraction | 27 (100.0%) | 0 (0.0%) |
| Installation, Maintenance & Repair | 26 (100.0%) | 0 (0.0%) |
| Total (Category) | 53 (100.0%) | 0 (0.0%) |
| Total (Overall) | 187 (51.2%) | 178 (48.8%) |
Production, Transportation and Moving Occupations
The most common Production, Transportation and Moving occupations in Ossineke are Transportation (32 | 8.8%), Production (15 | 4.1%), and Material Moving (11 | 3.0%).
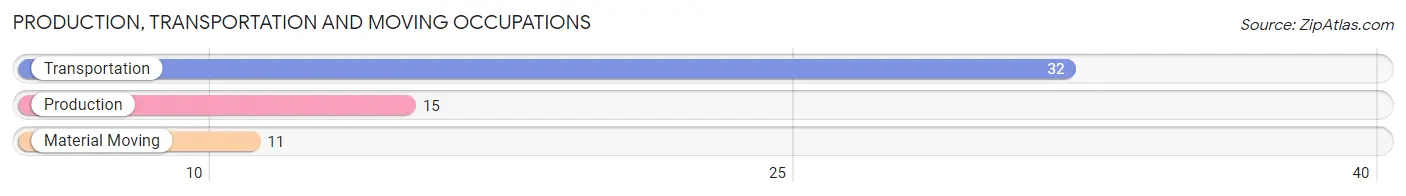
Production, Transportation and Moving Occupations by Sex
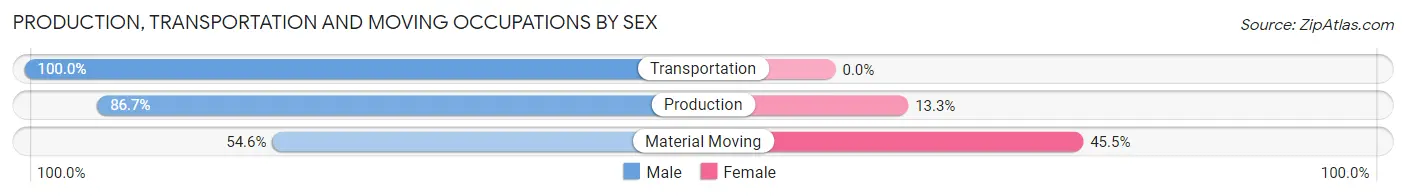
| Occupation | Male | Female |
| Production | 13 (86.7%) | 2 (13.3%) |
| Transportation | 32 (100.0%) | 0 (0.0%) |
| Material Moving | 6 (54.5%) | 5 (45.5%) |
| Total (Category) | 51 (87.9%) | 7 (12.1%) |
| Total (Overall) | 187 (51.2%) | 178 (48.8%) |
Employment Industries by Sex in Ossineke
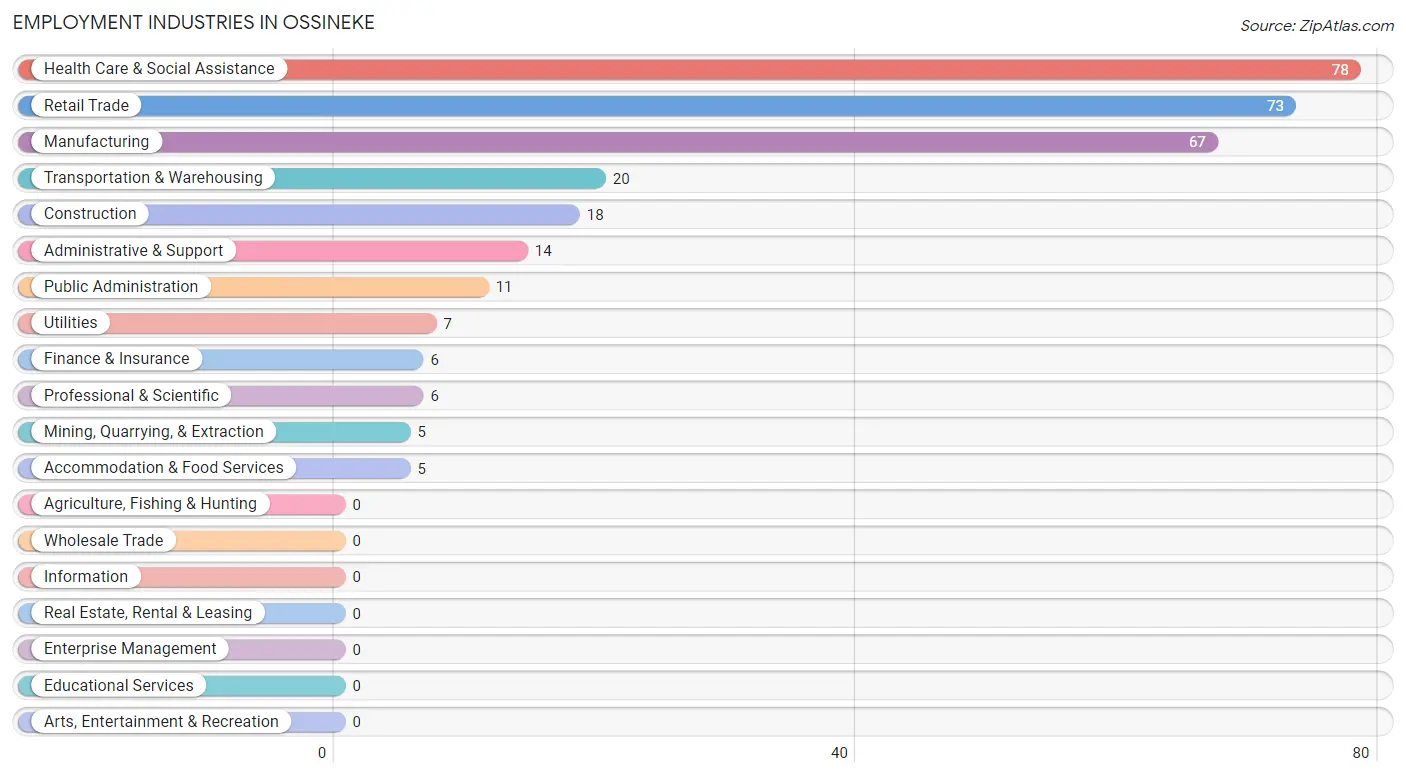
Employment Industries in Ossineke
The major employment industries in Ossineke include Health Care & Social Assistance (78 | 21.4%), Retail Trade (73 | 20.0%), Manufacturing (67 | 18.4%), Transportation & Warehousing (20 | 5.5%), and Construction (18 | 4.9%).
Employment Industries by Sex in Ossineke
The Ossineke industries that see more men than women are Mining, Quarrying, & Extraction (100.0%), Construction (100.0%), and Transportation & Warehousing (100.0%), whereas the industries that tend to have a higher number of women are Finance & Insurance (100.0%), Professional & Scientific (100.0%), and Accommodation & Food Services (100.0%).
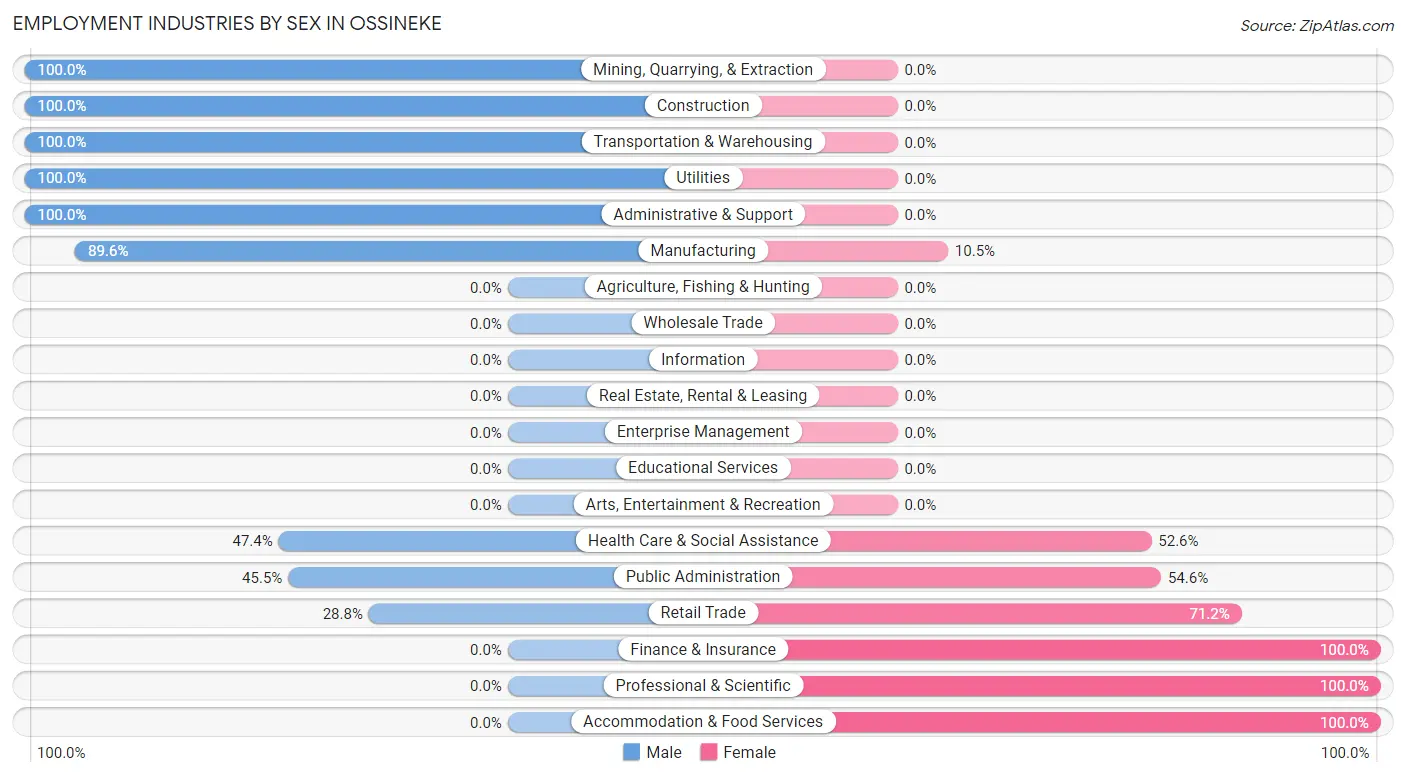
| Industry | Male | Female |
| Agriculture, Fishing & Hunting | 0 (0.0%) | 0 (0.0%) |
| Mining, Quarrying, & Extraction | 5 (100.0%) | 0 (0.0%) |
| Construction | 18 (100.0%) | 0 (0.0%) |
| Manufacturing | 60 (89.5%) | 7 (10.4%) |
| Wholesale Trade | 0 (0.0%) | 0 (0.0%) |
| Retail Trade | 21 (28.8%) | 52 (71.2%) |
| Transportation & Warehousing | 20 (100.0%) | 0 (0.0%) |
| Utilities | 7 (100.0%) | 0 (0.0%) |
| Information | 0 (0.0%) | 0 (0.0%) |
| Finance & Insurance | 0 (0.0%) | 6 (100.0%) |
| Real Estate, Rental & Leasing | 0 (0.0%) | 0 (0.0%) |
| Professional & Scientific | 0 (0.0%) | 6 (100.0%) |
| Enterprise Management | 0 (0.0%) | 0 (0.0%) |
| Administrative & Support | 14 (100.0%) | 0 (0.0%) |
| Educational Services | 0 (0.0%) | 0 (0.0%) |
| Health Care & Social Assistance | 37 (47.4%) | 41 (52.6%) |
| Arts, Entertainment & Recreation | 0 (0.0%) | 0 (0.0%) |
| Accommodation & Food Services | 0 (0.0%) | 5 (100.0%) |
| Public Administration | 5 (45.5%) | 6 (54.5%) |
| Total | 187 (51.2%) | 178 (48.8%) |
Education in Ossineke
School Enrollment in Ossineke
The most common levels of schooling among the 93 students in Ossineke are college / undergraduate (31 | 33.3%), kindergarten (27 | 29.0%), and high school (24 | 25.8%).
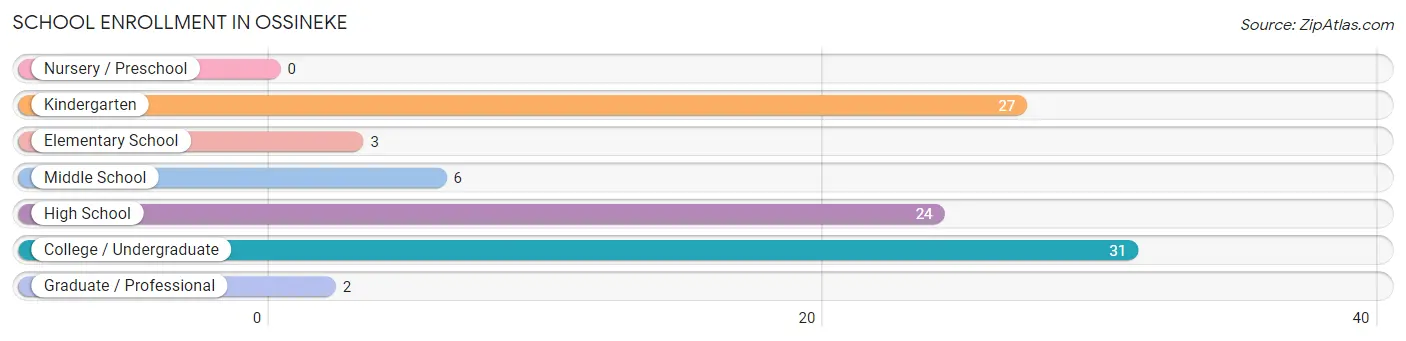
| School Level | # Students | % Students |
| Nursery / Preschool | 0 | 0.0% |
| Kindergarten | 27 | 29.0% |
| Elementary School | 3 | 3.2% |
| Middle School | 6 | 6.5% |
| High School | 24 | 25.8% |
| College / Undergraduate | 31 | 33.3% |
| Graduate / Professional | 2 | 2.1% |
| Total | 93 | 100.0% |
School Enrollment by Age by Funding Source in Ossineke
Out of a total of 93 students who are enrolled in schools in Ossineke, 30 (32.3%) attend a private institution, while the remaining 63 (67.7%) are enrolled in public schools. The age group of 25 to 34 year olds has the highest likelihood of being enrolled in private schools, with 21 (100.0% in the age bracket) enrolled. Conversely, the age group of 5 to 9 year old has the lowest likelihood of being enrolled in a private school, with 30 (100.0% in the age bracket) attending a public institution.
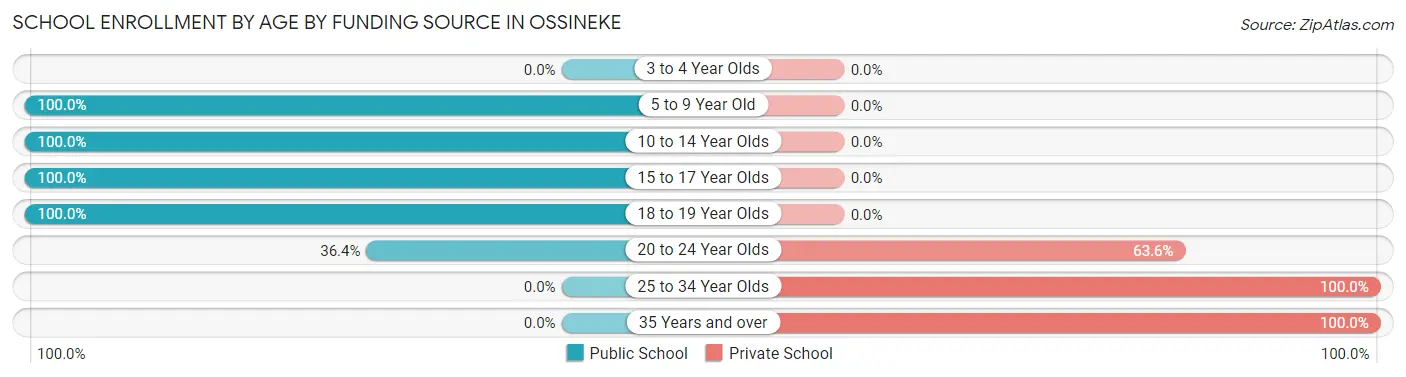
| Age Bracket | Public School | Private School |
| 3 to 4 Year Olds | 0 (0.0%) | 0 (0.0%) |
| 5 to 9 Year Old | 30 (100.0%) | 0 (0.0%) |
| 10 to 14 Year Olds | 11 (100.0%) | 0 (0.0%) |
| 15 to 17 Year Olds | 12 (100.0%) | 0 (0.0%) |
| 18 to 19 Year Olds | 6 (100.0%) | 0 (0.0%) |
| 20 to 24 Year Olds | 4 (36.4%) | 7 (63.6%) |
| 25 to 34 Year Olds | 0 (0.0%) | 21 (100.0%) |
| 35 Years and over | 0 (0.0%) | 2 (100.0%) |
| Total | 63 (67.7%) | 30 (32.3%) |
Educational Attainment by Field of Study in Ossineke
Education (28 | 27.7%), business (24 | 23.8%), science & technology (22 | 21.8%), computers & mathematics (14 | 13.9%), and literature & languages (6 | 5.9%) are the most common fields of study among 101 individuals in Ossineke who have obtained a bachelor's degree or higher.
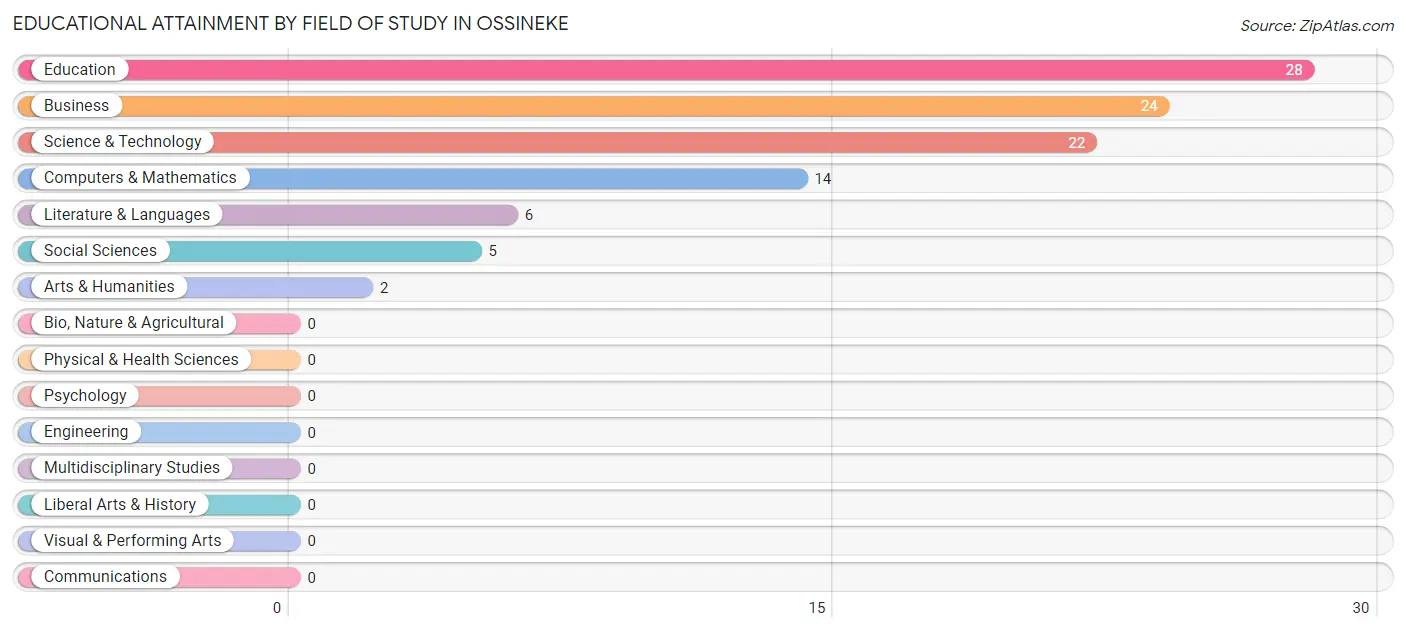
| Field of Study | # Graduates | % Graduates |
| Computers & Mathematics | 14 | 13.9% |
| Bio, Nature & Agricultural | 0 | 0.0% |
| Physical & Health Sciences | 0 | 0.0% |
| Psychology | 0 | 0.0% |
| Social Sciences | 5 | 5.0% |
| Engineering | 0 | 0.0% |
| Multidisciplinary Studies | 0 | 0.0% |
| Science & Technology | 22 | 21.8% |
| Business | 24 | 23.8% |
| Education | 28 | 27.7% |
| Literature & Languages | 6 | 5.9% |
| Liberal Arts & History | 0 | 0.0% |
| Visual & Performing Arts | 0 | 0.0% |
| Communications | 0 | 0.0% |
| Arts & Humanities | 2 | 2.0% |
| Total | 101 | 100.0% |
Transportation & Commute in Ossineke
Vehicle Availability by Sex in Ossineke
The most prevalent vehicle ownership categories in Ossineke are males with 2 vehicles (71, accounting for 38.0%) and females with 2 vehicles (81, making up 39.9%).
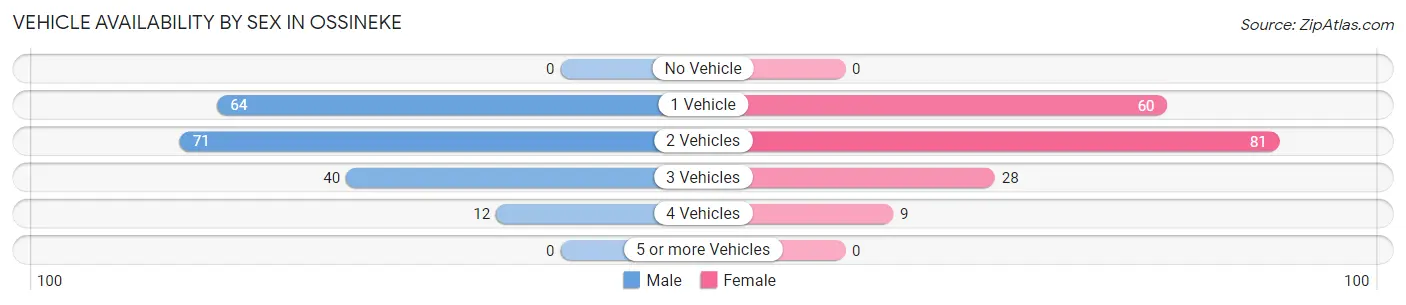
| Vehicles Available | Male | Female |
| No Vehicle | 0 (0.0%) | 0 (0.0%) |
| 1 Vehicle | 64 (34.2%) | 60 (33.7%) |
| 2 Vehicles | 71 (38.0%) | 81 (45.5%) |
| 3 Vehicles | 40 (21.4%) | 28 (15.7%) |
| 4 Vehicles | 12 (6.4%) | 9 (5.1%) |
| 5 or more Vehicles | 0 (0.0%) | 0 (0.0%) |
| Total | 187 (100.0%) | 178 (100.0%) |
Commute Time in Ossineke
The most frequently occuring commute durations in Ossineke are 30 to 34 minutes (94 commuters, 27.9%), 20 to 24 minutes (77 commuters, 22.9%), and 15 to 19 minutes (52 commuters, 15.4%).
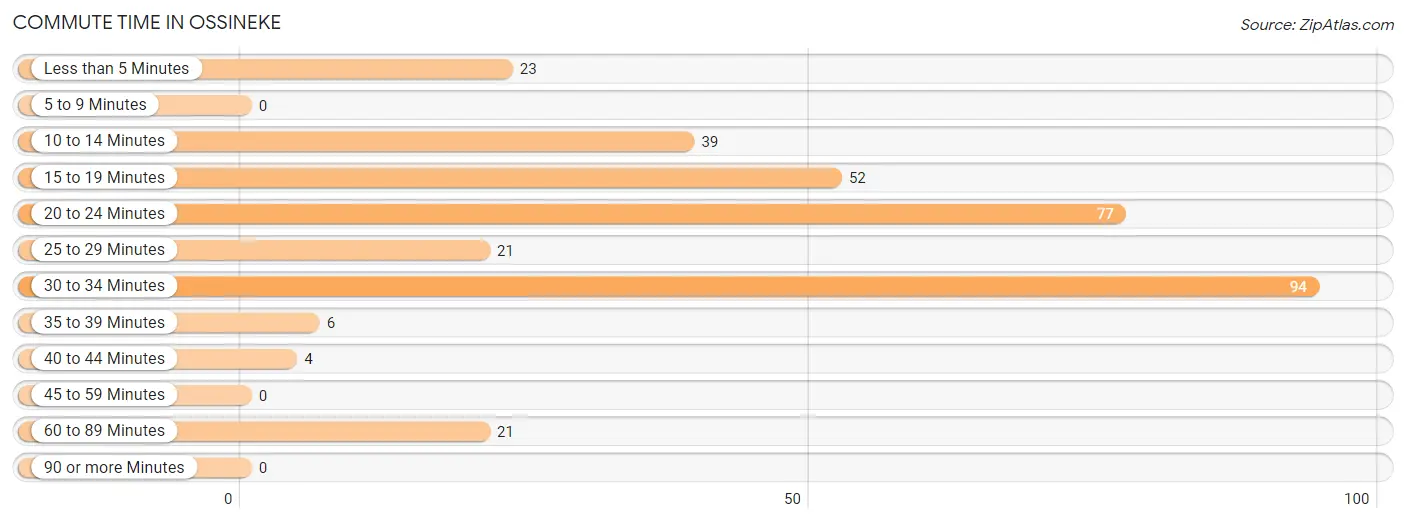
| Commute Time | # Commuters | % Commuters |
| Less than 5 Minutes | 23 | 6.8% |
| 5 to 9 Minutes | 0 | 0.0% |
| 10 to 14 Minutes | 39 | 11.6% |
| 15 to 19 Minutes | 52 | 15.4% |
| 20 to 24 Minutes | 77 | 22.9% |
| 25 to 29 Minutes | 21 | 6.2% |
| 30 to 34 Minutes | 94 | 27.9% |
| 35 to 39 Minutes | 6 | 1.8% |
| 40 to 44 Minutes | 4 | 1.2% |
| 45 to 59 Minutes | 0 | 0.0% |
| 60 to 89 Minutes | 21 | 6.2% |
| 90 or more Minutes | 0 | 0.0% |
Commute Time by Sex in Ossineke
The most common commute times in Ossineke are 30 to 34 minutes (66 commuters, 39.5%) for males and 20 to 24 minutes (47 commuters, 27.7%) for females.
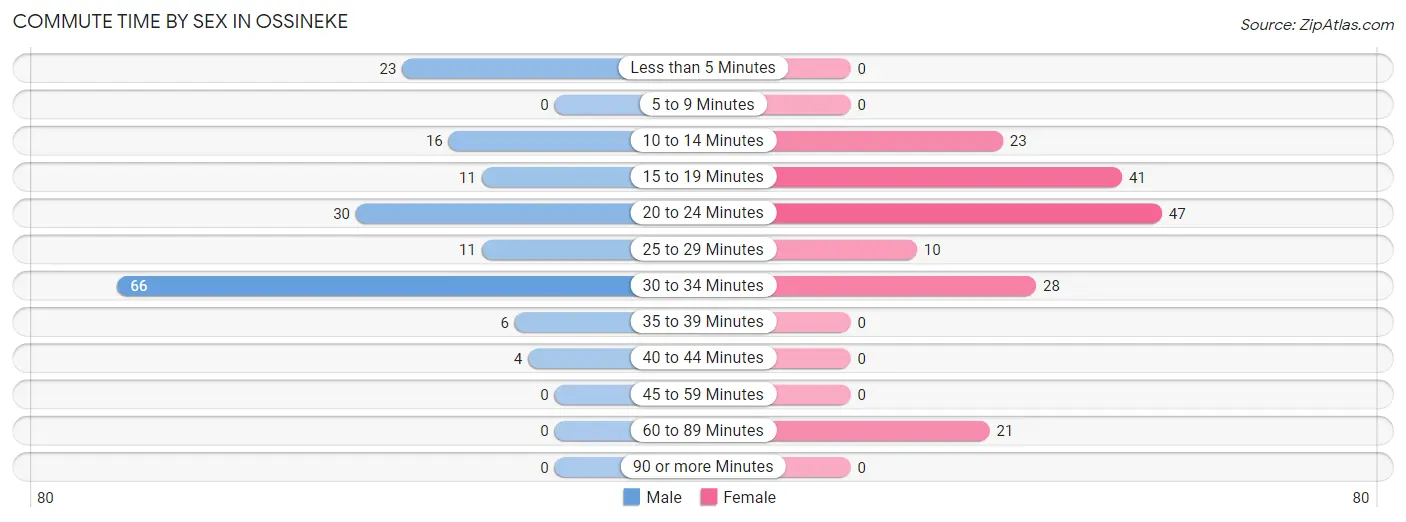
| Commute Time | Male | Female |
| Less than 5 Minutes | 23 (13.8%) | 0 (0.0%) |
| 5 to 9 Minutes | 0 (0.0%) | 0 (0.0%) |
| 10 to 14 Minutes | 16 (9.6%) | 23 (13.5%) |
| 15 to 19 Minutes | 11 (6.6%) | 41 (24.1%) |
| 20 to 24 Minutes | 30 (18.0%) | 47 (27.7%) |
| 25 to 29 Minutes | 11 (6.6%) | 10 (5.9%) |
| 30 to 34 Minutes | 66 (39.5%) | 28 (16.5%) |
| 35 to 39 Minutes | 6 (3.6%) | 0 (0.0%) |
| 40 to 44 Minutes | 4 (2.4%) | 0 (0.0%) |
| 45 to 59 Minutes | 0 (0.0%) | 0 (0.0%) |
| 60 to 89 Minutes | 0 (0.0%) | 21 (12.3%) |
| 90 or more Minutes | 0 (0.0%) | 0 (0.0%) |
Time of Departure to Work by Sex in Ossineke
The most frequent times of departure to work in Ossineke are 9:00 AM to 9:59 AM (61, 36.5%) for males and 7:00 AM to 7:29 AM (45, 26.5%) for females.
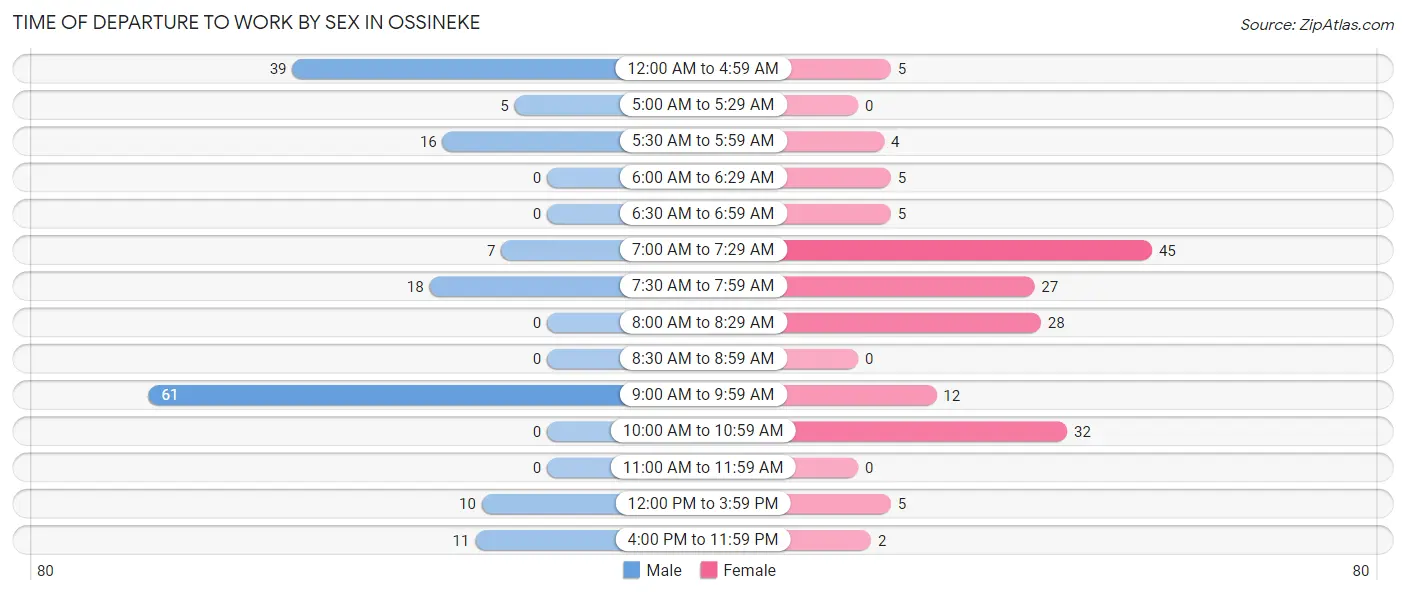
| Time of Departure | Male | Female |
| 12:00 AM to 4:59 AM | 39 (23.4%) | 5 (2.9%) |
| 5:00 AM to 5:29 AM | 5 (3.0%) | 0 (0.0%) |
| 5:30 AM to 5:59 AM | 16 (9.6%) | 4 (2.4%) |
| 6:00 AM to 6:29 AM | 0 (0.0%) | 5 (2.9%) |
| 6:30 AM to 6:59 AM | 0 (0.0%) | 5 (2.9%) |
| 7:00 AM to 7:29 AM | 7 (4.2%) | 45 (26.5%) |
| 7:30 AM to 7:59 AM | 18 (10.8%) | 27 (15.9%) |
| 8:00 AM to 8:29 AM | 0 (0.0%) | 28 (16.5%) |
| 8:30 AM to 8:59 AM | 0 (0.0%) | 0 (0.0%) |
| 9:00 AM to 9:59 AM | 61 (36.5%) | 12 (7.1%) |
| 10:00 AM to 10:59 AM | 0 (0.0%) | 32 (18.8%) |
| 11:00 AM to 11:59 AM | 0 (0.0%) | 0 (0.0%) |
| 12:00 PM to 3:59 PM | 10 (6.0%) | 5 (2.9%) |
| 4:00 PM to 11:59 PM | 11 (6.6%) | 2 (1.2%) |
| Total | 167 (100.0%) | 170 (100.0%) |
Housing Occupancy in Ossineke
Occupancy by Ownership in Ossineke
Of the total 392 dwellings in Ossineke, owner-occupied units account for 319 (81.4%), while renter-occupied units make up 73 (18.6%).
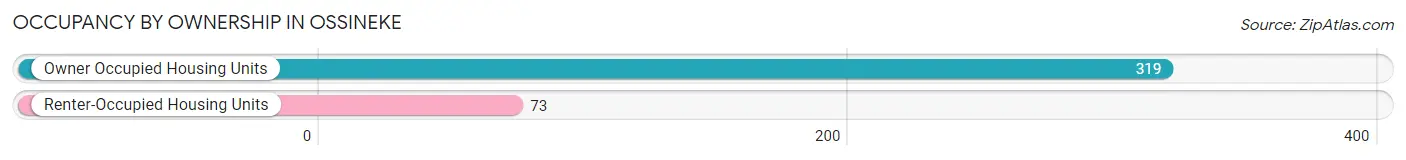
| Occupancy | # Housing Units | % Housing Units |
| Owner Occupied Housing Units | 319 | 81.4% |
| Renter-Occupied Housing Units | 73 | 18.6% |
| Total Occupied Housing Units | 392 | 100.0% |
Occupancy by Household Size in Ossineke
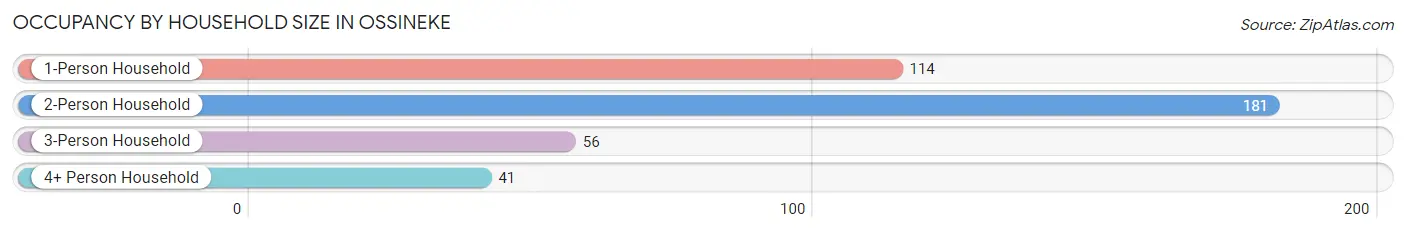
| Household Size | # Housing Units | % Housing Units |
| 1-Person Household | 114 | 29.1% |
| 2-Person Household | 181 | 46.2% |
| 3-Person Household | 56 | 14.3% |
| 4+ Person Household | 41 | 10.5% |
| Total Housing Units | 392 | 100.0% |
Occupancy by Ownership by Household Size in Ossineke
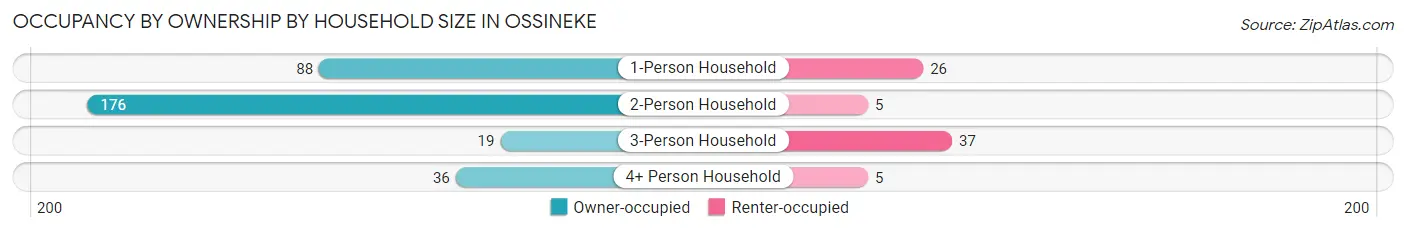
| Household Size | Owner-occupied | Renter-occupied |
| 1-Person Household | 88 (77.2%) | 26 (22.8%) |
| 2-Person Household | 176 (97.2%) | 5 (2.8%) |
| 3-Person Household | 19 (33.9%) | 37 (66.1%) |
| 4+ Person Household | 36 (87.8%) | 5 (12.2%) |
| Total Housing Units | 319 (81.4%) | 73 (18.6%) |
Occupancy by Educational Attainment in Ossineke
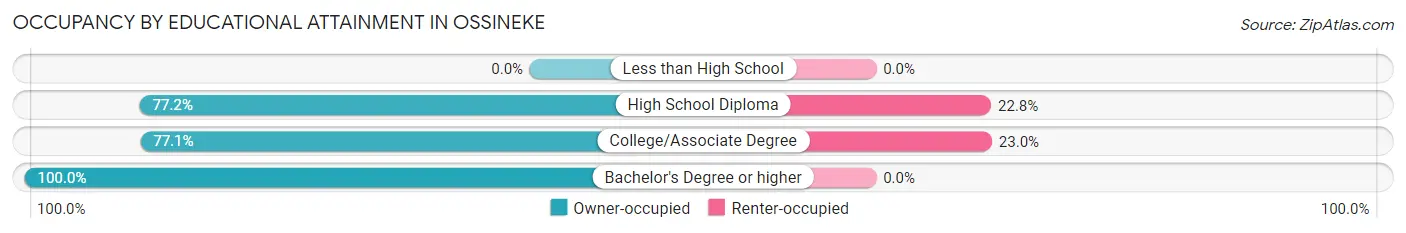
| Household Size | Owner-occupied | Renter-occupied |
| Less than High School | 0 (0.0%) | 0 (0.0%) |
| High School Diploma | 105 (77.2%) | 31 (22.8%) |
| College/Associate Degree | 141 (77.0%) | 42 (23.0%) |
| Bachelor's Degree or higher | 73 (100.0%) | 0 (0.0%) |
Occupancy by Age of Householder in Ossineke
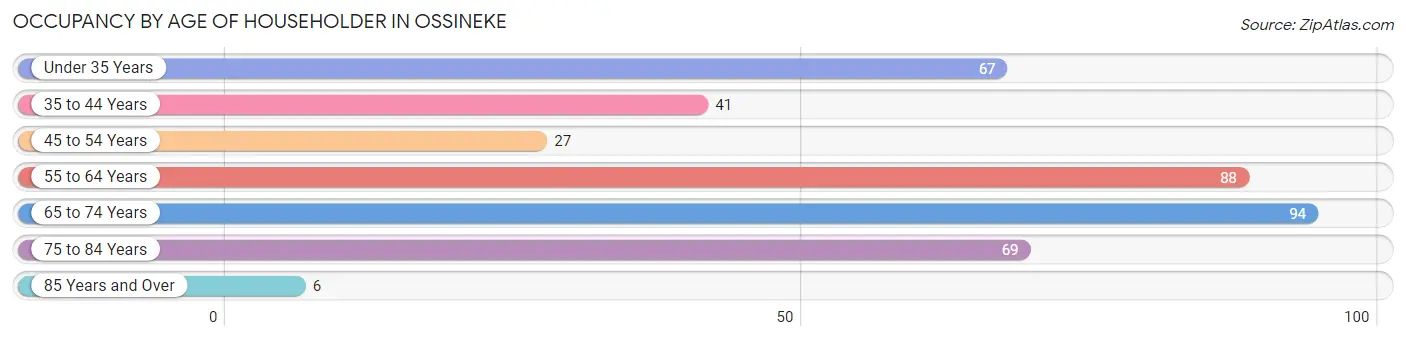
| Age Bracket | # Households | % Households |
| Under 35 Years | 67 | 17.1% |
| 35 to 44 Years | 41 | 10.5% |
| 45 to 54 Years | 27 | 6.9% |
| 55 to 64 Years | 88 | 22.5% |
| 65 to 74 Years | 94 | 24.0% |
| 75 to 84 Years | 69 | 17.6% |
| 85 Years and Over | 6 | 1.5% |
| Total | 392 | 100.0% |
Housing Finances in Ossineke
Median Income by Occupancy in Ossineke
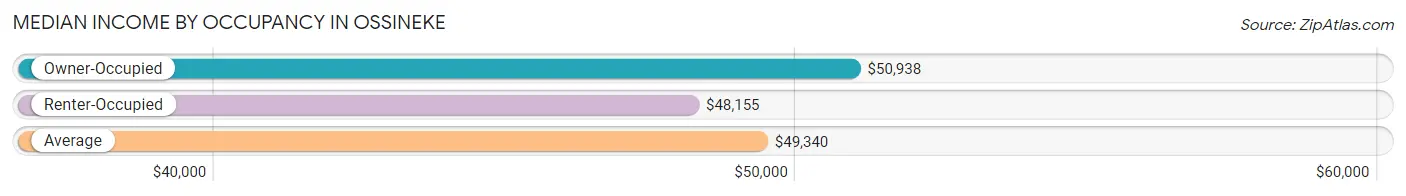
| Occupancy Type | # Households | Median Income |
| Owner-Occupied | 319 (81.4%) | $50,938 |
| Renter-Occupied | 73 (18.6%) | $48,155 |
| Average | 392 (100.0%) | $49,340 |
Occupancy by Householder Income Bracket in Ossineke
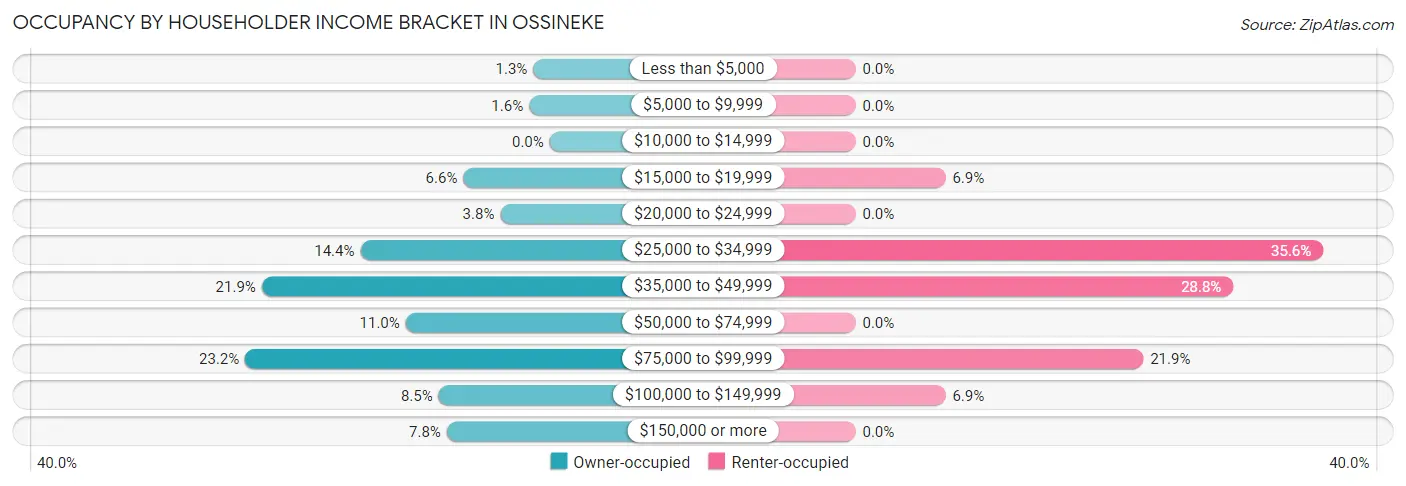
| Income Bracket | Owner-occupied | Renter-occupied |
| Less than $5,000 | 4 (1.3%) | 0 (0.0%) |
| $5,000 to $9,999 | 5 (1.6%) | 0 (0.0%) |
| $10,000 to $14,999 | 0 (0.0%) | 0 (0.0%) |
| $15,000 to $19,999 | 21 (6.6%) | 5 (6.9%) |
| $20,000 to $24,999 | 12 (3.8%) | 0 (0.0%) |
| $25,000 to $34,999 | 46 (14.4%) | 26 (35.6%) |
| $35,000 to $49,999 | 70 (21.9%) | 21 (28.8%) |
| $50,000 to $74,999 | 35 (11.0%) | 0 (0.0%) |
| $75,000 to $99,999 | 74 (23.2%) | 16 (21.9%) |
| $100,000 to $149,999 | 27 (8.5%) | 5 (6.9%) |
| $150,000 or more | 25 (7.8%) | 0 (0.0%) |
| Total | 319 (100.0%) | 73 (100.0%) |
Monthly Housing Cost Tiers in Ossineke
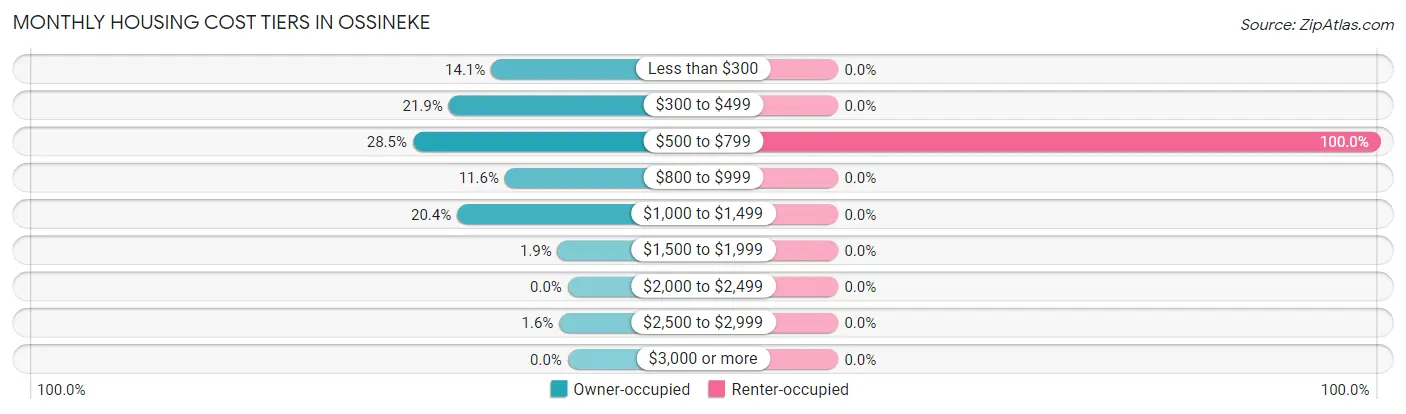
| Monthly Cost | Owner-occupied | Renter-occupied |
| Less than $300 | 45 (14.1%) | 0 (0.0%) |
| $300 to $499 | 70 (21.9%) | 0 (0.0%) |
| $500 to $799 | 91 (28.5%) | 73 (100.0%) |
| $800 to $999 | 37 (11.6%) | 0 (0.0%) |
| $1,000 to $1,499 | 65 (20.4%) | 0 (0.0%) |
| $1,500 to $1,999 | 6 (1.9%) | 0 (0.0%) |
| $2,000 to $2,499 | 0 (0.0%) | 0 (0.0%) |
| $2,500 to $2,999 | 5 (1.6%) | 0 (0.0%) |
| $3,000 or more | 0 (0.0%) | 0 (0.0%) |
| Total | 319 (100.0%) | 73 (100.0%) |
Physical Housing Characteristics in Ossineke
Housing Structures in Ossineke
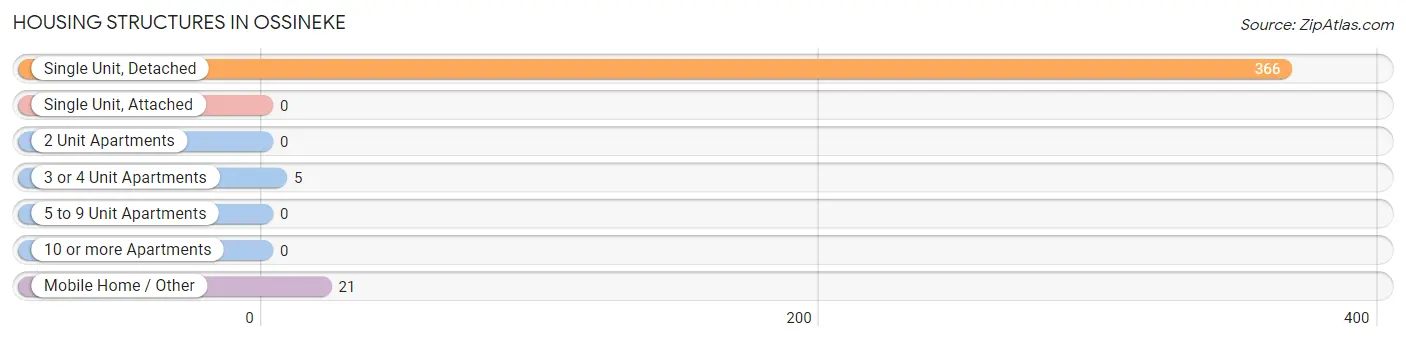
| Structure Type | # Housing Units | % Housing Units |
| Single Unit, Detached | 366 | 93.4% |
| Single Unit, Attached | 0 | 0.0% |
| 2 Unit Apartments | 0 | 0.0% |
| 3 or 4 Unit Apartments | 5 | 1.3% |
| 5 to 9 Unit Apartments | 0 | 0.0% |
| 10 or more Apartments | 0 | 0.0% |
| Mobile Home / Other | 21 | 5.4% |
| Total | 392 | 100.0% |
Housing Structures by Occupancy in Ossineke
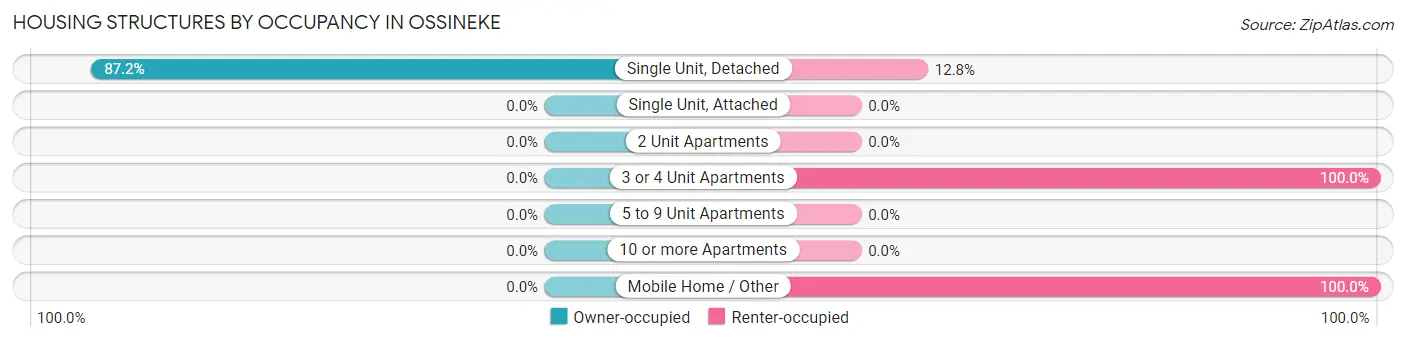
| Structure Type | Owner-occupied | Renter-occupied |
| Single Unit, Detached | 319 (87.2%) | 47 (12.8%) |
| Single Unit, Attached | 0 (0.0%) | 0 (0.0%) |
| 2 Unit Apartments | 0 (0.0%) | 0 (0.0%) |
| 3 or 4 Unit Apartments | 0 (0.0%) | 5 (100.0%) |
| 5 to 9 Unit Apartments | 0 (0.0%) | 0 (0.0%) |
| 10 or more Apartments | 0 (0.0%) | 0 (0.0%) |
| Mobile Home / Other | 0 (0.0%) | 21 (100.0%) |
| Total | 319 (81.4%) | 73 (18.6%) |
Housing Structures by Number of Rooms in Ossineke
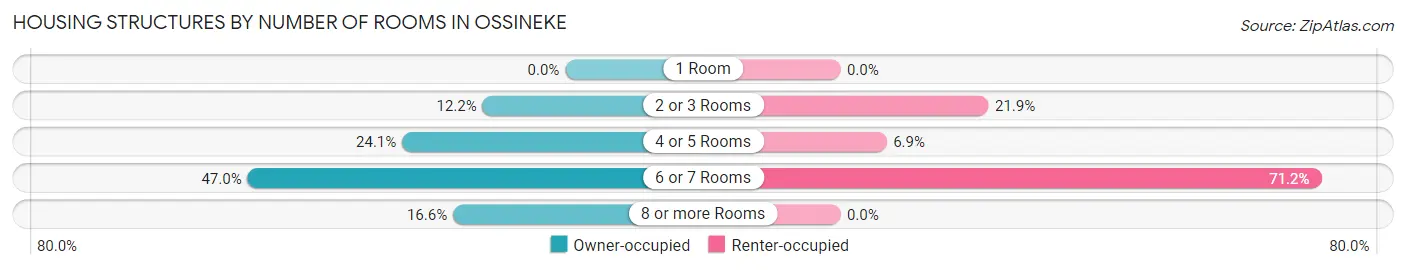
| Number of Rooms | Owner-occupied | Renter-occupied |
| 1 Room | 0 (0.0%) | 0 (0.0%) |
| 2 or 3 Rooms | 39 (12.2%) | 16 (21.9%) |
| 4 or 5 Rooms | 77 (24.1%) | 5 (6.9%) |
| 6 or 7 Rooms | 150 (47.0%) | 52 (71.2%) |
| 8 or more Rooms | 53 (16.6%) | 0 (0.0%) |
| Total | 319 (100.0%) | 73 (100.0%) |
Housing Structure by Heating Type in Ossineke
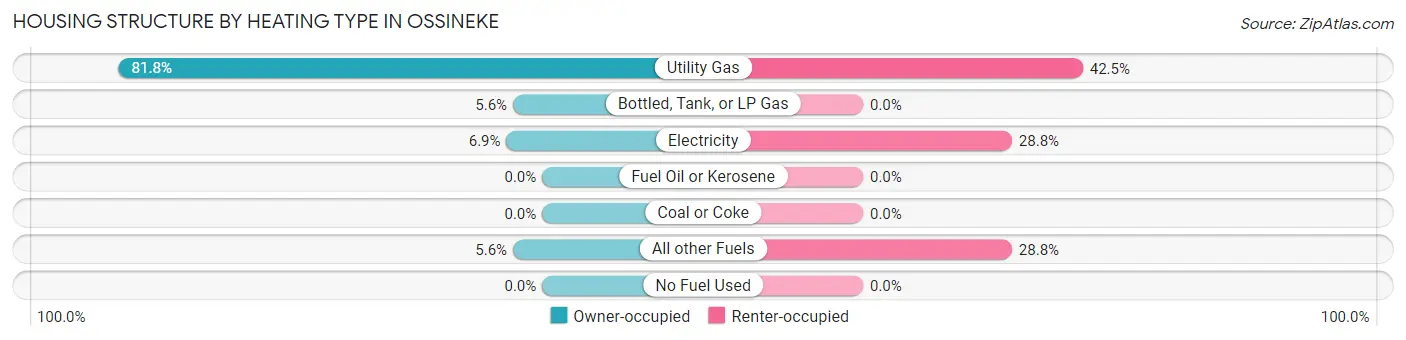
| Heating Type | Owner-occupied | Renter-occupied |
| Utility Gas | 261 (81.8%) | 31 (42.5%) |
| Bottled, Tank, or LP Gas | 18 (5.6%) | 0 (0.0%) |
| Electricity | 22 (6.9%) | 21 (28.8%) |
| Fuel Oil or Kerosene | 0 (0.0%) | 0 (0.0%) |
| Coal or Coke | 0 (0.0%) | 0 (0.0%) |
| All other Fuels | 18 (5.6%) | 21 (28.8%) |
| No Fuel Used | 0 (0.0%) | 0 (0.0%) |
| Total | 319 (100.0%) | 73 (100.0%) |
Household Vehicle Usage in Ossineke
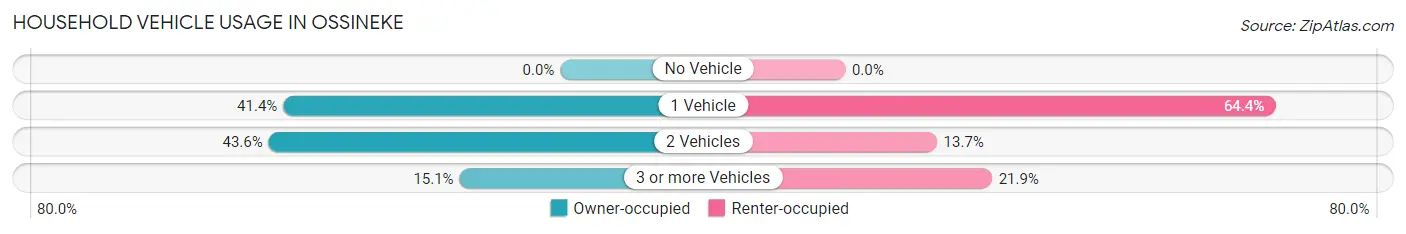
| Vehicles per Household | Owner-occupied | Renter-occupied |
| No Vehicle | 0 (0.0%) | 0 (0.0%) |
| 1 Vehicle | 132 (41.4%) | 47 (64.4%) |
| 2 Vehicles | 139 (43.6%) | 10 (13.7%) |
| 3 or more Vehicles | 48 (15.0%) | 16 (21.9%) |
| Total | 319 (100.0%) | 73 (100.0%) |
Real Estate & Mortgages in Ossineke
Real Estate and Mortgage Overview in Ossineke
| Characteristic | Without Mortgage | With Mortgage |
| Housing Units | 158 | 161 |
| Median Property Value | $116,100 | $146,500 |
| Median Household Income | $38,594 | $20 |
| Monthly Housing Costs | $374 | $0 |
| Real Estate Taxes | $1,231 | $11 |
Property Value by Mortgage Status in Ossineke
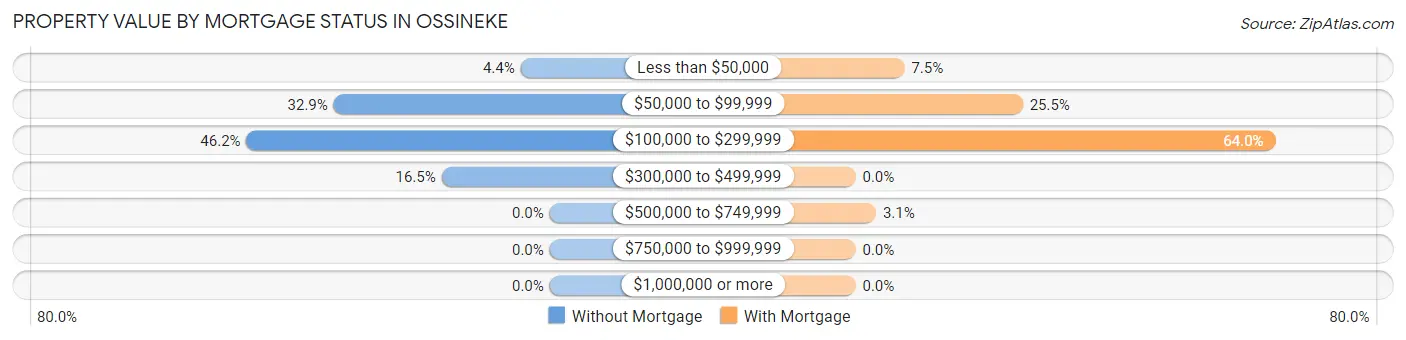
| Property Value | Without Mortgage | With Mortgage |
| Less than $50,000 | 7 (4.4%) | 12 (7.4%) |
| $50,000 to $99,999 | 52 (32.9%) | 41 (25.5%) |
| $100,000 to $299,999 | 73 (46.2%) | 103 (64.0%) |
| $300,000 to $499,999 | 26 (16.5%) | 0 (0.0%) |
| $500,000 to $749,999 | 0 (0.0%) | 5 (3.1%) |
| $750,000 to $999,999 | 0 (0.0%) | 0 (0.0%) |
| $1,000,000 or more | 0 (0.0%) | 0 (0.0%) |
| Total | 158 (100.0%) | 161 (100.0%) |
Household Income by Mortgage Status in Ossineke
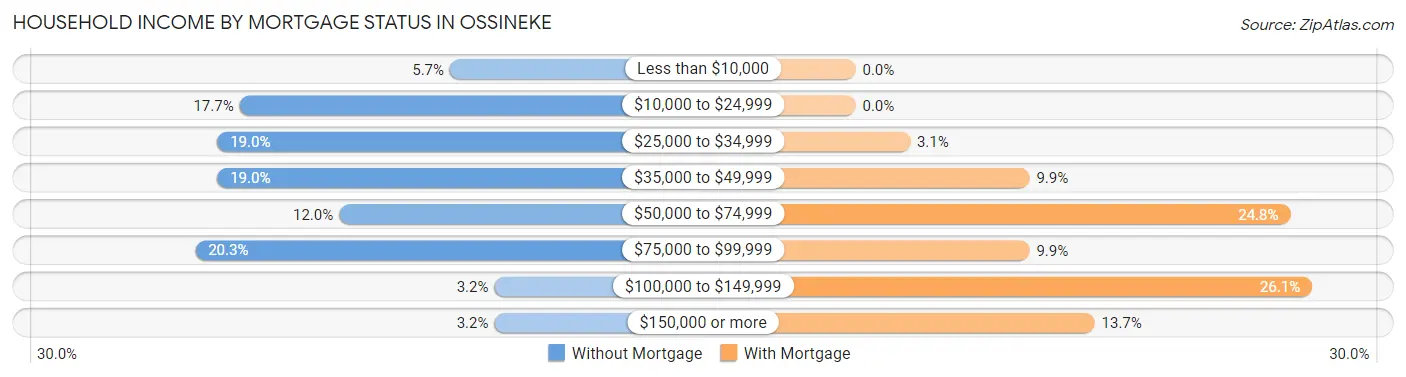
| Household Income | Without Mortgage | With Mortgage |
| Less than $10,000 | 9 (5.7%) | 0 (0.0%) |
| $10,000 to $24,999 | 28 (17.7%) | 0 (0.0%) |
| $25,000 to $34,999 | 30 (19.0%) | 5 (3.1%) |
| $35,000 to $49,999 | 30 (19.0%) | 16 (9.9%) |
| $50,000 to $74,999 | 19 (12.0%) | 40 (24.8%) |
| $75,000 to $99,999 | 32 (20.3%) | 16 (9.9%) |
| $100,000 to $149,999 | 5 (3.2%) | 42 (26.1%) |
| $150,000 or more | 5 (3.2%) | 22 (13.7%) |
| Total | 158 (100.0%) | 161 (100.0%) |
Property Value to Household Income Ratio in Ossineke
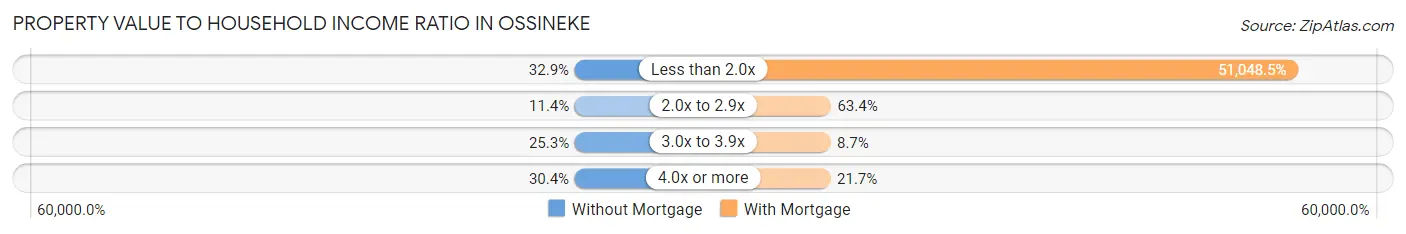
| Value-to-Income Ratio | Without Mortgage | With Mortgage |
| Less than 2.0x | 52 (32.9%) | 82,188 (51,048.5%) |
| 2.0x to 2.9x | 18 (11.4%) | 102 (63.3%) |
| 3.0x to 3.9x | 40 (25.3%) | 14 (8.7%) |
| 4.0x or more | 48 (30.4%) | 35 (21.7%) |
| Total | 158 (100.0%) | 161 (100.0%) |
Real Estate Taxes by Mortgage Status in Ossineke
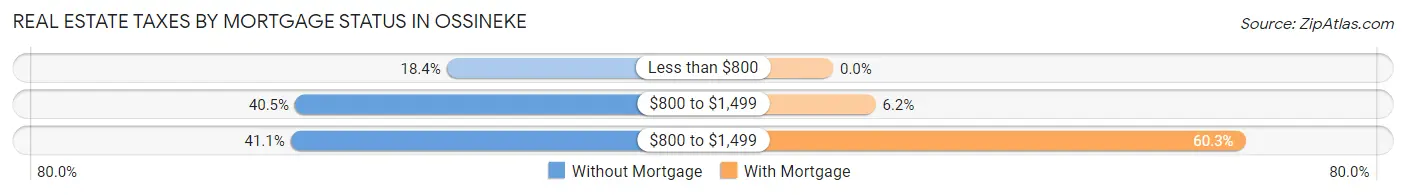
| Property Taxes | Without Mortgage | With Mortgage |
| Less than $800 | 29 (18.3%) | 0 (0.0%) |
| $800 to $1,499 | 64 (40.5%) | 10 (6.2%) |
| $800 to $1,499 | 65 (41.1%) | 97 (60.3%) |
| Total | 158 (100.0%) | 161 (100.0%) |
Health & Disability in Ossineke
Health Insurance Coverage by Age in Ossineke
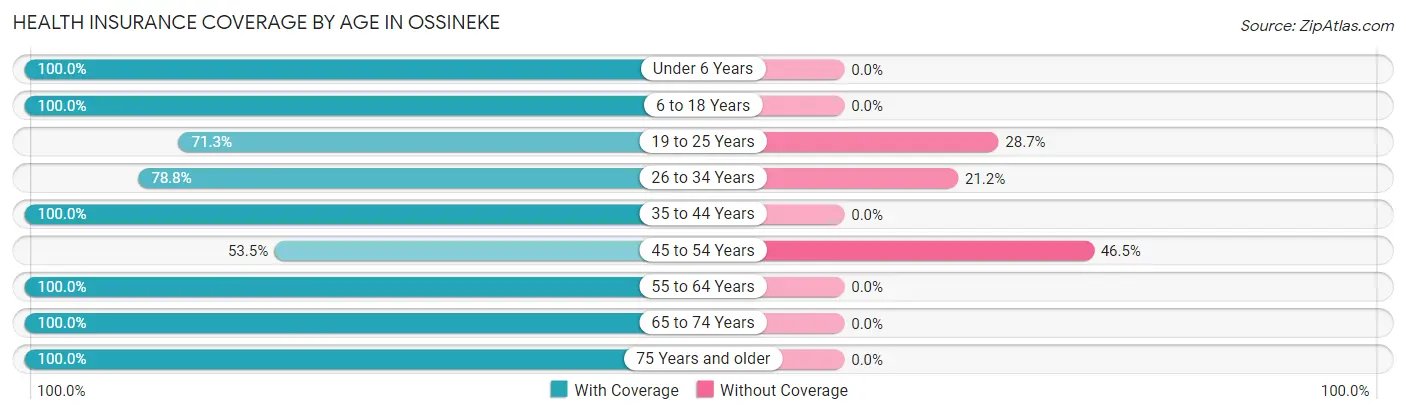
| Age Bracket | With Coverage | Without Coverage |
| Under 6 Years | 21 (100.0%) | 0 (0.0%) |
| 6 to 18 Years | 59 (100.0%) | 0 (0.0%) |
| 19 to 25 Years | 62 (71.3%) | 25 (28.7%) |
| 26 to 34 Years | 78 (78.8%) | 21 (21.2%) |
| 35 to 44 Years | 90 (100.0%) | 0 (0.0%) |
| 45 to 54 Years | 23 (53.5%) | 20 (46.5%) |
| 55 to 64 Years | 226 (100.0%) | 0 (0.0%) |
| 65 to 74 Years | 126 (100.0%) | 0 (0.0%) |
| 75 Years and older | 101 (100.0%) | 0 (0.0%) |
| Total | 786 (92.2%) | 66 (7.7%) |
Health Insurance Coverage by Citizenship Status in Ossineke
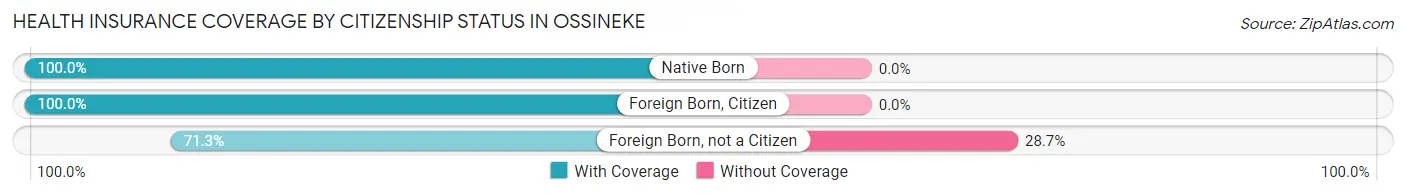
| Citizenship Status | With Coverage | Without Coverage |
| Native Born | 21 (100.0%) | 0 (0.0%) |
| Foreign Born, Citizen | 59 (100.0%) | 0 (0.0%) |
| Foreign Born, not a Citizen | 62 (71.3%) | 25 (28.7%) |
Health Insurance Coverage by Household Income in Ossineke
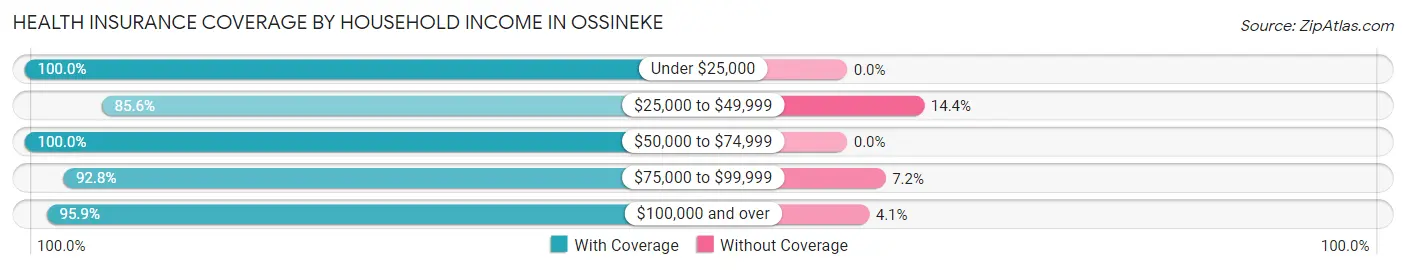
| Household Income | With Coverage | Without Coverage |
| Under $25,000 | 89 (100.0%) | 0 (0.0%) |
| $25,000 to $49,999 | 243 (85.6%) | 41 (14.4%) |
| $50,000 to $74,999 | 59 (100.0%) | 0 (0.0%) |
| $75,000 to $99,999 | 232 (92.8%) | 18 (7.2%) |
| $100,000 and over | 163 (95.9%) | 7 (4.1%) |
Public vs Private Health Insurance Coverage by Age in Ossineke
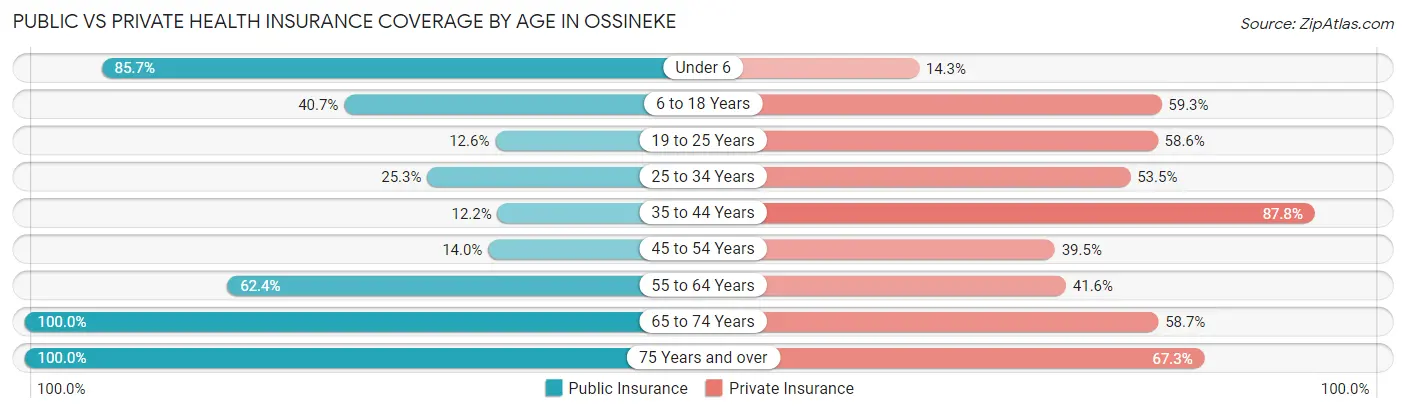
| Age Bracket | Public Insurance | Private Insurance |
| Under 6 | 18 (85.7%) | 3 (14.3%) |
| 6 to 18 Years | 24 (40.7%) | 35 (59.3%) |
| 19 to 25 Years | 11 (12.6%) | 51 (58.6%) |
| 25 to 34 Years | 25 (25.3%) | 53 (53.5%) |
| 35 to 44 Years | 11 (12.2%) | 79 (87.8%) |
| 45 to 54 Years | 6 (14.0%) | 17 (39.5%) |
| 55 to 64 Years | 141 (62.4%) | 94 (41.6%) |
| 65 to 74 Years | 126 (100.0%) | 74 (58.7%) |
| 75 Years and over | 101 (100.0%) | 68 (67.3%) |
| Total | 463 (54.3%) | 474 (55.6%) |
Disability Status by Sex by Age in Ossineke
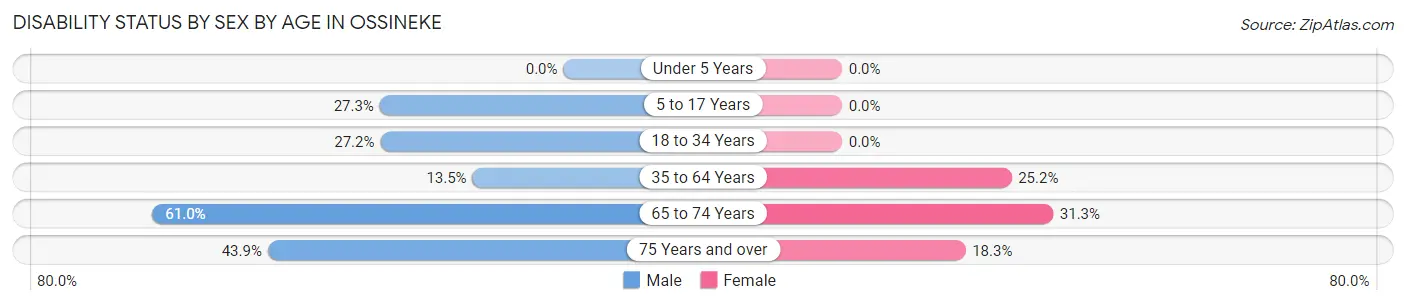
| Age Bracket | Male | Female |
| Under 5 Years | 0 (0.0%) | 0 (0.0%) |
| 5 to 17 Years | 3 (27.3%) | 0 (0.0%) |
| 18 to 34 Years | 28 (27.2%) | 0 (0.0%) |
| 35 to 64 Years | 27 (13.5%) | 40 (25.2%) |
| 65 to 74 Years | 36 (61.0%) | 21 (31.3%) |
| 75 Years and over | 18 (43.9%) | 11 (18.3%) |
Disability Class by Sex by Age in Ossineke
Disability Class: Hearing Difficulty
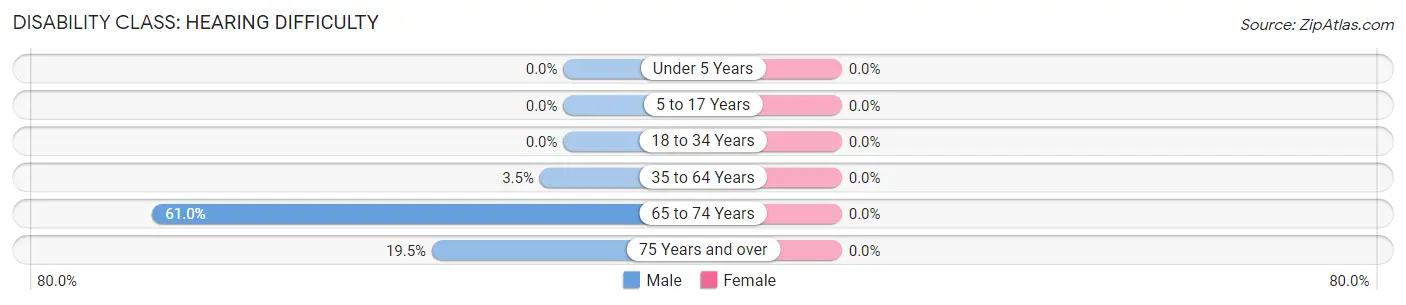
| Age Bracket | Male | Female |
| Under 5 Years | 0 (0.0%) | 0 (0.0%) |
| 5 to 17 Years | 0 (0.0%) | 0 (0.0%) |
| 18 to 34 Years | 0 (0.0%) | 0 (0.0%) |
| 35 to 64 Years | 7 (3.5%) | 0 (0.0%) |
| 65 to 74 Years | 36 (61.0%) | 0 (0.0%) |
| 75 Years and over | 8 (19.5%) | 0 (0.0%) |
Disability Class: Vision Difficulty
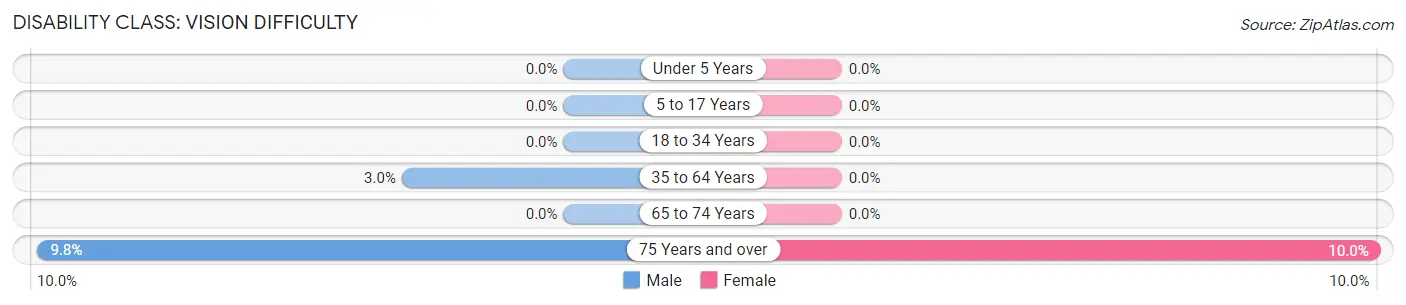
| Age Bracket | Male | Female |
| Under 5 Years | 0 (0.0%) | 0 (0.0%) |
| 5 to 17 Years | 0 (0.0%) | 0 (0.0%) |
| 18 to 34 Years | 0 (0.0%) | 0 (0.0%) |
| 35 to 64 Years | 6 (3.0%) | 0 (0.0%) |
| 65 to 74 Years | 0 (0.0%) | 0 (0.0%) |
| 75 Years and over | 4 (9.8%) | 6 (10.0%) |
Disability Class: Cognitive Difficulty
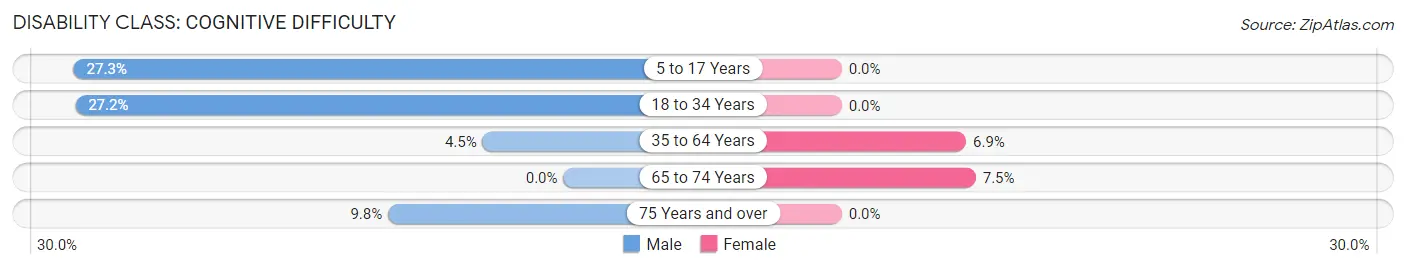
| Age Bracket | Male | Female |
| 5 to 17 Years | 3 (27.3%) | 0 (0.0%) |
| 18 to 34 Years | 28 (27.2%) | 0 (0.0%) |
| 35 to 64 Years | 9 (4.5%) | 11 (6.9%) |
| 65 to 74 Years | 0 (0.0%) | 5 (7.5%) |
| 75 Years and over | 4 (9.8%) | 0 (0.0%) |
Disability Class: Ambulatory Difficulty
| Age Bracket | Male | Female |
| 5 to 17 Years | 0 (0.0%) | 0 (0.0%) |
| 18 to 34 Years | 0 (0.0%) | 0 (0.0%) |
| 35 to 64 Years | 14 (7.0%) | 34 (21.4%) |
| 65 to 74 Years | 0 (0.0%) | 0 (0.0%) |
| 75 Years and over | 10 (24.4%) | 6 (10.0%) |
Disability Class: Self-Care Difficulty
| Age Bracket | Male | Female |
| 5 to 17 Years | 3 (27.3%) | 0 (0.0%) |
| 18 to 34 Years | 0 (0.0%) | 0 (0.0%) |
| 35 to 64 Years | 3 (1.5%) | 21 (13.2%) |
| 65 to 74 Years | 0 (0.0%) | 16 (23.9%) |
| 75 Years and over | 0 (0.0%) | 0 (0.0%) |
Technology Access in Ossineke
Computing Device Access in Ossineke
| Device Type | # Households | % Households |
| Desktop or Laptop | 313 | 79.8% |
| Smartphone | 325 | 82.9% |
| Tablet | 225 | 57.4% |
| No Computing Device | 24 | 6.1% |
| Total | 392 | 100.0% |
Internet Access in Ossineke
| Internet Type | # Households | % Households |
| Dial-Up Internet | 0 | 0.0% |
| Broadband Home | 319 | 81.4% |
| Cellular Data Only | 18 | 4.6% |
| Satellite Internet | 41 | 10.5% |
| No Internet | 49 | 12.5% |
| Total | 392 | 100.0% |
Ossineke Summary
Ossineke is a small unincorporated community located in Alpena County, Michigan. It is situated on the shores of Lake Huron, approximately 10 miles south of Alpena. The community is home to a population of approximately 500 people, and is known for its small-town charm and rural atmosphere.
History
Ossineke was first settled in the late 1800s by a group of German immigrants. The town was originally known as “Ossineke Station”, and was named after the nearby Ossineke River. The town was officially incorporated in 1891, and was home to a variety of businesses, including a sawmill, a general store, and a post office.
In the early 1900s, the town experienced a period of growth and prosperity. The population increased from just over 200 in 1900 to nearly 500 by 1910. During this time, the town was home to a variety of businesses, including a hotel, a bank, a blacksmith shop, and a variety of other stores.
In the 1920s, the town experienced a period of decline. The population decreased from 500 in 1910 to just over 300 in 1930. This decline was due in part to the Great Depression, as well as the decline of the lumber industry in the area.
In the 1940s, the town experienced a period of growth and prosperity once again. The population increased from just over 300 in 1930 to nearly 500 by 1950. During this time, the town was home to a variety of businesses, including a grocery store, a hardware store, a barber shop, and a variety of other stores.
Geography
Ossineke is located in Alpena County, Michigan. It is situated on the shores of Lake Huron, approximately 10 miles south of Alpena. The town is surrounded by a variety of natural features, including the Ossineke River, the Thunder Bay River, and the Thunder Bay National Wildlife Refuge.
The town is located in a rural area, and is home to a variety of wildlife, including deer, bear, and a variety of birds. The area is also home to a variety of trees, including maple, oak, and pine.
Economy
The economy of Ossineke is largely based on tourism and agriculture. The town is home to a variety of tourist attractions, including the Thunder Bay National Wildlife Refuge, the Thunder Bay River, and the Ossineke River. The town is also home to a variety of farms, which produce a variety of crops, including corn, soybeans, and wheat.
The town is also home to a variety of businesses, including a grocery store, a hardware store, a barber shop, and a variety of other stores. The town is also home to a variety of restaurants, including a pizza parlor, a diner, and a variety of other eateries.
Demographics
As of the 2010 census, the population of Ossineke was 498. The racial makeup of the town was 97.2% White, 0.2% African American, 0.2% Native American, 0.2% Asian, 0.2% from other races, and 1.8% from two or more races. Hispanic or Latino of any race were 0.8% of the population.
The median household income in Ossineke was $37,500, and the median family income was $41,250. The per capita income for the town was $17,845. About 11.2% of families and 13.2% of the population were below the poverty line, including 16.7% of those under age 18 and 8.3% of those age 65 or over.
Common Questions
What is Per Capita Income in Ossineke?
Per Capita income in Ossineke is $32,473.
What is the Median Family Income in Ossineke?
Median Family Income in Ossineke is $80,417.
What is the Median Household income in Ossineke?
Median Household Income in Ossineke is $49,340.
What is Inequality or Gini Index in Ossineke?
Inequality or Gini Index in Ossineke is 0.41.
What is the Total Population of Ossineke?
Total Population of Ossineke is 852.
What is the Total Male Population of Ossineke?
Total Male Population of Ossineke is 432.
What is the Total Female Population of Ossineke?
Total Female Population of Ossineke is 420.
What is the Ratio of Males per 100 Females in Ossineke?
There are 102.86 Males per 100 Females in Ossineke.
What is the Ratio of Females per 100 Males in Ossineke?
There are 97.22 Females per 100 Males in Ossineke.
What is the Median Population Age in Ossineke?
Median Population Age in Ossineke is 56.3 Years.
What is the Average Family Size in Ossineke
Average Family Size in Ossineke is 2.5 People.
What is the Average Household Size in Ossineke
Average Household Size in Ossineke is 2.2 People.
How Large is the Labor Force in Ossineke?
There are 421 People in the Labor Forcein in Ossineke.
What is the Percentage of People in the Labor Force in Ossineke?
53.3% of People are in the Labor Force in Ossineke.
What is the Unemployment Rate in Ossineke?
Unemployment Rate in Ossineke is 13.3%.