Palmer, MI Map & Demographics
Palmer Map
Palmer Overview
$27,028
PER CAPITA INCOME
$60,208
AVG FAMILY INCOME
$59,615
AVG HOUSEHOLD INCOME
51.1%
WAGE / INCOME GAP [ % ]
48.9¢/ $1
WAGE / INCOME GAP [ $ ]
0.35
INEQUALITY / GINI INDEX
378
TOTAL POPULATION
194
MALE POPULATION
184
FEMALE POPULATION
105.43
MALES / 100 FEMALES
94.85
FEMALES / 100 MALES
40.8
MEDIAN AGE
3.5
AVG FAMILY SIZE
2.6
AVG HOUSEHOLD SIZE
197
LABOR FORCE [ PEOPLE ]
62.3%
PERCENT IN LABOR FORCE
4.1%
UNEMPLOYMENT RATE
Palmer Zip Codes
Palmer Area Codes
Income in Palmer
Income Overview in Palmer
Per Capita Income in Palmer is $27,028, while median incomes of families and households are $60,208 and $59,615 respectively.
| Characteristic | Number | Measure |
| Per Capita Income | 378 | $27,028 |
| Median Family Income | 85 | $60,208 |
| Mean Family Income | 85 | $74,048 |
| Median Household Income | 136 | $59,615 |
| Mean Household Income | 136 | $65,649 |
| Income Deficit | 85 | $0 |
| Wage / Income Gap (%) | 378 | 51.11% |
| Wage / Income Gap ($) | 378 | 48.89¢ per $1 |
| Gini / Inequality Index | 378 | 0.35 |
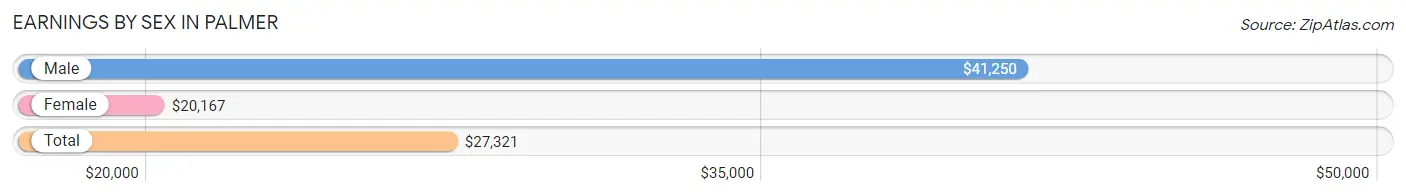
Earnings by Sex in Palmer
Average Earnings in Palmer are $27,321, $41,250 for men and $20,167 for women, a difference of 51.1%.
| Sex | Number | Average Earnings |
| Male | 101 (52.3%) | $41,250 |
| Female | 92 (47.7%) | $20,167 |
| Total | 193 (100.0%) | $27,321 |
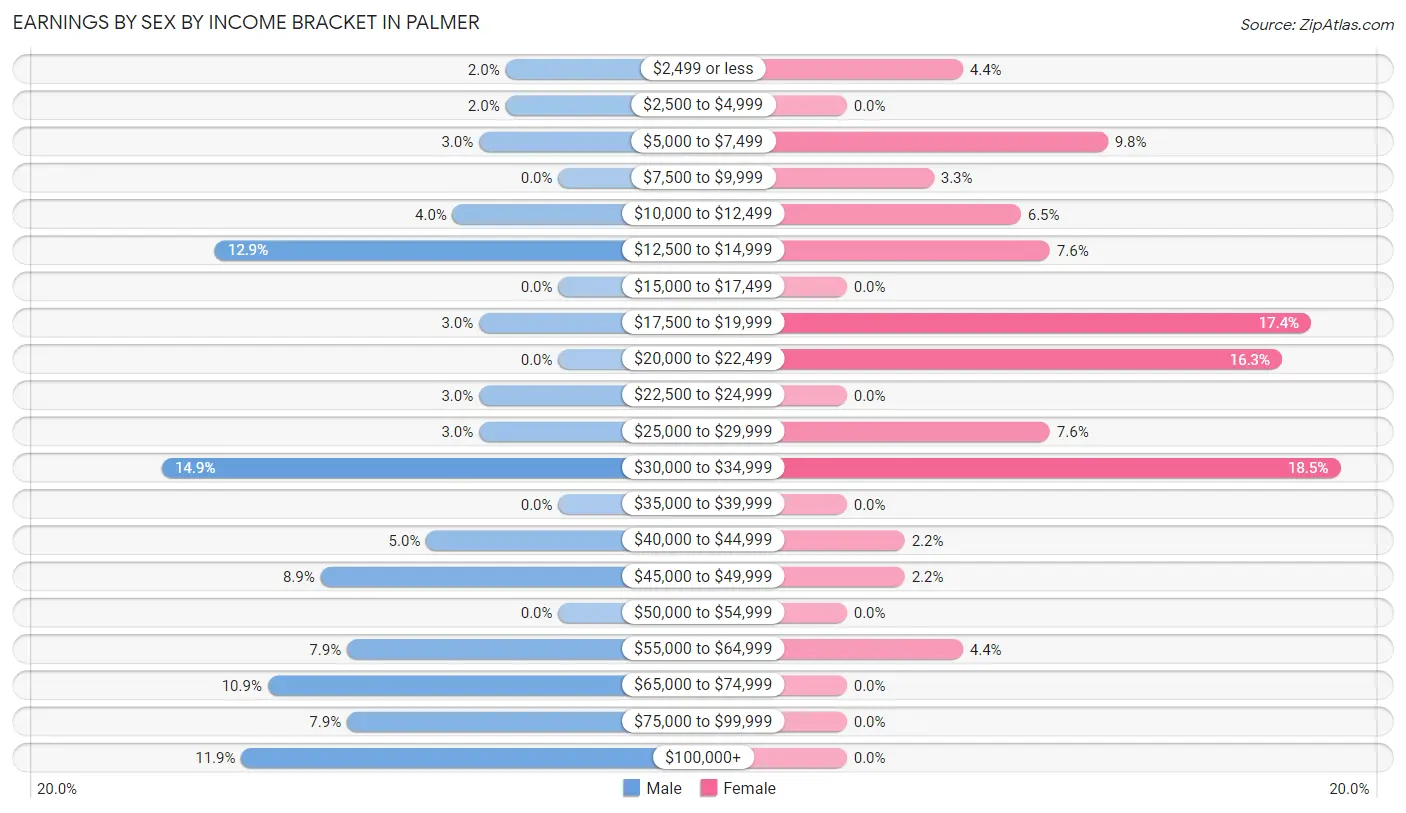
Earnings by Sex by Income Bracket in Palmer
The most common earnings brackets in Palmer are $30,000 to $34,999 for men (15 | 14.8%) and $30,000 to $34,999 for women (17 | 18.5%).
| Income | Male | Female |
| $2,499 or less | 2 (2.0%) | 4 (4.3%) |
| $2,500 to $4,999 | 2 (2.0%) | 0 (0.0%) |
| $5,000 to $7,499 | 3 (3.0%) | 9 (9.8%) |
| $7,500 to $9,999 | 0 (0.0%) | 3 (3.3%) |
| $10,000 to $12,499 | 4 (4.0%) | 6 (6.5%) |
| $12,500 to $14,999 | 13 (12.9%) | 7 (7.6%) |
| $15,000 to $17,499 | 0 (0.0%) | 0 (0.0%) |
| $17,500 to $19,999 | 3 (3.0%) | 16 (17.4%) |
| $20,000 to $22,499 | 0 (0.0%) | 15 (16.3%) |
| $22,500 to $24,999 | 3 (3.0%) | 0 (0.0%) |
| $25,000 to $29,999 | 3 (3.0%) | 7 (7.6%) |
| $30,000 to $34,999 | 15 (14.8%) | 17 (18.5%) |
| $35,000 to $39,999 | 0 (0.0%) | 0 (0.0%) |
| $40,000 to $44,999 | 5 (5.0%) | 2 (2.2%) |
| $45,000 to $49,999 | 9 (8.9%) | 2 (2.2%) |
| $50,000 to $54,999 | 0 (0.0%) | 0 (0.0%) |
| $55,000 to $64,999 | 8 (7.9%) | 4 (4.3%) |
| $65,000 to $74,999 | 11 (10.9%) | 0 (0.0%) |
| $75,000 to $99,999 | 8 (7.9%) | 0 (0.0%) |
| $100,000+ | 12 (11.9%) | 0 (0.0%) |
| Total | 101 (100.0%) | 92 (100.0%) |
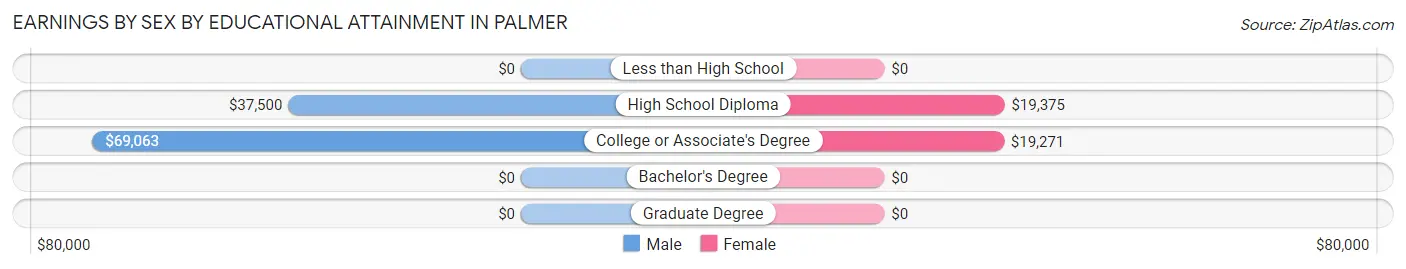
Earnings by Sex by Educational Attainment in Palmer
Average earnings in Palmer are $46,528 for men and $19,531 for women, a difference of 58.0%. Men with an educational attainment of college or associate's degree enjoy the highest average annual earnings of $69,063, while those with high school diploma education earn the least with $37,500. Women with an educational attainment of high school diploma earn the most with the average annual earnings of $19,375, while those with college or associate's degree education have the smallest earnings of $19,271.
| Educational Attainment | Male Income | Female Income |
| Less than High School | - | - |
| High School Diploma | $37,500 | $19,375 |
| College or Associate's Degree | $69,063 | $19,271 |
| Bachelor's Degree | - | - |
| Graduate Degree | - | - |
| Total | $46,528 | $19,531 |
Family Income in Palmer
Family Income Brackets in Palmer
According to the Palmer family income data, there are 25 families falling into the $50,000 to $74,999 income range, which is the most common income bracket and makes up 29.4% of all families.
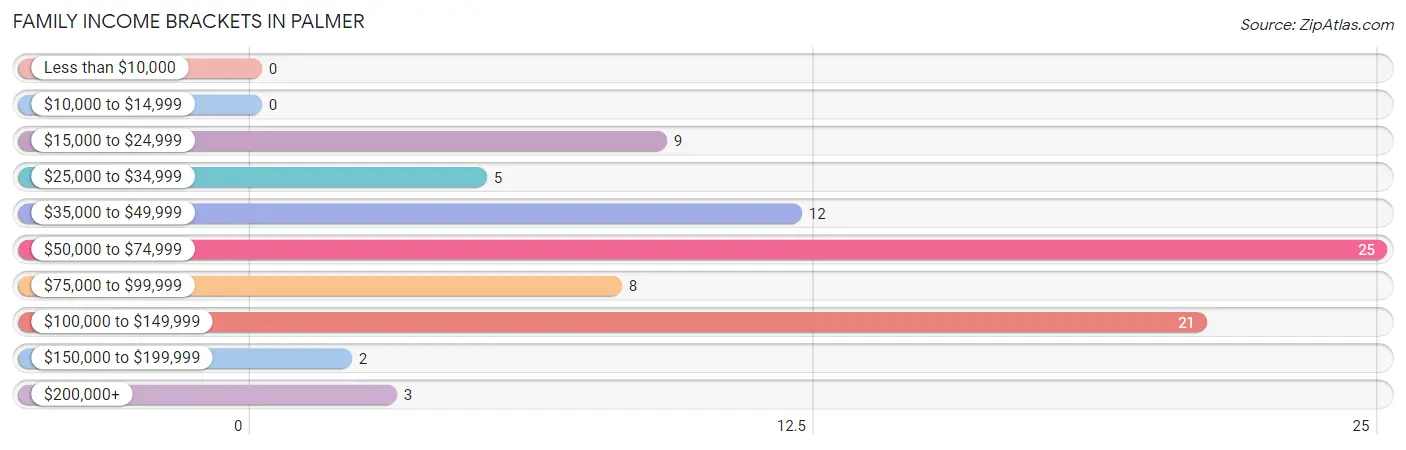
| Income Bracket | # Families | % Families |
| Less than $10,000 | 0 | 0.0% |
| $10,000 to $14,999 | 0 | 0.0% |
| $15,000 to $24,999 | 9 | 10.6% |
| $25,000 to $34,999 | 5 | 5.9% |
| $35,000 to $49,999 | 12 | 14.1% |
| $50,000 to $74,999 | 25 | 29.4% |
| $75,000 to $99,999 | 8 | 9.4% |
| $100,000 to $149,999 | 21 | 24.7% |
| $150,000 to $199,999 | 2 | 2.4% |
| $200,000+ | 3 | 3.5% |
Family Income by Famaliy Size in Palmer
3-person families (31 | 36.5%) account for the highest median family income in Palmer with $96,875 per family, while 3-person families (31 | 36.5%) have the highest median income of $32,292 per family member.
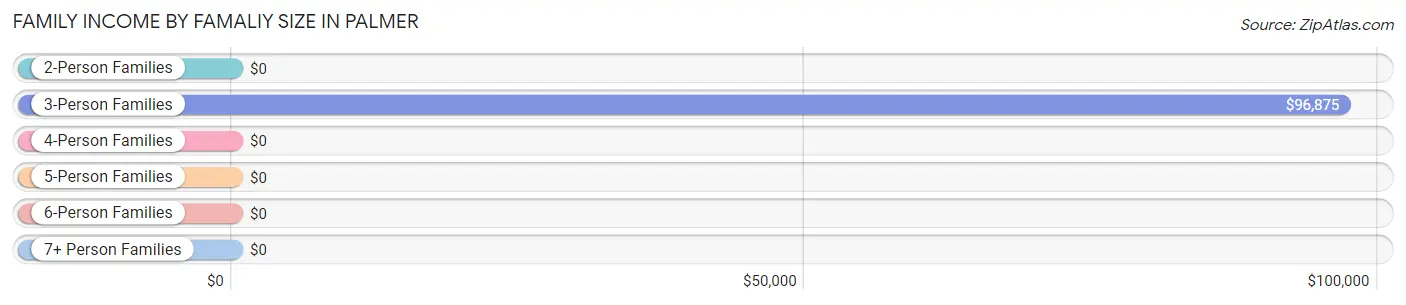
| Income Bracket | # Families | Median Income |
| 2-Person Families | 32 (37.7%) | $0 |
| 3-Person Families | 31 (36.5%) | $96,875 |
| 4-Person Families | 22 (25.9%) | $0 |
| 5-Person Families | 0 (0.0%) | $0 |
| 6-Person Families | 0 (0.0%) | $0 |
| 7+ Person Families | 0 (0.0%) | $0 |
| Total | 85 (100.0%) | $60,208 |
Family Income by Number of Earners in Palmer
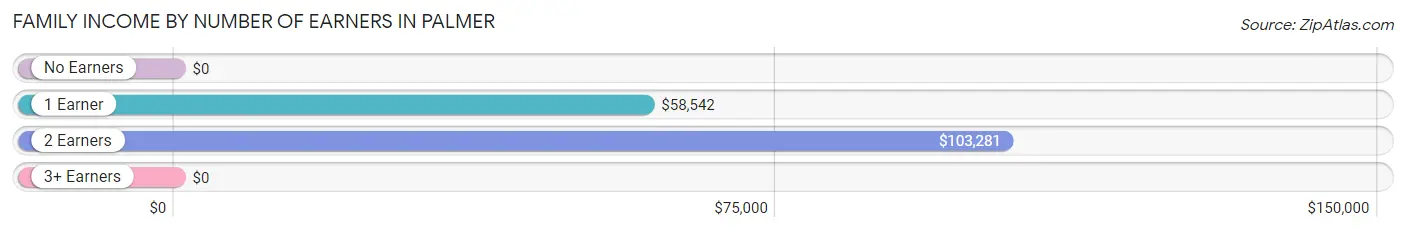
| Number of Earners | # Families | Median Income |
| No Earners | 5 (5.9%) | $0 |
| 1 Earner | 38 (44.7%) | $58,542 |
| 2 Earners | 37 (43.5%) | $103,281 |
| 3+ Earners | 5 (5.9%) | $0 |
| Total | 85 (100.0%) | $60,208 |
Household Income in Palmer
Household Income Brackets in Palmer
With 42 households falling in the category, the $50,000 to $74,999 income range is the most frequent in Palmer, accounting for 30.9% of all households. In contrast, only 2 households (1.5%) fall into the $150,000 to $199,999 income bracket, making it the least populous group.
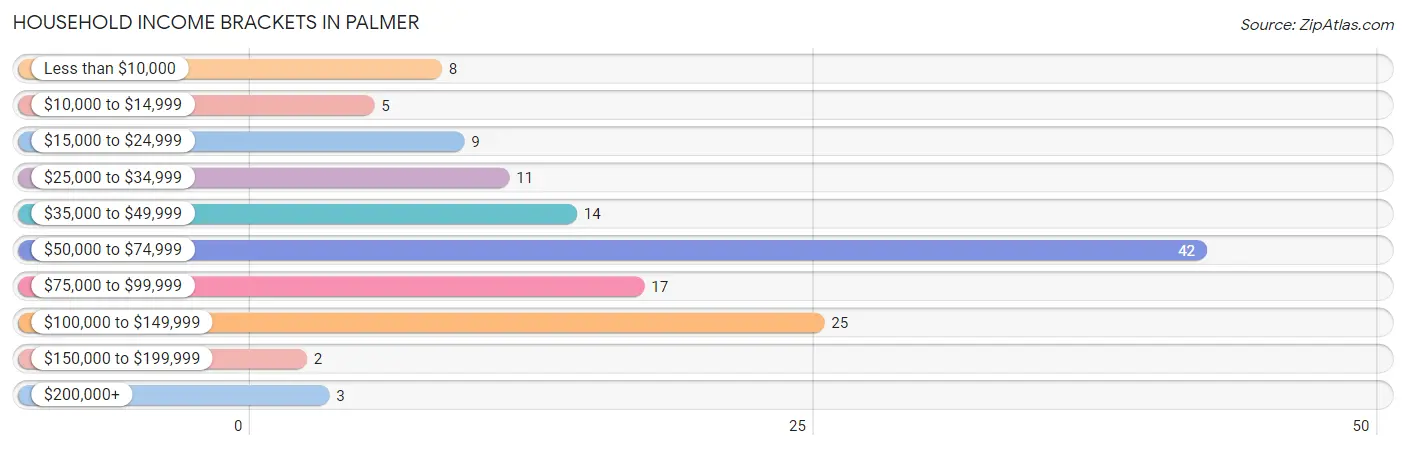
| Income Bracket | # Households | % Households |
| Less than $10,000 | 8 | 5.9% |
| $10,000 to $14,999 | 5 | 3.7% |
| $15,000 to $24,999 | 9 | 6.6% |
| $25,000 to $34,999 | 11 | 8.1% |
| $35,000 to $49,999 | 14 | 10.3% |
| $50,000 to $74,999 | 42 | 30.9% |
| $75,000 to $99,999 | 17 | 12.5% |
| $100,000 to $149,999 | 25 | 18.4% |
| $150,000 to $199,999 | 2 | 1.5% |
| $200,000+ | 3 | 2.2% |
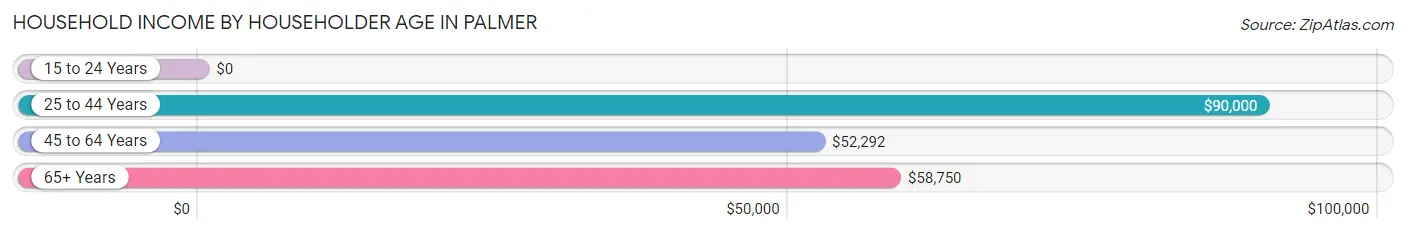
Household Income by Householder Age in Palmer
The median household income in Palmer is $59,615, with the highest median household income of $90,000 found in the 25 to 44 years age bracket for the primary householder. A total of 34 households (25.0%) fall into this category.
| Income Bracket | # Households | Median Income |
| 15 to 24 Years | 0 (0.0%) | $0 |
| 25 to 44 Years | 34 (25.0%) | $90,000 |
| 45 to 64 Years | 83 (61.0%) | $52,292 |
| 65+ Years | 19 (14.0%) | $58,750 |
| Total | 136 (100.0%) | $59,615 |
Poverty in Palmer
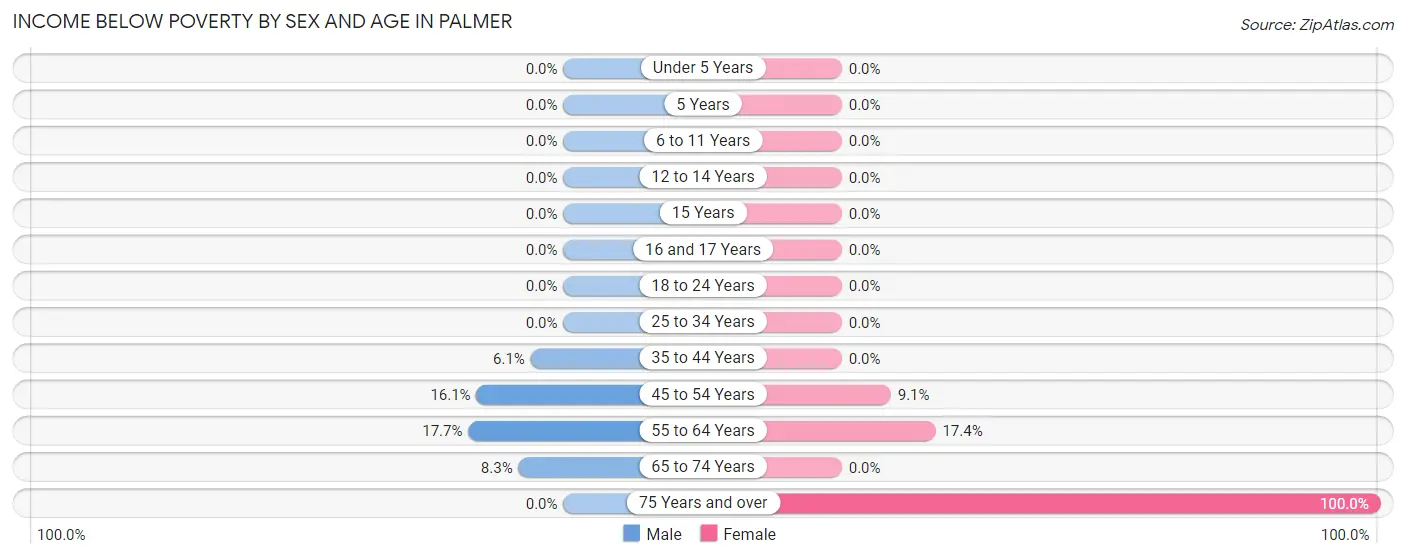
Income Below Poverty by Sex and Age in Palmer
With 9.3% poverty level for males and 7.1% for females among the residents of Palmer, 55 to 64 year old males and 75 year old and over females are the most vulnerable to poverty, with 9 males (17.6%) and 3 females (100.0%) in their respective age groups living below the poverty level.
| Age Bracket | Male | Female |
| Under 5 Years | 0 (0.0%) | 0 (0.0%) |
| 5 Years | 0 (0.0%) | 0 (0.0%) |
| 6 to 11 Years | 0 (0.0%) | 0 (0.0%) |
| 12 to 14 Years | 0 (0.0%) | 0 (0.0%) |
| 15 Years | 0 (0.0%) | 0 (0.0%) |
| 16 and 17 Years | 0 (0.0%) | 0 (0.0%) |
| 18 to 24 Years | 0 (0.0%) | 0 (0.0%) |
| 25 to 34 Years | 0 (0.0%) | 0 (0.0%) |
| 35 to 44 Years | 2 (6.1%) | 0 (0.0%) |
| 45 to 54 Years | 5 (16.1%) | 2 (9.1%) |
| 55 to 64 Years | 9 (17.6%) | 8 (17.4%) |
| 65 to 74 Years | 2 (8.3%) | 0 (0.0%) |
| 75 Years and over | 0 (0.0%) | 3 (100.0%) |
| Total | 18 (9.3%) | 13 (7.1%) |
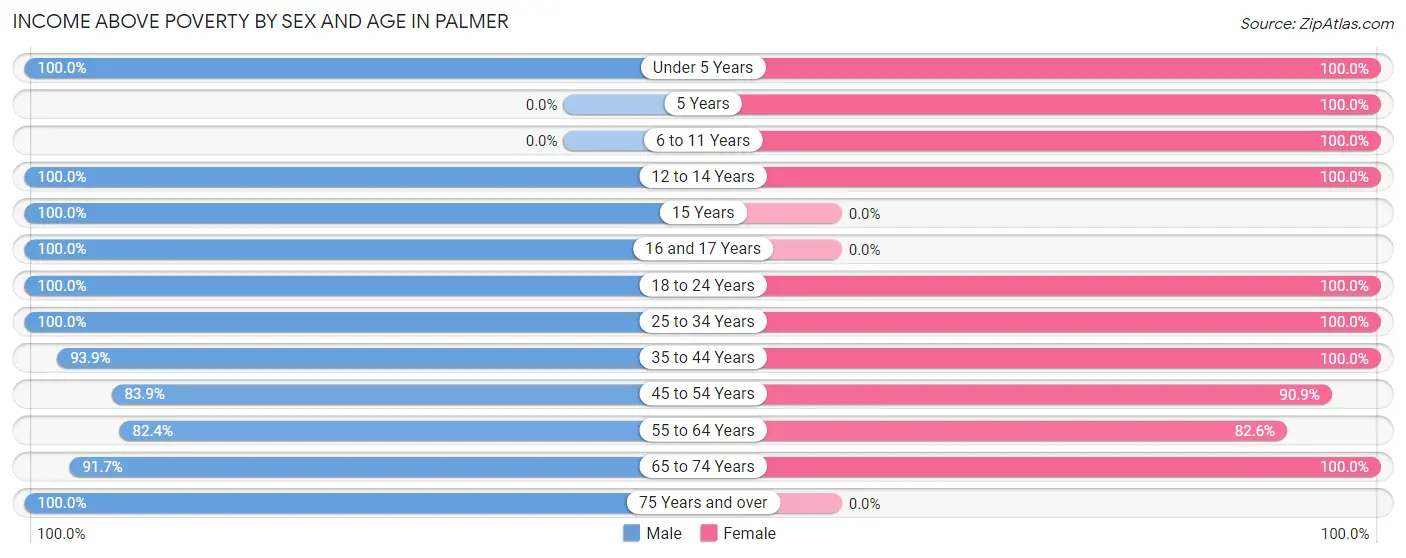
Income Above Poverty by Sex and Age in Palmer
According to the poverty statistics in Palmer, males aged under 5 years and females aged under 5 years are the age groups that are most secure financially, with 100.0% of males and 100.0% of females in these age groups living above the poverty line.
| Age Bracket | Male | Female |
| Under 5 Years | 3 (100.0%) | 10 (100.0%) |
| 5 Years | 0 (0.0%) | 5 (100.0%) |
| 6 to 11 Years | 0 (0.0%) | 24 (100.0%) |
| 12 to 14 Years | 11 (100.0%) | 7 (100.0%) |
| 15 Years | 2 (100.0%) | 0 (0.0%) |
| 16 and 17 Years | 7 (100.0%) | 0 (0.0%) |
| 18 to 24 Years | 20 (100.0%) | 8 (100.0%) |
| 25 to 34 Years | 11 (100.0%) | 43 (100.0%) |
| 35 to 44 Years | 31 (93.9%) | 7 (100.0%) |
| 45 to 54 Years | 26 (83.9%) | 20 (90.9%) |
| 55 to 64 Years | 42 (82.4%) | 38 (82.6%) |
| 65 to 74 Years | 22 (91.7%) | 9 (100.0%) |
| 75 Years and over | 1 (100.0%) | 0 (0.0%) |
| Total | 176 (90.7%) | 171 (92.9%) |
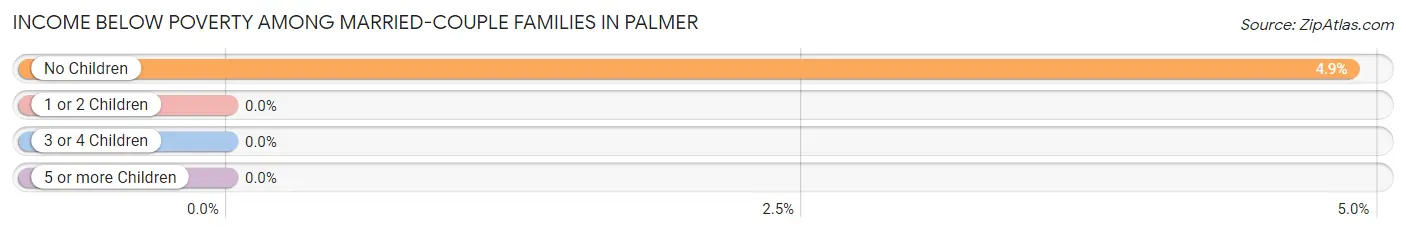
Income Below Poverty Among Married-Couple Families in Palmer
The poverty statistics for married-couple families in Palmer show that 2.8% or 2 of the total 71 families live below the poverty line. Families with no children have the highest poverty rate of 4.9%, comprising of 2 families. On the other hand, families with 1 or 2 children have the lowest poverty rate of 0.0%, which includes 0 families.
| Children | Above Poverty | Below Poverty |
| No Children | 39 (95.1%) | 2 (4.9%) |
| 1 or 2 Children | 30 (100.0%) | 0 (0.0%) |
| 3 or 4 Children | 0 (0.0%) | 0 (0.0%) |
| 5 or more Children | 0 (0.0%) | 0 (0.0%) |
| Total | 69 (97.2%) | 2 (2.8%) |
Income Below Poverty Among Single-Parent Households in Palmer
| Children | Single Father | Single Mother |
| No Children | 0 (0.0%) | 0 (0.0%) |
| 1 or 2 Children | 0 (0.0%) | 0 (0.0%) |
| 3 or 4 Children | 0 (0.0%) | 0 (0.0%) |
| 5 or more Children | 0 (0.0%) | 0 (0.0%) |
| Total | 0 (0.0%) | 0 (0.0%) |
Income Below Poverty Among Married-Couple vs Single-Parent Households in Palmer
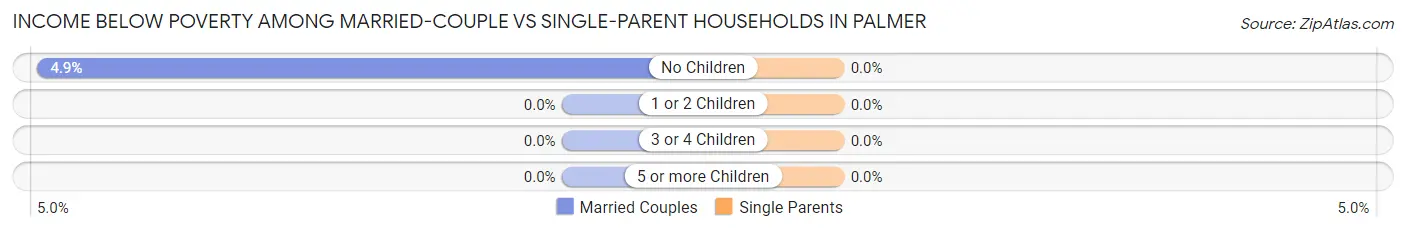
| Children | Married-Couple Families | Single-Parent Households |
| No Children | 2 (4.9%) | 0 (0.0%) |
| 1 or 2 Children | 0 (0.0%) | 0 (0.0%) |
| 3 or 4 Children | 0 (0.0%) | 0 (0.0%) |
| 5 or more Children | 0 (0.0%) | 0 (0.0%) |
| Total | 2 (2.8%) | 0 (0.0%) |
Race in Palmer
The most populous races in Palmer are White / Caucasian (370 | 97.9%), Two or more Races (6 | 1.6%), and Native / Alaskan (2 | 0.5%).
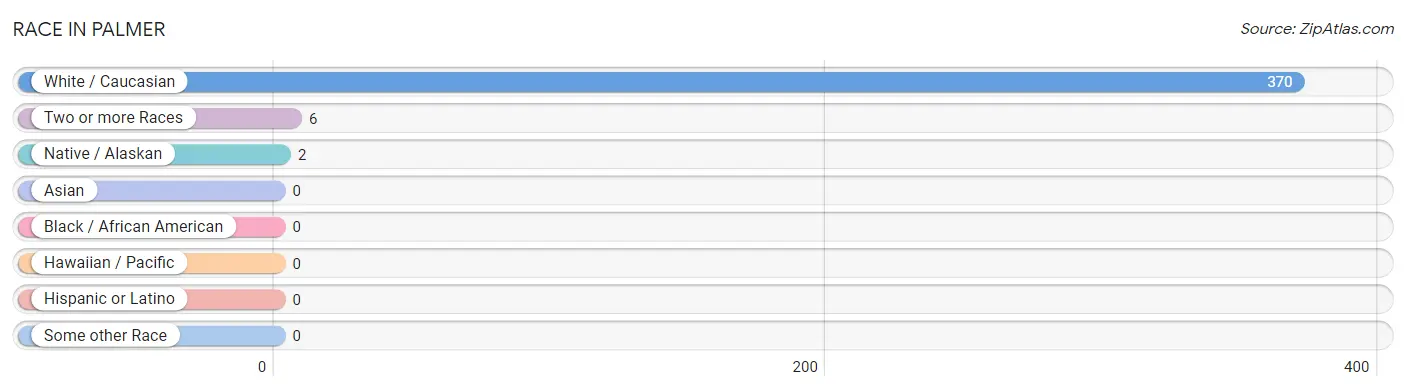
| Race | # Population | % Population |
| Asian | 0 | 0.0% |
| Black / African American | 0 | 0.0% |
| Hawaiian / Pacific | 0 | 0.0% |
| Hispanic or Latino | 0 | 0.0% |
| Native / Alaskan | 2 | 0.5% |
| White / Caucasian | 370 | 97.9% |
| Two or more Races | 6 | 1.6% |
| Some other Race | 0 | 0.0% |
| Total | 378 | 100.0% |
Ancestry in Palmer
The most populous ancestries reported in Palmer are Finnish (141 | 37.3%), Irish (60 | 15.9%), Italian (58 | 15.3%), French (29 | 7.7%), and German (24 | 6.4%), together accounting for 82.5% of all Palmer residents.
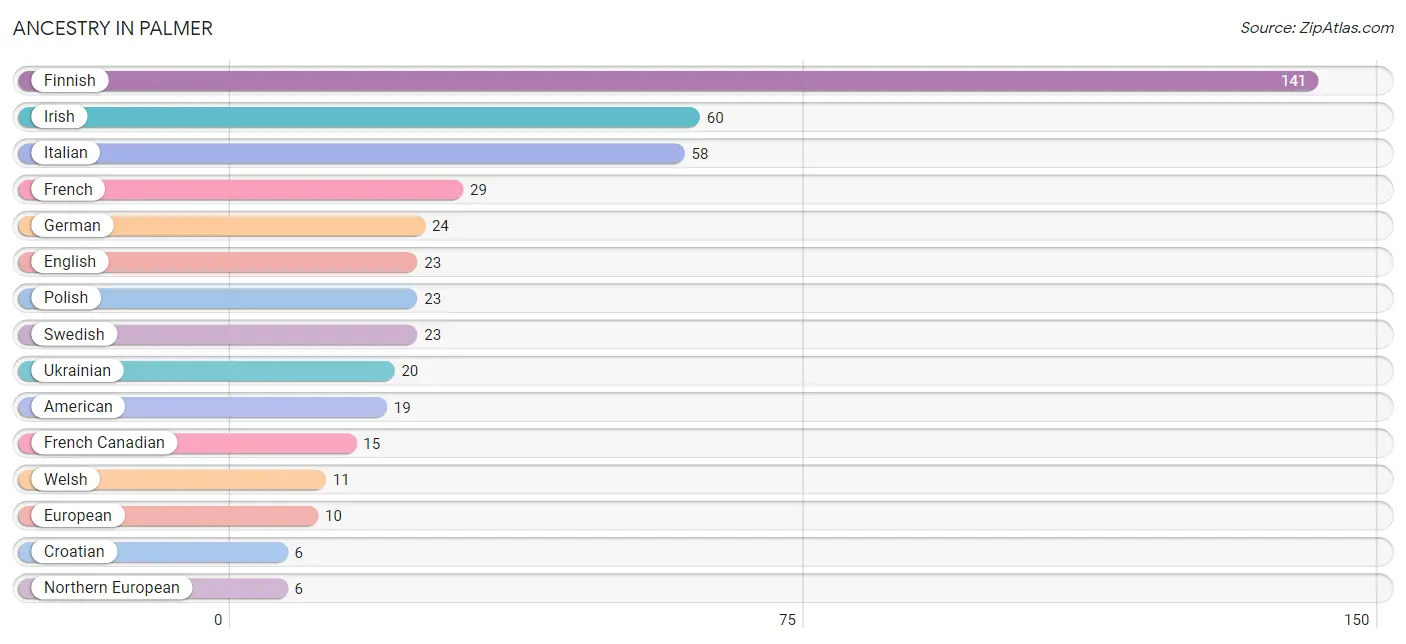
| Ancestry | # Population | % Population |
| American | 19 | 5.0% |
| Austrian | 3 | 0.8% |
| Chippewa | 2 | 0.5% |
| Croatian | 6 | 1.6% |
| Dutch | 5 | 1.3% |
| English | 23 | 6.1% |
| European | 10 | 2.6% |
| Finnish | 141 | 37.3% |
| French | 29 | 7.7% |
| French Canadian | 15 | 4.0% |
| German | 24 | 6.4% |
| Irish | 60 | 15.9% |
| Italian | 58 | 15.3% |
| Northern European | 6 | 1.6% |
| Polish | 23 | 6.1% |
| Swedish | 23 | 6.1% |
| Ukrainian | 20 | 5.3% |
| Welsh | 11 | 2.9% | View All 18 Rows |
Immigrants in Palmer

| Immigration Origin | # Population | % Population | View All 0 Rows |
Sex and Age in Palmer
Sex and Age in Palmer
The most populous age groups in Palmer are 60 to 64 Years (31 | 16.0%) for men and 25 to 29 Years (29 | 15.8%) for women.
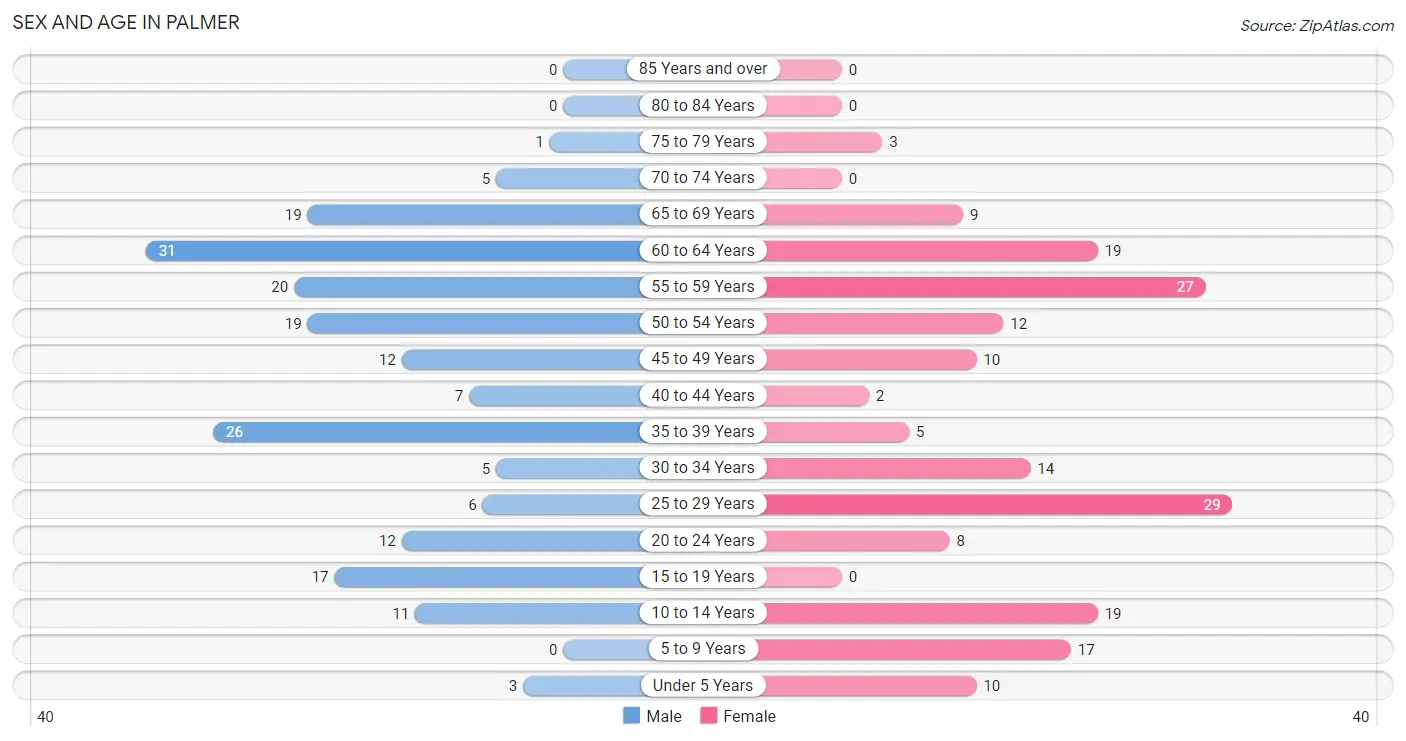
| Age Bracket | Male | Female |
| Under 5 Years | 3 (1.5%) | 10 (5.4%) |
| 5 to 9 Years | 0 (0.0%) | 17 (9.2%) |
| 10 to 14 Years | 11 (5.7%) | 19 (10.3%) |
| 15 to 19 Years | 17 (8.8%) | 0 (0.0%) |
| 20 to 24 Years | 12 (6.2%) | 8 (4.3%) |
| 25 to 29 Years | 6 (3.1%) | 29 (15.8%) |
| 30 to 34 Years | 5 (2.6%) | 14 (7.6%) |
| 35 to 39 Years | 26 (13.4%) | 5 (2.7%) |
| 40 to 44 Years | 7 (3.6%) | 2 (1.1%) |
| 45 to 49 Years | 12 (6.2%) | 10 (5.4%) |
| 50 to 54 Years | 19 (9.8%) | 12 (6.5%) |
| 55 to 59 Years | 20 (10.3%) | 27 (14.7%) |
| 60 to 64 Years | 31 (16.0%) | 19 (10.3%) |
| 65 to 69 Years | 19 (9.8%) | 9 (4.9%) |
| 70 to 74 Years | 5 (2.6%) | 0 (0.0%) |
| 75 to 79 Years | 1 (0.5%) | 3 (1.6%) |
| 80 to 84 Years | 0 (0.0%) | 0 (0.0%) |
| 85 Years and over | 0 (0.0%) | 0 (0.0%) |
| Total | 194 (100.0%) | 184 (100.0%) |
Families and Households in Palmer
Median Family Size in Palmer
The median family size in Palmer is 3.47 persons per family, with single male/father families (8 | 9.4%) accounting for the largest median family size of 3.88 persons per family. On the other hand, single female/mother families (6 | 7.1%) represent the smallest median family size with 2.50 persons per family.
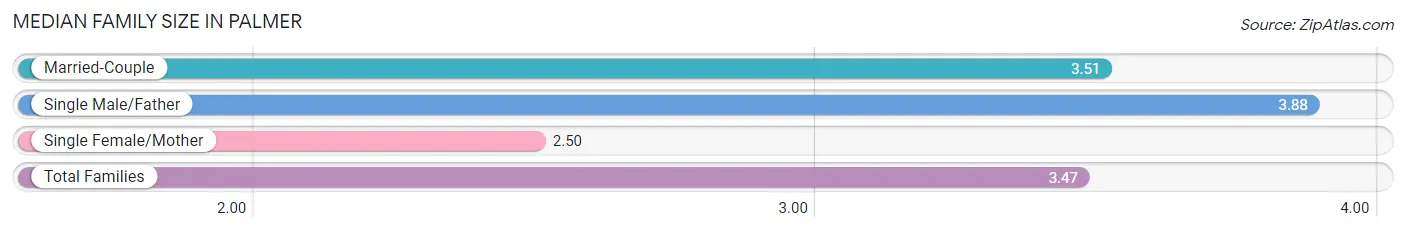
| Family Type | # Families | Family Size |
| Married-Couple | 71 (83.5%) | 3.51 |
| Single Male/Father | 8 (9.4%) | 3.88 |
| Single Female/Mother | 6 (7.1%) | 2.50 |
| Total Families | 85 (100.0%) | 3.47 |
Median Household Size in Palmer
The median household size in Palmer is 2.60 persons per household, with single male/father households (8 | 5.9%) accounting for the largest median household size of 3.88 persons per household. non-family households (51 | 37.5%) represent the smallest median household size with 1.08 persons per household.
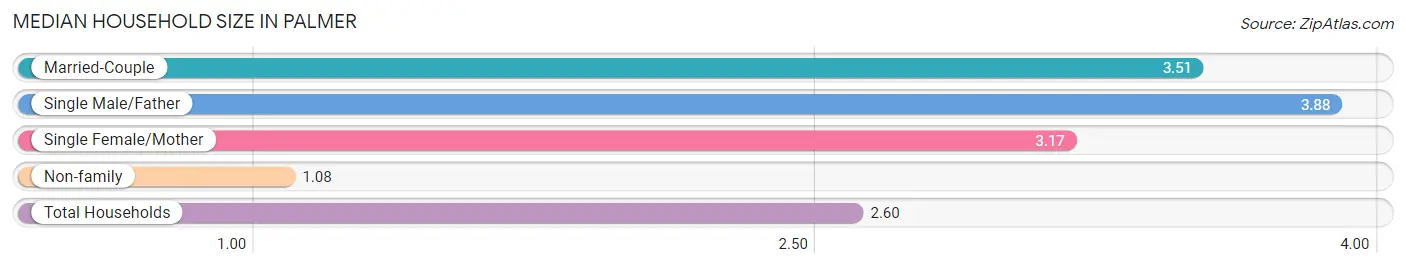
| Household Type | # Households | Household Size |
| Married-Couple | 71 (52.2%) | 3.51 |
| Single Male/Father | 8 (5.9%) | 3.88 |
| Single Female/Mother | 6 (4.4%) | 3.17 |
| Non-family | 51 (37.5%) | 1.08 |
| Total Households | 136 (100.0%) | 2.60 |
Household Size by Marriage Status in Palmer
Out of a total of 136 households in Palmer, 85 (62.5%) are family households, while 51 (37.5%) are nonfamily households. The most numerous type of family households are 3-person households, comprising 35, and the most common type of nonfamily households are 1-person households, comprising 48.
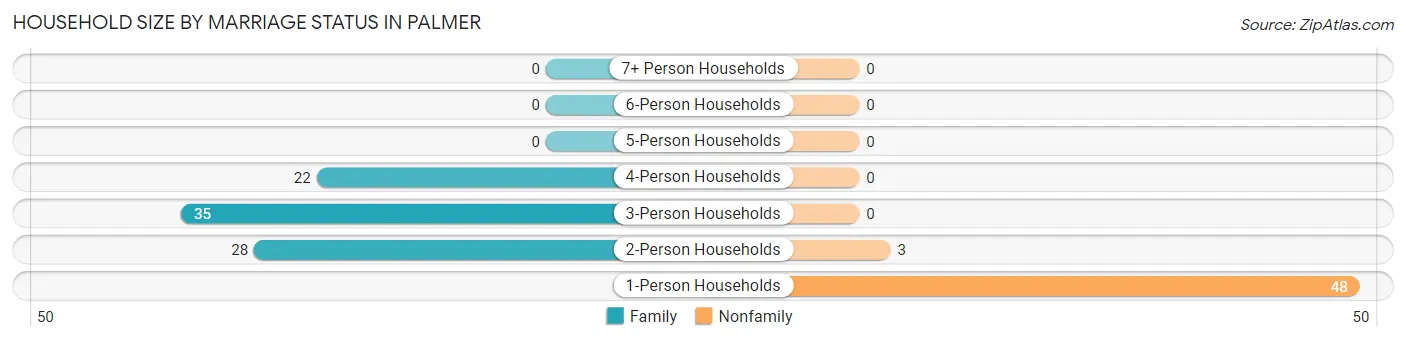
| Household Size | Family Households | Nonfamily Households |
| 1-Person Households | - | 48 (35.3%) |
| 2-Person Households | 28 (20.6%) | 3 (2.2%) |
| 3-Person Households | 35 (25.7%) | 0 (0.0%) |
| 4-Person Households | 22 (16.2%) | 0 (0.0%) |
| 5-Person Households | 0 (0.0%) | 0 (0.0%) |
| 6-Person Households | 0 (0.0%) | 0 (0.0%) |
| 7+ Person Households | 0 (0.0%) | 0 (0.0%) |
| Total | 85 (62.5%) | 51 (37.5%) |
Female Fertility in Palmer
Fertility by Age in Palmer
| Age Bracket | Women with Births | Births / 1,000 Women |
| 15 to 19 years | 0 (0.0%) | 0.0 |
| 20 to 34 years | 0 (0.0%) | 0.0 |
| 35 to 50 years | 0 (0.0%) | 0.0 |
| Total | 0 (0.0%) | 0.0 |
Fertility by Age by Marriage Status in Palmer
| Age Bracket | Married | Unmarried |
| 15 to 19 years | 0 (0.0%) | 0 (0.0%) |
| 20 to 34 years | 0 (0.0%) | 0 (0.0%) |
| 35 to 50 years | 0 (0.0%) | 0 (0.0%) |
| Total | 0 (0.0%) | 0 (0.0%) |
Fertility by Education in Palmer
| Educational Attainment | Women with Births | Births / 1,000 Women |
| Less than High School | 0 (0.0%) | 0.0 |
| High School Diploma | 0 (0.0%) | 0.0 |
| College or Associate's Degree | 0 (0.0%) | 0.0 |
| Bachelor's Degree | 0 (0.0%) | 0.0 |
| Graduate Degree | 0 (0.0%) | 0.0 |
| Total | 0 (0.0%) | 0.0 |
Fertility by Education by Marriage Status in Palmer
| Educational Attainment | Married | Unmarried |
| Less than High School | 0 (0.0%) | 0 (0.0%) |
| High School Diploma | 0 (0.0%) | 0 (0.0%) |
| College or Associate's Degree | 0 (0.0%) | 0 (0.0%) |
| Bachelor's Degree | 0 (0.0%) | 0 (0.0%) |
| Graduate Degree | 0 (0.0%) | 0 (0.0%) |
| Total | 0 (0.0%) | 0 (0.0%) |
Employment Characteristics in Palmer
Employment by Class of Employer in Palmer
Among the 189 employed individuals in Palmer, private company employees (159 | 84.1%), not-for-profit organizations (13 | 6.9%), and local government employees (9 | 4.8%) make up the most common classes of employment.
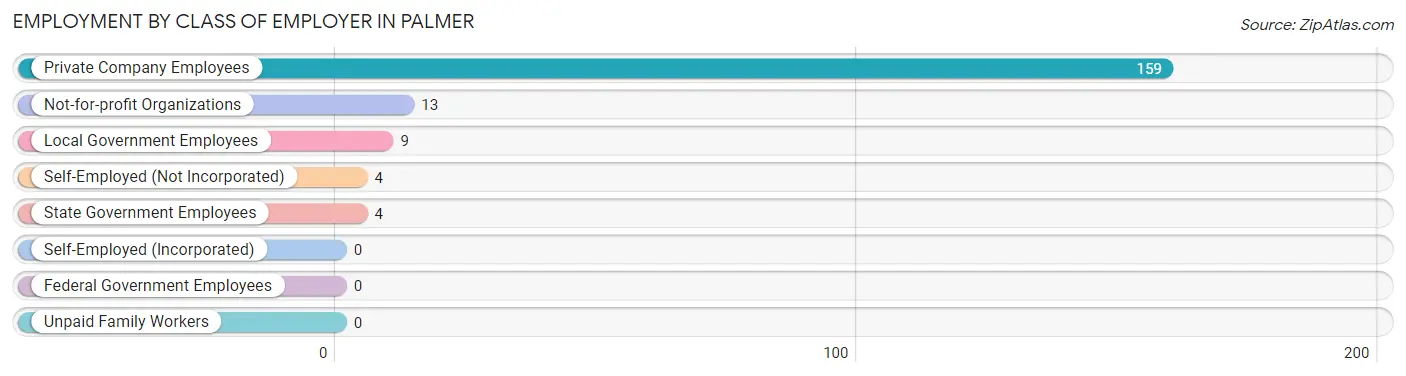
| Employer Class | # Employees | % Employees |
| Private Company Employees | 159 | 84.1% |
| Self-Employed (Incorporated) | 0 | 0.0% |
| Self-Employed (Not Incorporated) | 4 | 2.1% |
| Not-for-profit Organizations | 13 | 6.9% |
| Local Government Employees | 9 | 4.8% |
| State Government Employees | 4 | 2.1% |
| Federal Government Employees | 0 | 0.0% |
| Unpaid Family Workers | 0 | 0.0% |
| Total | 189 | 100.0% |
Employment Status by Age in Palmer
According to the labor force statistics for Palmer, out of the total population over 16 years of age (316), 62.3% or 197 individuals are in the labor force, with 4.1% or 8 of them unemployed. The age group with the highest labor force participation rate is 30 to 34 years, with 100.0% or 19 individuals in the labor force. Within the labor force, the 16 to 19 years age range has the highest percentage of unemployed individuals, with 38.5% or 5 of them being unemployed.
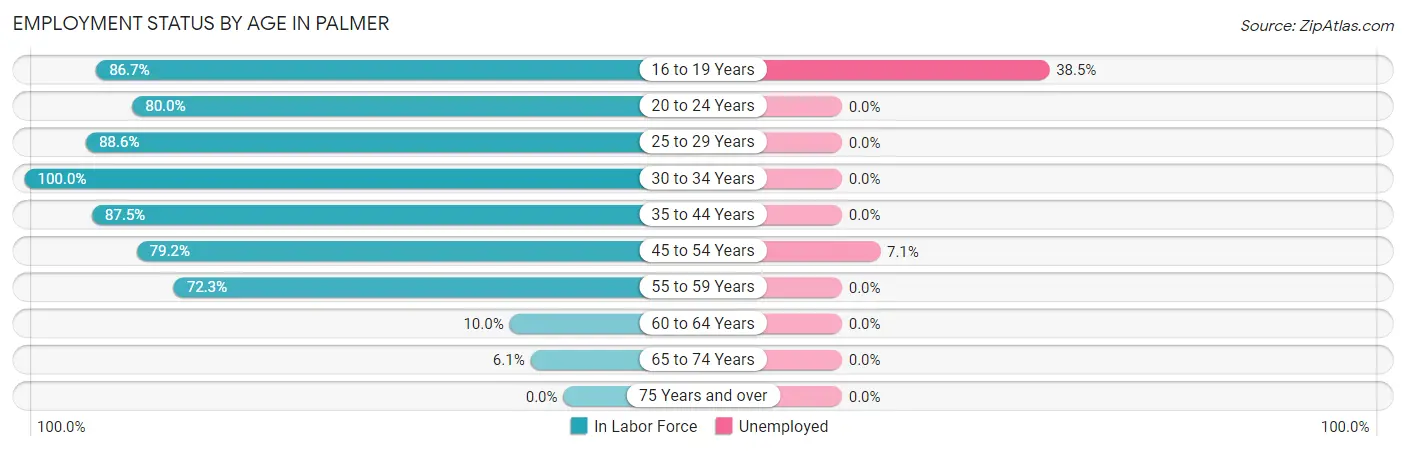
| Age Bracket | In Labor Force | Unemployed |
| 16 to 19 Years | 13 (86.7%) | 5 (38.5%) |
| 20 to 24 Years | 16 (80.0%) | 0 (0.0%) |
| 25 to 29 Years | 31 (88.6%) | 0 (0.0%) |
| 30 to 34 Years | 19 (100.0%) | 0 (0.0%) |
| 35 to 44 Years | 35 (87.5%) | 0 (0.0%) |
| 45 to 54 Years | 42 (79.2%) | 3 (7.1%) |
| 55 to 59 Years | 34 (72.3%) | 0 (0.0%) |
| 60 to 64 Years | 5 (10.0%) | 0 (0.0%) |
| 65 to 74 Years | 2 (6.1%) | 0 (0.0%) |
| 75 Years and over | 0 (0.0%) | 0 (0.0%) |
| Total | 197 (62.3%) | 8 (4.1%) |
Employment Status by Educational Attainment in Palmer
According to labor force statistics for Palmer, 68.0% of individuals (166) out of the total population between 25 and 64 years of age (244) are in the labor force, with 1.8% or 3 of them being unemployed. The group with the highest labor force participation rate are those with the educational attainment of bachelor's degree or higher, with 100.0% or 15 individuals in the labor force. Within the labor force, individuals with college / associate degree education have the highest percentage of unemployment, with 3.3% or 3 of them being unemployed.
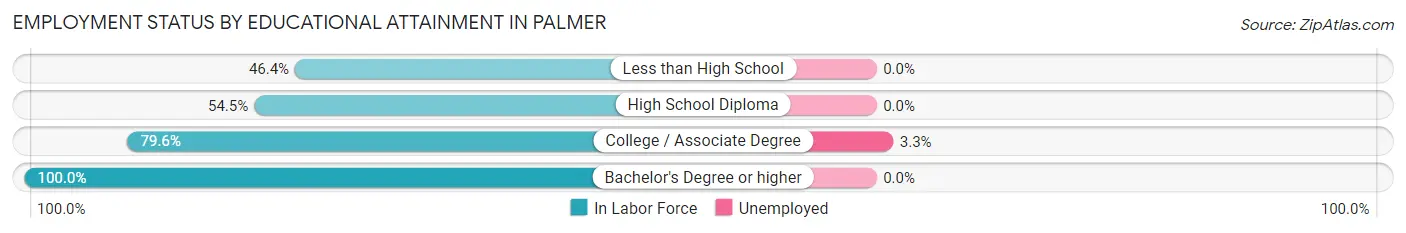
| Educational Attainment | In Labor Force | Unemployed |
| Less than High School | 13 (46.4%) | 0 (0.0%) |
| High School Diploma | 48 (54.5%) | 0 (0.0%) |
| College / Associate Degree | 90 (79.6%) | 4 (3.3%) |
| Bachelor's Degree or higher | 15 (100.0%) | 0 (0.0%) |
| Total | 166 (68.0%) | 4 (1.8%) |
Employment Occupations by Sex in Palmer
Management, Business, Science and Arts Occupations
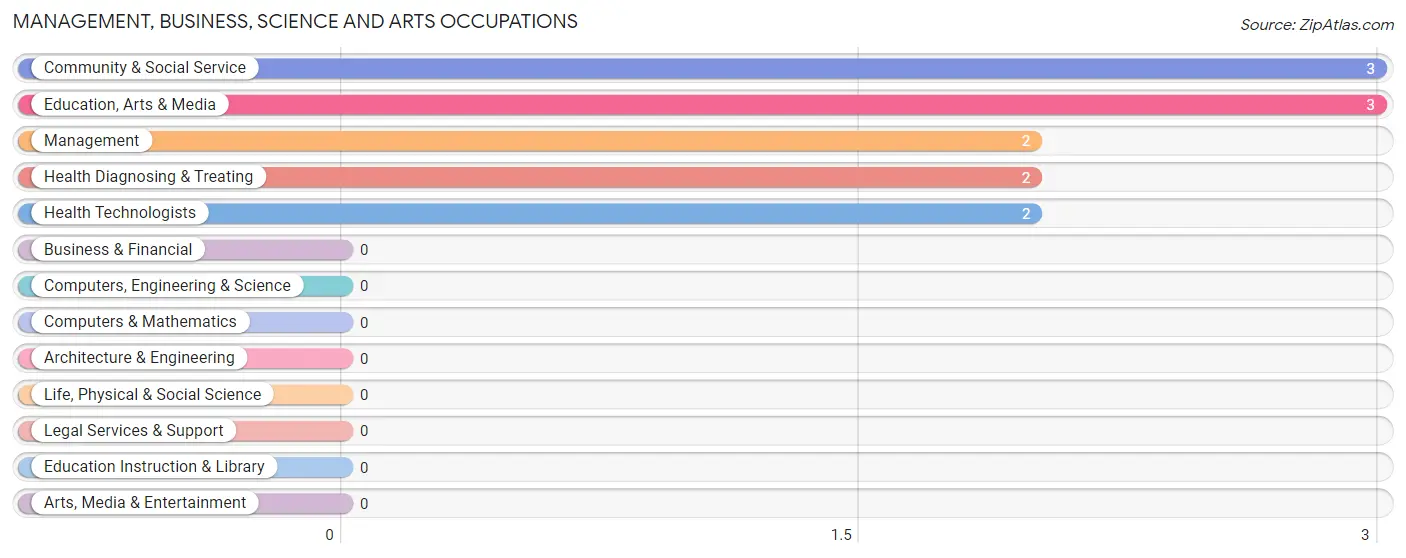
The most common Management, Business, Science and Arts occupations in Palmer are Community & Social Service (3 | 1.6%), Education, Arts & Media (3 | 1.6%), Management (2 | 1.1%), Health Diagnosing & Treating (2 | 1.1%), and Health Technologists (2 | 1.1%).
Management, Business, Science and Arts Occupations by Sex
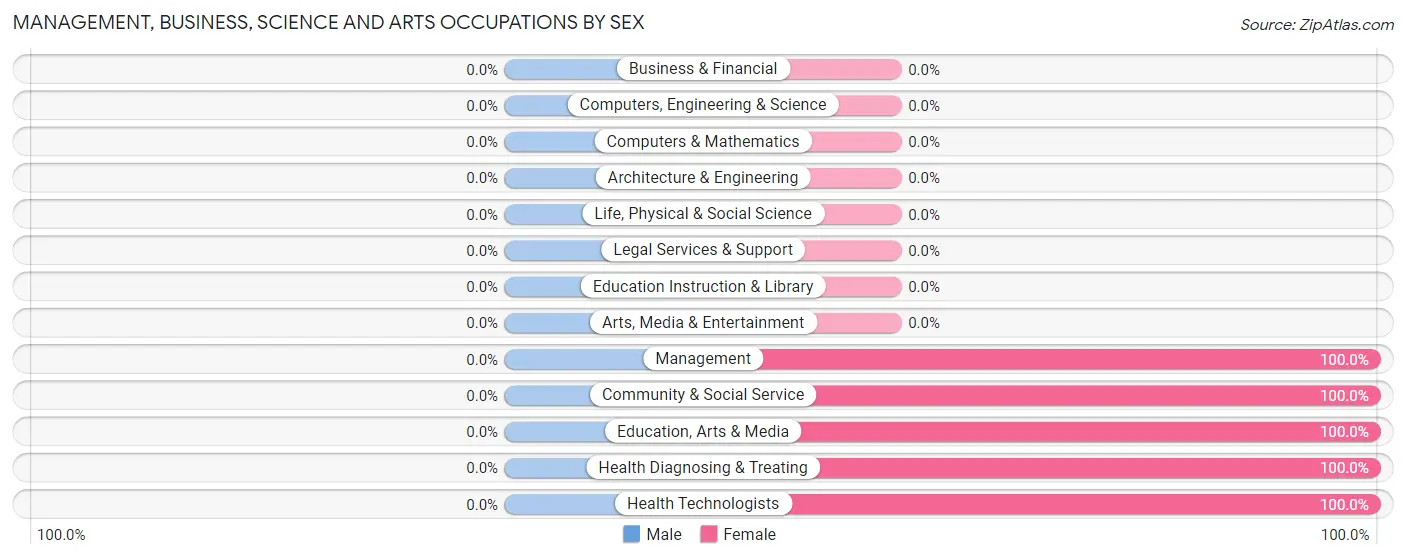
| Occupation | Male | Female |
| Management | 0 (0.0%) | 2 (100.0%) |
| Business & Financial | 0 (0.0%) | 0 (0.0%) |
| Computers, Engineering & Science | 0 (0.0%) | 0 (0.0%) |
| Computers & Mathematics | 0 (0.0%) | 0 (0.0%) |
| Architecture & Engineering | 0 (0.0%) | 0 (0.0%) |
| Life, Physical & Social Science | 0 (0.0%) | 0 (0.0%) |
| Community & Social Service | 0 (0.0%) | 3 (100.0%) |
| Education, Arts & Media | 0 (0.0%) | 3 (100.0%) |
| Legal Services & Support | 0 (0.0%) | 0 (0.0%) |
| Education Instruction & Library | 0 (0.0%) | 0 (0.0%) |
| Arts, Media & Entertainment | 0 (0.0%) | 0 (0.0%) |
| Health Diagnosing & Treating | 0 (0.0%) | 2 (100.0%) |
| Health Technologists | 0 (0.0%) | 2 (100.0%) |
| Total (Category) | 0 (0.0%) | 7 (100.0%) |
| Total (Overall) | 101 (53.4%) | 88 (46.6%) |
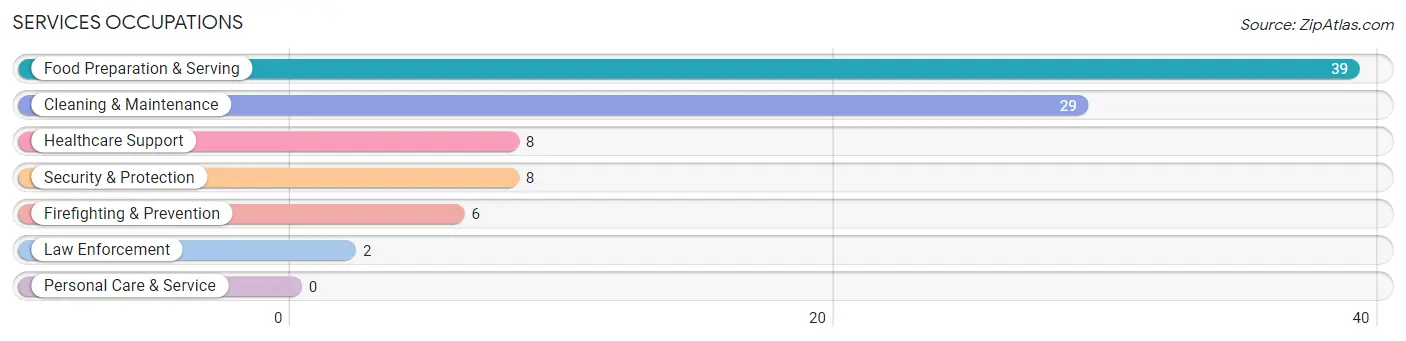
Services Occupations
The most common Services occupations in Palmer are Food Preparation & Serving (39 | 20.6%), Cleaning & Maintenance (29 | 15.3%), Healthcare Support (8 | 4.2%), Security & Protection (8 | 4.2%), and Firefighting & Prevention (6 | 3.2%).
Services Occupations by Sex
Within the Services occupations in Palmer, the most male-oriented occupations are Security & Protection (100.0%), Firefighting & Prevention (100.0%), and Law Enforcement (100.0%), while the most female-oriented occupations are Food Preparation & Serving (100.0%), Cleaning & Maintenance (31.0%), and Healthcare Support (25.0%).
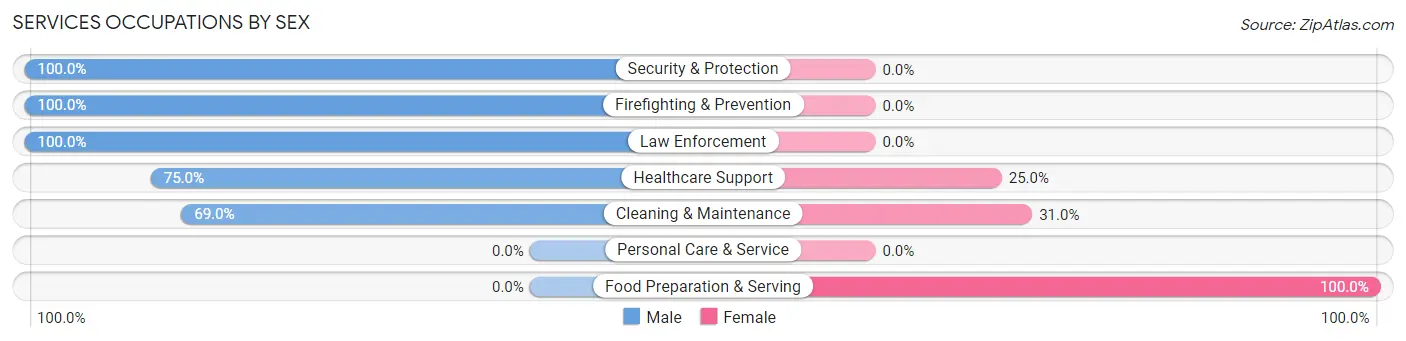
| Occupation | Male | Female |
| Healthcare Support | 6 (75.0%) | 2 (25.0%) |
| Security & Protection | 8 (100.0%) | 0 (0.0%) |
| Firefighting & Prevention | 6 (100.0%) | 0 (0.0%) |
| Law Enforcement | 2 (100.0%) | 0 (0.0%) |
| Food Preparation & Serving | 0 (0.0%) | 39 (100.0%) |
| Cleaning & Maintenance | 20 (69.0%) | 9 (31.0%) |
| Personal Care & Service | 0 (0.0%) | 0 (0.0%) |
| Total (Category) | 34 (40.5%) | 50 (59.5%) |
| Total (Overall) | 101 (53.4%) | 88 (46.6%) |
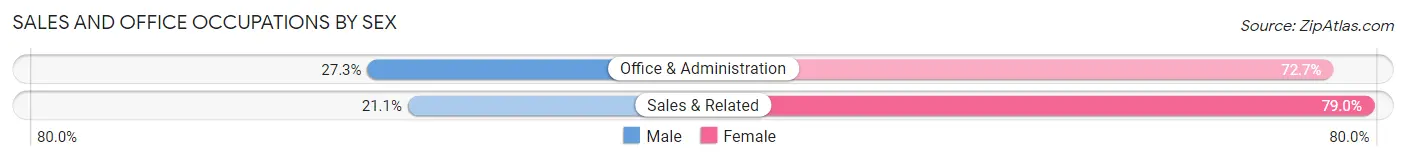
Sales and Office Occupations
The most common Sales and Office occupations in Palmer are Office & Administration (22 | 11.6%), and Sales & Related (19 | 10.1%).
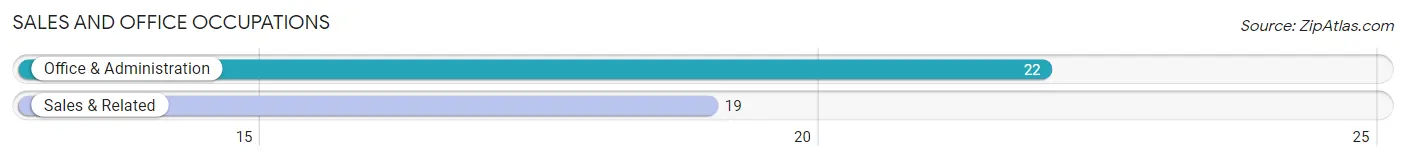
Sales and Office Occupations by Sex
| Occupation | Male | Female |
| Sales & Related | 4 (21.0%) | 15 (78.9%) |
| Office & Administration | 6 (27.3%) | 16 (72.7%) |
| Total (Category) | 10 (24.4%) | 31 (75.6%) |
| Total (Overall) | 101 (53.4%) | 88 (46.6%) |
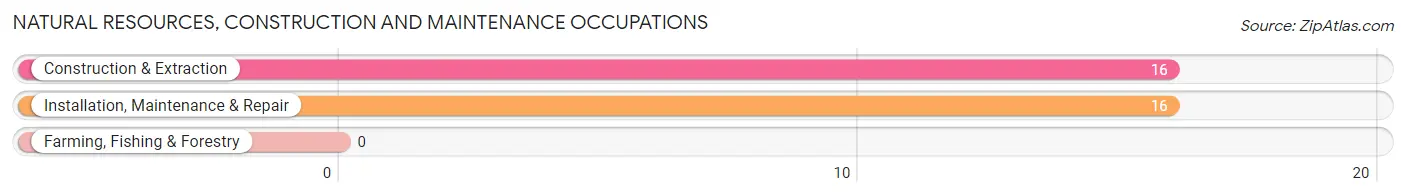
Natural Resources, Construction and Maintenance Occupations
The most common Natural Resources, Construction and Maintenance occupations in Palmer are Construction & Extraction (16 | 8.5%), and Installation, Maintenance & Repair (16 | 8.5%).
Natural Resources, Construction and Maintenance Occupations by Sex
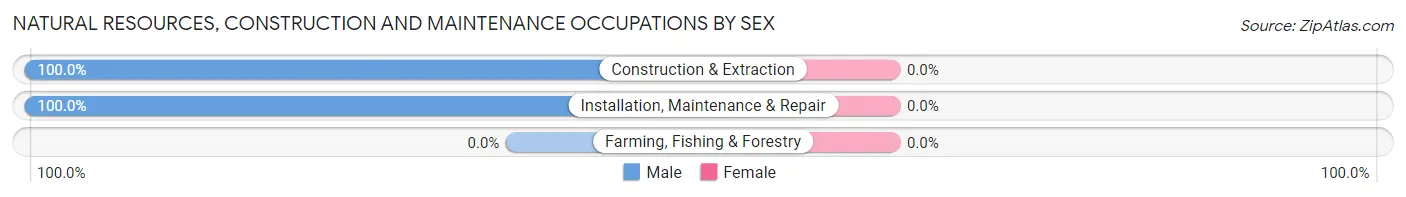
| Occupation | Male | Female |
| Farming, Fishing & Forestry | 0 (0.0%) | 0 (0.0%) |
| Construction & Extraction | 16 (100.0%) | 0 (0.0%) |
| Installation, Maintenance & Repair | 16 (100.0%) | 0 (0.0%) |
| Total (Category) | 32 (100.0%) | 0 (0.0%) |
| Total (Overall) | 101 (53.4%) | 88 (46.6%) |
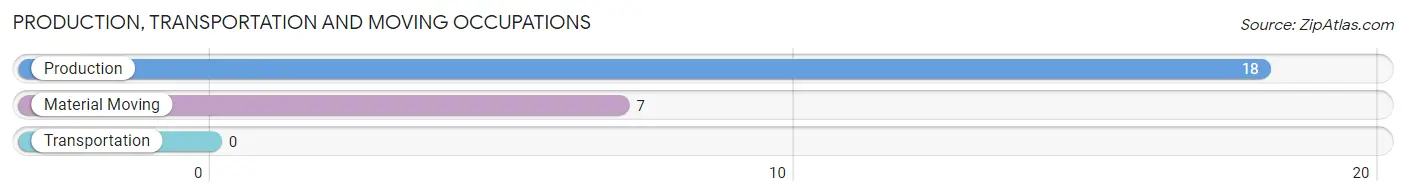
Production, Transportation and Moving Occupations
The most common Production, Transportation and Moving occupations in Palmer are Production (18 | 9.5%), and Material Moving (7 | 3.7%).
Production, Transportation and Moving Occupations by Sex
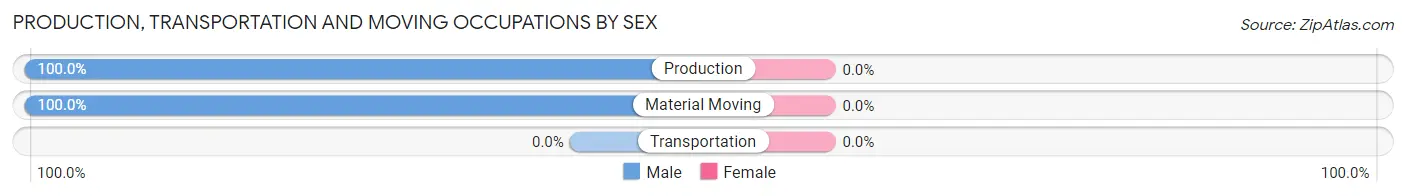
| Occupation | Male | Female |
| Production | 18 (100.0%) | 0 (0.0%) |
| Transportation | 0 (0.0%) | 0 (0.0%) |
| Material Moving | 7 (100.0%) | 0 (0.0%) |
| Total (Category) | 25 (100.0%) | 0 (0.0%) |
| Total (Overall) | 101 (53.4%) | 88 (46.6%) |
Employment Industries by Sex in Palmer
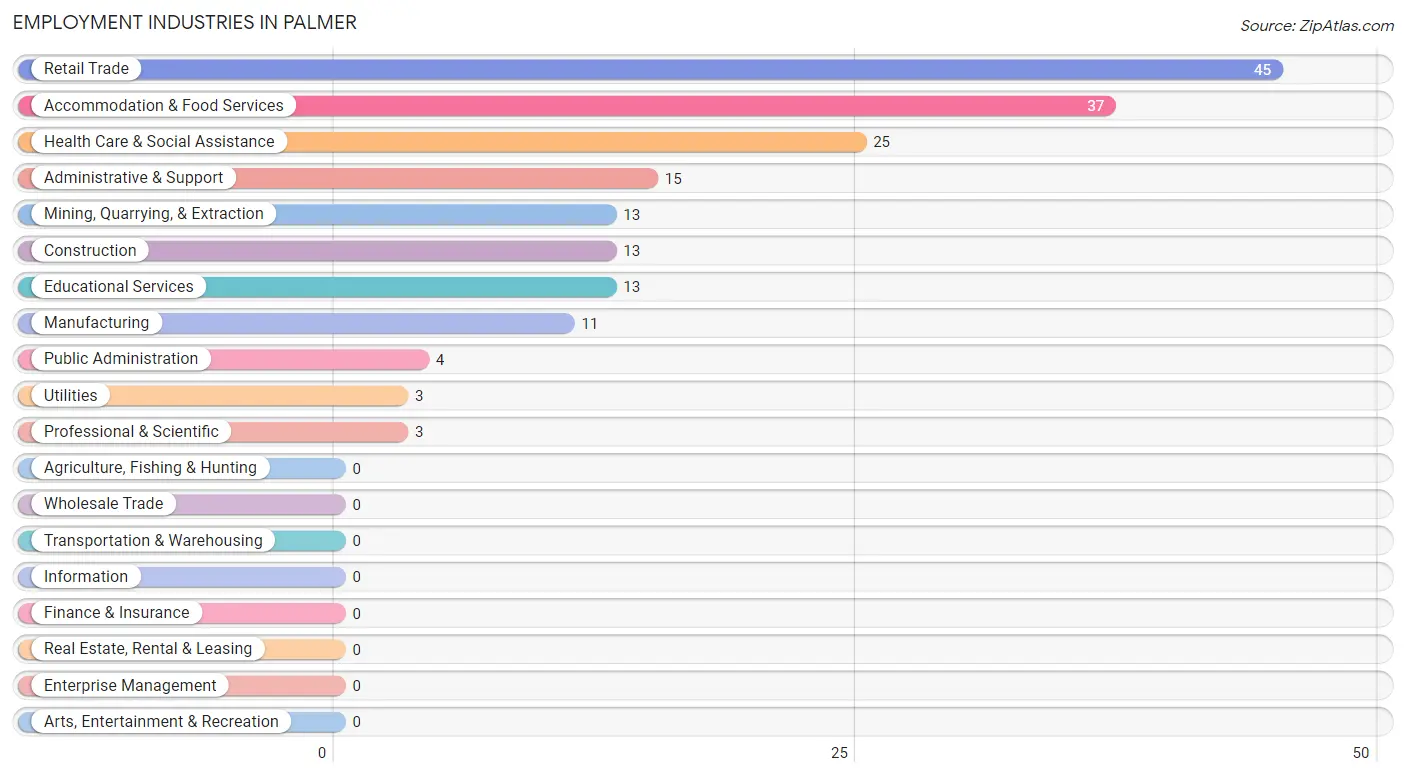
Employment Industries in Palmer
The major employment industries in Palmer include Retail Trade (45 | 23.8%), Accommodation & Food Services (37 | 19.6%), Health Care & Social Assistance (25 | 13.2%), Administrative & Support (15 | 7.9%), and Mining, Quarrying, & Extraction (13 | 6.9%).
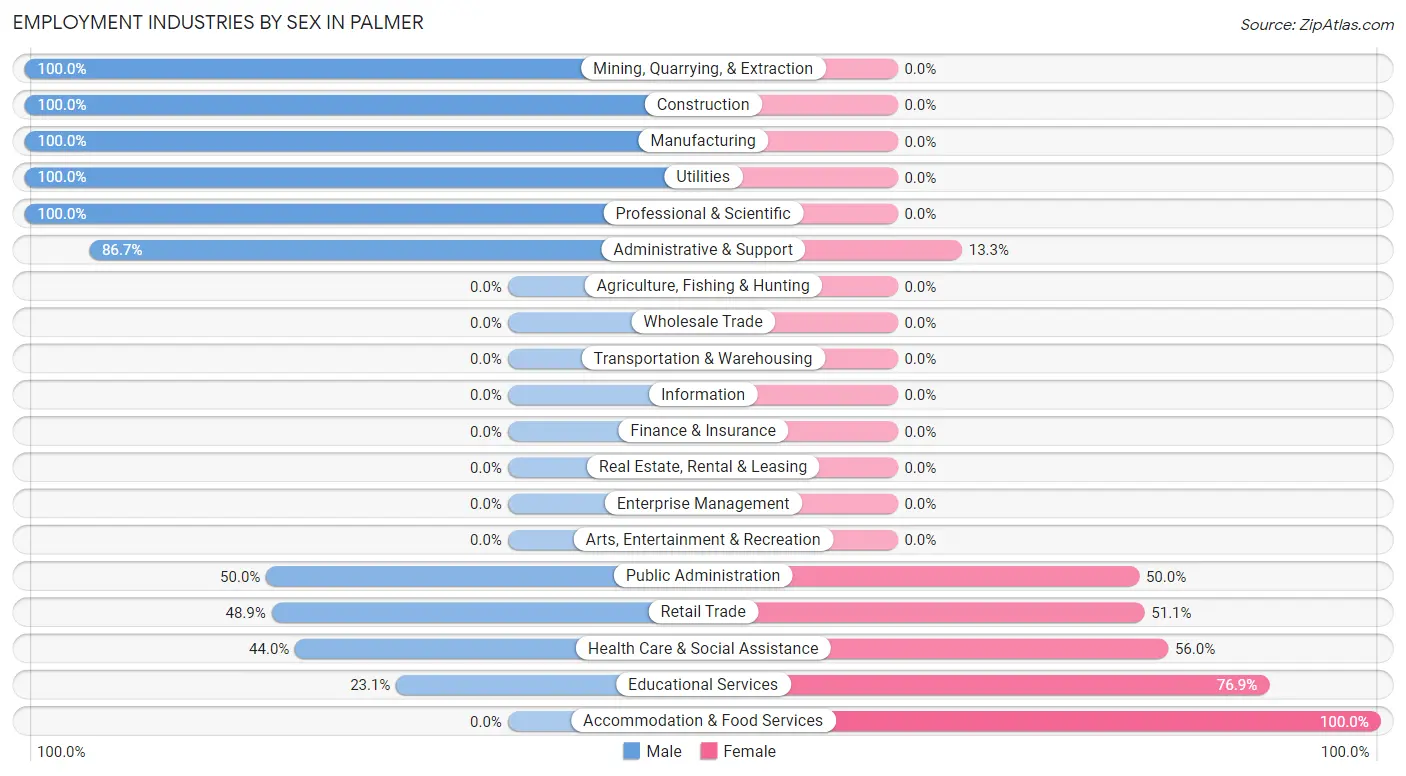
Employment Industries by Sex in Palmer
The Palmer industries that see more men than women are Mining, Quarrying, & Extraction (100.0%), Construction (100.0%), and Manufacturing (100.0%), whereas the industries that tend to have a higher number of women are Accommodation & Food Services (100.0%), Educational Services (76.9%), and Health Care & Social Assistance (56.0%).
| Industry | Male | Female |
| Agriculture, Fishing & Hunting | 0 (0.0%) | 0 (0.0%) |
| Mining, Quarrying, & Extraction | 13 (100.0%) | 0 (0.0%) |
| Construction | 13 (100.0%) | 0 (0.0%) |
| Manufacturing | 11 (100.0%) | 0 (0.0%) |
| Wholesale Trade | 0 (0.0%) | 0 (0.0%) |
| Retail Trade | 22 (48.9%) | 23 (51.1%) |
| Transportation & Warehousing | 0 (0.0%) | 0 (0.0%) |
| Utilities | 3 (100.0%) | 0 (0.0%) |
| Information | 0 (0.0%) | 0 (0.0%) |
| Finance & Insurance | 0 (0.0%) | 0 (0.0%) |
| Real Estate, Rental & Leasing | 0 (0.0%) | 0 (0.0%) |
| Professional & Scientific | 3 (100.0%) | 0 (0.0%) |
| Enterprise Management | 0 (0.0%) | 0 (0.0%) |
| Administrative & Support | 13 (86.7%) | 2 (13.3%) |
| Educational Services | 3 (23.1%) | 10 (76.9%) |
| Health Care & Social Assistance | 11 (44.0%) | 14 (56.0%) |
| Arts, Entertainment & Recreation | 0 (0.0%) | 0 (0.0%) |
| Accommodation & Food Services | 0 (0.0%) | 37 (100.0%) |
| Public Administration | 2 (50.0%) | 2 (50.0%) |
| Total | 101 (53.4%) | 88 (46.6%) |
Education in Palmer
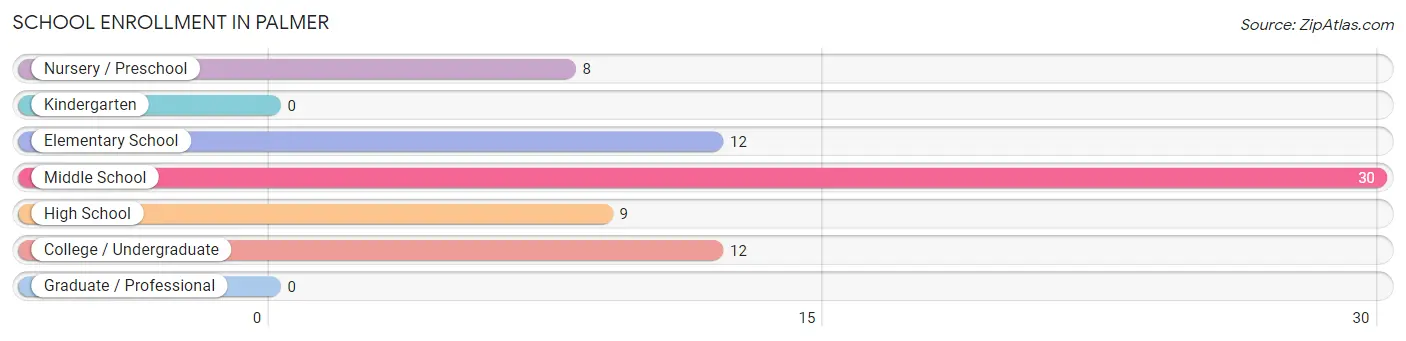
School Enrollment in Palmer
The most common levels of schooling among the 71 students in Palmer are middle school (30 | 42.2%), elementary school (12 | 16.9%), and college / undergraduate (12 | 16.9%).
| School Level | # Students | % Students |
| Nursery / Preschool | 8 | 11.3% |
| Kindergarten | 0 | 0.0% |
| Elementary School | 12 | 16.9% |
| Middle School | 30 | 42.2% |
| High School | 9 | 12.7% |
| College / Undergraduate | 12 | 16.9% |
| Graduate / Professional | 0 | 0.0% |
| Total | 71 | 100.0% |
School Enrollment by Age by Funding Source in Palmer
Out of a total of 71 students who are enrolled in schools in Palmer, 3 (4.2%) attend a private institution, while the remaining 68 (95.8%) are enrolled in public schools. The age group of 3 to 4 year olds has the highest likelihood of being enrolled in private schools, with 3 (100.0% in the age bracket) enrolled. Conversely, the age group of 5 to 9 year old has the lowest likelihood of being enrolled in a private school, with 17 (100.0% in the age bracket) attending a public institution.
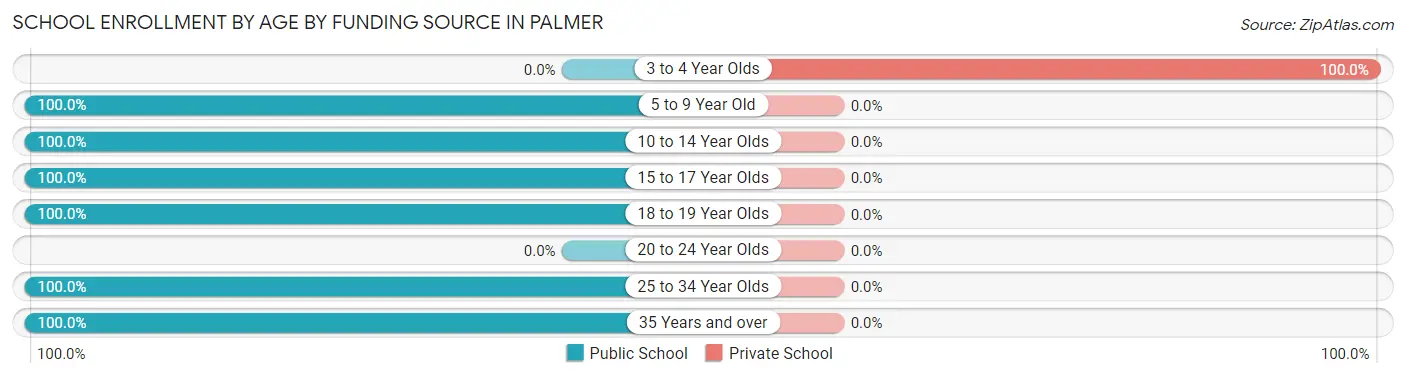
| Age Bracket | Public School | Private School |
| 3 to 4 Year Olds | 0 (0.0%) | 3 (100.0%) |
| 5 to 9 Year Old | 17 (100.0%) | 0 (0.0%) |
| 10 to 14 Year Olds | 30 (100.0%) | 0 (0.0%) |
| 15 to 17 Year Olds | 9 (100.0%) | 0 (0.0%) |
| 18 to 19 Year Olds | 2 (100.0%) | 0 (0.0%) |
| 20 to 24 Year Olds | 0 (0.0%) | 0 (0.0%) |
| 25 to 34 Year Olds | 6 (100.0%) | 0 (0.0%) |
| 35 Years and over | 4 (100.0%) | 0 (0.0%) |
| Total | 68 (95.8%) | 3 (4.2%) |
Educational Attainment by Field of Study in Palmer
Arts & humanities (6 | 35.3%), computers & mathematics (3 | 17.6%), business (3 | 17.6%), communications (3 | 17.6%), and science & technology (2 | 11.8%) are the most common fields of study among 17 individuals in Palmer who have obtained a bachelor's degree or higher.
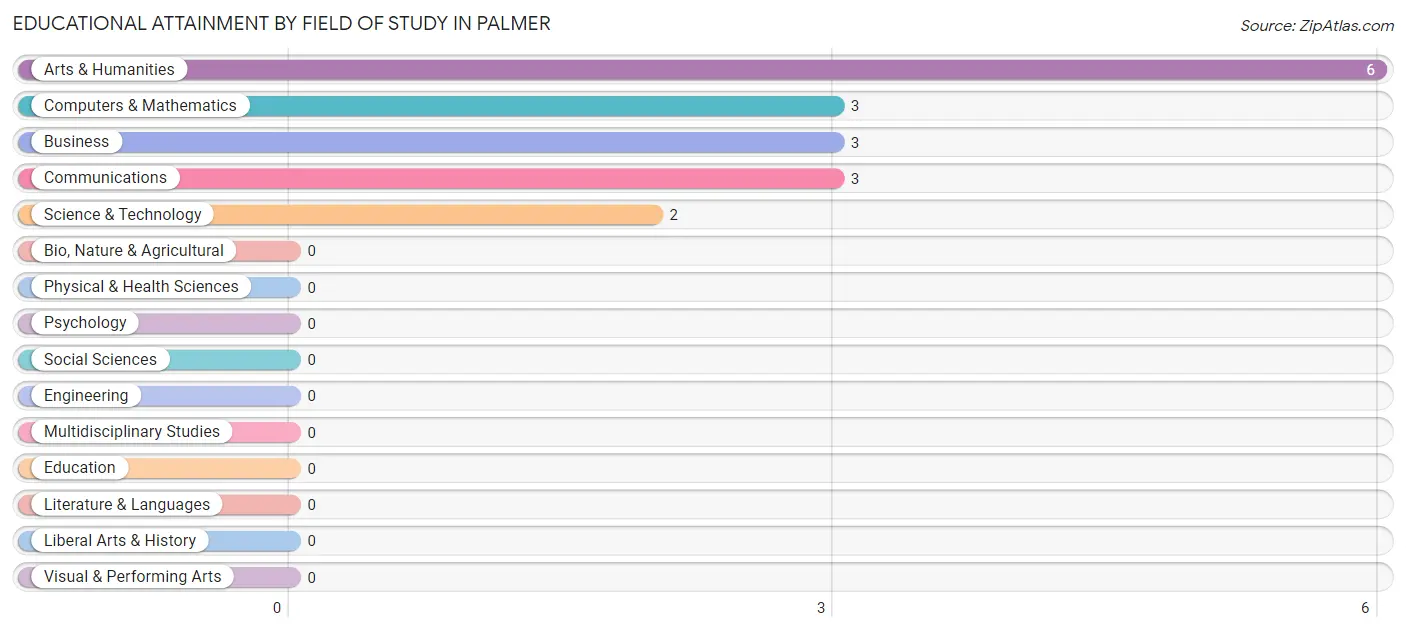
| Field of Study | # Graduates | % Graduates |
| Computers & Mathematics | 3 | 17.6% |
| Bio, Nature & Agricultural | 0 | 0.0% |
| Physical & Health Sciences | 0 | 0.0% |
| Psychology | 0 | 0.0% |
| Social Sciences | 0 | 0.0% |
| Engineering | 0 | 0.0% |
| Multidisciplinary Studies | 0 | 0.0% |
| Science & Technology | 2 | 11.8% |
| Business | 3 | 17.6% |
| Education | 0 | 0.0% |
| Literature & Languages | 0 | 0.0% |
| Liberal Arts & History | 0 | 0.0% |
| Visual & Performing Arts | 0 | 0.0% |
| Communications | 3 | 17.6% |
| Arts & Humanities | 6 | 35.3% |
| Total | 17 | 100.0% |
Transportation & Commute in Palmer
Vehicle Availability by Sex in Palmer
The most prevalent vehicle ownership categories in Palmer are males with 2 vehicles (43, accounting for 44.3%) and females with 2 vehicles (36, making up 50.0%).
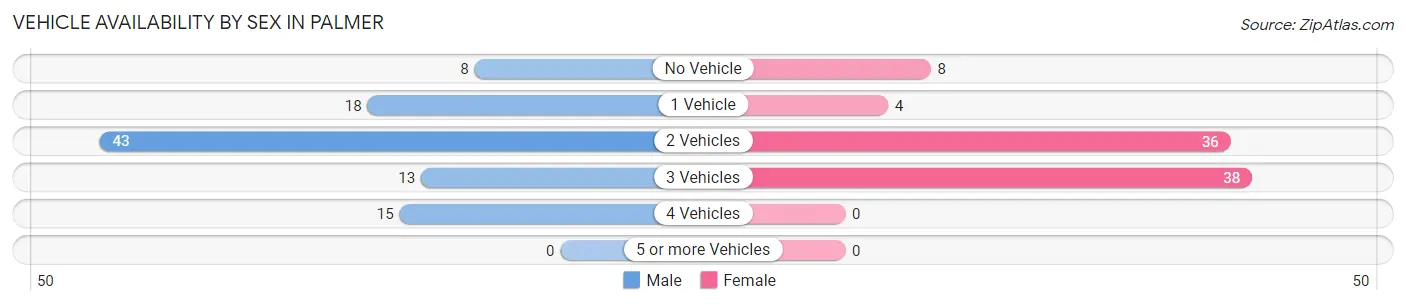
| Vehicles Available | Male | Female |
| No Vehicle | 8 (8.3%) | 8 (9.3%) |
| 1 Vehicle | 18 (18.6%) | 4 (4.6%) |
| 2 Vehicles | 43 (44.3%) | 36 (41.9%) |
| 3 Vehicles | 13 (13.4%) | 38 (44.2%) |
| 4 Vehicles | 15 (15.5%) | 0 (0.0%) |
| 5 or more Vehicles | 0 (0.0%) | 0 (0.0%) |
| Total | 97 (100.0%) | 86 (100.0%) |
Commute Time in Palmer
The most frequently occuring commute durations in Palmer are 20 to 24 minutes (57 commuters, 32.4%), 15 to 19 minutes (27 commuters, 15.3%), and 30 to 34 minutes (27 commuters, 15.3%).
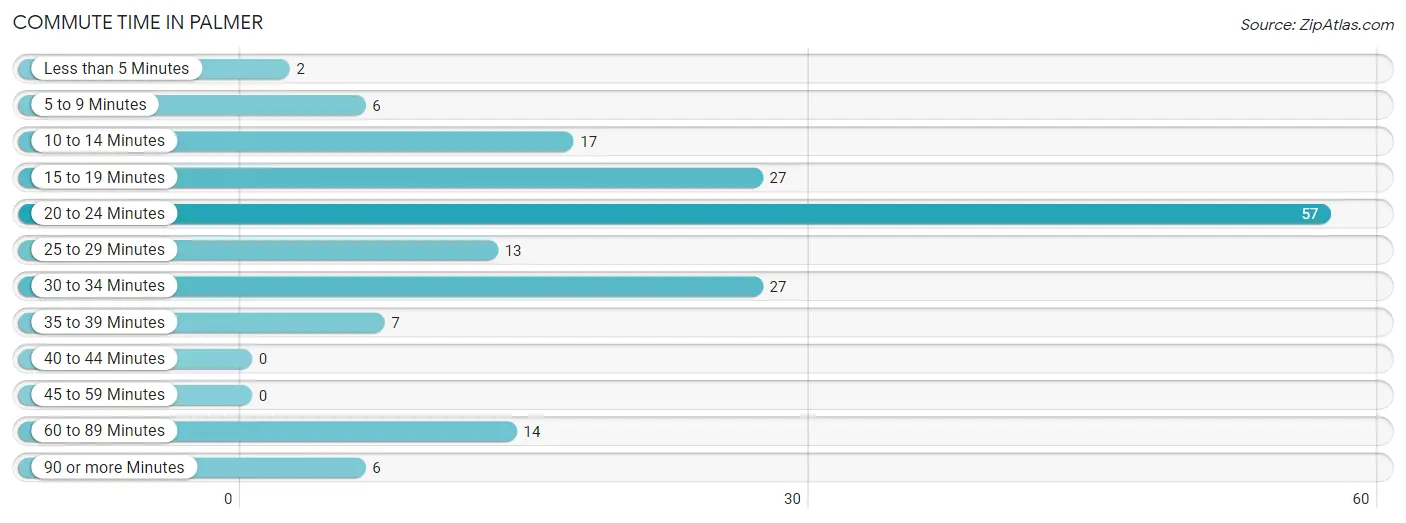
| Commute Time | # Commuters | % Commuters |
| Less than 5 Minutes | 2 | 1.1% |
| 5 to 9 Minutes | 6 | 3.4% |
| 10 to 14 Minutes | 17 | 9.7% |
| 15 to 19 Minutes | 27 | 15.3% |
| 20 to 24 Minutes | 57 | 32.4% |
| 25 to 29 Minutes | 13 | 7.4% |
| 30 to 34 Minutes | 27 | 15.3% |
| 35 to 39 Minutes | 7 | 4.0% |
| 40 to 44 Minutes | 0 | 0.0% |
| 45 to 59 Minutes | 0 | 0.0% |
| 60 to 89 Minutes | 14 | 8.0% |
| 90 or more Minutes | 6 | 3.4% |
Commute Time by Sex in Palmer
The most common commute times in Palmer are 20 to 24 minutes (31 commuters, 34.4%) for males and 20 to 24 minutes (26 commuters, 30.2%) for females.
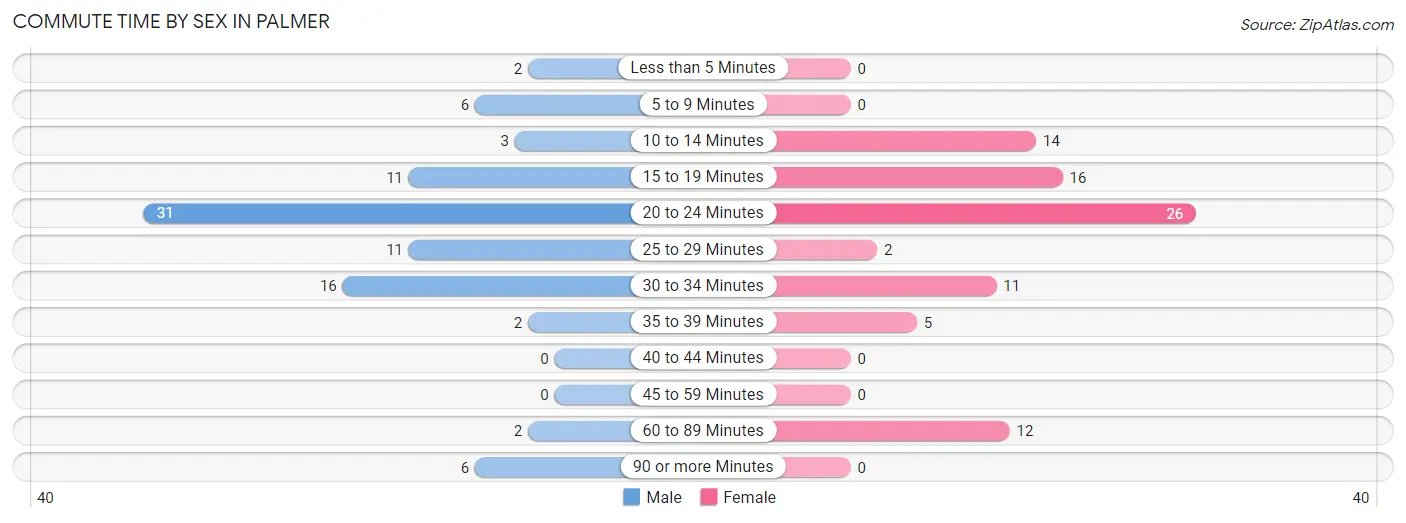
| Commute Time | Male | Female |
| Less than 5 Minutes | 2 (2.2%) | 0 (0.0%) |
| 5 to 9 Minutes | 6 (6.7%) | 0 (0.0%) |
| 10 to 14 Minutes | 3 (3.3%) | 14 (16.3%) |
| 15 to 19 Minutes | 11 (12.2%) | 16 (18.6%) |
| 20 to 24 Minutes | 31 (34.4%) | 26 (30.2%) |
| 25 to 29 Minutes | 11 (12.2%) | 2 (2.3%) |
| 30 to 34 Minutes | 16 (17.8%) | 11 (12.8%) |
| 35 to 39 Minutes | 2 (2.2%) | 5 (5.8%) |
| 40 to 44 Minutes | 0 (0.0%) | 0 (0.0%) |
| 45 to 59 Minutes | 0 (0.0%) | 0 (0.0%) |
| 60 to 89 Minutes | 2 (2.2%) | 12 (14.0%) |
| 90 or more Minutes | 6 (6.7%) | 0 (0.0%) |
Time of Departure to Work by Sex in Palmer
The most frequent times of departure to work in Palmer are 4:00 PM to 11:59 PM (18, 20.0%) for males and 8:00 AM to 8:29 AM (29, 33.7%) for females.
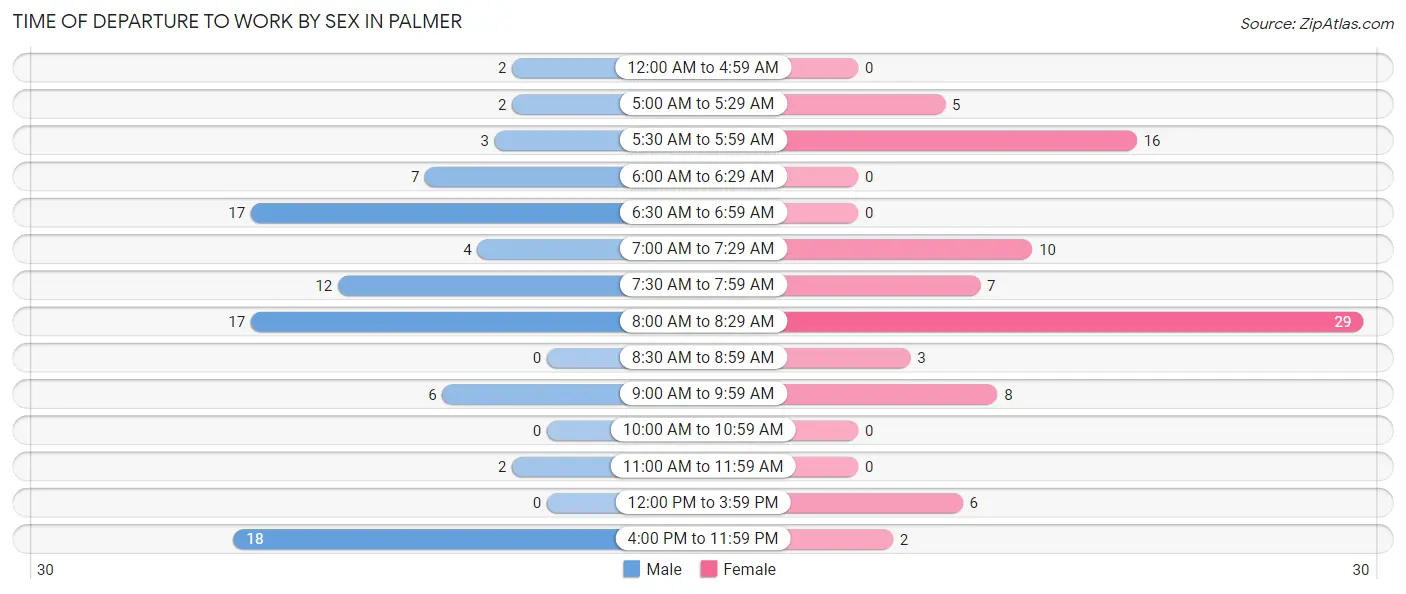
| Time of Departure | Male | Female |
| 12:00 AM to 4:59 AM | 2 (2.2%) | 0 (0.0%) |
| 5:00 AM to 5:29 AM | 2 (2.2%) | 5 (5.8%) |
| 5:30 AM to 5:59 AM | 3 (3.3%) | 16 (18.6%) |
| 6:00 AM to 6:29 AM | 7 (7.8%) | 0 (0.0%) |
| 6:30 AM to 6:59 AM | 17 (18.9%) | 0 (0.0%) |
| 7:00 AM to 7:29 AM | 4 (4.4%) | 10 (11.6%) |
| 7:30 AM to 7:59 AM | 12 (13.3%) | 7 (8.1%) |
| 8:00 AM to 8:29 AM | 17 (18.9%) | 29 (33.7%) |
| 8:30 AM to 8:59 AM | 0 (0.0%) | 3 (3.5%) |
| 9:00 AM to 9:59 AM | 6 (6.7%) | 8 (9.3%) |
| 10:00 AM to 10:59 AM | 0 (0.0%) | 0 (0.0%) |
| 11:00 AM to 11:59 AM | 2 (2.2%) | 0 (0.0%) |
| 12:00 PM to 3:59 PM | 0 (0.0%) | 6 (7.0%) |
| 4:00 PM to 11:59 PM | 18 (20.0%) | 2 (2.3%) |
| Total | 90 (100.0%) | 86 (100.0%) |
Housing Occupancy in Palmer
Occupancy by Ownership in Palmer
Of the total 136 dwellings in Palmer, owner-occupied units account for 125 (91.9%), while renter-occupied units make up 11 (8.1%).
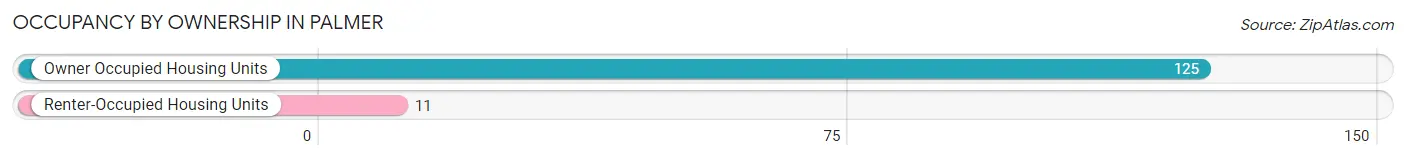
| Occupancy | # Housing Units | % Housing Units |
| Owner Occupied Housing Units | 125 | 91.9% |
| Renter-Occupied Housing Units | 11 | 8.1% |
| Total Occupied Housing Units | 136 | 100.0% |
Occupancy by Household Size in Palmer
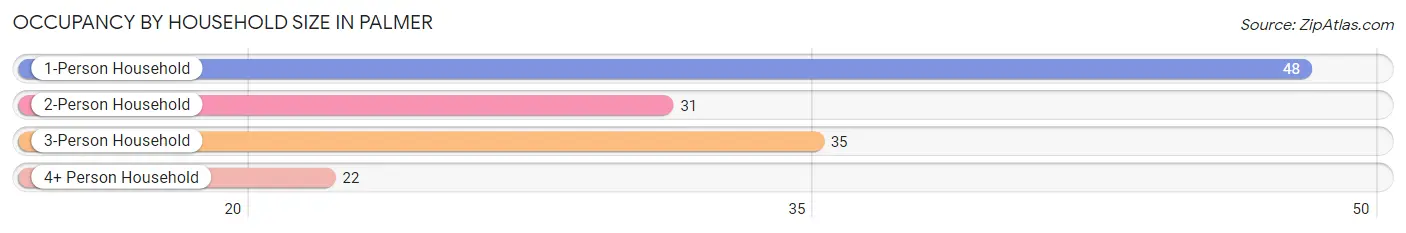
| Household Size | # Housing Units | % Housing Units |
| 1-Person Household | 48 | 35.3% |
| 2-Person Household | 31 | 22.8% |
| 3-Person Household | 35 | 25.7% |
| 4+ Person Household | 22 | 16.2% |
| Total Housing Units | 136 | 100.0% |
Occupancy by Ownership by Household Size in Palmer
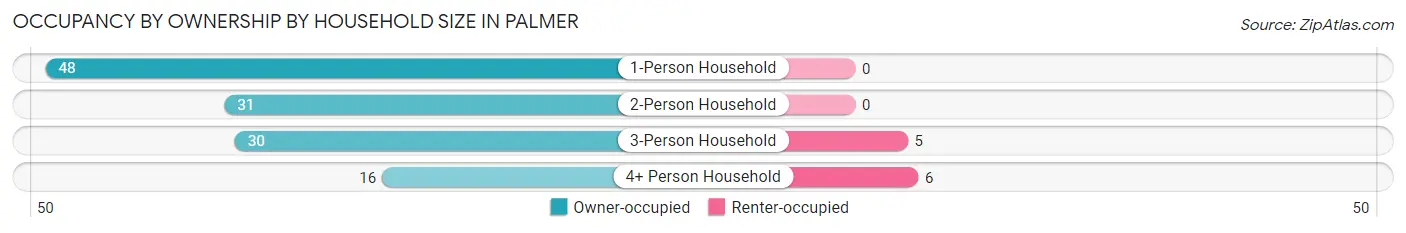
| Household Size | Owner-occupied | Renter-occupied |
| 1-Person Household | 48 (100.0%) | 0 (0.0%) |
| 2-Person Household | 31 (100.0%) | 0 (0.0%) |
| 3-Person Household | 30 (85.7%) | 5 (14.3%) |
| 4+ Person Household | 16 (72.7%) | 6 (27.3%) |
| Total Housing Units | 125 (91.9%) | 11 (8.1%) |
Occupancy by Educational Attainment in Palmer
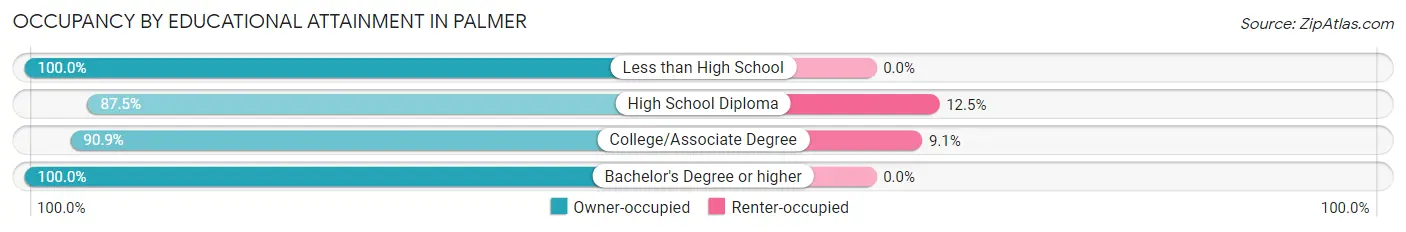
| Household Size | Owner-occupied | Renter-occupied |
| Less than High School | 18 (100.0%) | 0 (0.0%) |
| High School Diploma | 35 (87.5%) | 5 (12.5%) |
| College/Associate Degree | 60 (90.9%) | 6 (9.1%) |
| Bachelor's Degree or higher | 12 (100.0%) | 0 (0.0%) |
Occupancy by Age of Householder in Palmer
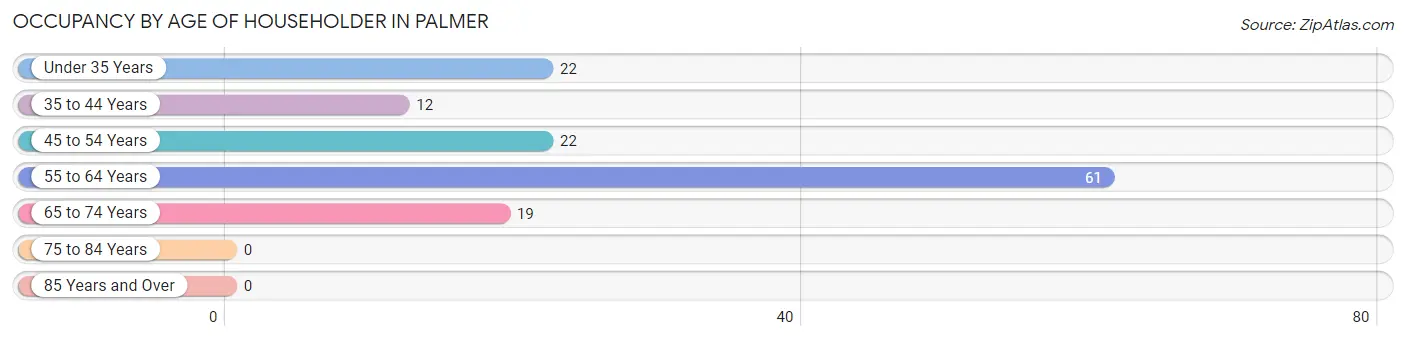
| Age Bracket | # Households | % Households |
| Under 35 Years | 22 | 16.2% |
| 35 to 44 Years | 12 | 8.8% |
| 45 to 54 Years | 22 | 16.2% |
| 55 to 64 Years | 61 | 44.9% |
| 65 to 74 Years | 19 | 14.0% |
| 75 to 84 Years | 0 | 0.0% |
| 85 Years and Over | 0 | 0.0% |
| Total | 136 | 100.0% |
Housing Finances in Palmer
Median Income by Occupancy in Palmer
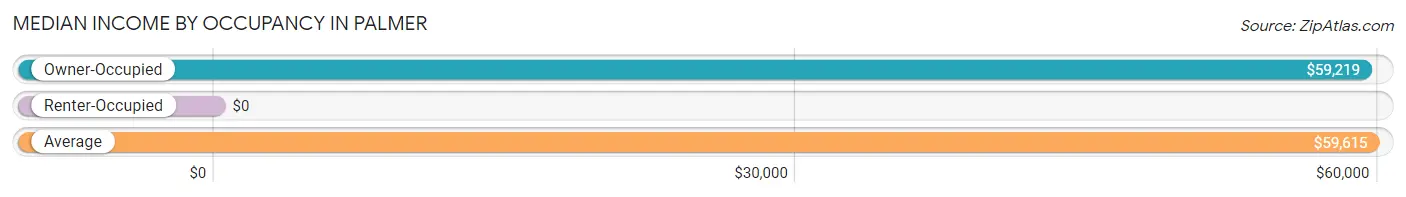
| Occupancy Type | # Households | Median Income |
| Owner-Occupied | 125 (91.9%) | $59,219 |
| Renter-Occupied | 11 (8.1%) | $0 |
| Average | 136 (100.0%) | $59,615 |
Occupancy by Householder Income Bracket in Palmer
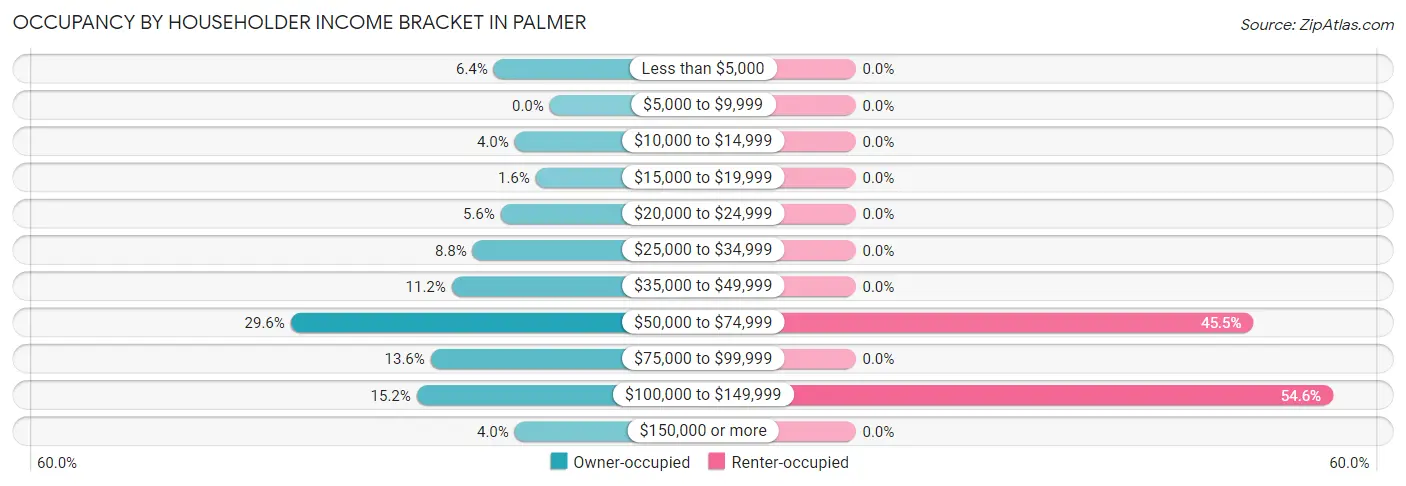
| Income Bracket | Owner-occupied | Renter-occupied |
| Less than $5,000 | 8 (6.4%) | 0 (0.0%) |
| $5,000 to $9,999 | 0 (0.0%) | 0 (0.0%) |
| $10,000 to $14,999 | 5 (4.0%) | 0 (0.0%) |
| $15,000 to $19,999 | 2 (1.6%) | 0 (0.0%) |
| $20,000 to $24,999 | 7 (5.6%) | 0 (0.0%) |
| $25,000 to $34,999 | 11 (8.8%) | 0 (0.0%) |
| $35,000 to $49,999 | 14 (11.2%) | 0 (0.0%) |
| $50,000 to $74,999 | 37 (29.6%) | 5 (45.5%) |
| $75,000 to $99,999 | 17 (13.6%) | 0 (0.0%) |
| $100,000 to $149,999 | 19 (15.2%) | 6 (54.5%) |
| $150,000 or more | 5 (4.0%) | 0 (0.0%) |
| Total | 125 (100.0%) | 11 (100.0%) |
Monthly Housing Cost Tiers in Palmer
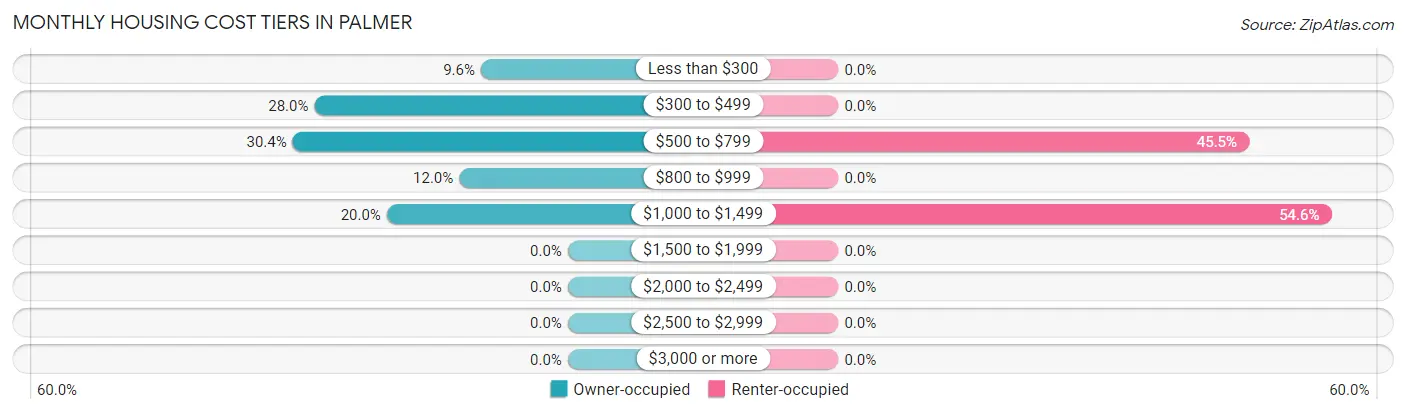
| Monthly Cost | Owner-occupied | Renter-occupied |
| Less than $300 | 12 (9.6%) | 0 (0.0%) |
| $300 to $499 | 35 (28.0%) | 0 (0.0%) |
| $500 to $799 | 38 (30.4%) | 5 (45.5%) |
| $800 to $999 | 15 (12.0%) | 0 (0.0%) |
| $1,000 to $1,499 | 25 (20.0%) | 6 (54.5%) |
| $1,500 to $1,999 | 0 (0.0%) | 0 (0.0%) |
| $2,000 to $2,499 | 0 (0.0%) | 0 (0.0%) |
| $2,500 to $2,999 | 0 (0.0%) | 0 (0.0%) |
| $3,000 or more | 0 (0.0%) | 0 (0.0%) |
| Total | 125 (100.0%) | 11 (100.0%) |
Physical Housing Characteristics in Palmer
Housing Structures in Palmer
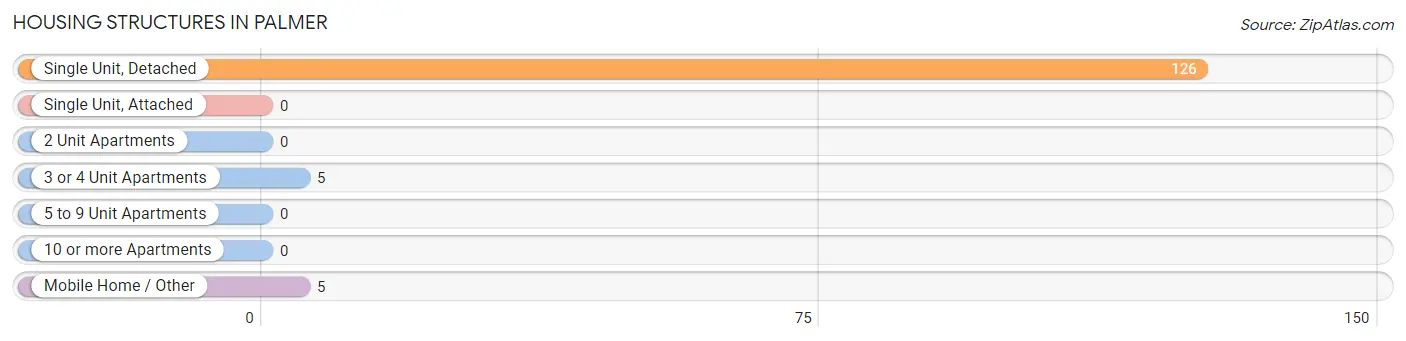
| Structure Type | # Housing Units | % Housing Units |
| Single Unit, Detached | 126 | 92.6% |
| Single Unit, Attached | 0 | 0.0% |
| 2 Unit Apartments | 0 | 0.0% |
| 3 or 4 Unit Apartments | 5 | 3.7% |
| 5 to 9 Unit Apartments | 0 | 0.0% |
| 10 or more Apartments | 0 | 0.0% |
| Mobile Home / Other | 5 | 3.7% |
| Total | 136 | 100.0% |
Housing Structures by Occupancy in Palmer
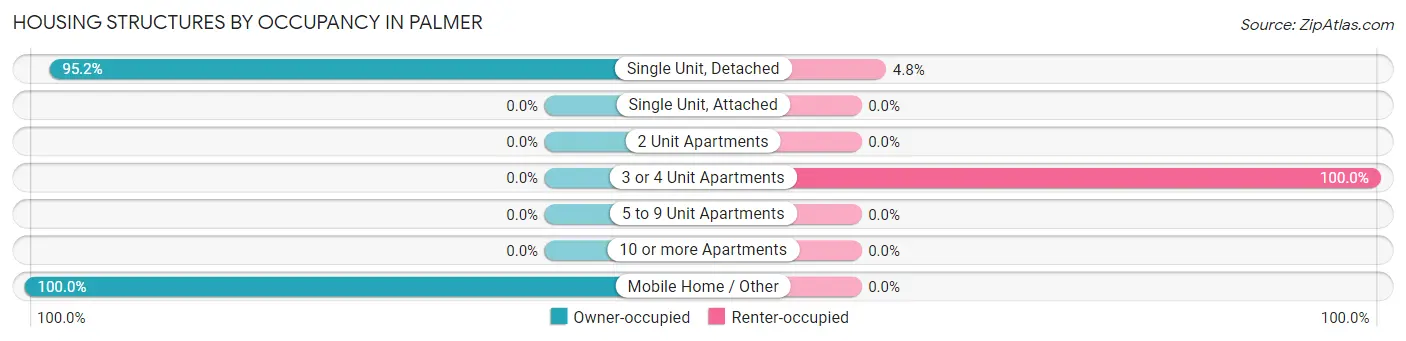
| Structure Type | Owner-occupied | Renter-occupied |
| Single Unit, Detached | 120 (95.2%) | 6 (4.8%) |
| Single Unit, Attached | 0 (0.0%) | 0 (0.0%) |
| 2 Unit Apartments | 0 (0.0%) | 0 (0.0%) |
| 3 or 4 Unit Apartments | 0 (0.0%) | 5 (100.0%) |
| 5 to 9 Unit Apartments | 0 (0.0%) | 0 (0.0%) |
| 10 or more Apartments | 0 (0.0%) | 0 (0.0%) |
| Mobile Home / Other | 5 (100.0%) | 0 (0.0%) |
| Total | 125 (91.9%) | 11 (8.1%) |
Housing Structures by Number of Rooms in Palmer
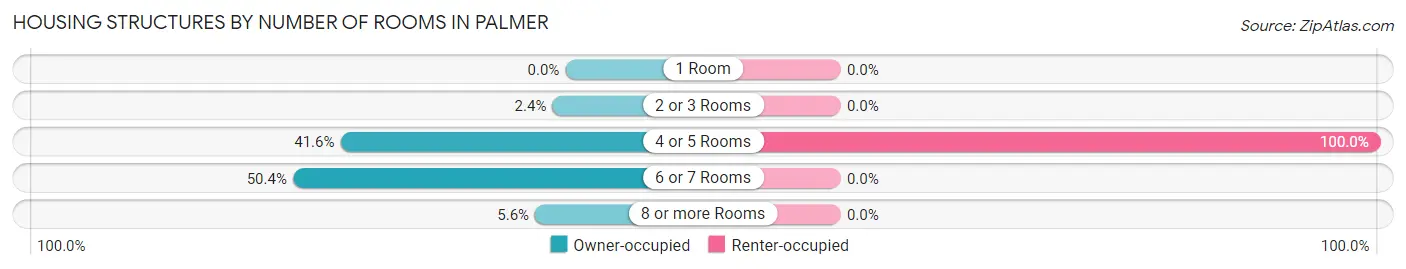
| Number of Rooms | Owner-occupied | Renter-occupied |
| 1 Room | 0 (0.0%) | 0 (0.0%) |
| 2 or 3 Rooms | 3 (2.4%) | 0 (0.0%) |
| 4 or 5 Rooms | 52 (41.6%) | 11 (100.0%) |
| 6 or 7 Rooms | 63 (50.4%) | 0 (0.0%) |
| 8 or more Rooms | 7 (5.6%) | 0 (0.0%) |
| Total | 125 (100.0%) | 11 (100.0%) |
Housing Structure by Heating Type in Palmer
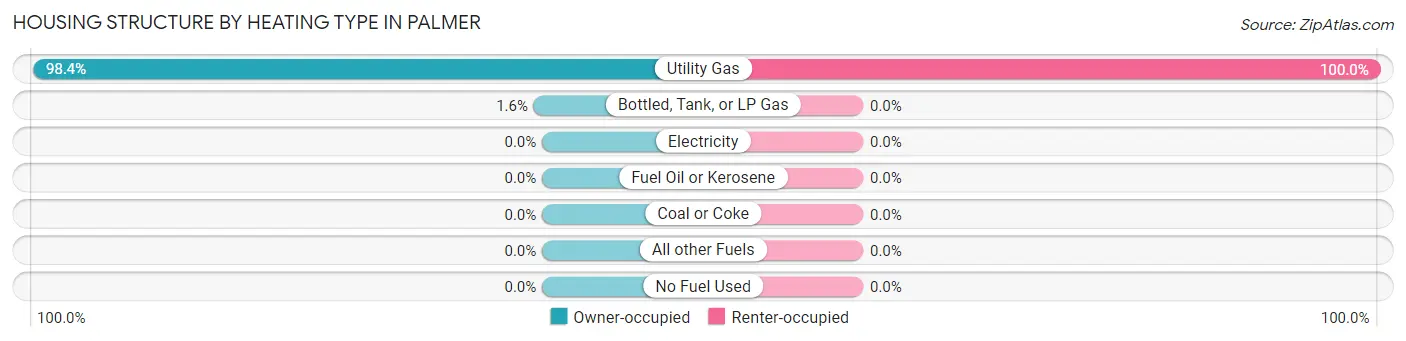
| Heating Type | Owner-occupied | Renter-occupied |
| Utility Gas | 123 (98.4%) | 11 (100.0%) |
| Bottled, Tank, or LP Gas | 2 (1.6%) | 0 (0.0%) |
| Electricity | 0 (0.0%) | 0 (0.0%) |
| Fuel Oil or Kerosene | 0 (0.0%) | 0 (0.0%) |
| Coal or Coke | 0 (0.0%) | 0 (0.0%) |
| All other Fuels | 0 (0.0%) | 0 (0.0%) |
| No Fuel Used | 0 (0.0%) | 0 (0.0%) |
| Total | 125 (100.0%) | 11 (100.0%) |
Household Vehicle Usage in Palmer
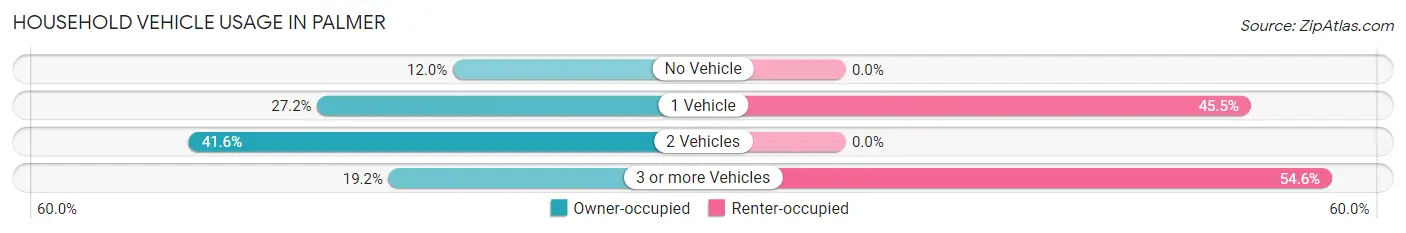
| Vehicles per Household | Owner-occupied | Renter-occupied |
| No Vehicle | 15 (12.0%) | 0 (0.0%) |
| 1 Vehicle | 34 (27.2%) | 5 (45.5%) |
| 2 Vehicles | 52 (41.6%) | 0 (0.0%) |
| 3 or more Vehicles | 24 (19.2%) | 6 (54.5%) |
| Total | 125 (100.0%) | 11 (100.0%) |
Real Estate & Mortgages in Palmer
Real Estate and Mortgage Overview in Palmer
| Characteristic | Without Mortgage | With Mortgage |
| Housing Units | 56 | 69 |
| Median Property Value | $67,100 | $68,800 |
| Median Household Income | $51,563 | $2 |
| Monthly Housing Costs | $373 | $0 |
| Real Estate Taxes | $750 | $14 |
Property Value by Mortgage Status in Palmer
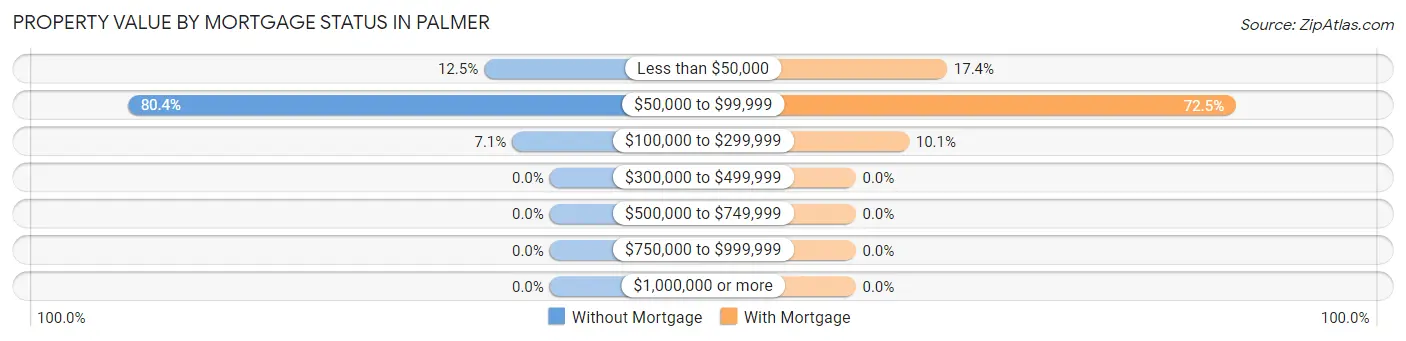
| Property Value | Without Mortgage | With Mortgage |
| Less than $50,000 | 7 (12.5%) | 12 (17.4%) |
| $50,000 to $99,999 | 45 (80.4%) | 50 (72.5%) |
| $100,000 to $299,999 | 4 (7.1%) | 7 (10.1%) |
| $300,000 to $499,999 | 0 (0.0%) | 0 (0.0%) |
| $500,000 to $749,999 | 0 (0.0%) | 0 (0.0%) |
| $750,000 to $999,999 | 0 (0.0%) | 0 (0.0%) |
| $1,000,000 or more | 0 (0.0%) | 0 (0.0%) |
| Total | 56 (100.0%) | 69 (100.0%) |
Household Income by Mortgage Status in Palmer
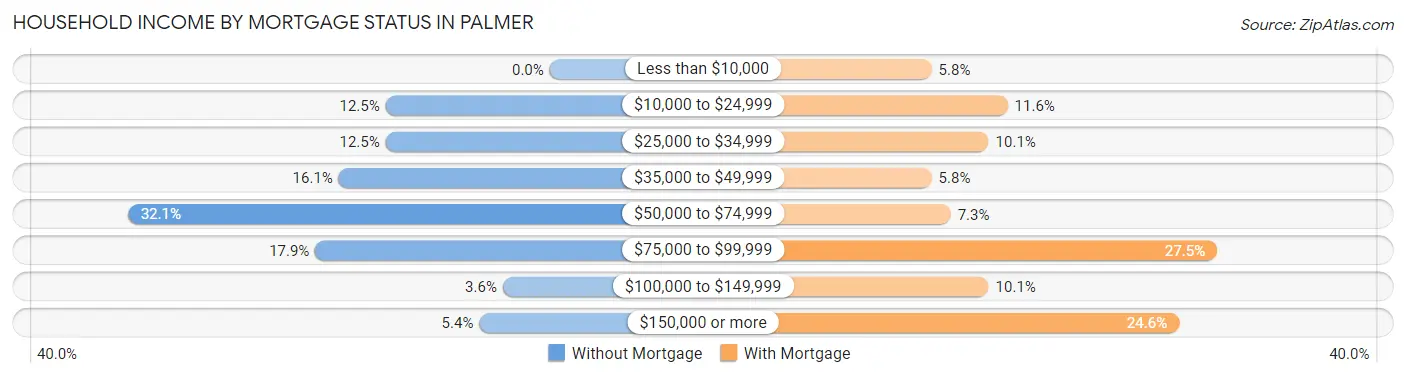
| Household Income | Without Mortgage | With Mortgage |
| Less than $10,000 | 0 (0.0%) | 4 (5.8%) |
| $10,000 to $24,999 | 7 (12.5%) | 8 (11.6%) |
| $25,000 to $34,999 | 7 (12.5%) | 7 (10.1%) |
| $35,000 to $49,999 | 9 (16.1%) | 4 (5.8%) |
| $50,000 to $74,999 | 18 (32.1%) | 5 (7.2%) |
| $75,000 to $99,999 | 10 (17.9%) | 19 (27.5%) |
| $100,000 to $149,999 | 2 (3.6%) | 7 (10.1%) |
| $150,000 or more | 3 (5.4%) | 17 (24.6%) |
| Total | 56 (100.0%) | 69 (100.0%) |
Property Value to Household Income Ratio in Palmer
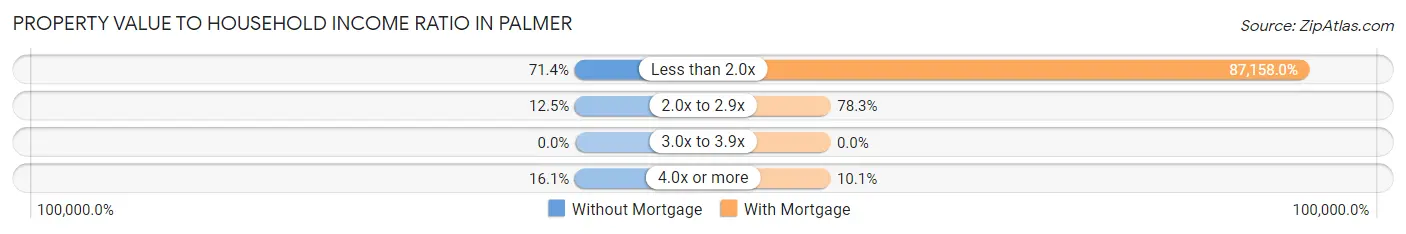
| Value-to-Income Ratio | Without Mortgage | With Mortgage |
| Less than 2.0x | 40 (71.4%) | 60,139 (87,158.0%) |
| 2.0x to 2.9x | 7 (12.5%) | 54 (78.3%) |
| 3.0x to 3.9x | 0 (0.0%) | 0 (0.0%) |
| 4.0x or more | 9 (16.1%) | 7 (10.1%) |
| Total | 56 (100.0%) | 69 (100.0%) |
Real Estate Taxes by Mortgage Status in Palmer
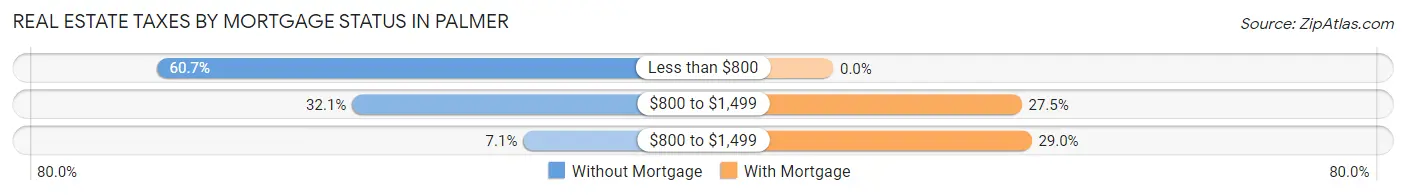
| Property Taxes | Without Mortgage | With Mortgage |
| Less than $800 | 34 (60.7%) | 0 (0.0%) |
| $800 to $1,499 | 18 (32.1%) | 19 (27.5%) |
| $800 to $1,499 | 4 (7.1%) | 20 (29.0%) |
| Total | 56 (100.0%) | 69 (100.0%) |
Health & Disability in Palmer
Health Insurance Coverage by Age in Palmer
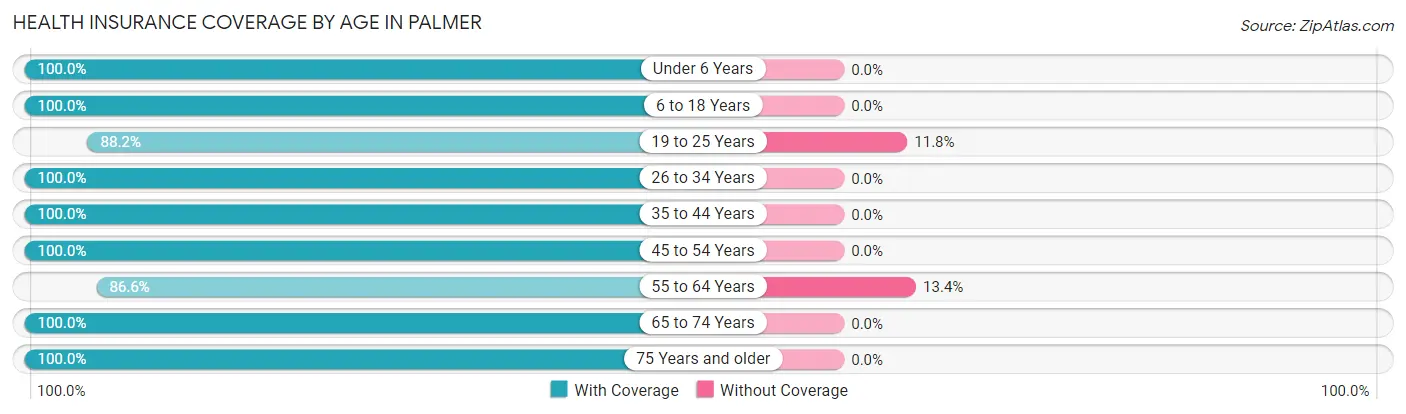
| Age Bracket | With Coverage | Without Coverage |
| Under 6 Years | 18 (100.0%) | 0 (0.0%) |
| 6 to 18 Years | 53 (100.0%) | 0 (0.0%) |
| 19 to 25 Years | 30 (88.2%) | 4 (11.8%) |
| 26 to 34 Years | 46 (100.0%) | 0 (0.0%) |
| 35 to 44 Years | 40 (100.0%) | 0 (0.0%) |
| 45 to 54 Years | 53 (100.0%) | 0 (0.0%) |
| 55 to 64 Years | 84 (86.6%) | 13 (13.4%) |
| 65 to 74 Years | 33 (100.0%) | 0 (0.0%) |
| 75 Years and older | 4 (100.0%) | 0 (0.0%) |
| Total | 361 (95.5%) | 17 (4.5%) |
Health Insurance Coverage by Citizenship Status in Palmer
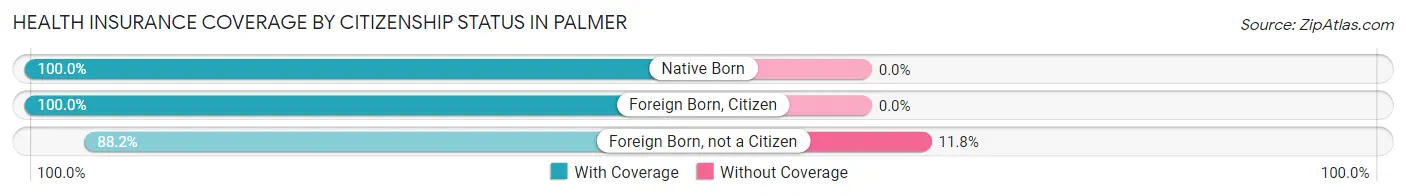
| Citizenship Status | With Coverage | Without Coverage |
| Native Born | 18 (100.0%) | 0 (0.0%) |
| Foreign Born, Citizen | 53 (100.0%) | 0 (0.0%) |
| Foreign Born, not a Citizen | 30 (88.2%) | 4 (11.8%) |
Health Insurance Coverage by Household Income in Palmer
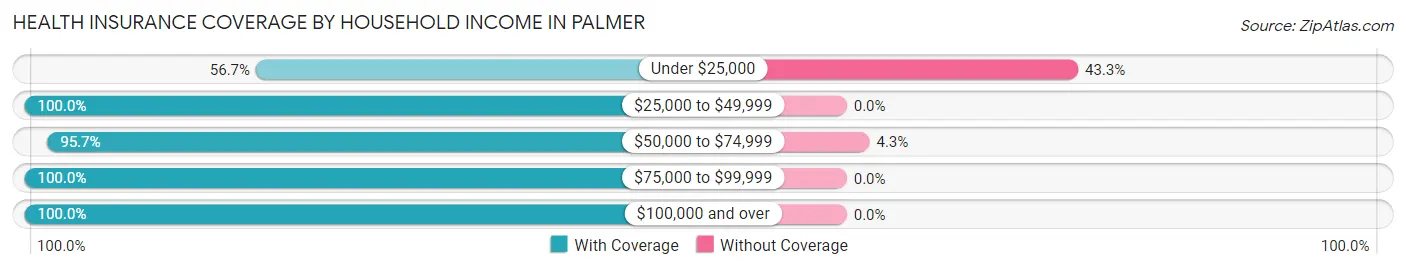
| Household Income | With Coverage | Without Coverage |
| Under $25,000 | 17 (56.7%) | 13 (43.3%) |
| $25,000 to $49,999 | 83 (100.0%) | 0 (0.0%) |
| $50,000 to $74,999 | 90 (95.7%) | 4 (4.3%) |
| $75,000 to $99,999 | 43 (100.0%) | 0 (0.0%) |
| $100,000 and over | 104 (100.0%) | 0 (0.0%) |
Public vs Private Health Insurance Coverage by Age in Palmer
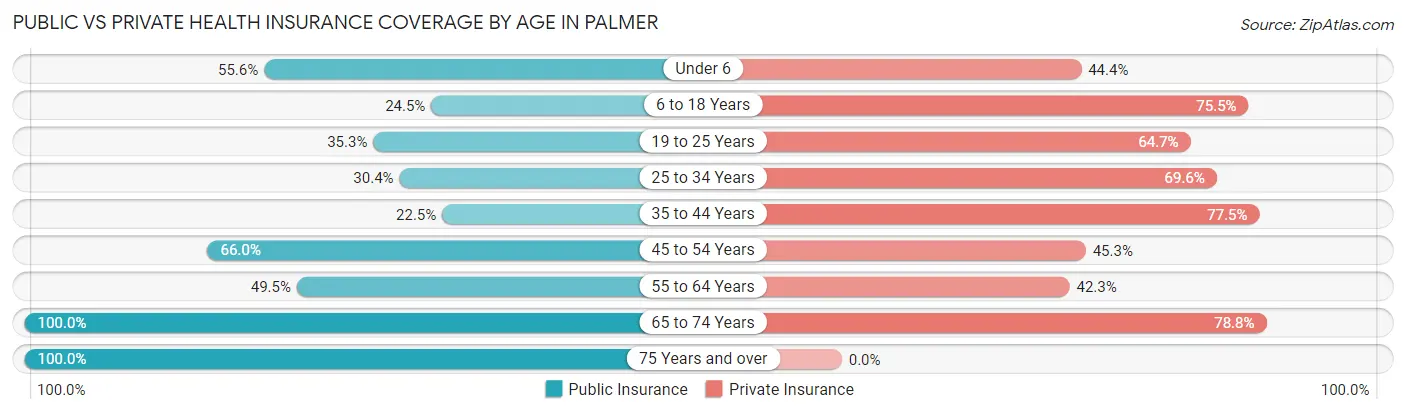
| Age Bracket | Public Insurance | Private Insurance |
| Under 6 | 10 (55.6%) | 8 (44.4%) |
| 6 to 18 Years | 13 (24.5%) | 40 (75.5%) |
| 19 to 25 Years | 12 (35.3%) | 22 (64.7%) |
| 25 to 34 Years | 14 (30.4%) | 32 (69.6%) |
| 35 to 44 Years | 9 (22.5%) | 31 (77.5%) |
| 45 to 54 Years | 35 (66.0%) | 24 (45.3%) |
| 55 to 64 Years | 48 (49.5%) | 41 (42.3%) |
| 65 to 74 Years | 33 (100.0%) | 26 (78.8%) |
| 75 Years and over | 4 (100.0%) | 0 (0.0%) |
| Total | 178 (47.1%) | 224 (59.3%) |
Disability Status by Sex by Age in Palmer
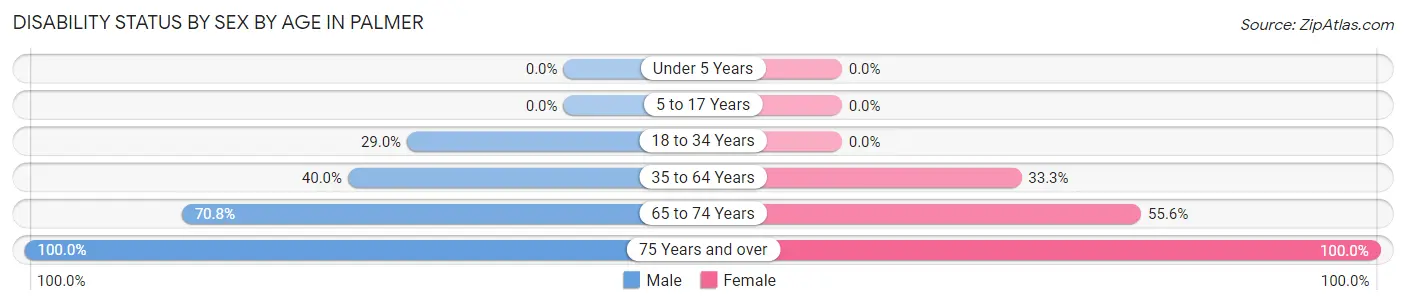
| Age Bracket | Male | Female |
| Under 5 Years | 0 (0.0%) | 0 (0.0%) |
| 5 to 17 Years | 0 (0.0%) | 0 (0.0%) |
| 18 to 34 Years | 9 (29.0%) | 0 (0.0%) |
| 35 to 64 Years | 46 (40.0%) | 25 (33.3%) |
| 65 to 74 Years | 17 (70.8%) | 5 (55.6%) |
| 75 Years and over | 1 (100.0%) | 3 (100.0%) |
Disability Class by Sex by Age in Palmer
Disability Class: Hearing Difficulty
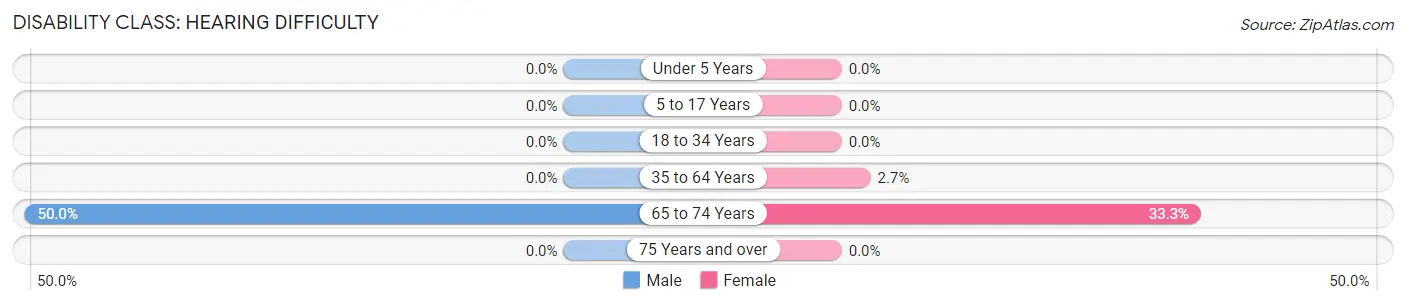
| Age Bracket | Male | Female |
| Under 5 Years | 0 (0.0%) | 0 (0.0%) |
| 5 to 17 Years | 0 (0.0%) | 0 (0.0%) |
| 18 to 34 Years | 0 (0.0%) | 0 (0.0%) |
| 35 to 64 Years | 0 (0.0%) | 2 (2.7%) |
| 65 to 74 Years | 12 (50.0%) | 3 (33.3%) |
| 75 Years and over | 0 (0.0%) | 0 (0.0%) |
Disability Class: Vision Difficulty
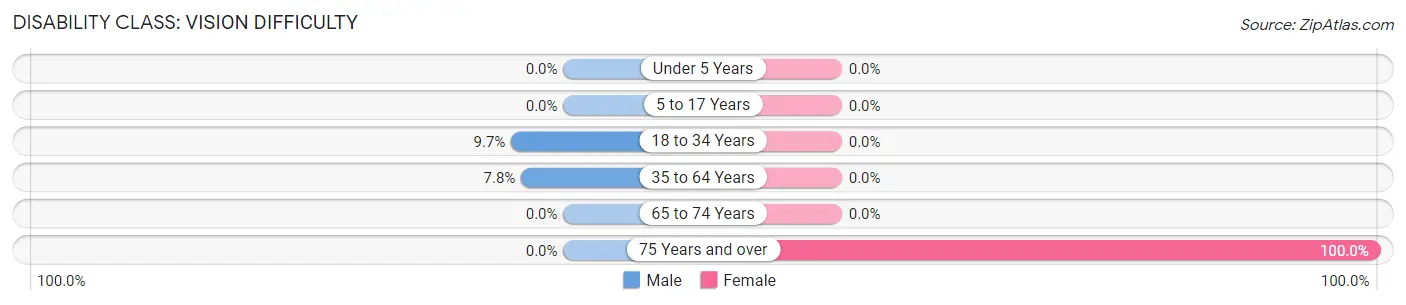
| Age Bracket | Male | Female |
| Under 5 Years | 0 (0.0%) | 0 (0.0%) |
| 5 to 17 Years | 0 (0.0%) | 0 (0.0%) |
| 18 to 34 Years | 3 (9.7%) | 0 (0.0%) |
| 35 to 64 Years | 9 (7.8%) | 0 (0.0%) |
| 65 to 74 Years | 0 (0.0%) | 0 (0.0%) |
| 75 Years and over | 0 (0.0%) | 3 (100.0%) |
Disability Class: Cognitive Difficulty
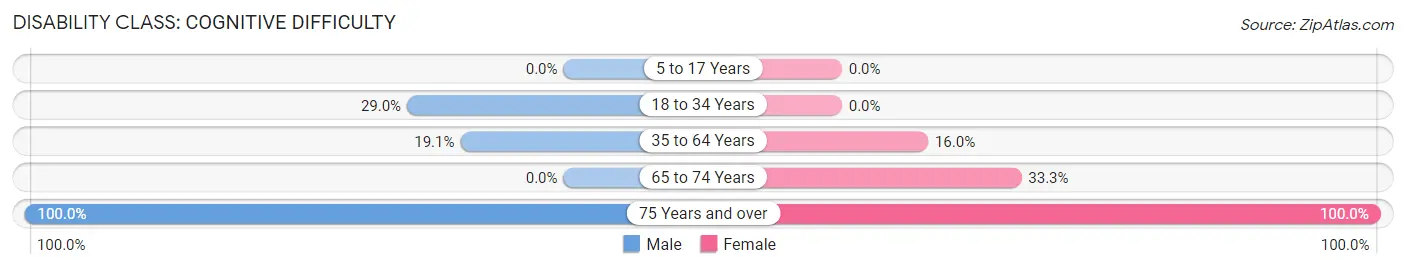
| Age Bracket | Male | Female |
| 5 to 17 Years | 0 (0.0%) | 0 (0.0%) |
| 18 to 34 Years | 9 (29.0%) | 0 (0.0%) |
| 35 to 64 Years | 22 (19.1%) | 12 (16.0%) |
| 65 to 74 Years | 0 (0.0%) | 3 (33.3%) |
| 75 Years and over | 1 (100.0%) | 3 (100.0%) |
Disability Class: Ambulatory Difficulty
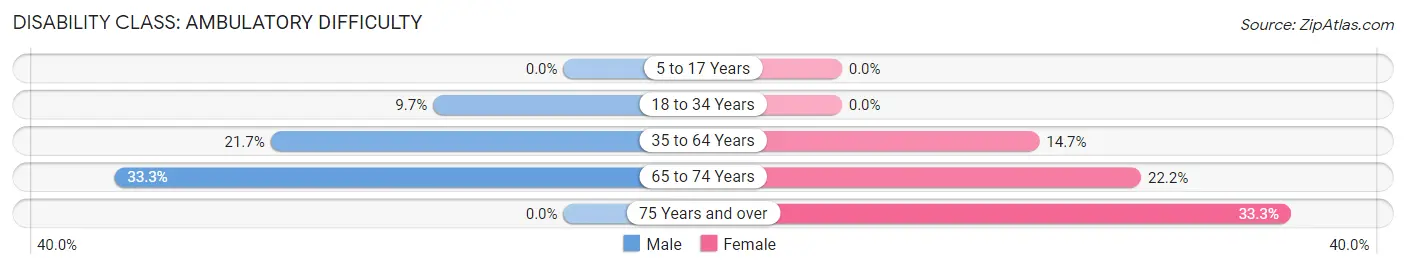
| Age Bracket | Male | Female |
| 5 to 17 Years | 0 (0.0%) | 0 (0.0%) |
| 18 to 34 Years | 3 (9.7%) | 0 (0.0%) |
| 35 to 64 Years | 25 (21.7%) | 11 (14.7%) |
| 65 to 74 Years | 8 (33.3%) | 2 (22.2%) |
| 75 Years and over | 0 (0.0%) | 1 (33.3%) |
Disability Class: Self-Care Difficulty
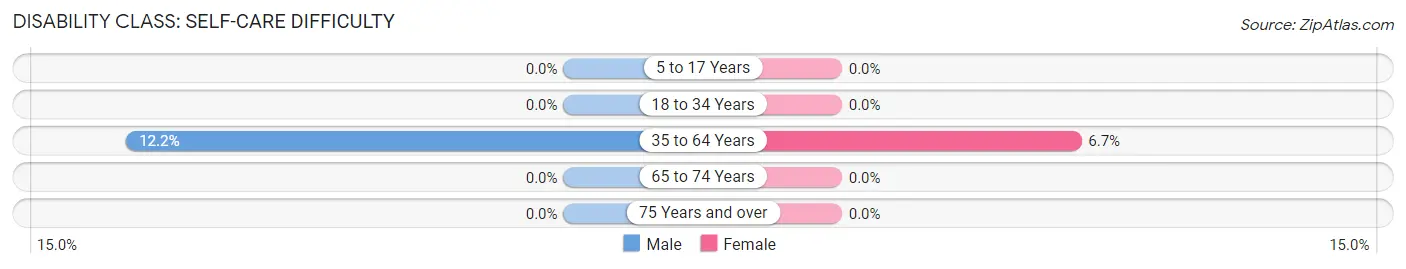
| Age Bracket | Male | Female |
| 5 to 17 Years | 0 (0.0%) | 0 (0.0%) |
| 18 to 34 Years | 0 (0.0%) | 0 (0.0%) |
| 35 to 64 Years | 14 (12.2%) | 5 (6.7%) |
| 65 to 74 Years | 0 (0.0%) | 0 (0.0%) |
| 75 Years and over | 0 (0.0%) | 0 (0.0%) |
Technology Access in Palmer
Computing Device Access in Palmer
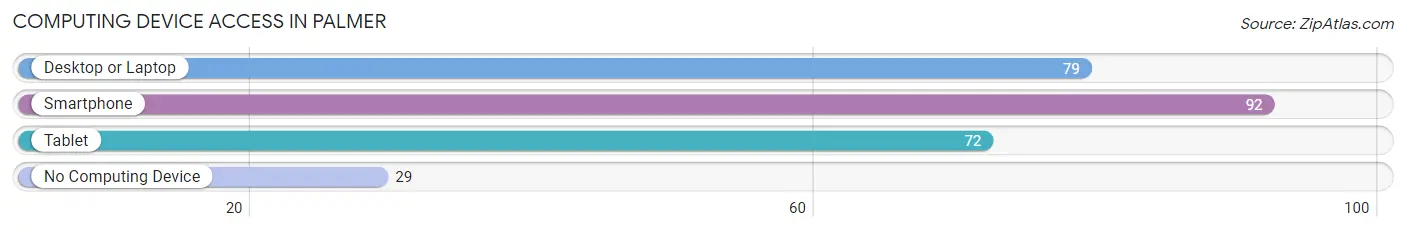
| Device Type | # Households | % Households |
| Desktop or Laptop | 79 | 58.1% |
| Smartphone | 92 | 67.6% |
| Tablet | 72 | 52.9% |
| No Computing Device | 29 | 21.3% |
| Total | 136 | 100.0% |
Internet Access in Palmer
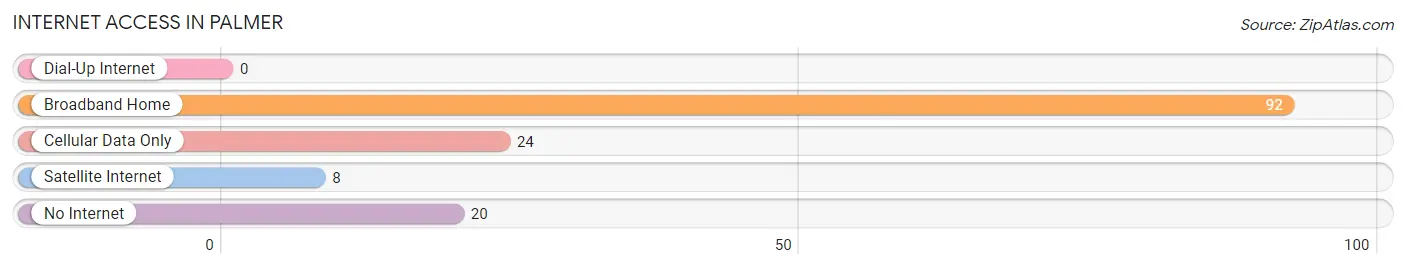
| Internet Type | # Households | % Households |
| Dial-Up Internet | 0 | 0.0% |
| Broadband Home | 92 | 67.6% |
| Cellular Data Only | 24 | 17.6% |
| Satellite Internet | 8 | 5.9% |
| No Internet | 20 | 14.7% |
| Total | 136 | 100.0% |
Palmer Summary
Palmer is a small unincorporated community located in the Upper Peninsula of Michigan, in the United States. It is situated in the western part of Marquette County, approximately 10 miles south of the city of Marquette. The community is located on the south shore of Lake Superior, and is surrounded by the Huron Mountains.
History
The area that is now Palmer was first settled in the late 1800s by Finnish immigrants. The first settlers were attracted to the area by the abundance of timber and the potential for farming. The community was originally known as “Finn Town”, and was later renamed Palmer after the first postmaster, John Palmer.
The community grew slowly over the years, and by the early 1900s, Palmer had become a thriving logging and farming community. The community was home to several sawmills, a general store, a blacksmith shop, and a school.
In the 1920s, the community began to decline as the logging industry moved away from the area. The population decreased, and many of the businesses closed. The school closed in the 1940s, and the post office closed in the 1950s.
Geography
Palmer is located in the western part of Marquette County, in the Upper Peninsula of Michigan. It is situated on the south shore of Lake Superior, and is surrounded by the Huron Mountains. The community is located approximately 10 miles south of the city of Marquette.
The terrain in the area is mostly flat, with some rolling hills. The area is heavily forested, with a mix of coniferous and deciduous trees. The climate in the area is generally cool and humid, with cold winters and warm summers.
Economy
The economy of Palmer is largely based on tourism. The area is popular with outdoor enthusiasts, and there are several campgrounds and recreational areas in the area. The community is also home to several small businesses, including a general store, a restaurant, and a gas station.
The area is also home to several small farms, which produce a variety of crops, including potatoes, corn, and hay. The area is also home to several logging companies, which harvest timber from the surrounding forests.
Demographics
As of the 2010 census, the population of Palmer was 545. The racial makeup of the community was 97.3% White, 0.2% African American, 0.2% Native American, 0.2% Asian, 0.4% from other races, and 1.7% from two or more races. Hispanic or Latino of any race were 1.3% of the population.
The median household income in Palmer was $37,500, and the median family income was $41,250. The per capita income for the community was $17,845. About 11.2% of families and 14.2% of the population were below the poverty line, including 18.2% of those under age 18 and 8.3% of those age 65 or over.
Common Questions
What is Per Capita Income in Palmer?
Per Capita income in Palmer is $27,028.
What is the Median Family Income in Palmer?
Median Family Income in Palmer is $60,208.
What is the Median Household income in Palmer?
Median Household Income in Palmer is $59,615.
What is Income or Wage Gap in Palmer?
Income or Wage Gap in Palmer is 51.1%.
Women in Palmer earn 48.9 cents for every dollar earned by a man.
What is Inequality or Gini Index in Palmer?
Inequality or Gini Index in Palmer is 0.35.
What is the Total Population of Palmer?
Total Population of Palmer is 378.
What is the Total Male Population of Palmer?
Total Male Population of Palmer is 194.
What is the Total Female Population of Palmer?
Total Female Population of Palmer is 184.
What is the Ratio of Males per 100 Females in Palmer?
There are 105.43 Males per 100 Females in Palmer.
What is the Ratio of Females per 100 Males in Palmer?
There are 94.85 Females per 100 Males in Palmer.
What is the Median Population Age in Palmer?
Median Population Age in Palmer is 40.8 Years.
What is the Average Family Size in Palmer
Average Family Size in Palmer is 3.5 People.
What is the Average Household Size in Palmer
Average Household Size in Palmer is 2.6 People.
How Large is the Labor Force in Palmer?
There are 197 People in the Labor Forcein in Palmer.
What is the Percentage of People in the Labor Force in Palmer?
62.3% of People are in the Labor Force in Palmer.
What is the Unemployment Rate in Palmer?
Unemployment Rate in Palmer is 4.1%.