Pigeon, MI Map & Demographics
Pigeon Map
Pigeon Overview
$29,453
PER CAPITA INCOME
$77,361
AVG FAMILY INCOME
$53,750
AVG HOUSEHOLD INCOME
33.1%
WAGE / INCOME GAP [ % ]
66.9¢/ $1
WAGE / INCOME GAP [ $ ]
0.39
INEQUALITY / GINI INDEX
1,100
TOTAL POPULATION
544
MALE POPULATION
556
FEMALE POPULATION
97.84
MALES / 100 FEMALES
102.21
FEMALES / 100 MALES
48.6
MEDIAN AGE
3.0
AVG FAMILY SIZE
2.1
AVG HOUSEHOLD SIZE
448
LABOR FORCE [ PEOPLE ]
53.3%
PERCENT IN LABOR FORCE
1.3%
UNEMPLOYMENT RATE
Pigeon Zip Codes
Pigeon Area Codes
Income in Pigeon
Income Overview in Pigeon
Per Capita Income in Pigeon is $29,453, while median incomes of families and households are $77,361 and $53,750 respectively.
| Characteristic | Number | Measure |
| Per Capita Income | 1,100 | $29,453 |
| Median Family Income | 275 | $77,361 |
| Mean Family Income | 275 | $86,674 |
| Median Household Income | 524 | $53,750 |
| Mean Household Income | 524 | $60,787 |
| Income Deficit | 275 | $0 |
| Wage / Income Gap (%) | 1,100 | 33.08% |
| Wage / Income Gap ($) | 1,100 | 66.92¢ per $1 |
| Gini / Inequality Index | 1,100 | 0.39 |
Earnings by Sex in Pigeon
Average Earnings in Pigeon are $40,859, $49,500 for men and $33,125 for women, a difference of 33.1%.
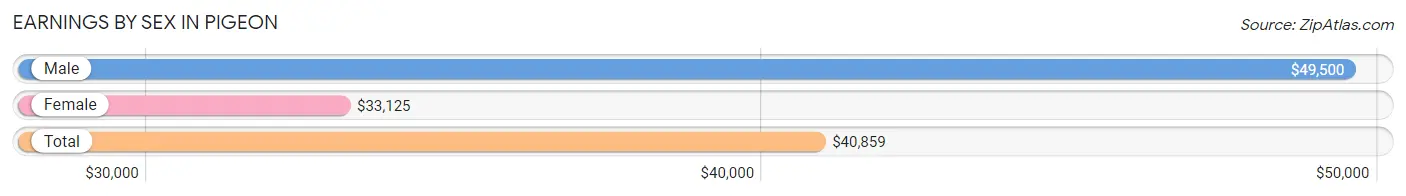
| Sex | Number | Average Earnings |
| Male | 246 (51.4%) | $49,500 |
| Female | 233 (48.6%) | $33,125 |
| Total | 479 (100.0%) | $40,859 |
Earnings by Sex by Income Bracket in Pigeon
The most common earnings brackets in Pigeon are $55,000 to $64,999 for men (48 | 19.5%) and $55,000 to $64,999 for women (41 | 17.6%).
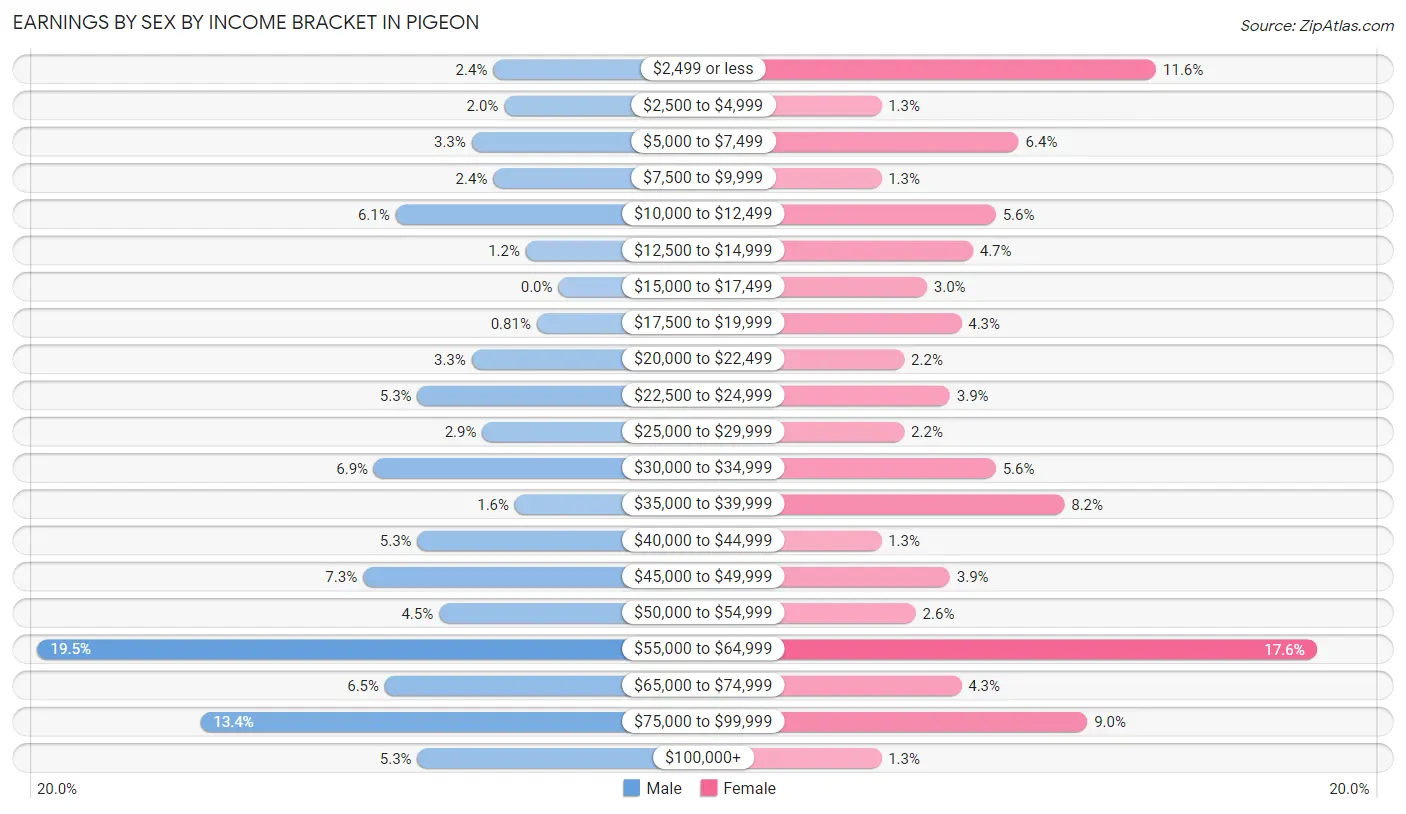
| Income | Male | Female |
| $2,499 or less | 6 (2.4%) | 27 (11.6%) |
| $2,500 to $4,999 | 5 (2.0%) | 3 (1.3%) |
| $5,000 to $7,499 | 8 (3.3%) | 15 (6.4%) |
| $7,500 to $9,999 | 6 (2.4%) | 3 (1.3%) |
| $10,000 to $12,499 | 15 (6.1%) | 13 (5.6%) |
| $12,500 to $14,999 | 3 (1.2%) | 11 (4.7%) |
| $15,000 to $17,499 | 0 (0.0%) | 7 (3.0%) |
| $17,500 to $19,999 | 2 (0.8%) | 10 (4.3%) |
| $20,000 to $22,499 | 8 (3.3%) | 5 (2.1%) |
| $22,500 to $24,999 | 13 (5.3%) | 9 (3.9%) |
| $25,000 to $29,999 | 7 (2.9%) | 5 (2.1%) |
| $30,000 to $34,999 | 17 (6.9%) | 13 (5.6%) |
| $35,000 to $39,999 | 4 (1.6%) | 19 (8.2%) |
| $40,000 to $44,999 | 13 (5.3%) | 3 (1.3%) |
| $45,000 to $49,999 | 18 (7.3%) | 9 (3.9%) |
| $50,000 to $54,999 | 11 (4.5%) | 6 (2.6%) |
| $55,000 to $64,999 | 48 (19.5%) | 41 (17.6%) |
| $65,000 to $74,999 | 16 (6.5%) | 10 (4.3%) |
| $75,000 to $99,999 | 33 (13.4%) | 21 (9.0%) |
| $100,000+ | 13 (5.3%) | 3 (1.3%) |
| Total | 246 (100.0%) | 233 (100.0%) |
Earnings by Sex by Educational Attainment in Pigeon
Average earnings in Pigeon are $53,750 for men and $35,156 for women, a difference of 34.6%. Men with an educational attainment of graduate degree enjoy the highest average annual earnings of $71,250, while those with less than high school education earn the least with $20,781. Women with an educational attainment of graduate degree earn the most with the average annual earnings of $58,250, while those with less than high school education have the smallest earnings of $18,750.
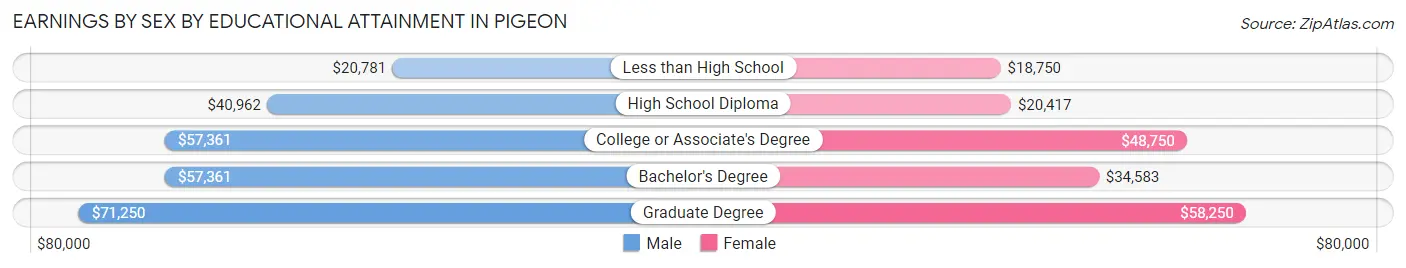
| Educational Attainment | Male Income | Female Income |
| Less than High School | $20,781 | $18,750 |
| High School Diploma | $40,962 | $20,417 |
| College or Associate's Degree | $57,361 | $48,750 |
| Bachelor's Degree | $57,361 | $34,583 |
| Graduate Degree | $71,250 | $58,250 |
| Total | $53,750 | $35,156 |
Family Income in Pigeon
Family Income Brackets in Pigeon
According to the Pigeon family income data, there are 84 families falling into the $75,000 to $99,999 income range, which is the most common income bracket and makes up 30.5% of all families.
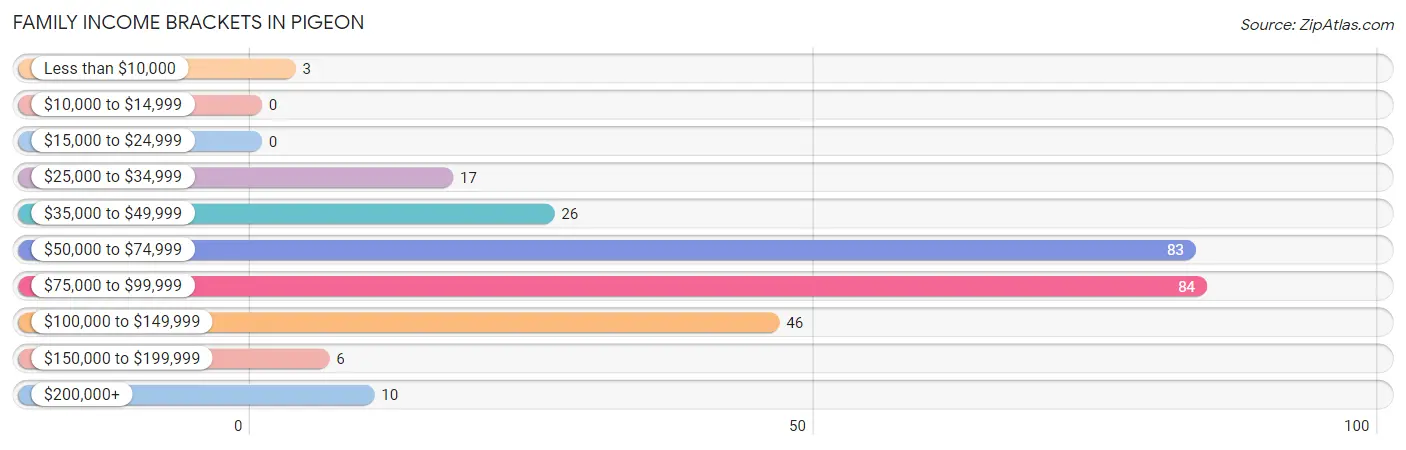
| Income Bracket | # Families | % Families |
| Less than $10,000 | 3 | 1.1% |
| $10,000 to $14,999 | 0 | 0.0% |
| $15,000 to $24,999 | 0 | 0.0% |
| $25,000 to $34,999 | 17 | 6.2% |
| $35,000 to $49,999 | 26 | 9.5% |
| $50,000 to $74,999 | 83 | 30.2% |
| $75,000 to $99,999 | 84 | 30.5% |
| $100,000 to $149,999 | 46 | 16.7% |
| $150,000 to $199,999 | 6 | 2.2% |
| $200,000+ | 10 | 3.6% |
Family Income by Famaliy Size in Pigeon
4-person families (45 | 16.4%) account for the highest median family income in Pigeon with $127,917 per family, while 2-person families (152 | 55.3%) have the highest median income of $35,815 per family member.
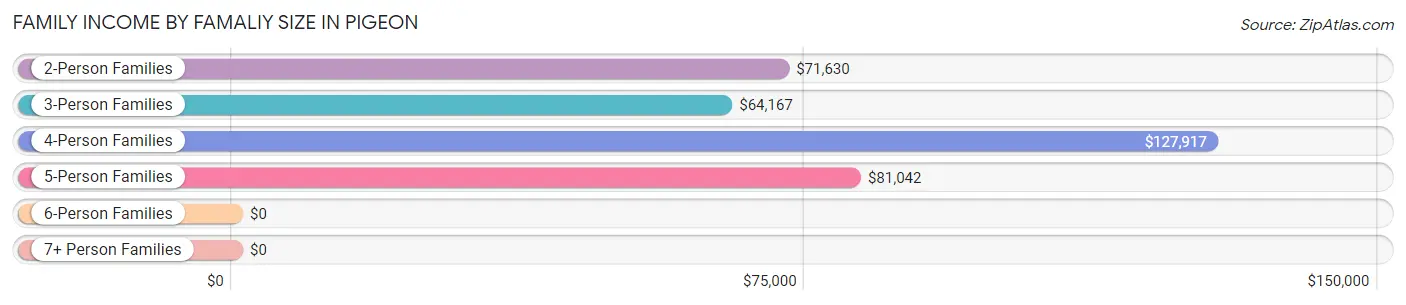
| Income Bracket | # Families | Median Income |
| 2-Person Families | 152 (55.3%) | $71,630 |
| 3-Person Families | 52 (18.9%) | $64,167 |
| 4-Person Families | 45 (16.4%) | $127,917 |
| 5-Person Families | 23 (8.4%) | $81,042 |
| 6-Person Families | 3 (1.1%) | $0 |
| 7+ Person Families | 0 (0.0%) | $0 |
| Total | 275 (100.0%) | $77,361 |
Family Income by Number of Earners in Pigeon
The median family income in Pigeon is $77,361, with families comprising 3+ earners (14) having the highest median family income of $128,333, while families with no earners (44) have the lowest median family income of $55,833, accounting for 5.1% and 16.0% of families, respectively.
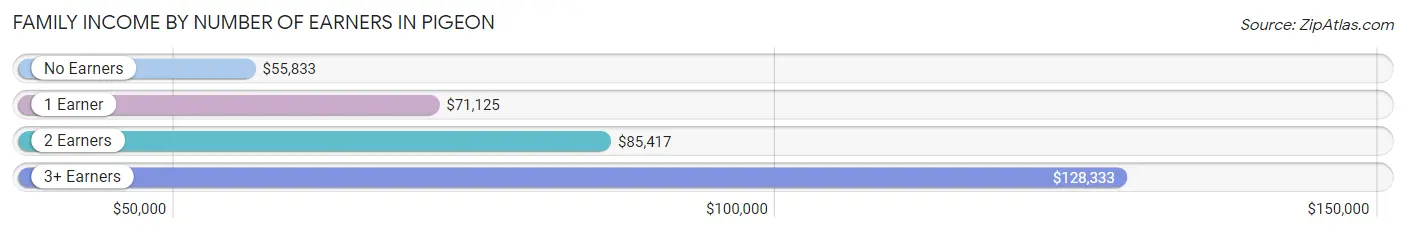
| Number of Earners | # Families | Median Income |
| No Earners | 44 (16.0%) | $55,833 |
| 1 Earner | 122 (44.4%) | $71,125 |
| 2 Earners | 95 (34.5%) | $85,417 |
| 3+ Earners | 14 (5.1%) | $128,333 |
| Total | 275 (100.0%) | $77,361 |
Household Income in Pigeon
Household Income Brackets in Pigeon
With 125 households falling in the category, the $50,000 to $74,999 income range is the most frequent in Pigeon, accounting for 23.8% of all households. In contrast, only 6 households (1.1%) fall into the $150,000 to $199,999 income bracket, making it the least populous group.
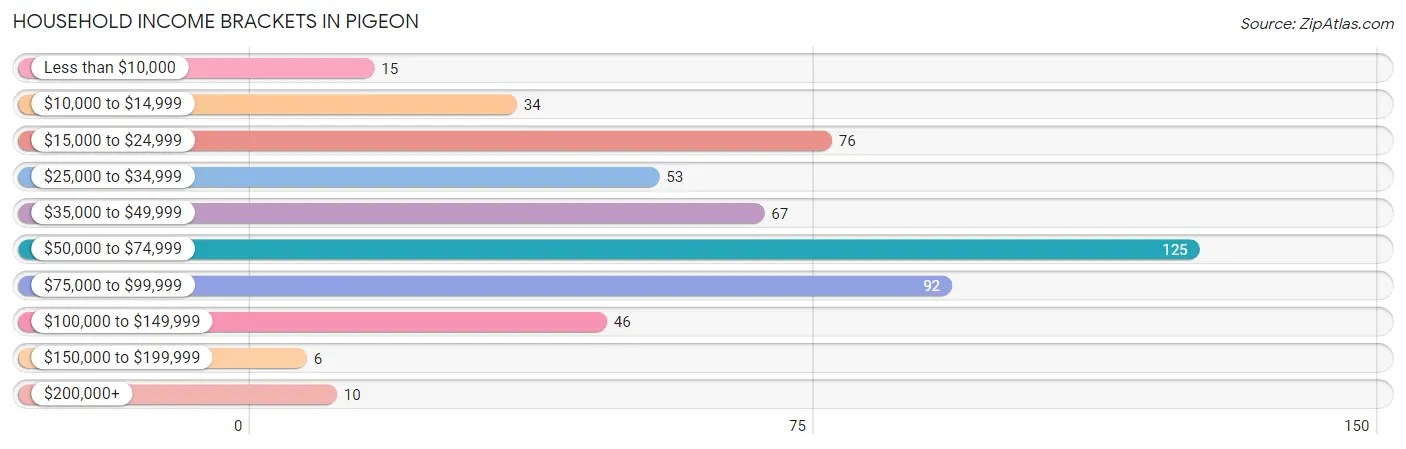
| Income Bracket | # Households | % Households |
| Less than $10,000 | 15 | 2.9% |
| $10,000 to $14,999 | 34 | 6.5% |
| $15,000 to $24,999 | 76 | 14.5% |
| $25,000 to $34,999 | 53 | 10.1% |
| $35,000 to $49,999 | 67 | 12.8% |
| $50,000 to $74,999 | 125 | 23.9% |
| $75,000 to $99,999 | 92 | 17.6% |
| $100,000 to $149,999 | 46 | 8.8% |
| $150,000 to $199,999 | 6 | 1.1% |
| $200,000+ | 10 | 1.9% |
Household Income by Householder Age in Pigeon
The median household income in Pigeon is $53,750, with the highest median household income of $70,938 found in the 25 to 44 years age bracket for the primary householder. A total of 121 households (23.1%) fall into this category. Meanwhile, the 15 to 24 years age bracket for the primary householder has the lowest median household income of $0, with 3 households (0.6%) in this group.
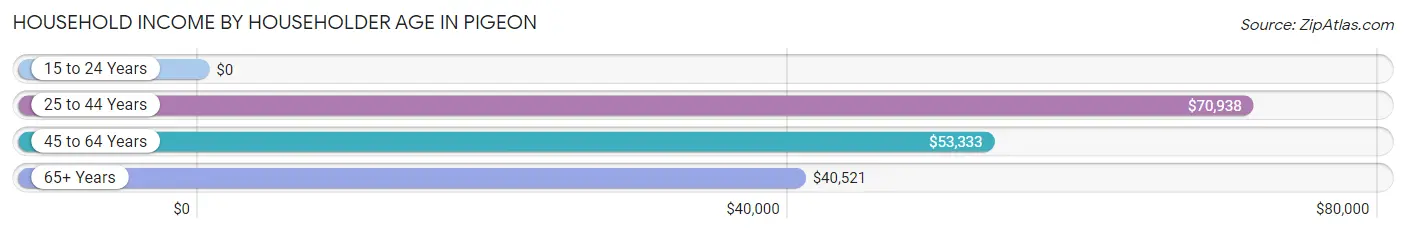
| Income Bracket | # Households | Median Income |
| 15 to 24 Years | 3 (0.6%) | $0 |
| 25 to 44 Years | 121 (23.1%) | $70,938 |
| 45 to 64 Years | 196 (37.4%) | $53,333 |
| 65+ Years | 204 (38.9%) | $40,521 |
| Total | 524 (100.0%) | $53,750 |
Poverty in Pigeon
Income Below Poverty by Sex and Age in Pigeon
With 4.3% poverty level for males and 5.7% for females among the residents of Pigeon, 55 to 64 year old males and 65 to 74 year old females are the most vulnerable to poverty, with 14 males (17.7%) and 7 females (10.8%) in their respective age groups living below the poverty level.
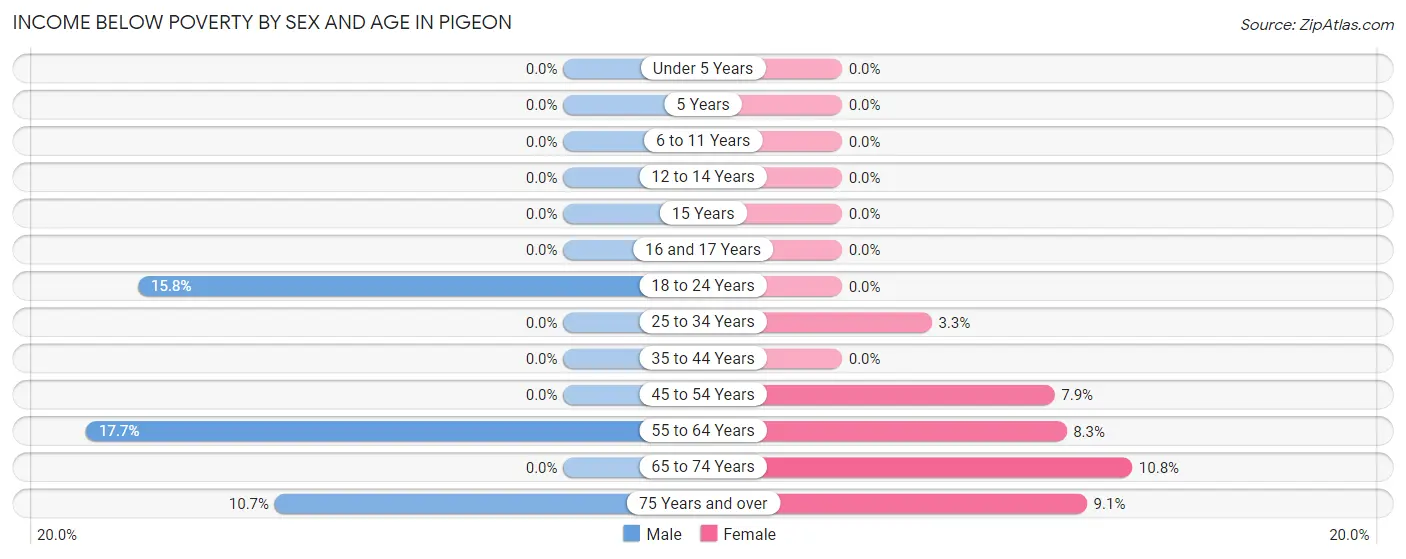
| Age Bracket | Male | Female |
| Under 5 Years | 0 (0.0%) | 0 (0.0%) |
| 5 Years | 0 (0.0%) | 0 (0.0%) |
| 6 to 11 Years | 0 (0.0%) | 0 (0.0%) |
| 12 to 14 Years | 0 (0.0%) | 0 (0.0%) |
| 15 Years | 0 (0.0%) | 0 (0.0%) |
| 16 and 17 Years | 0 (0.0%) | 0 (0.0%) |
| 18 to 24 Years | 3 (15.8%) | 0 (0.0%) |
| 25 to 34 Years | 0 (0.0%) | 2 (3.3%) |
| 35 to 44 Years | 0 (0.0%) | 0 (0.0%) |
| 45 to 54 Years | 0 (0.0%) | 3 (7.9%) |
| 55 to 64 Years | 14 (17.7%) | 10 (8.3%) |
| 65 to 74 Years | 0 (0.0%) | 7 (10.8%) |
| 75 Years and over | 6 (10.7%) | 9 (9.1%) |
| Total | 23 (4.3%) | 31 (5.7%) |
Income Above Poverty by Sex and Age in Pigeon
According to the poverty statistics in Pigeon, males aged under 5 years and females aged under 5 years are the age groups that are most secure financially, with 100.0% of males and 100.0% of females in these age groups living above the poverty line.
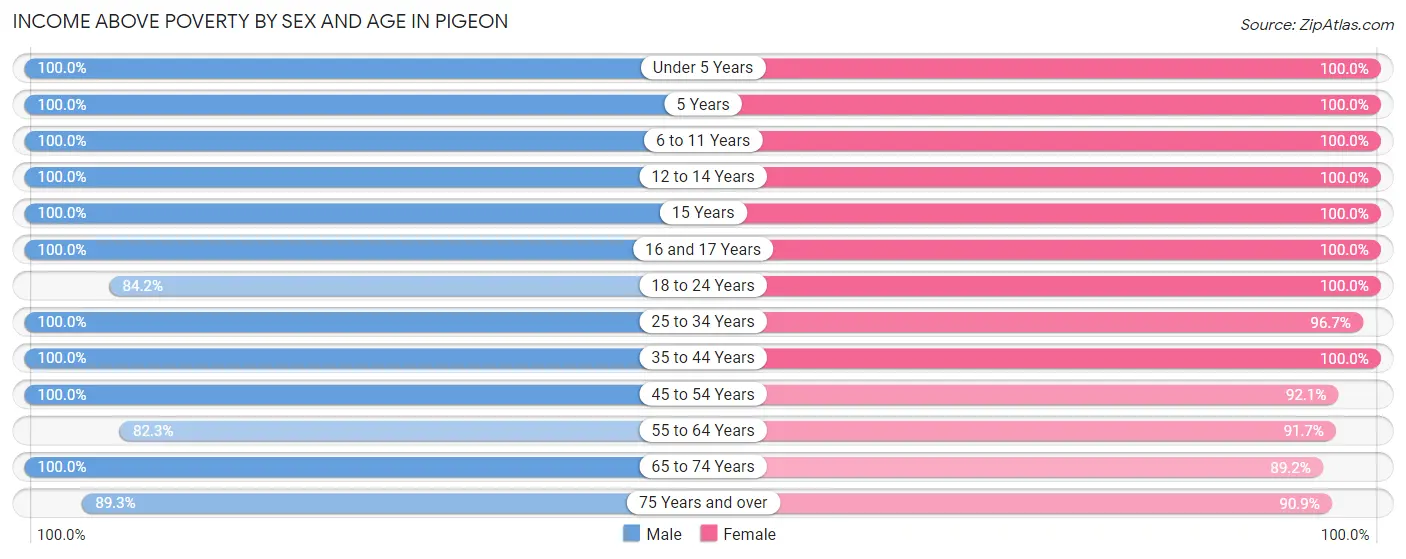
| Age Bracket | Male | Female |
| Under 5 Years | 64 (100.0%) | 28 (100.0%) |
| 5 Years | 12 (100.0%) | 17 (100.0%) |
| 6 to 11 Years | 61 (100.0%) | 20 (100.0%) |
| 12 to 14 Years | 21 (100.0%) | 18 (100.0%) |
| 15 Years | 15 (100.0%) | 3 (100.0%) |
| 16 and 17 Years | 6 (100.0%) | 3 (100.0%) |
| 18 to 24 Years | 16 (84.2%) | 13 (100.0%) |
| 25 to 34 Years | 71 (100.0%) | 58 (96.7%) |
| 35 to 44 Years | 32 (100.0%) | 63 (100.0%) |
| 45 to 54 Years | 54 (100.0%) | 35 (92.1%) |
| 55 to 64 Years | 65 (82.3%) | 110 (91.7%) |
| 65 to 74 Years | 44 (100.0%) | 58 (89.2%) |
| 75 Years and over | 50 (89.3%) | 90 (90.9%) |
| Total | 511 (95.7%) | 516 (94.3%) |
Income Below Poverty Among Married-Couple Families in Pigeon
The poverty statistics for married-couple families in Pigeon show that 1.4% or 3 of the total 211 families live below the poverty line. Families with no children have the highest poverty rate of 2.4%, comprising of 3 families. On the other hand, families with 1 or 2 children have the lowest poverty rate of 0.0%, which includes 0 families.
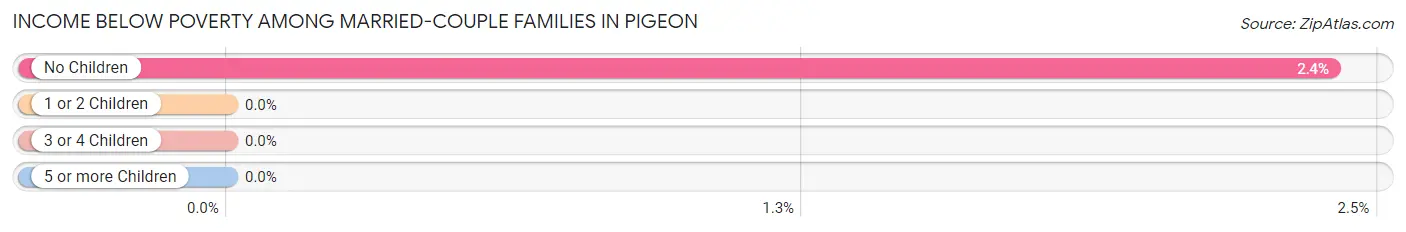
| Children | Above Poverty | Below Poverty |
| No Children | 122 (97.6%) | 3 (2.4%) |
| 1 or 2 Children | 63 (100.0%) | 0 (0.0%) |
| 3 or 4 Children | 23 (100.0%) | 0 (0.0%) |
| 5 or more Children | 0 (0.0%) | 0 (0.0%) |
| Total | 208 (98.6%) | 3 (1.4%) |
Income Below Poverty Among Single-Parent Households in Pigeon
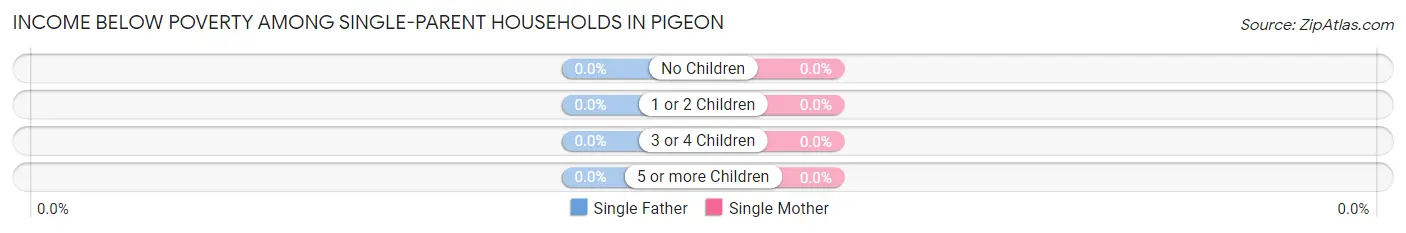
| Children | Single Father | Single Mother |
| No Children | 0 (0.0%) | 0 (0.0%) |
| 1 or 2 Children | 0 (0.0%) | 0 (0.0%) |
| 3 or 4 Children | 0 (0.0%) | 0 (0.0%) |
| 5 or more Children | 0 (0.0%) | 0 (0.0%) |
| Total | 0 (0.0%) | 0 (0.0%) |
Income Below Poverty Among Married-Couple vs Single-Parent Households in Pigeon
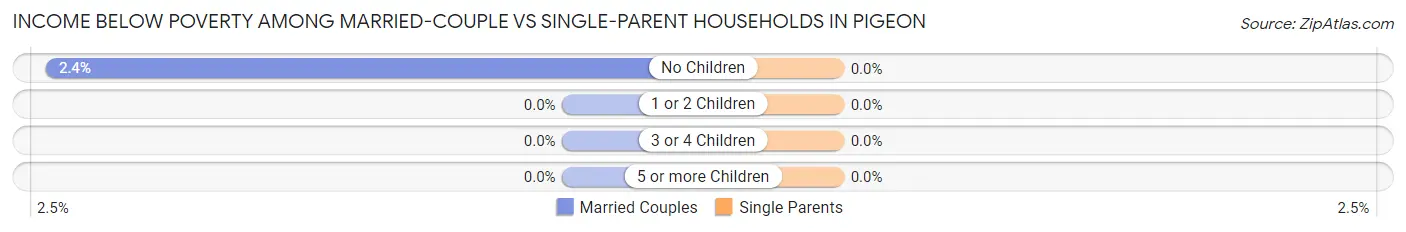
| Children | Married-Couple Families | Single-Parent Households |
| No Children | 3 (2.4%) | 0 (0.0%) |
| 1 or 2 Children | 0 (0.0%) | 0 (0.0%) |
| 3 or 4 Children | 0 (0.0%) | 0 (0.0%) |
| 5 or more Children | 0 (0.0%) | 0 (0.0%) |
| Total | 3 (1.4%) | 0 (0.0%) |
Race in Pigeon
The most populous races in Pigeon are White / Caucasian (1,021 | 92.8%), Hispanic or Latino (61 | 5.6%), and Two or more Races (54 | 4.9%).
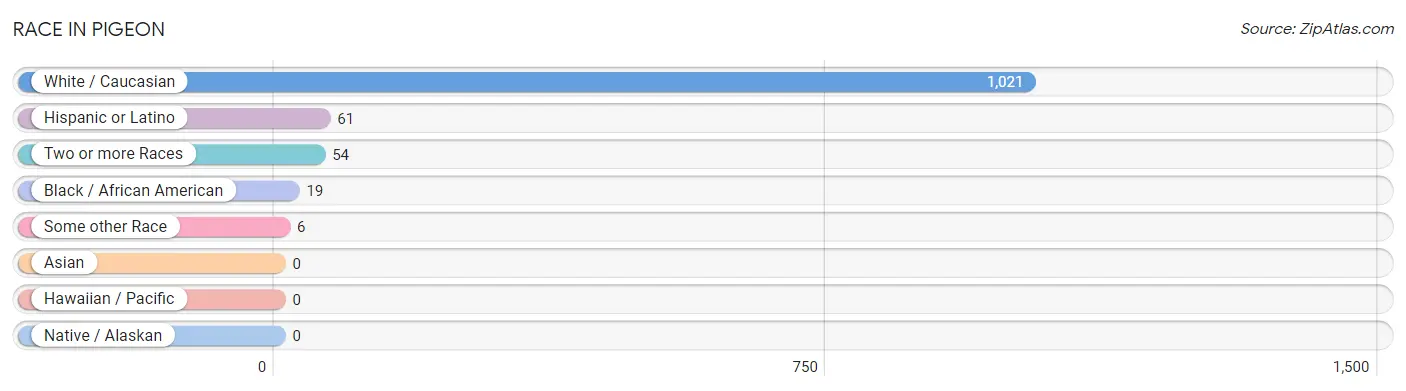
| Race | # Population | % Population |
| Asian | 0 | 0.0% |
| Black / African American | 19 | 1.7% |
| Hawaiian / Pacific | 0 | 0.0% |
| Hispanic or Latino | 61 | 5.6% |
| Native / Alaskan | 0 | 0.0% |
| White / Caucasian | 1,021 | 92.8% |
| Two or more Races | 54 | 4.9% |
| Some other Race | 6 | 0.5% |
| Total | 1,100 | 100.0% |
Ancestry in Pigeon
The most populous ancestries reported in Pigeon are German (500 | 45.5%), Polish (187 | 17.0%), French (78 | 7.1%), English (77 | 7.0%), and Irish (64 | 5.8%), together accounting for 82.4% of all Pigeon residents.
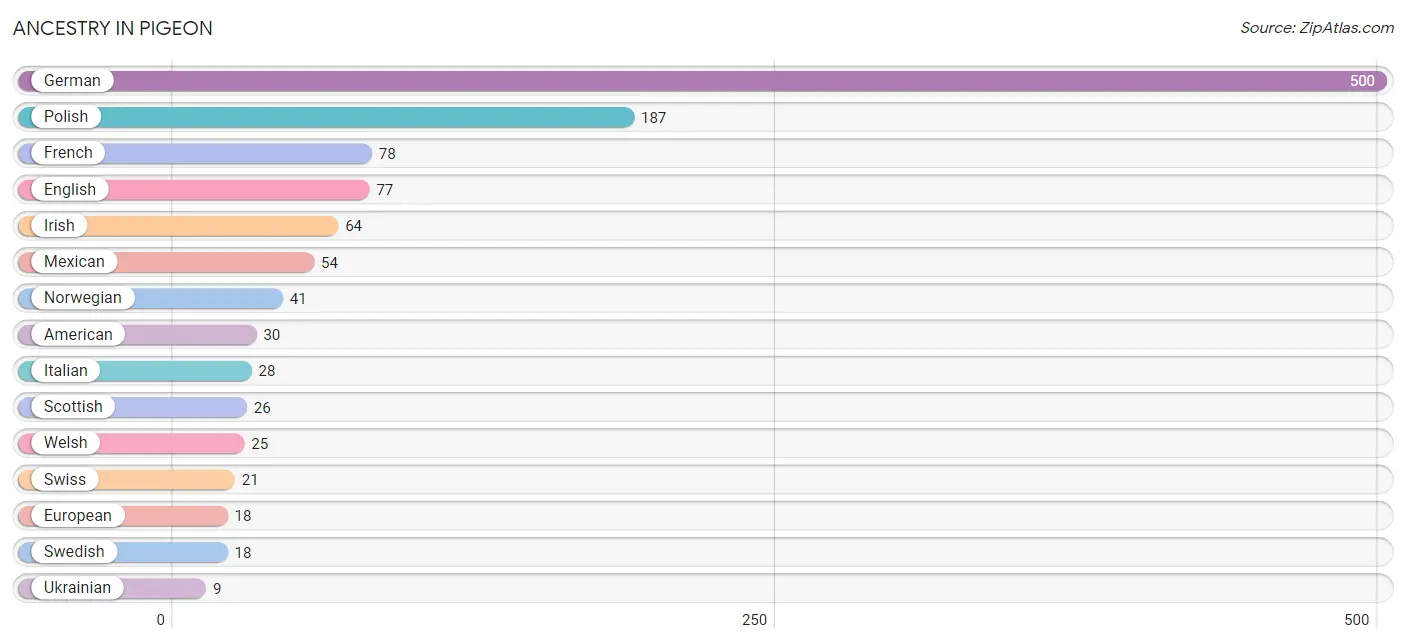
| Ancestry | # Population | % Population |
| American | 30 | 2.7% |
| Apache | 3 | 0.3% |
| Austrian | 3 | 0.3% |
| Belgian | 6 | 0.5% |
| British | 6 | 0.5% |
| Canadian | 6 | 0.5% |
| Central American | 7 | 0.6% |
| Czech | 3 | 0.3% |
| Danish | 6 | 0.5% |
| English | 77 | 7.0% |
| European | 18 | 1.6% |
| Finnish | 3 | 0.3% |
| French | 78 | 7.1% |
| French Canadian | 6 | 0.5% |
| German | 500 | 45.5% |
| Hungarian | 6 | 0.5% |
| Irish | 64 | 5.8% |
| Italian | 28 | 2.5% |
| Lithuanian | 2 | 0.2% |
| Mexican | 54 | 4.9% |
| Nicaraguan | 7 | 0.6% |
| Norwegian | 41 | 3.7% |
| Pennsylvania German | 3 | 0.3% |
| Polish | 187 | 17.0% |
| Romanian | 4 | 0.4% |
| Scandinavian | 3 | 0.3% |
| Scotch-Irish | 2 | 0.2% |
| Scottish | 26 | 2.4% |
| Swedish | 18 | 1.6% |
| Swiss | 21 | 1.9% |
| Ukrainian | 9 | 0.8% |
| Welsh | 25 | 2.3% | View All 32 Rows |
Immigrants in Pigeon
The most numerous immigrant groups reported in Pigeon came from Central America (7 | 0.6%), Latin America (7 | 0.6%), Nicaragua (7 | 0.6%), Eastern Europe (6 | 0.5%), and Europe (6 | 0.5%), together accounting for 3.0% of all Pigeon residents.
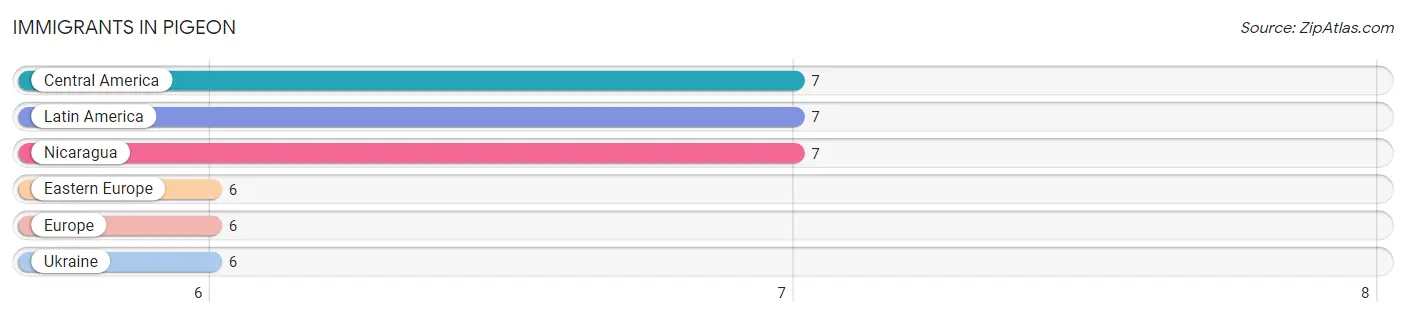
| Immigration Origin | # Population | % Population |
| Central America | 7 | 0.6% |
| Eastern Europe | 6 | 0.5% |
| Europe | 6 | 0.5% |
| Latin America | 7 | 0.6% |
| Nicaragua | 7 | 0.6% |
| Ukraine | 6 | 0.5% | View All 6 Rows |
Sex and Age in Pigeon
Sex and Age in Pigeon
The most populous age groups in Pigeon are 5 to 9 Years (65 | 11.9%) for men and 55 to 59 Years (72 | 13.0%) for women.
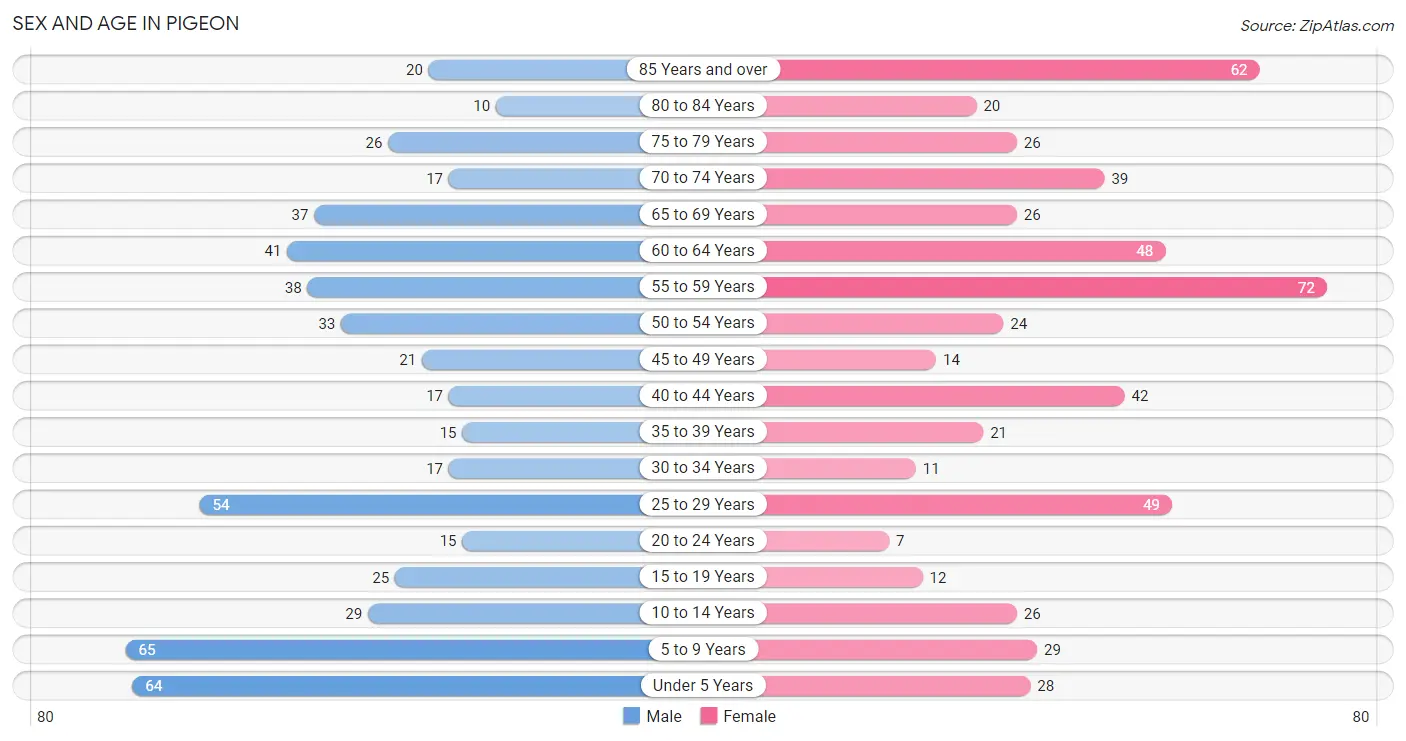
| Age Bracket | Male | Female |
| Under 5 Years | 64 (11.8%) | 28 (5.0%) |
| 5 to 9 Years | 65 (11.9%) | 29 (5.2%) |
| 10 to 14 Years | 29 (5.3%) | 26 (4.7%) |
| 15 to 19 Years | 25 (4.6%) | 12 (2.2%) |
| 20 to 24 Years | 15 (2.8%) | 7 (1.3%) |
| 25 to 29 Years | 54 (9.9%) | 49 (8.8%) |
| 30 to 34 Years | 17 (3.1%) | 11 (2.0%) |
| 35 to 39 Years | 15 (2.8%) | 21 (3.8%) |
| 40 to 44 Years | 17 (3.1%) | 42 (7.5%) |
| 45 to 49 Years | 21 (3.9%) | 14 (2.5%) |
| 50 to 54 Years | 33 (6.1%) | 24 (4.3%) |
| 55 to 59 Years | 38 (7.0%) | 72 (13.0%) |
| 60 to 64 Years | 41 (7.5%) | 48 (8.6%) |
| 65 to 69 Years | 37 (6.8%) | 26 (4.7%) |
| 70 to 74 Years | 17 (3.1%) | 39 (7.0%) |
| 75 to 79 Years | 26 (4.8%) | 26 (4.7%) |
| 80 to 84 Years | 10 (1.8%) | 20 (3.6%) |
| 85 Years and over | 20 (3.7%) | 62 (11.2%) |
| Total | 544 (100.0%) | 556 (100.0%) |
Families and Households in Pigeon
Median Family Size in Pigeon
The median family size in Pigeon is 2.99 persons per family, with married-couple families (211 | 76.7%) accounting for the largest median family size of 3.03 persons per family. On the other hand, single male/father families (28 | 10.2%) represent the smallest median family size with 2.68 persons per family.
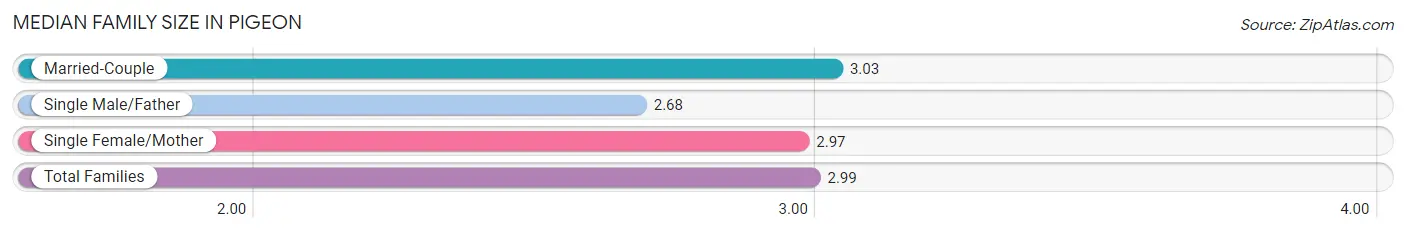
| Family Type | # Families | Family Size |
| Married-Couple | 211 (76.7%) | 3.03 |
| Single Male/Father | 28 (10.2%) | 2.68 |
| Single Female/Mother | 36 (13.1%) | 2.97 |
| Total Families | 275 (100.0%) | 2.99 |
Median Household Size in Pigeon
The median household size in Pigeon is 2.06 persons per household, with married-couple households (211 | 40.3%) accounting for the largest median household size of 3.03 persons per household. non-family households (249 | 47.5%) represent the smallest median household size with 1.04 persons per household.
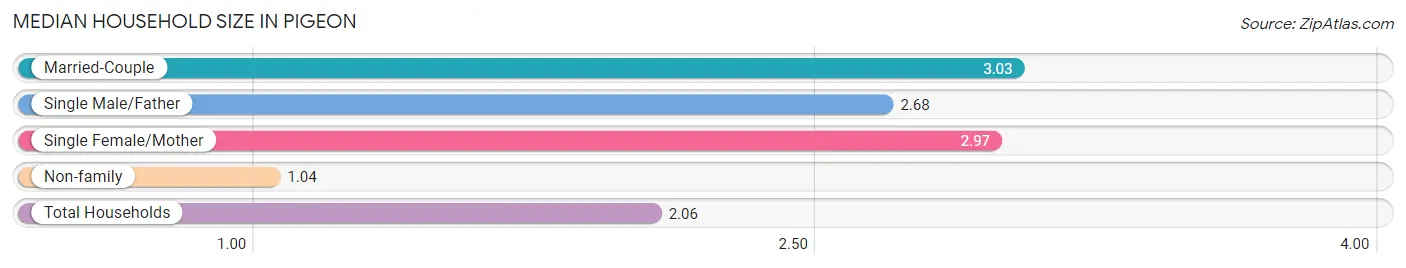
| Household Type | # Households | Household Size |
| Married-Couple | 211 (40.3%) | 3.03 |
| Single Male/Father | 28 (5.3%) | 2.68 |
| Single Female/Mother | 36 (6.9%) | 2.97 |
| Non-family | 249 (47.5%) | 1.04 |
| Total Households | 524 (100.0%) | 2.06 |
Household Size by Marriage Status in Pigeon
Out of a total of 524 households in Pigeon, 275 (52.5%) are family households, while 249 (47.5%) are nonfamily households. The most numerous type of family households are 2-person households, comprising 152, and the most common type of nonfamily households are 1-person households, comprising 241.
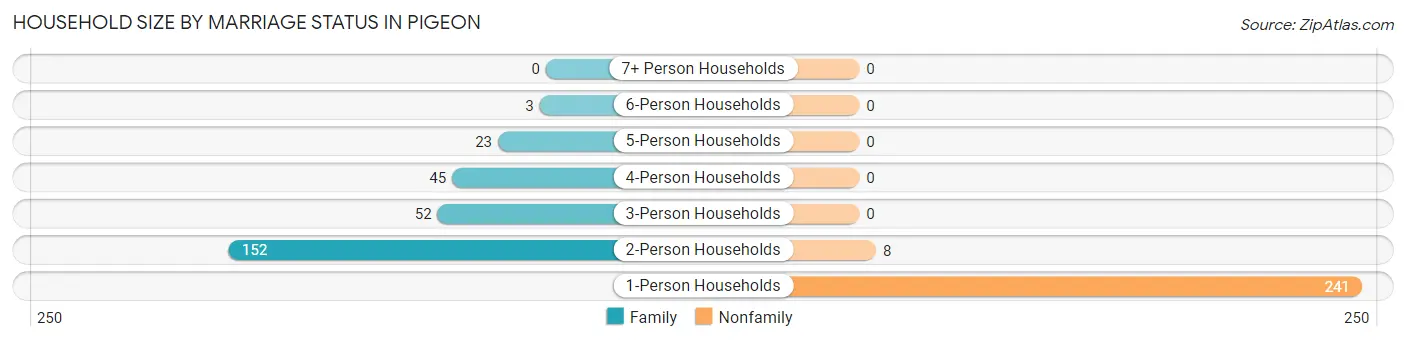
| Household Size | Family Households | Nonfamily Households |
| 1-Person Households | - | 241 (46.0%) |
| 2-Person Households | 152 (29.0%) | 8 (1.5%) |
| 3-Person Households | 52 (9.9%) | 0 (0.0%) |
| 4-Person Households | 45 (8.6%) | 0 (0.0%) |
| 5-Person Households | 23 (4.4%) | 0 (0.0%) |
| 6-Person Households | 3 (0.6%) | 0 (0.0%) |
| 7+ Person Households | 0 (0.0%) | 0 (0.0%) |
| Total | 275 (52.5%) | 249 (47.5%) |
Female Fertility in Pigeon
Fertility by Age in Pigeon
Average fertility rate in Pigeon is 59.0 births per 1,000 women. Women in the age bracket of 20 to 34 years have the highest fertility rate with 149.0 births per 1,000 women. Women in the age bracket of 20 to 34 years acount for 100.0% of all women with births.
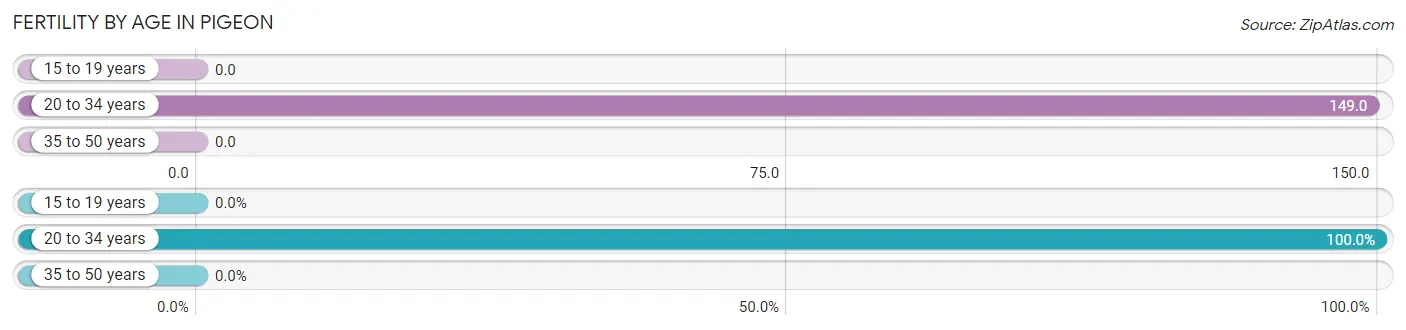
| Age Bracket | Women with Births | Births / 1,000 Women |
| 15 to 19 years | 0 (0.0%) | 0.0 |
| 20 to 34 years | 10 (100.0%) | 149.0 |
| 35 to 50 years | 0 (0.0%) | 0.0 |
| Total | 10 (100.0%) | 59.0 |
Fertility by Age by Marriage Status in Pigeon
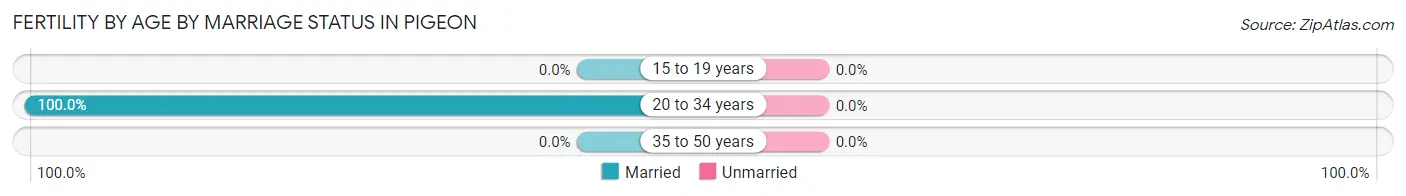
| Age Bracket | Married | Unmarried |
| 15 to 19 years | 0 (0.0%) | 0 (0.0%) |
| 20 to 34 years | 10 (100.0%) | 0 (0.0%) |
| 35 to 50 years | 0 (0.0%) | 0 (0.0%) |
| Total | 10 (100.0%) | 0 (0.0%) |
Fertility by Education in Pigeon
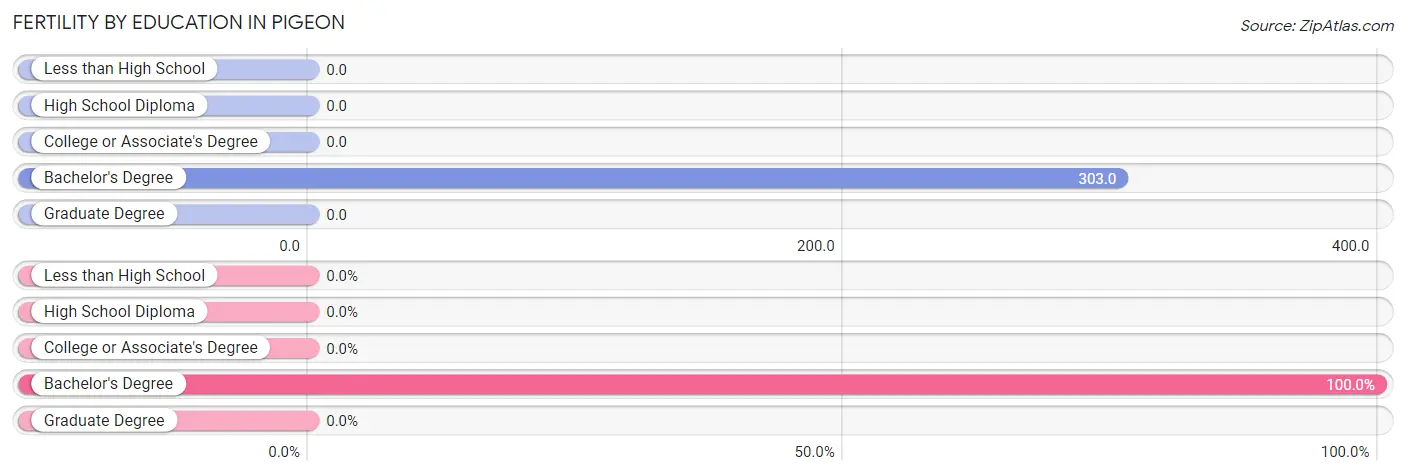
| Educational Attainment | Women with Births | Births / 1,000 Women |
| Less than High School | 0 (0.0%) | 0.0 |
| High School Diploma | 0 (0.0%) | 0.0 |
| College or Associate's Degree | 0 (0.0%) | 0.0 |
| Bachelor's Degree | 10 (100.0%) | 303.0 |
| Graduate Degree | 0 (0.0%) | 0.0 |
| Total | 10 (100.0%) | 59.0 |
Fertility by Education by Marriage Status in Pigeon
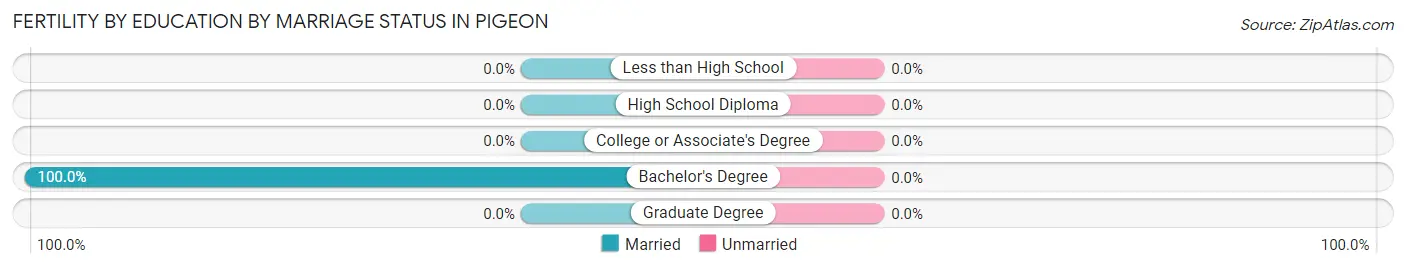
| Educational Attainment | Married | Unmarried |
| Less than High School | 0 (0.0%) | 0 (0.0%) |
| High School Diploma | 0 (0.0%) | 0 (0.0%) |
| College or Associate's Degree | 0 (0.0%) | 0 (0.0%) |
| Bachelor's Degree | 10 (100.0%) | 0 (0.0%) |
| Graduate Degree | 0 (0.0%) | 0 (0.0%) |
| Total | 10 (100.0%) | 0 (0.0%) |
Employment Characteristics in Pigeon
Employment by Class of Employer in Pigeon
Among the 442 employed individuals in Pigeon, private company employees (315 | 71.3%), local government employees (48 | 10.9%), and not-for-profit organizations (46 | 10.4%) make up the most common classes of employment.
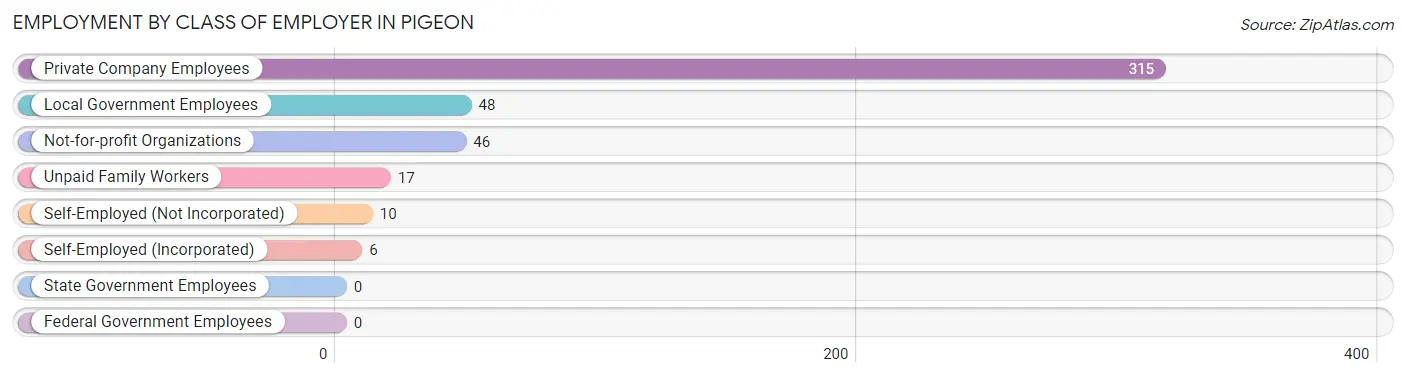
| Employer Class | # Employees | % Employees |
| Private Company Employees | 315 | 71.3% |
| Self-Employed (Incorporated) | 6 | 1.4% |
| Self-Employed (Not Incorporated) | 10 | 2.3% |
| Not-for-profit Organizations | 46 | 10.4% |
| Local Government Employees | 48 | 10.9% |
| State Government Employees | 0 | 0.0% |
| Federal Government Employees | 0 | 0.0% |
| Unpaid Family Workers | 17 | 3.8% |
| Total | 442 | 100.0% |
Employment Status by Age in Pigeon
According to the labor force statistics for Pigeon, out of the total population over 16 years of age (841), 53.3% or 448 individuals are in the labor force, with 1.3% or 6 of them unemployed. The age group with the highest labor force participation rate is 30 to 34 years, with 100.0% or 28 individuals in the labor force. Within the labor force, the 55 to 59 years age range has the highest percentage of unemployed individuals, with 4.8% or 4 of them being unemployed.
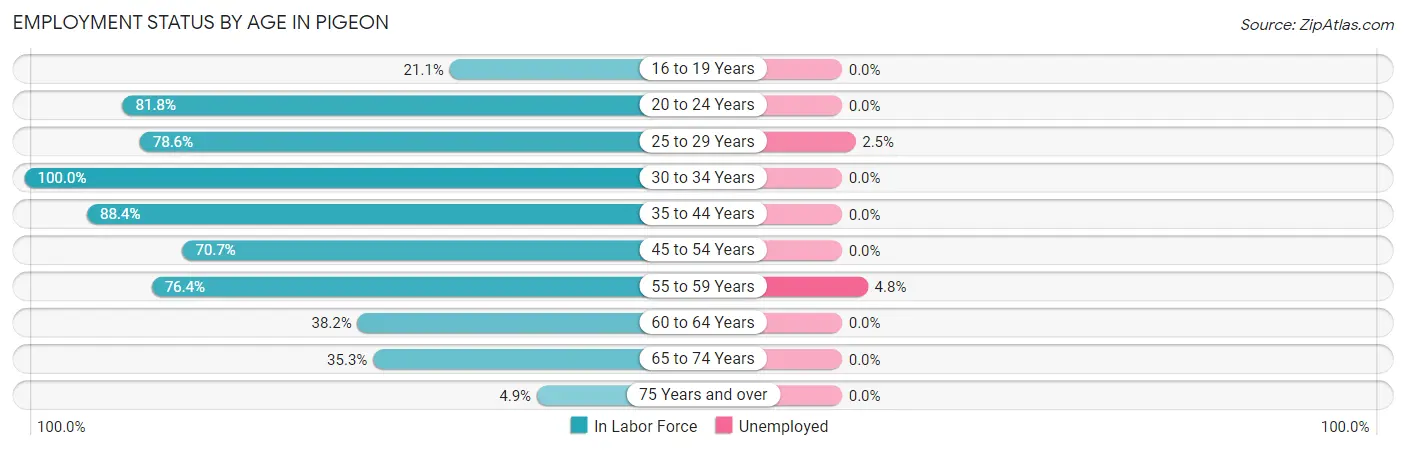
| Age Bracket | In Labor Force | Unemployed |
| 16 to 19 Years | 4 (21.1%) | 0 (0.0%) |
| 20 to 24 Years | 18 (81.8%) | 0 (0.0%) |
| 25 to 29 Years | 81 (78.6%) | 2 (2.5%) |
| 30 to 34 Years | 28 (100.0%) | 0 (0.0%) |
| 35 to 44 Years | 84 (88.4%) | 0 (0.0%) |
| 45 to 54 Years | 65 (70.7%) | 0 (0.0%) |
| 55 to 59 Years | 84 (76.4%) | 4 (4.8%) |
| 60 to 64 Years | 34 (38.2%) | 0 (0.0%) |
| 65 to 74 Years | 42 (35.3%) | 0 (0.0%) |
| 75 Years and over | 8 (4.9%) | 0 (0.0%) |
| Total | 448 (53.3%) | 6 (1.3%) |
Employment Status by Educational Attainment in Pigeon
According to labor force statistics for Pigeon, 72.7% of individuals (376) out of the total population between 25 and 64 years of age (517) are in the labor force, with 1.6% or 6 of them being unemployed. The group with the highest labor force participation rate are those with the educational attainment of less than high school, with 89.7% or 26 individuals in the labor force. Within the labor force, individuals with high school diploma education have the highest percentage of unemployment, with 3.0% or 4 of them being unemployed.
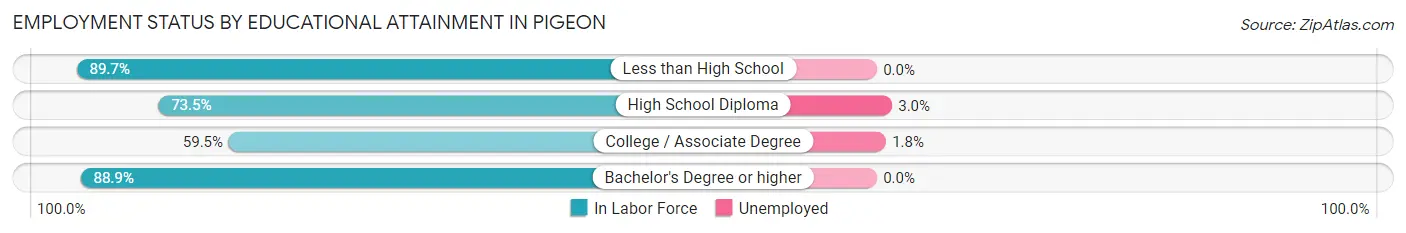
| Educational Attainment | In Labor Force | Unemployed |
| Less than High School | 26 (89.7%) | 0 (0.0%) |
| High School Diploma | 133 (73.5%) | 5 (3.0%) |
| College / Associate Degree | 113 (59.5%) | 3 (1.8%) |
| Bachelor's Degree or higher | 104 (88.9%) | 0 (0.0%) |
| Total | 376 (72.7%) | 8 (1.6%) |
Employment Occupations by Sex in Pigeon
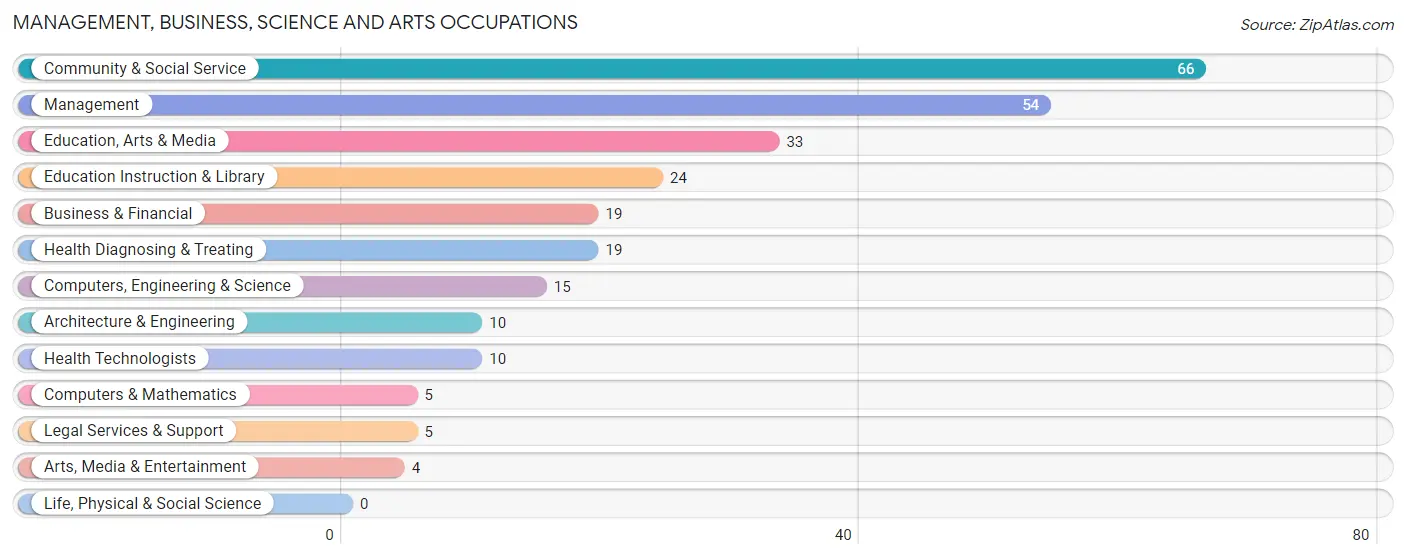
Management, Business, Science and Arts Occupations
The most common Management, Business, Science and Arts occupations in Pigeon are Community & Social Service (66 | 14.9%), Management (54 | 12.2%), Education, Arts & Media (33 | 7.5%), Education Instruction & Library (24 | 5.4%), and Business & Financial (19 | 4.3%).
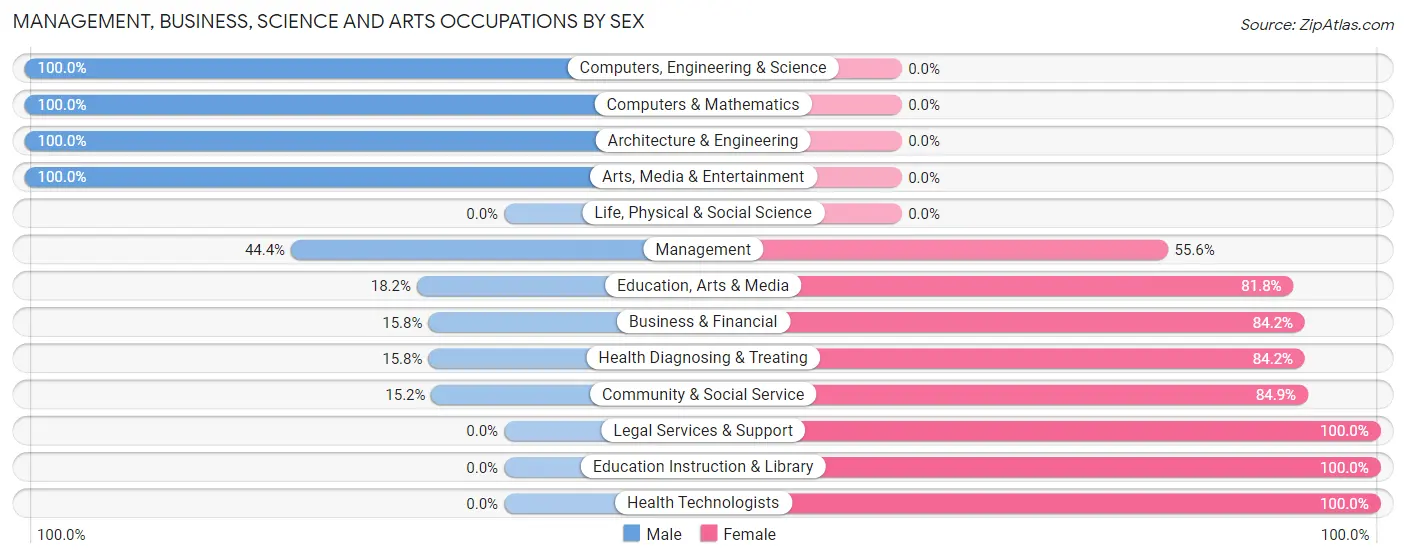
Management, Business, Science and Arts Occupations by Sex
Within the Management, Business, Science and Arts occupations in Pigeon, the most male-oriented occupations are Computers, Engineering & Science (100.0%), Computers & Mathematics (100.0%), and Architecture & Engineering (100.0%), while the most female-oriented occupations are Legal Services & Support (100.0%), Education Instruction & Library (100.0%), and Health Technologists (100.0%).
| Occupation | Male | Female |
| Management | 24 (44.4%) | 30 (55.6%) |
| Business & Financial | 3 (15.8%) | 16 (84.2%) |
| Computers, Engineering & Science | 15 (100.0%) | 0 (0.0%) |
| Computers & Mathematics | 5 (100.0%) | 0 (0.0%) |
| Architecture & Engineering | 10 (100.0%) | 0 (0.0%) |
| Life, Physical & Social Science | 0 (0.0%) | 0 (0.0%) |
| Community & Social Service | 10 (15.1%) | 56 (84.9%) |
| Education, Arts & Media | 6 (18.2%) | 27 (81.8%) |
| Legal Services & Support | 0 (0.0%) | 5 (100.0%) |
| Education Instruction & Library | 0 (0.0%) | 24 (100.0%) |
| Arts, Media & Entertainment | 4 (100.0%) | 0 (0.0%) |
| Health Diagnosing & Treating | 3 (15.8%) | 16 (84.2%) |
| Health Technologists | 0 (0.0%) | 10 (100.0%) |
| Total (Category) | 55 (31.8%) | 118 (68.2%) |
| Total (Overall) | 229 (51.8%) | 213 (48.2%) |
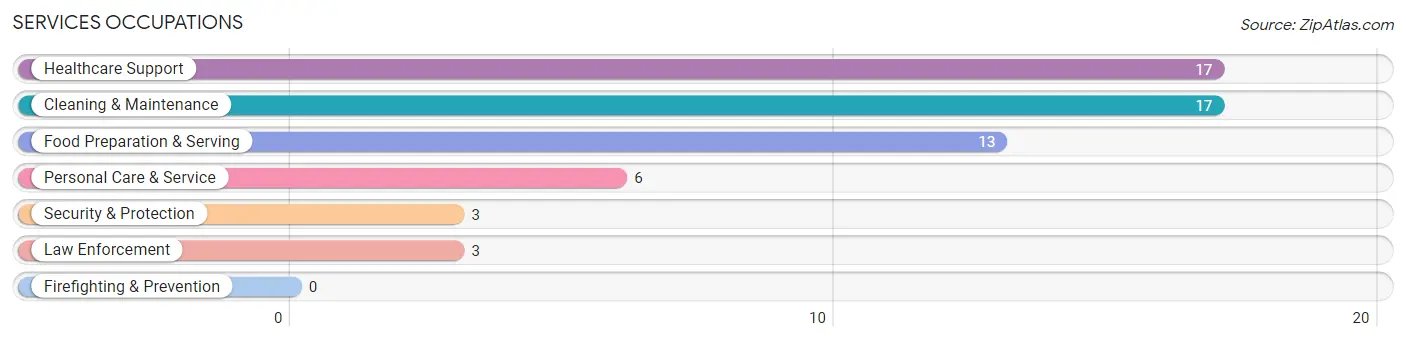
Services Occupations
The most common Services occupations in Pigeon are Healthcare Support (17 | 3.8%), Cleaning & Maintenance (17 | 3.8%), Food Preparation & Serving (13 | 2.9%), Personal Care & Service (6 | 1.4%), and Security & Protection (3 | 0.7%).
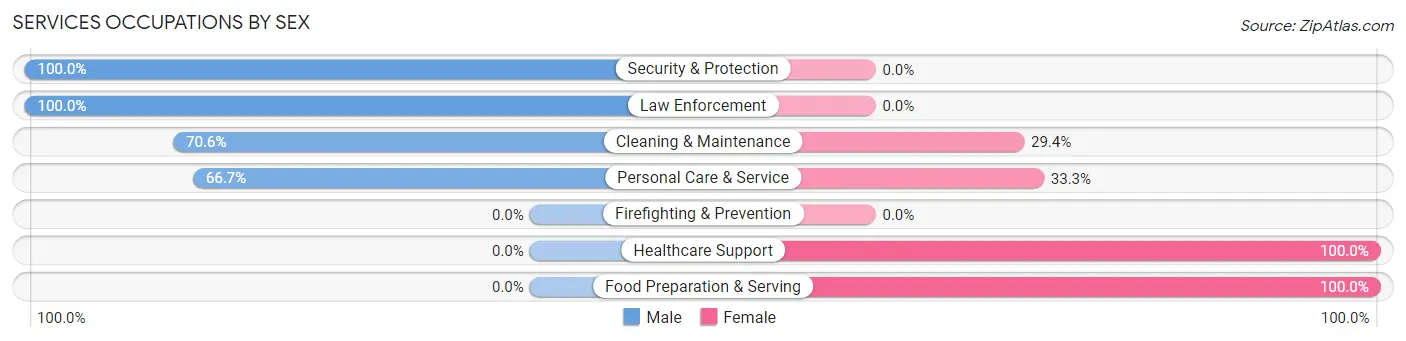
Services Occupations by Sex
Within the Services occupations in Pigeon, the most male-oriented occupations are Security & Protection (100.0%), Law Enforcement (100.0%), and Cleaning & Maintenance (70.6%), while the most female-oriented occupations are Healthcare Support (100.0%), Food Preparation & Serving (100.0%), and Personal Care & Service (33.3%).
| Occupation | Male | Female |
| Healthcare Support | 0 (0.0%) | 17 (100.0%) |
| Security & Protection | 3 (100.0%) | 0 (0.0%) |
| Firefighting & Prevention | 0 (0.0%) | 0 (0.0%) |
| Law Enforcement | 3 (100.0%) | 0 (0.0%) |
| Food Preparation & Serving | 0 (0.0%) | 13 (100.0%) |
| Cleaning & Maintenance | 12 (70.6%) | 5 (29.4%) |
| Personal Care & Service | 4 (66.7%) | 2 (33.3%) |
| Total (Category) | 19 (33.9%) | 37 (66.1%) |
| Total (Overall) | 229 (51.8%) | 213 (48.2%) |
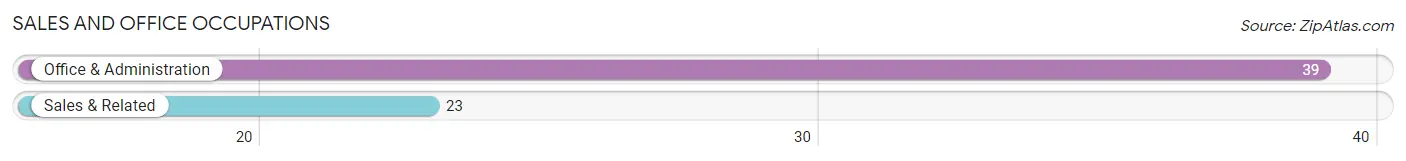
Sales and Office Occupations
The most common Sales and Office occupations in Pigeon are Office & Administration (39 | 8.8%), and Sales & Related (23 | 5.2%).
Sales and Office Occupations by Sex
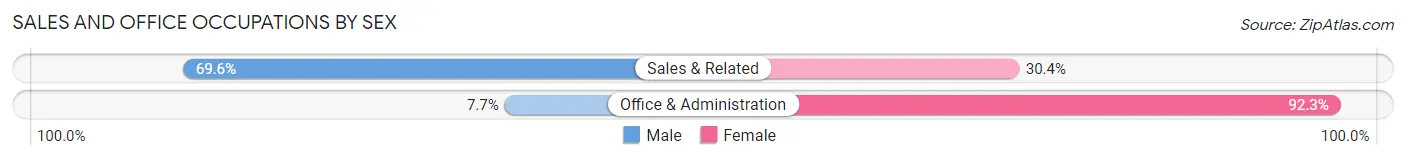
| Occupation | Male | Female |
| Sales & Related | 16 (69.6%) | 7 (30.4%) |
| Office & Administration | 3 (7.7%) | 36 (92.3%) |
| Total (Category) | 19 (30.6%) | 43 (69.4%) |
| Total (Overall) | 229 (51.8%) | 213 (48.2%) |
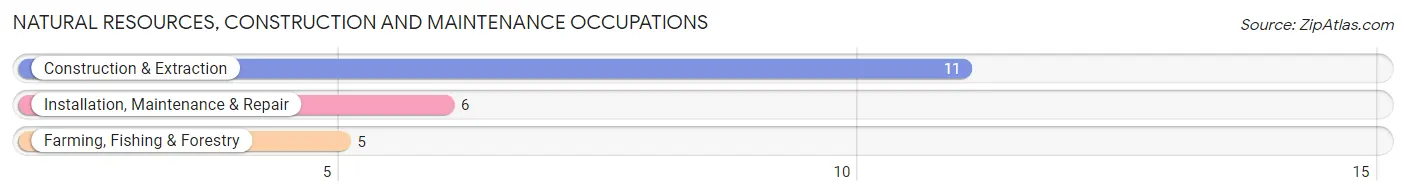
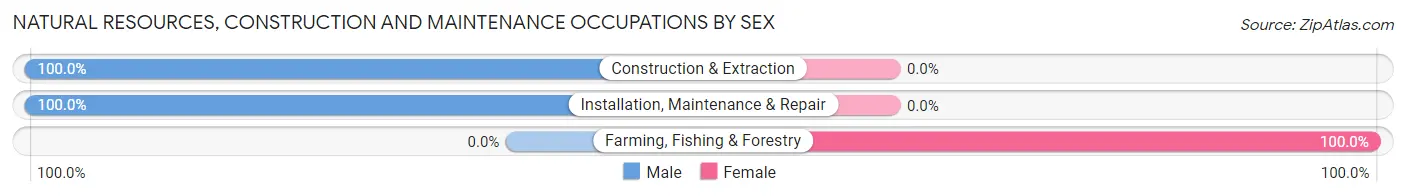
Natural Resources, Construction and Maintenance Occupations
The most common Natural Resources, Construction and Maintenance occupations in Pigeon are Construction & Extraction (11 | 2.5%), Installation, Maintenance & Repair (6 | 1.4%), and Farming, Fishing & Forestry (5 | 1.1%).
Natural Resources, Construction and Maintenance Occupations by Sex
| Occupation | Male | Female |
| Farming, Fishing & Forestry | 0 (0.0%) | 5 (100.0%) |
| Construction & Extraction | 11 (100.0%) | 0 (0.0%) |
| Installation, Maintenance & Repair | 6 (100.0%) | 0 (0.0%) |
| Total (Category) | 17 (77.3%) | 5 (22.7%) |
| Total (Overall) | 229 (51.8%) | 213 (48.2%) |
Production, Transportation and Moving Occupations
The most common Production, Transportation and Moving occupations in Pigeon are Production (75 | 17.0%), Material Moving (36 | 8.1%), and Transportation (18 | 4.1%).
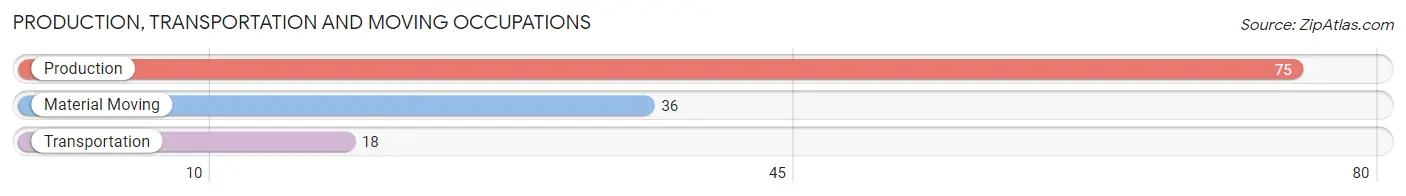
Production, Transportation and Moving Occupations by Sex
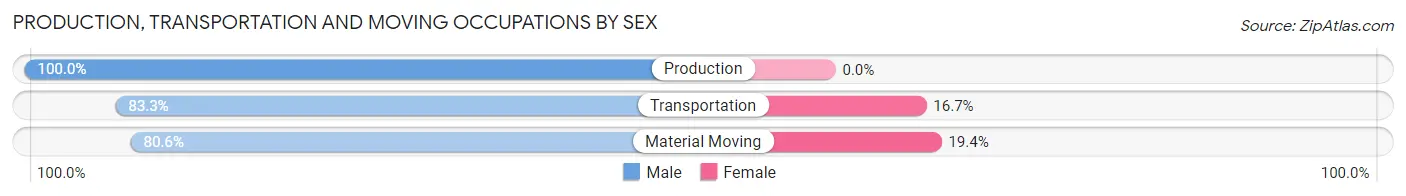
| Occupation | Male | Female |
| Production | 75 (100.0%) | 0 (0.0%) |
| Transportation | 15 (83.3%) | 3 (16.7%) |
| Material Moving | 29 (80.6%) | 7 (19.4%) |
| Total (Category) | 119 (92.2%) | 10 (7.7%) |
| Total (Overall) | 229 (51.8%) | 213 (48.2%) |
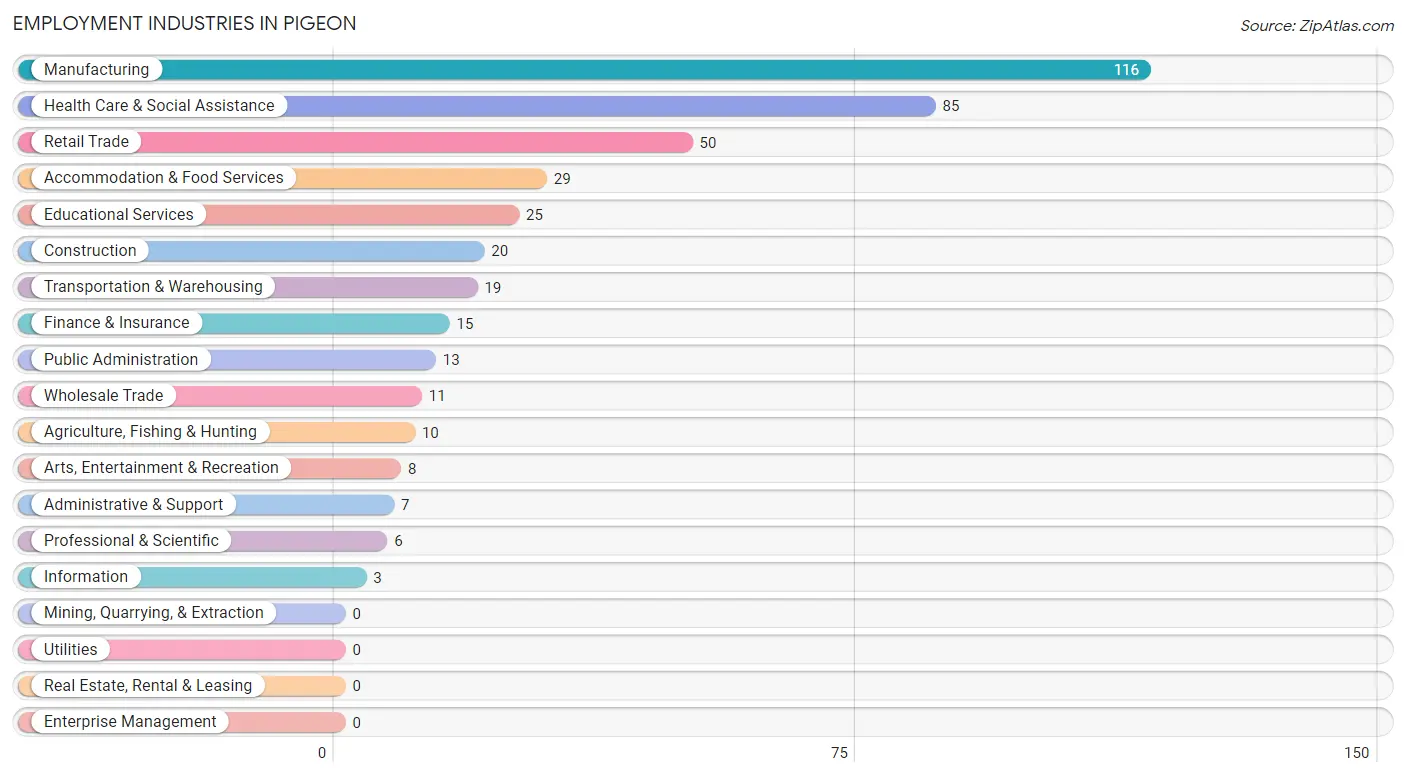
Employment Industries by Sex in Pigeon
Employment Industries in Pigeon
The major employment industries in Pigeon include Manufacturing (116 | 26.2%), Health Care & Social Assistance (85 | 19.2%), Retail Trade (50 | 11.3%), Accommodation & Food Services (29 | 6.6%), and Educational Services (25 | 5.7%).
Employment Industries by Sex in Pigeon
The Pigeon industries that see more men than women are Wholesale Trade (100.0%), Transportation & Warehousing (100.0%), and Information (100.0%), whereas the industries that tend to have a higher number of women are Educational Services (100.0%), Health Care & Social Assistance (94.1%), and Accommodation & Food Services (89.7%).
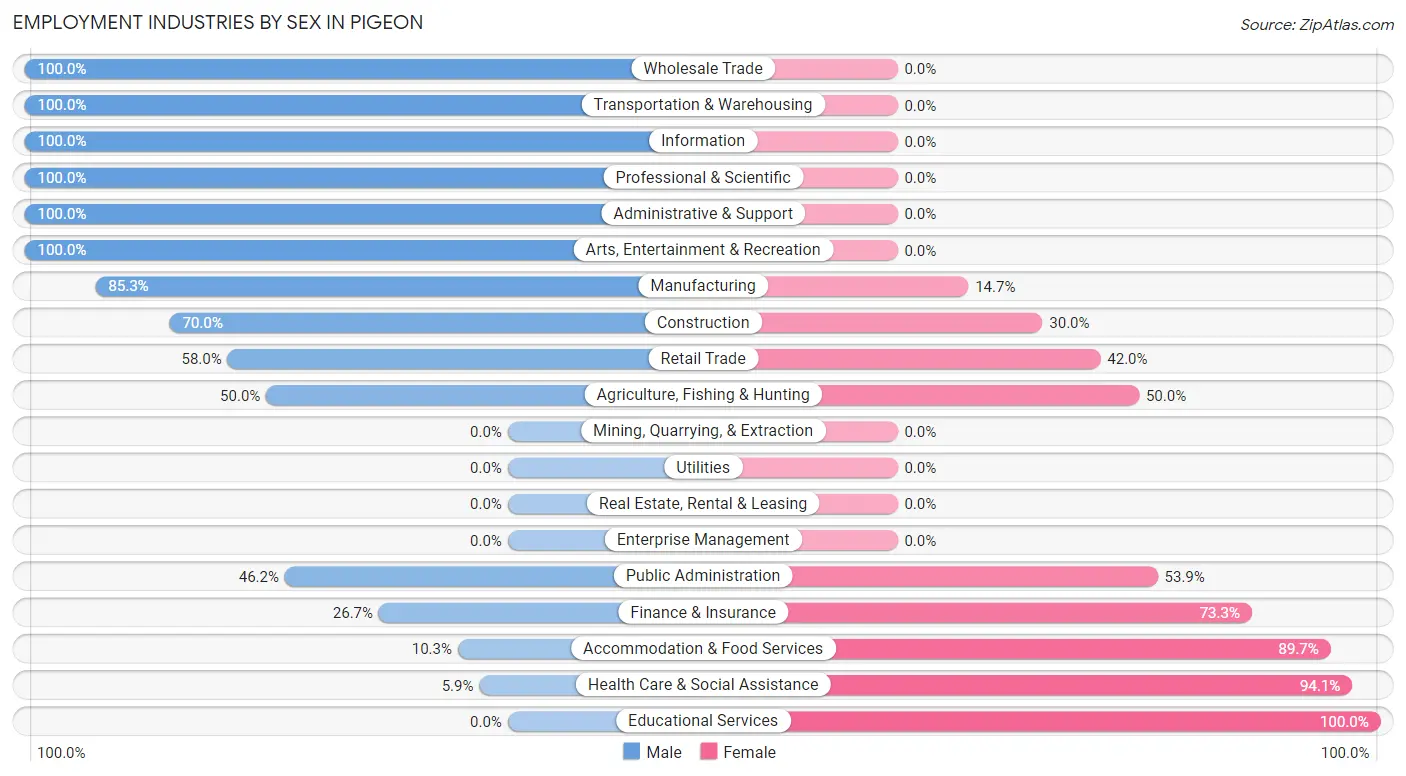
| Industry | Male | Female |
| Agriculture, Fishing & Hunting | 5 (50.0%) | 5 (50.0%) |
| Mining, Quarrying, & Extraction | 0 (0.0%) | 0 (0.0%) |
| Construction | 14 (70.0%) | 6 (30.0%) |
| Manufacturing | 99 (85.3%) | 17 (14.7%) |
| Wholesale Trade | 11 (100.0%) | 0 (0.0%) |
| Retail Trade | 29 (58.0%) | 21 (42.0%) |
| Transportation & Warehousing | 19 (100.0%) | 0 (0.0%) |
| Utilities | 0 (0.0%) | 0 (0.0%) |
| Information | 3 (100.0%) | 0 (0.0%) |
| Finance & Insurance | 4 (26.7%) | 11 (73.3%) |
| Real Estate, Rental & Leasing | 0 (0.0%) | 0 (0.0%) |
| Professional & Scientific | 6 (100.0%) | 0 (0.0%) |
| Enterprise Management | 0 (0.0%) | 0 (0.0%) |
| Administrative & Support | 7 (100.0%) | 0 (0.0%) |
| Educational Services | 0 (0.0%) | 25 (100.0%) |
| Health Care & Social Assistance | 5 (5.9%) | 80 (94.1%) |
| Arts, Entertainment & Recreation | 8 (100.0%) | 0 (0.0%) |
| Accommodation & Food Services | 3 (10.3%) | 26 (89.7%) |
| Public Administration | 6 (46.2%) | 7 (53.8%) |
| Total | 229 (51.8%) | 213 (48.2%) |
Education in Pigeon
School Enrollment in Pigeon
The most common levels of schooling among the 239 students in Pigeon are elementary school (70 | 29.3%), nursery / preschool (41 | 17.2%), and high school (38 | 15.9%).
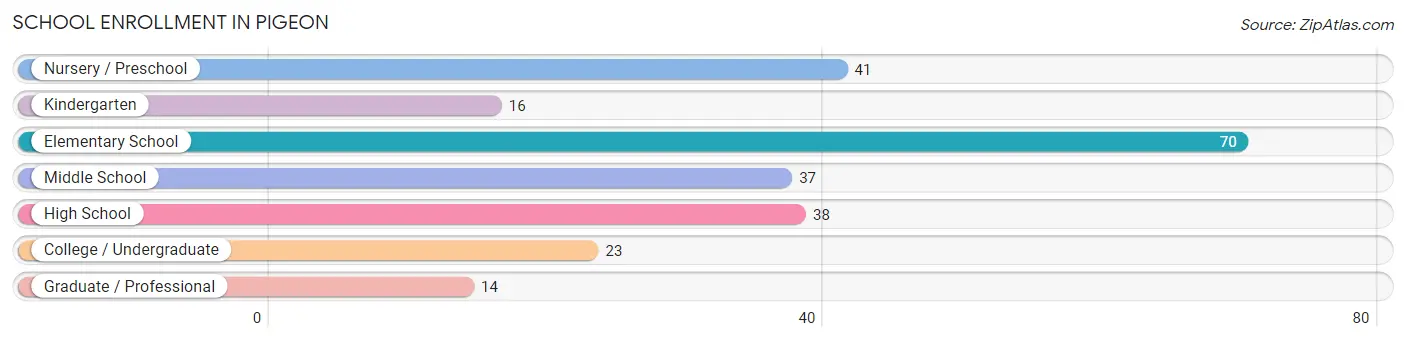
| School Level | # Students | % Students |
| Nursery / Preschool | 41 | 17.2% |
| Kindergarten | 16 | 6.7% |
| Elementary School | 70 | 29.3% |
| Middle School | 37 | 15.5% |
| High School | 38 | 15.9% |
| College / Undergraduate | 23 | 9.6% |
| Graduate / Professional | 14 | 5.9% |
| Total | 239 | 100.0% |
School Enrollment by Age by Funding Source in Pigeon
Out of a total of 239 students who are enrolled in schools in Pigeon, 15 (6.3%) attend a private institution, while the remaining 224 (93.7%) are enrolled in public schools. The age group of 10 to 14 year olds has the highest likelihood of being enrolled in private schools, with 10 (19.2% in the age bracket) enrolled. Conversely, the age group of 3 to 4 year olds has the lowest likelihood of being enrolled in a private school, with 23 (100.0% in the age bracket) attending a public institution.
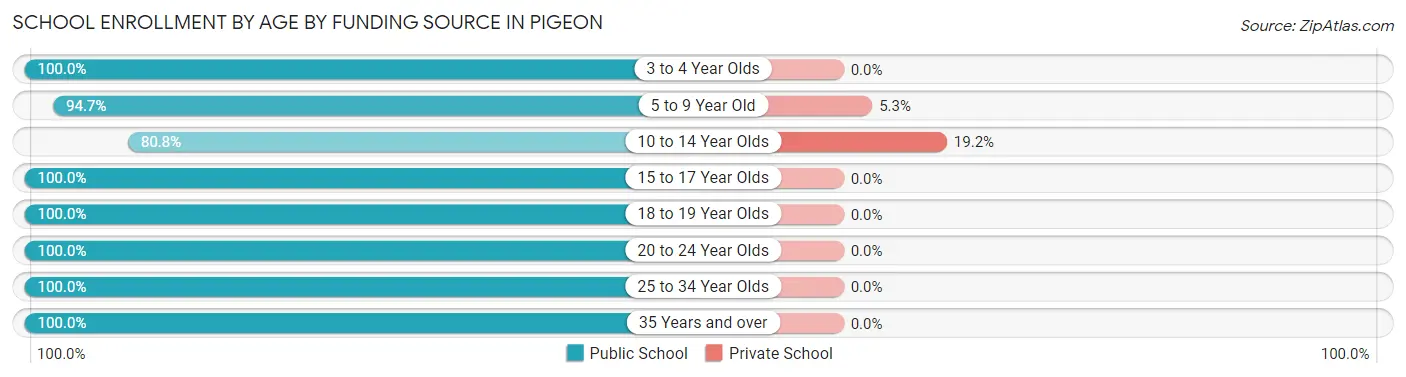
| Age Bracket | Public School | Private School |
| 3 to 4 Year Olds | 23 (100.0%) | 0 (0.0%) |
| 5 to 9 Year Old | 89 (94.7%) | 5 (5.3%) |
| 10 to 14 Year Olds | 42 (80.8%) | 10 (19.2%) |
| 15 to 17 Year Olds | 27 (100.0%) | 0 (0.0%) |
| 18 to 19 Year Olds | 10 (100.0%) | 0 (0.0%) |
| 20 to 24 Year Olds | 10 (100.0%) | 0 (0.0%) |
| 25 to 34 Year Olds | 17 (100.0%) | 0 (0.0%) |
| 35 Years and over | 6 (100.0%) | 0 (0.0%) |
| Total | 224 (93.7%) | 15 (6.3%) |
Educational Attainment by Field of Study in Pigeon
Business (37 | 20.3%), education (35 | 19.2%), science & technology (30 | 16.5%), arts & humanities (29 | 15.9%), and psychology (11 | 6.0%) are the most common fields of study among 182 individuals in Pigeon who have obtained a bachelor's degree or higher.
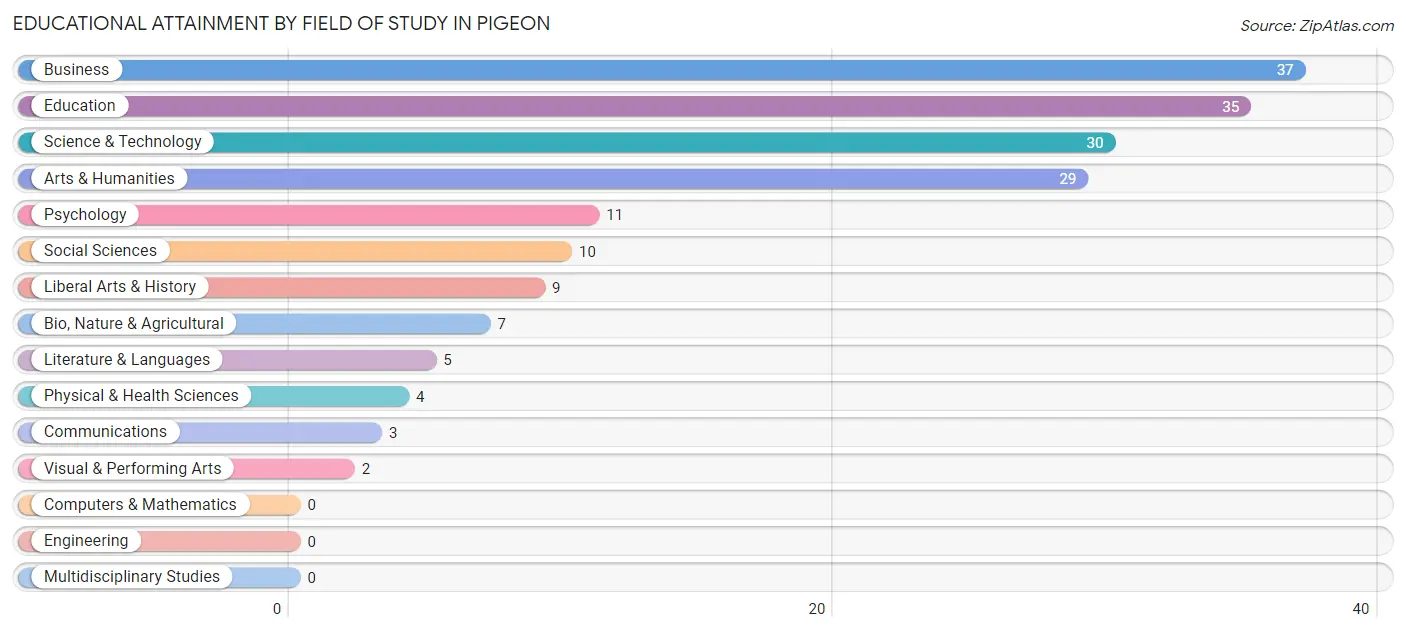
| Field of Study | # Graduates | % Graduates |
| Computers & Mathematics | 0 | 0.0% |
| Bio, Nature & Agricultural | 7 | 3.8% |
| Physical & Health Sciences | 4 | 2.2% |
| Psychology | 11 | 6.0% |
| Social Sciences | 10 | 5.5% |
| Engineering | 0 | 0.0% |
| Multidisciplinary Studies | 0 | 0.0% |
| Science & Technology | 30 | 16.5% |
| Business | 37 | 20.3% |
| Education | 35 | 19.2% |
| Literature & Languages | 5 | 2.8% |
| Liberal Arts & History | 9 | 5.0% |
| Visual & Performing Arts | 2 | 1.1% |
| Communications | 3 | 1.7% |
| Arts & Humanities | 29 | 15.9% |
| Total | 182 | 100.0% |
Transportation & Commute in Pigeon
Vehicle Availability by Sex in Pigeon
The most prevalent vehicle ownership categories in Pigeon are males with 2 vehicles (99, accounting for 43.2%) and females with 2 vehicles (88, making up 46.7%).
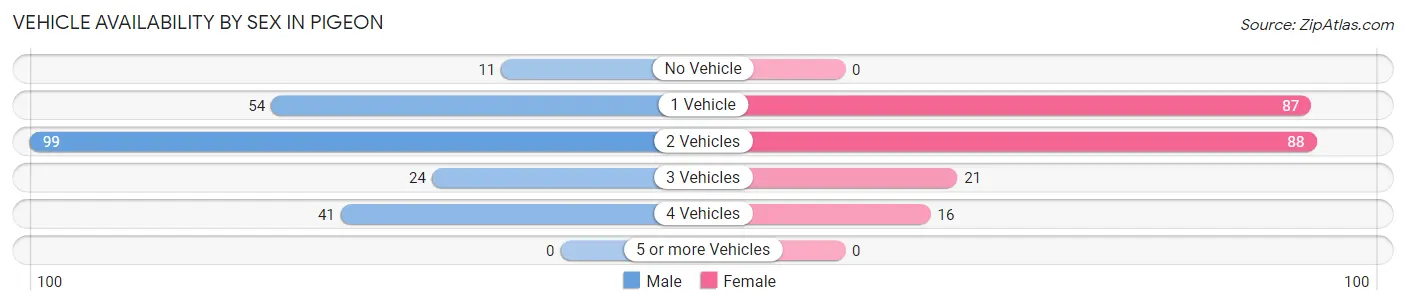
| Vehicles Available | Male | Female |
| No Vehicle | 11 (4.8%) | 0 (0.0%) |
| 1 Vehicle | 54 (23.6%) | 87 (41.0%) |
| 2 Vehicles | 99 (43.2%) | 88 (41.5%) |
| 3 Vehicles | 24 (10.5%) | 21 (9.9%) |
| 4 Vehicles | 41 (17.9%) | 16 (7.5%) |
| 5 or more Vehicles | 0 (0.0%) | 0 (0.0%) |
| Total | 229 (100.0%) | 212 (100.0%) |
Commute Time in Pigeon
The most frequently occuring commute durations in Pigeon are 5 to 9 minutes (117 commuters, 27.4%), less than 5 minutes (87 commuters, 20.4%), and 10 to 14 minutes (57 commuters, 13.4%).
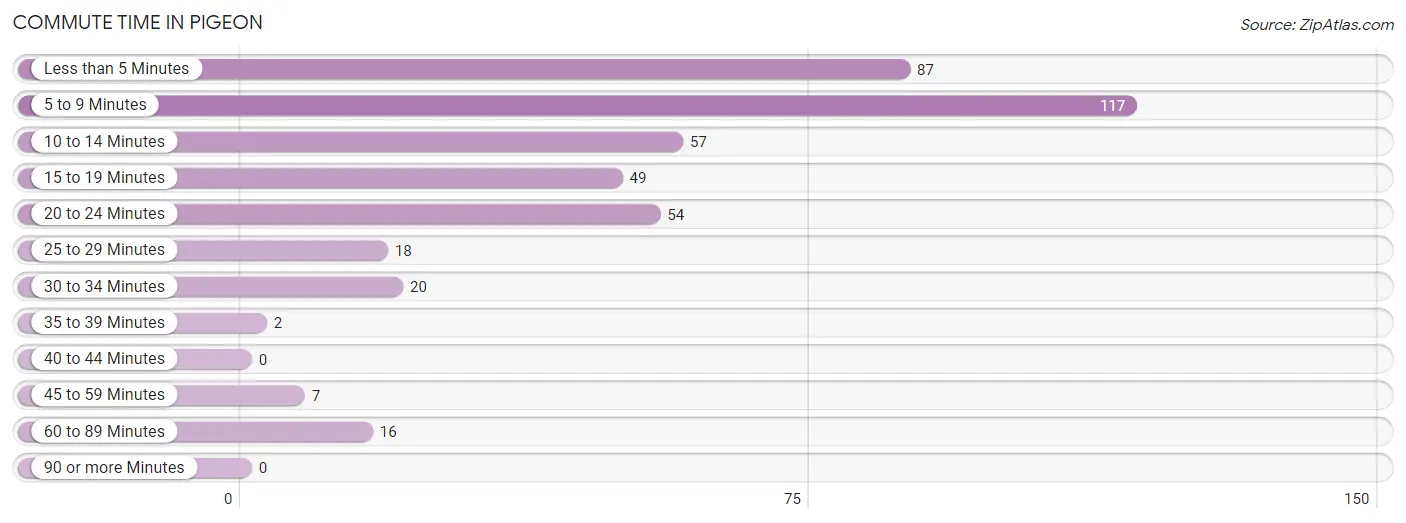
| Commute Time | # Commuters | % Commuters |
| Less than 5 Minutes | 87 | 20.4% |
| 5 to 9 Minutes | 117 | 27.4% |
| 10 to 14 Minutes | 57 | 13.4% |
| 15 to 19 Minutes | 49 | 11.5% |
| 20 to 24 Minutes | 54 | 12.7% |
| 25 to 29 Minutes | 18 | 4.2% |
| 30 to 34 Minutes | 20 | 4.7% |
| 35 to 39 Minutes | 2 | 0.5% |
| 40 to 44 Minutes | 0 | 0.0% |
| 45 to 59 Minutes | 7 | 1.6% |
| 60 to 89 Minutes | 16 | 3.7% |
| 90 or more Minutes | 0 | 0.0% |
Commute Time by Sex in Pigeon
The most common commute times in Pigeon are 5 to 9 minutes (72 commuters, 32.4%) for males and less than 5 minutes (47 commuters, 22.9%) for females.
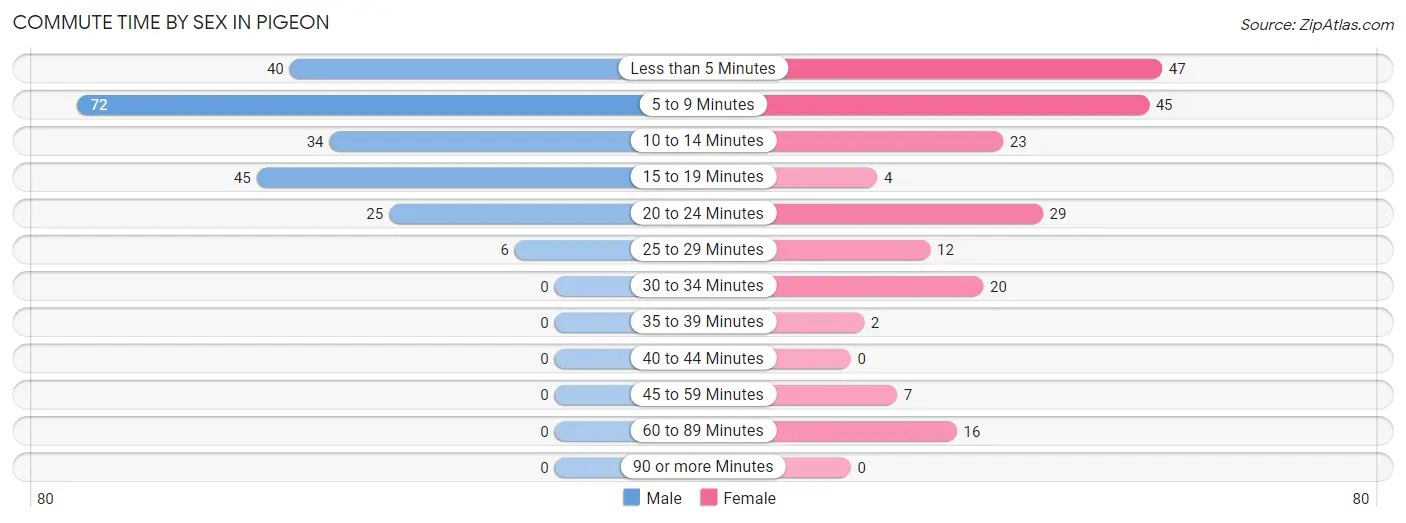
| Commute Time | Male | Female |
| Less than 5 Minutes | 40 (18.0%) | 47 (22.9%) |
| 5 to 9 Minutes | 72 (32.4%) | 45 (22.0%) |
| 10 to 14 Minutes | 34 (15.3%) | 23 (11.2%) |
| 15 to 19 Minutes | 45 (20.3%) | 4 (1.9%) |
| 20 to 24 Minutes | 25 (11.3%) | 29 (14.1%) |
| 25 to 29 Minutes | 6 (2.7%) | 12 (5.9%) |
| 30 to 34 Minutes | 0 (0.0%) | 20 (9.8%) |
| 35 to 39 Minutes | 0 (0.0%) | 2 (1.0%) |
| 40 to 44 Minutes | 0 (0.0%) | 0 (0.0%) |
| 45 to 59 Minutes | 0 (0.0%) | 7 (3.4%) |
| 60 to 89 Minutes | 0 (0.0%) | 16 (7.8%) |
| 90 or more Minutes | 0 (0.0%) | 0 (0.0%) |
Time of Departure to Work by Sex in Pigeon
The most frequent times of departure to work in Pigeon are 6:30 AM to 6:59 AM (42, 18.9%) for males and 7:00 AM to 7:29 AM (42, 20.5%) for females.
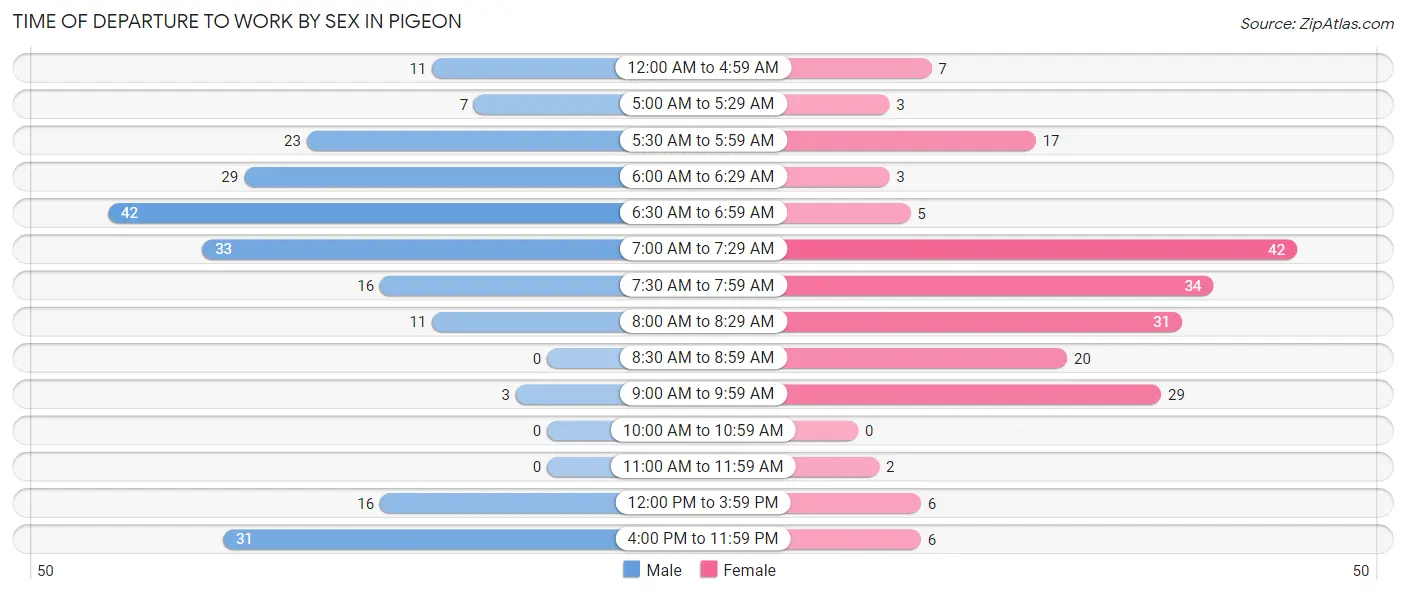
| Time of Departure | Male | Female |
| 12:00 AM to 4:59 AM | 11 (5.0%) | 7 (3.4%) |
| 5:00 AM to 5:29 AM | 7 (3.2%) | 3 (1.5%) |
| 5:30 AM to 5:59 AM | 23 (10.4%) | 17 (8.3%) |
| 6:00 AM to 6:29 AM | 29 (13.1%) | 3 (1.5%) |
| 6:30 AM to 6:59 AM | 42 (18.9%) | 5 (2.4%) |
| 7:00 AM to 7:29 AM | 33 (14.9%) | 42 (20.5%) |
| 7:30 AM to 7:59 AM | 16 (7.2%) | 34 (16.6%) |
| 8:00 AM to 8:29 AM | 11 (5.0%) | 31 (15.1%) |
| 8:30 AM to 8:59 AM | 0 (0.0%) | 20 (9.8%) |
| 9:00 AM to 9:59 AM | 3 (1.3%) | 29 (14.1%) |
| 10:00 AM to 10:59 AM | 0 (0.0%) | 0 (0.0%) |
| 11:00 AM to 11:59 AM | 0 (0.0%) | 2 (1.0%) |
| 12:00 PM to 3:59 PM | 16 (7.2%) | 6 (2.9%) |
| 4:00 PM to 11:59 PM | 31 (14.0%) | 6 (2.9%) |
| Total | 222 (100.0%) | 205 (100.0%) |
Housing Occupancy in Pigeon
Occupancy by Ownership in Pigeon
Of the total 524 dwellings in Pigeon, owner-occupied units account for 312 (59.5%), while renter-occupied units make up 212 (40.5%).
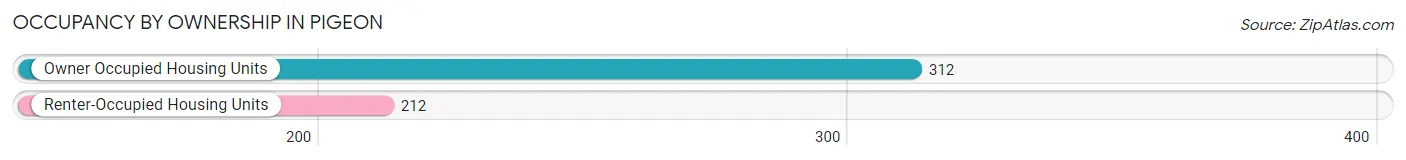
| Occupancy | # Housing Units | % Housing Units |
| Owner Occupied Housing Units | 312 | 59.5% |
| Renter-Occupied Housing Units | 212 | 40.5% |
| Total Occupied Housing Units | 524 | 100.0% |
Occupancy by Household Size in Pigeon
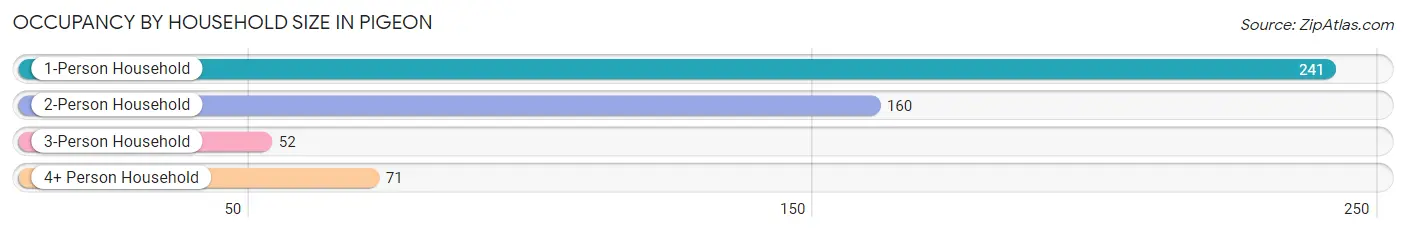
| Household Size | # Housing Units | % Housing Units |
| 1-Person Household | 241 | 46.0% |
| 2-Person Household | 160 | 30.5% |
| 3-Person Household | 52 | 9.9% |
| 4+ Person Household | 71 | 13.6% |
| Total Housing Units | 524 | 100.0% |
Occupancy by Ownership by Household Size in Pigeon
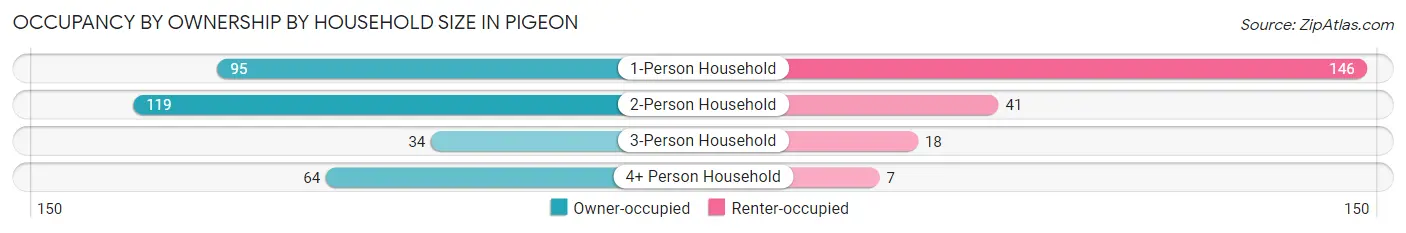
| Household Size | Owner-occupied | Renter-occupied |
| 1-Person Household | 95 (39.4%) | 146 (60.6%) |
| 2-Person Household | 119 (74.4%) | 41 (25.6%) |
| 3-Person Household | 34 (65.4%) | 18 (34.6%) |
| 4+ Person Household | 64 (90.1%) | 7 (9.9%) |
| Total Housing Units | 312 (59.5%) | 212 (40.5%) |
Occupancy by Educational Attainment in Pigeon
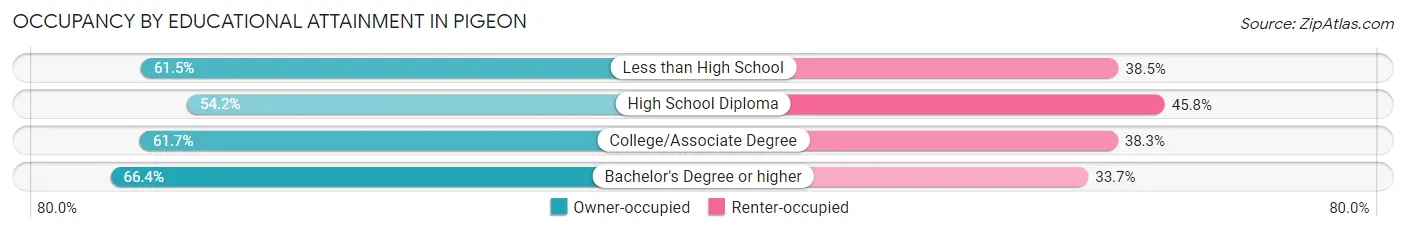
| Household Size | Owner-occupied | Renter-occupied |
| Less than High School | 16 (61.5%) | 10 (38.5%) |
| High School Diploma | 116 (54.2%) | 98 (45.8%) |
| College/Associate Degree | 111 (61.7%) | 69 (38.3%) |
| Bachelor's Degree or higher | 69 (66.3%) | 35 (33.7%) |
Occupancy by Age of Householder in Pigeon
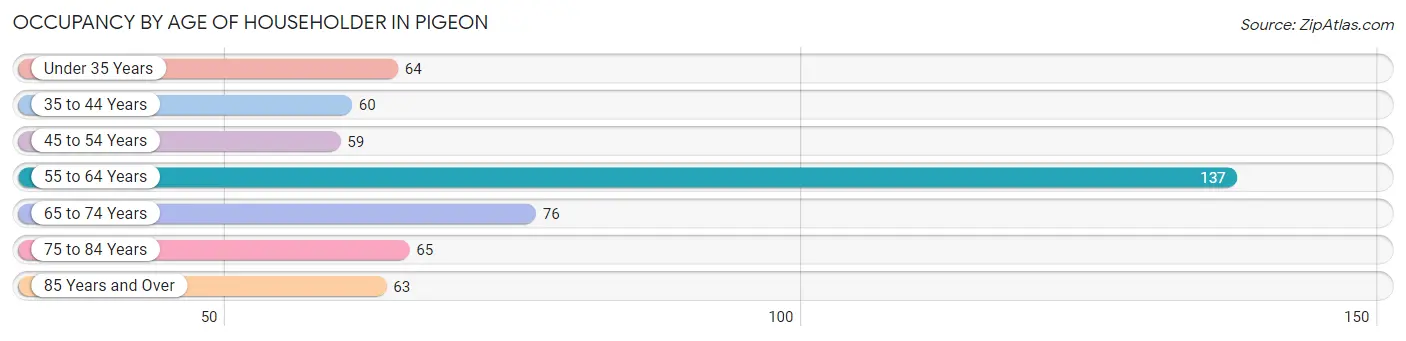
| Age Bracket | # Households | % Households |
| Under 35 Years | 64 | 12.2% |
| 35 to 44 Years | 60 | 11.5% |
| 45 to 54 Years | 59 | 11.3% |
| 55 to 64 Years | 137 | 26.2% |
| 65 to 74 Years | 76 | 14.5% |
| 75 to 84 Years | 65 | 12.4% |
| 85 Years and Over | 63 | 12.0% |
| Total | 524 | 100.0% |
Housing Finances in Pigeon
Median Income by Occupancy in Pigeon
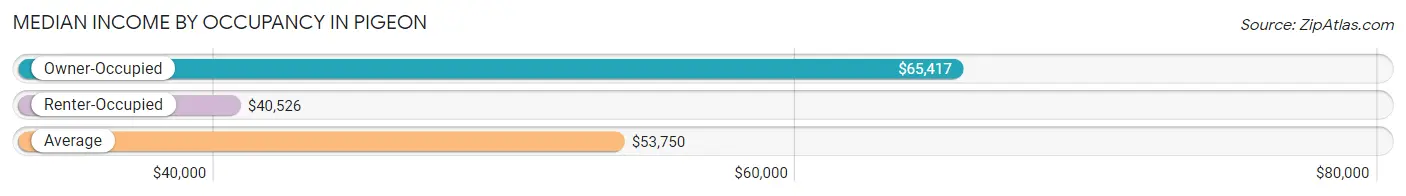
| Occupancy Type | # Households | Median Income |
| Owner-Occupied | 312 (59.5%) | $65,417 |
| Renter-Occupied | 212 (40.5%) | $40,526 |
| Average | 524 (100.0%) | $53,750 |
Occupancy by Householder Income Bracket in Pigeon
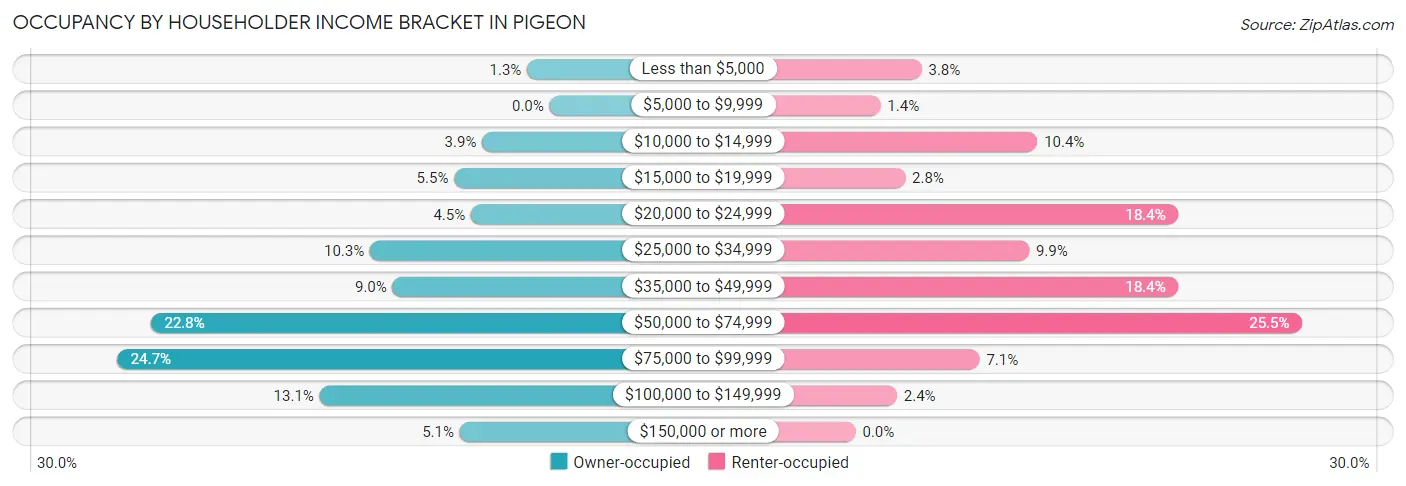
| Income Bracket | Owner-occupied | Renter-occupied |
| Less than $5,000 | 4 (1.3%) | 8 (3.8%) |
| $5,000 to $9,999 | 0 (0.0%) | 3 (1.4%) |
| $10,000 to $14,999 | 12 (3.8%) | 22 (10.4%) |
| $15,000 to $19,999 | 17 (5.4%) | 6 (2.8%) |
| $20,000 to $24,999 | 14 (4.5%) | 39 (18.4%) |
| $25,000 to $34,999 | 32 (10.3%) | 21 (9.9%) |
| $35,000 to $49,999 | 28 (9.0%) | 39 (18.4%) |
| $50,000 to $74,999 | 71 (22.8%) | 54 (25.5%) |
| $75,000 to $99,999 | 77 (24.7%) | 15 (7.1%) |
| $100,000 to $149,999 | 41 (13.1%) | 5 (2.4%) |
| $150,000 or more | 16 (5.1%) | 0 (0.0%) |
| Total | 312 (100.0%) | 212 (100.0%) |
Monthly Housing Cost Tiers in Pigeon
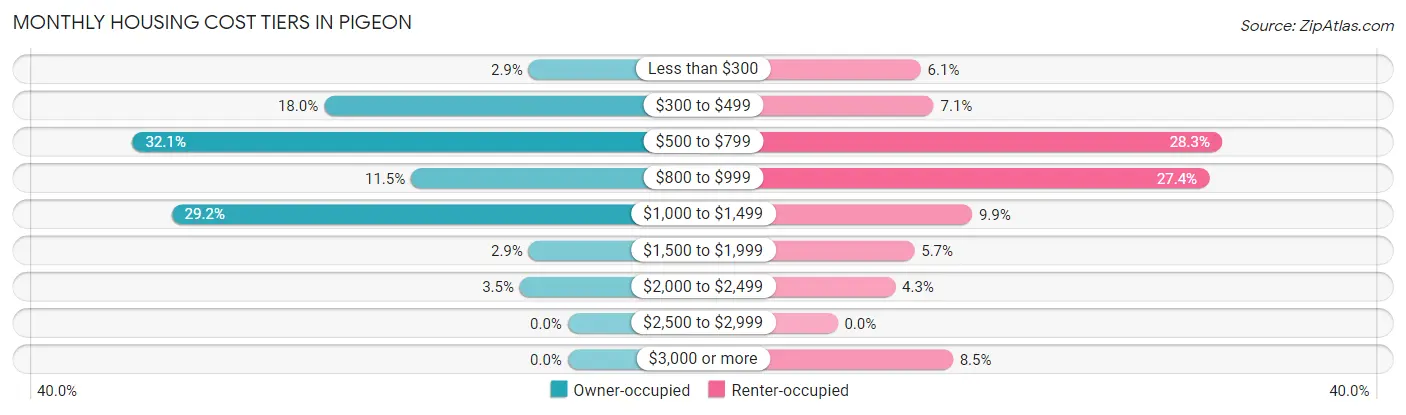
| Monthly Cost | Owner-occupied | Renter-occupied |
| Less than $300 | 9 (2.9%) | 13 (6.1%) |
| $300 to $499 | 56 (17.9%) | 15 (7.1%) |
| $500 to $799 | 100 (32.1%) | 60 (28.3%) |
| $800 to $999 | 36 (11.5%) | 58 (27.4%) |
| $1,000 to $1,499 | 91 (29.2%) | 21 (9.9%) |
| $1,500 to $1,999 | 9 (2.9%) | 12 (5.7%) |
| $2,000 to $2,499 | 11 (3.5%) | 9 (4.3%) |
| $2,500 to $2,999 | 0 (0.0%) | 0 (0.0%) |
| $3,000 or more | 0 (0.0%) | 18 (8.5%) |
| Total | 312 (100.0%) | 212 (100.0%) |
Physical Housing Characteristics in Pigeon
Housing Structures in Pigeon
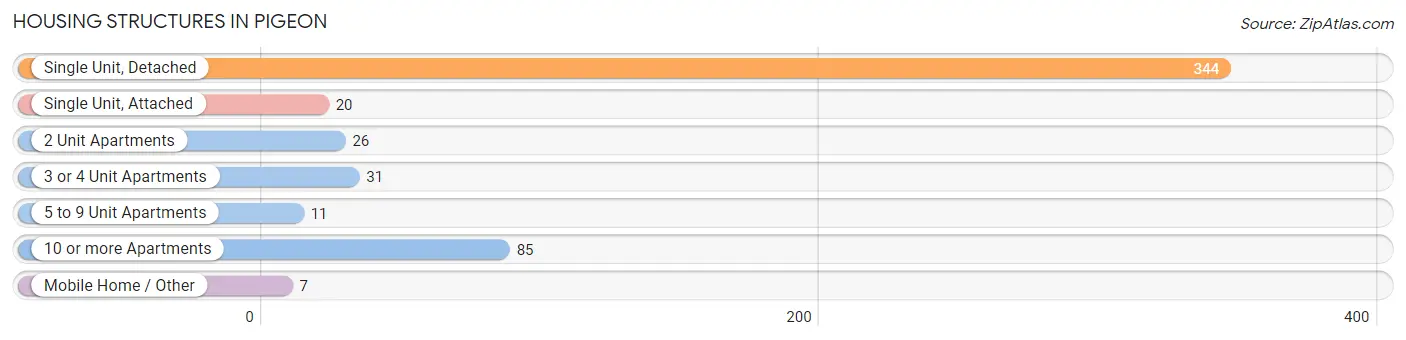
| Structure Type | # Housing Units | % Housing Units |
| Single Unit, Detached | 344 | 65.6% |
| Single Unit, Attached | 20 | 3.8% |
| 2 Unit Apartments | 26 | 5.0% |
| 3 or 4 Unit Apartments | 31 | 5.9% |
| 5 to 9 Unit Apartments | 11 | 2.1% |
| 10 or more Apartments | 85 | 16.2% |
| Mobile Home / Other | 7 | 1.3% |
| Total | 524 | 100.0% |
Housing Structures by Occupancy in Pigeon
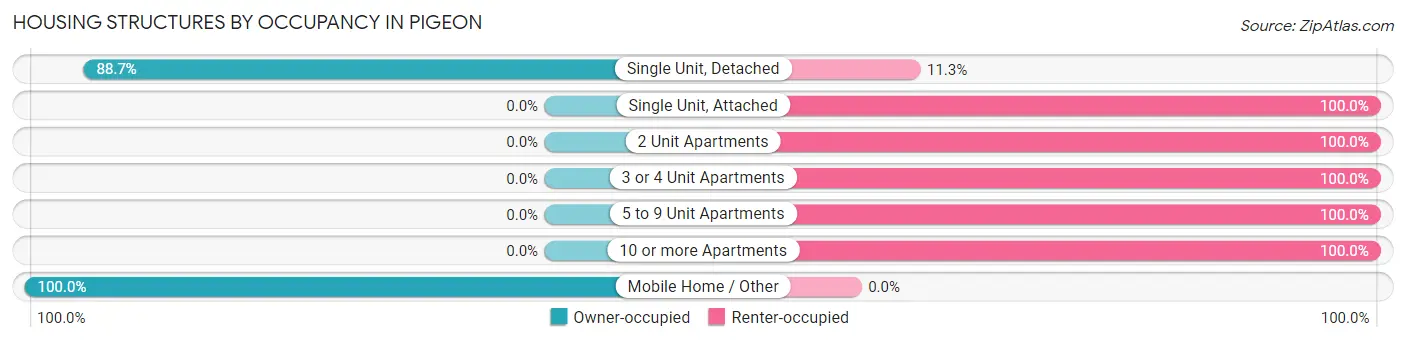
| Structure Type | Owner-occupied | Renter-occupied |
| Single Unit, Detached | 305 (88.7%) | 39 (11.3%) |
| Single Unit, Attached | 0 (0.0%) | 20 (100.0%) |
| 2 Unit Apartments | 0 (0.0%) | 26 (100.0%) |
| 3 or 4 Unit Apartments | 0 (0.0%) | 31 (100.0%) |
| 5 to 9 Unit Apartments | 0 (0.0%) | 11 (100.0%) |
| 10 or more Apartments | 0 (0.0%) | 85 (100.0%) |
| Mobile Home / Other | 7 (100.0%) | 0 (0.0%) |
| Total | 312 (59.5%) | 212 (40.5%) |
Housing Structures by Number of Rooms in Pigeon
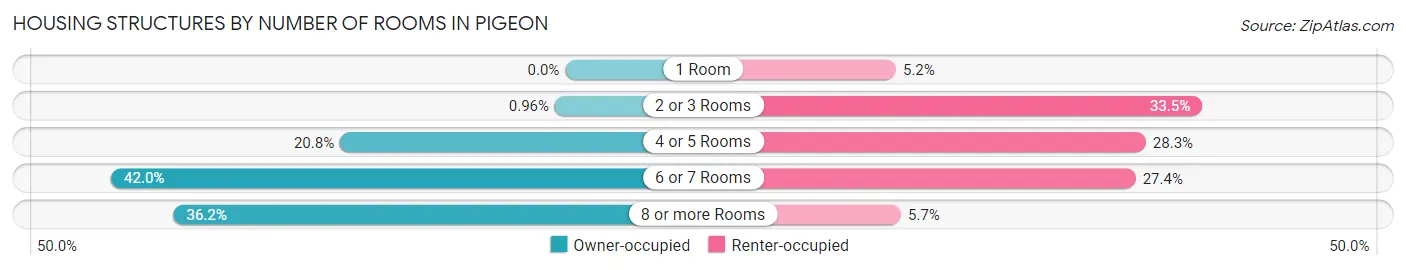
| Number of Rooms | Owner-occupied | Renter-occupied |
| 1 Room | 0 (0.0%) | 11 (5.2%) |
| 2 or 3 Rooms | 3 (1.0%) | 71 (33.5%) |
| 4 or 5 Rooms | 65 (20.8%) | 60 (28.3%) |
| 6 or 7 Rooms | 131 (42.0%) | 58 (27.4%) |
| 8 or more Rooms | 113 (36.2%) | 12 (5.7%) |
| Total | 312 (100.0%) | 212 (100.0%) |
Housing Structure by Heating Type in Pigeon
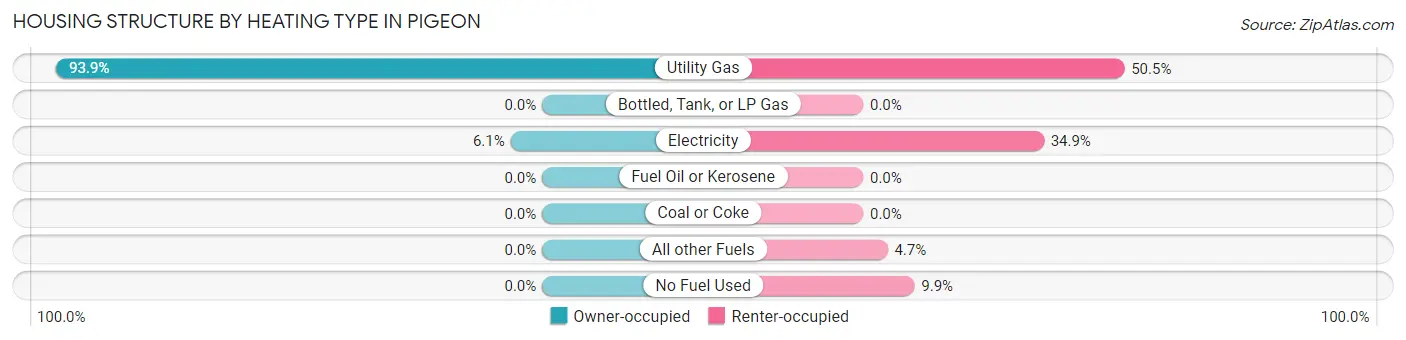
| Heating Type | Owner-occupied | Renter-occupied |
| Utility Gas | 293 (93.9%) | 107 (50.5%) |
| Bottled, Tank, or LP Gas | 0 (0.0%) | 0 (0.0%) |
| Electricity | 19 (6.1%) | 74 (34.9%) |
| Fuel Oil or Kerosene | 0 (0.0%) | 0 (0.0%) |
| Coal or Coke | 0 (0.0%) | 0 (0.0%) |
| All other Fuels | 0 (0.0%) | 10 (4.7%) |
| No Fuel Used | 0 (0.0%) | 21 (9.9%) |
| Total | 312 (100.0%) | 212 (100.0%) |
Household Vehicle Usage in Pigeon
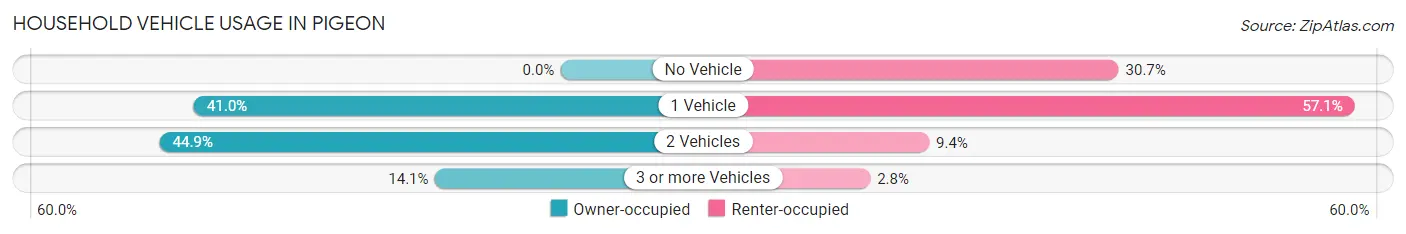
| Vehicles per Household | Owner-occupied | Renter-occupied |
| No Vehicle | 0 (0.0%) | 65 (30.7%) |
| 1 Vehicle | 128 (41.0%) | 121 (57.1%) |
| 2 Vehicles | 140 (44.9%) | 20 (9.4%) |
| 3 or more Vehicles | 44 (14.1%) | 6 (2.8%) |
| Total | 312 (100.0%) | 212 (100.0%) |
Real Estate & Mortgages in Pigeon
Real Estate and Mortgage Overview in Pigeon
| Characteristic | Without Mortgage | With Mortgage |
| Housing Units | 153 | 159 |
| Median Property Value | $99,200 | $102,800 |
| Median Household Income | $57,656 | $8 |
| Monthly Housing Costs | $535 | $0 |
| Real Estate Taxes | $1,794 | $10 |
Property Value by Mortgage Status in Pigeon
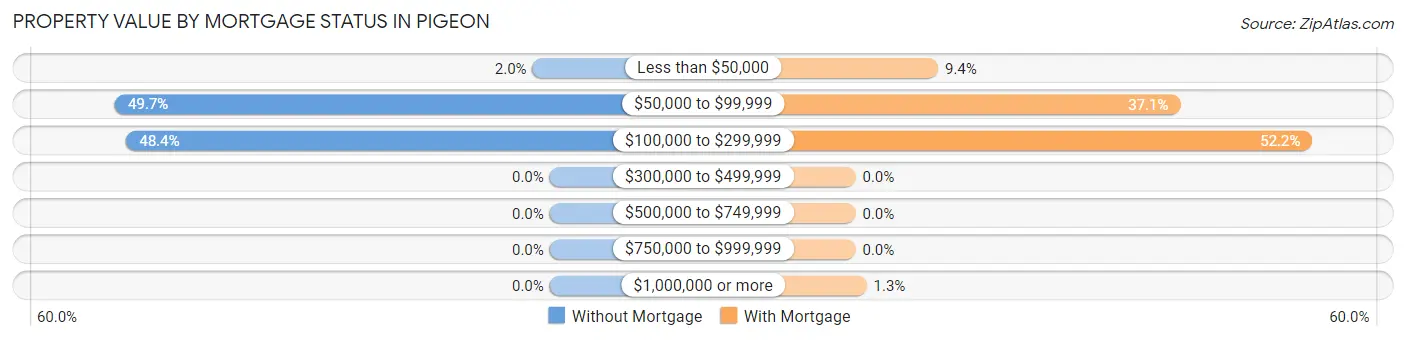
| Property Value | Without Mortgage | With Mortgage |
| Less than $50,000 | 3 (2.0%) | 15 (9.4%) |
| $50,000 to $99,999 | 76 (49.7%) | 59 (37.1%) |
| $100,000 to $299,999 | 74 (48.4%) | 83 (52.2%) |
| $300,000 to $499,999 | 0 (0.0%) | 0 (0.0%) |
| $500,000 to $749,999 | 0 (0.0%) | 0 (0.0%) |
| $750,000 to $999,999 | 0 (0.0%) | 0 (0.0%) |
| $1,000,000 or more | 0 (0.0%) | 2 (1.3%) |
| Total | 153 (100.0%) | 159 (100.0%) |
Household Income by Mortgage Status in Pigeon
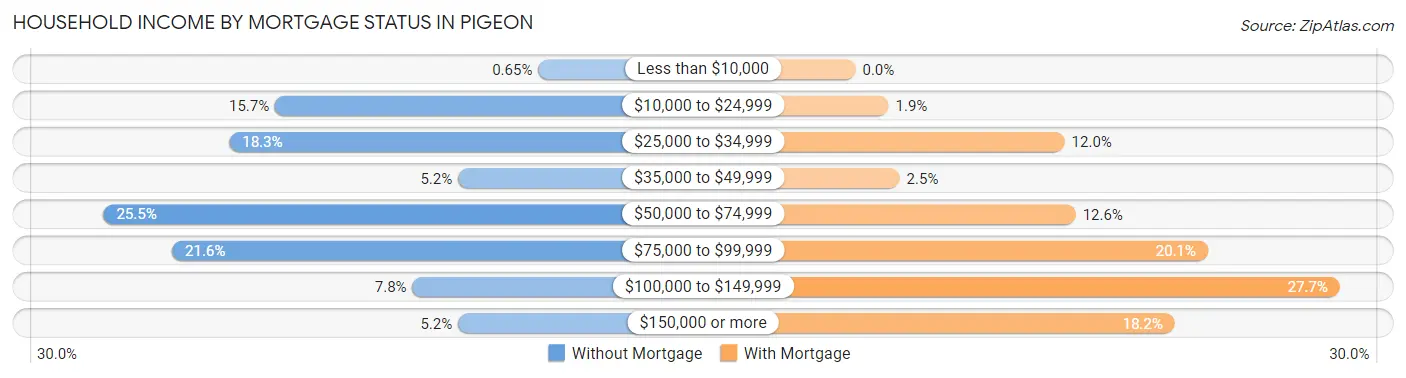
| Household Income | Without Mortgage | With Mortgage |
| Less than $10,000 | 1 (0.6%) | 0 (0.0%) |
| $10,000 to $24,999 | 24 (15.7%) | 3 (1.9%) |
| $25,000 to $34,999 | 28 (18.3%) | 19 (11.9%) |
| $35,000 to $49,999 | 8 (5.2%) | 4 (2.5%) |
| $50,000 to $74,999 | 39 (25.5%) | 20 (12.6%) |
| $75,000 to $99,999 | 33 (21.6%) | 32 (20.1%) |
| $100,000 to $149,999 | 12 (7.8%) | 44 (27.7%) |
| $150,000 or more | 8 (5.2%) | 29 (18.2%) |
| Total | 153 (100.0%) | 159 (100.0%) |
Property Value to Household Income Ratio in Pigeon
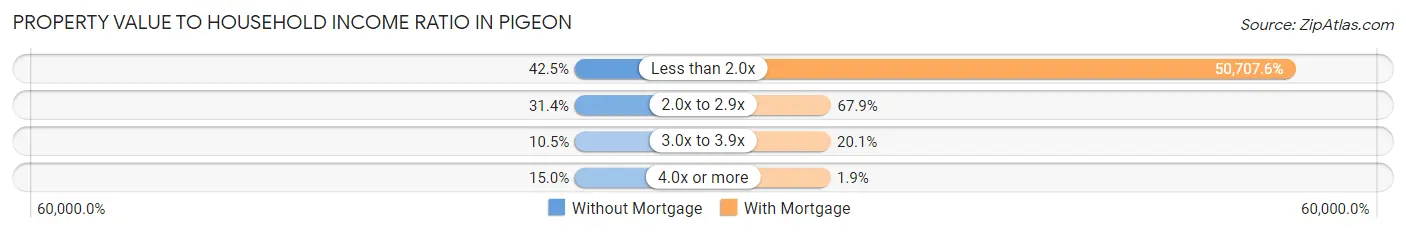
| Value-to-Income Ratio | Without Mortgage | With Mortgage |
| Less than 2.0x | 65 (42.5%) | 80,625 (50,707.5%) |
| 2.0x to 2.9x | 48 (31.4%) | 108 (67.9%) |
| 3.0x to 3.9x | 16 (10.5%) | 32 (20.1%) |
| 4.0x or more | 23 (15.0%) | 3 (1.9%) |
| Total | 153 (100.0%) | 159 (100.0%) |
Real Estate Taxes by Mortgage Status in Pigeon
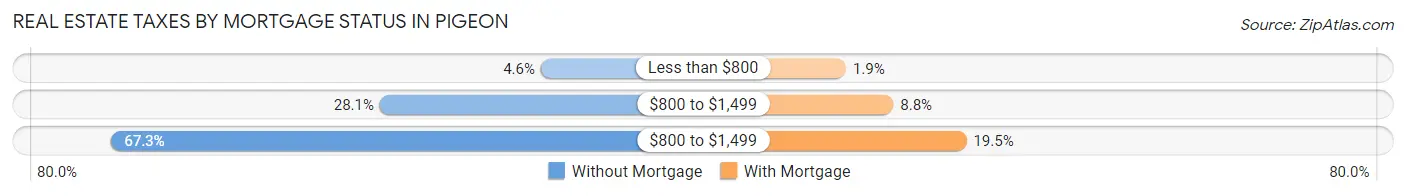
| Property Taxes | Without Mortgage | With Mortgage |
| Less than $800 | 7 (4.6%) | 3 (1.9%) |
| $800 to $1,499 | 43 (28.1%) | 14 (8.8%) |
| $800 to $1,499 | 103 (67.3%) | 31 (19.5%) |
| Total | 153 (100.0%) | 159 (100.0%) |
Health & Disability in Pigeon
Health Insurance Coverage by Age in Pigeon
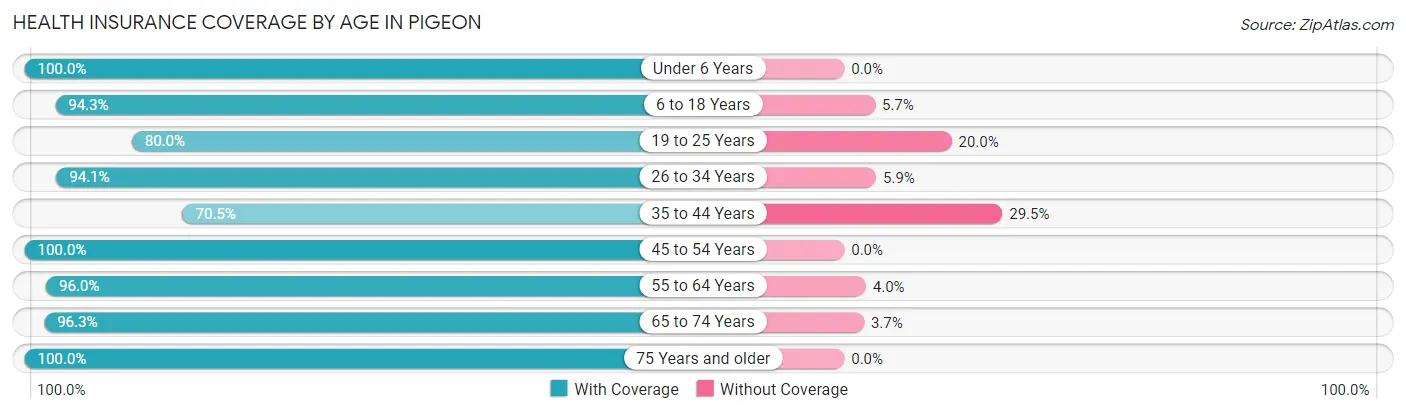
| Age Bracket | With Coverage | Without Coverage |
| Under 6 Years | 121 (100.0%) | 0 (0.0%) |
| 6 to 18 Years | 148 (94.3%) | 9 (5.7%) |
| 19 to 25 Years | 28 (80.0%) | 7 (20.0%) |
| 26 to 34 Years | 111 (94.1%) | 7 (5.9%) |
| 35 to 44 Years | 67 (70.5%) | 28 (29.5%) |
| 45 to 54 Years | 92 (100.0%) | 0 (0.0%) |
| 55 to 64 Years | 191 (96.0%) | 8 (4.0%) |
| 65 to 74 Years | 105 (96.3%) | 4 (3.7%) |
| 75 Years and older | 155 (100.0%) | 0 (0.0%) |
| Total | 1,018 (94.2%) | 63 (5.8%) |
Health Insurance Coverage by Citizenship Status in Pigeon
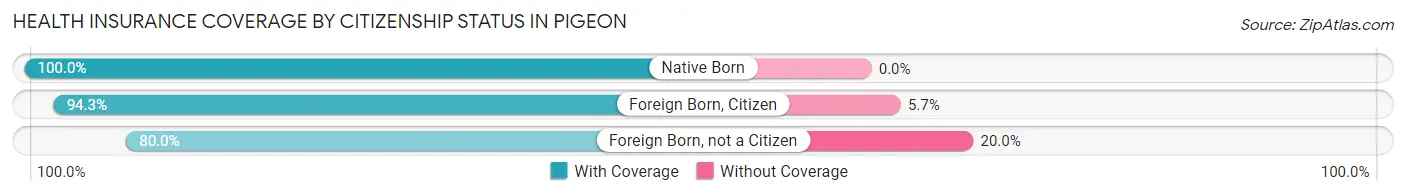
| Citizenship Status | With Coverage | Without Coverage |
| Native Born | 121 (100.0%) | 0 (0.0%) |
| Foreign Born, Citizen | 148 (94.3%) | 9 (5.7%) |
| Foreign Born, not a Citizen | 28 (80.0%) | 7 (20.0%) |
Health Insurance Coverage by Household Income in Pigeon
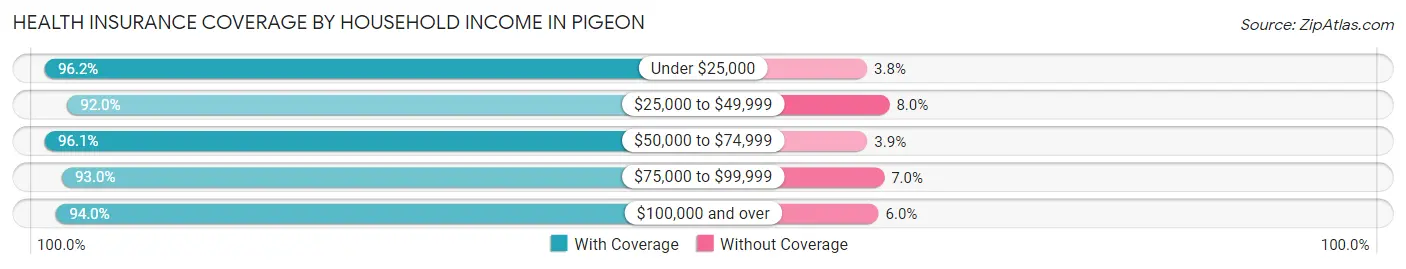
| Household Income | With Coverage | Without Coverage |
| Under $25,000 | 126 (96.2%) | 5 (3.8%) |
| $25,000 to $49,999 | 184 (92.0%) | 16 (8.0%) |
| $50,000 to $74,999 | 249 (96.1%) | 10 (3.9%) |
| $75,000 to $99,999 | 252 (93.0%) | 19 (7.0%) |
| $100,000 and over | 205 (94.0%) | 13 (6.0%) |
Public vs Private Health Insurance Coverage by Age in Pigeon
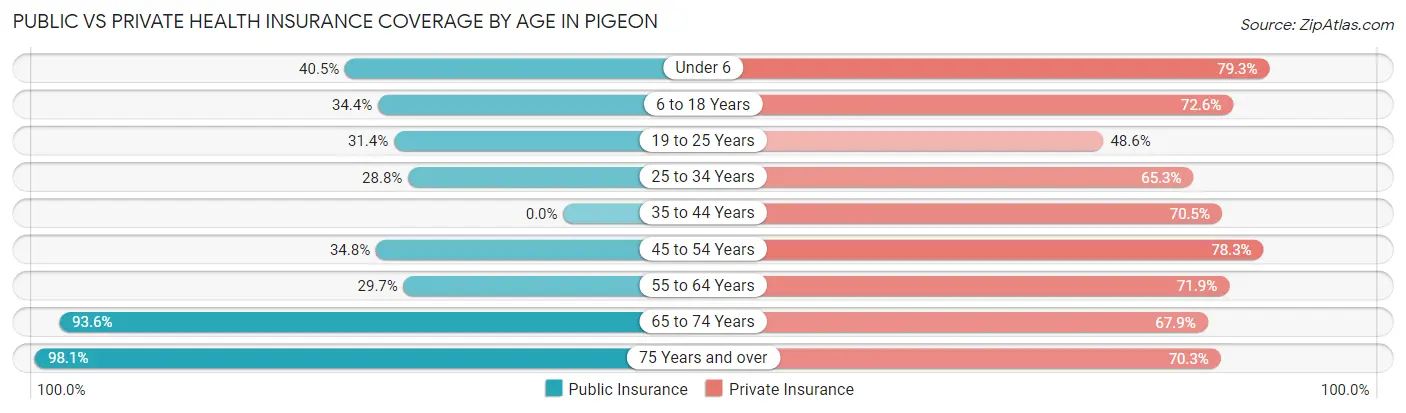
| Age Bracket | Public Insurance | Private Insurance |
| Under 6 | 49 (40.5%) | 96 (79.3%) |
| 6 to 18 Years | 54 (34.4%) | 114 (72.6%) |
| 19 to 25 Years | 11 (31.4%) | 17 (48.6%) |
| 25 to 34 Years | 34 (28.8%) | 77 (65.2%) |
| 35 to 44 Years | 0 (0.0%) | 67 (70.5%) |
| 45 to 54 Years | 32 (34.8%) | 72 (78.3%) |
| 55 to 64 Years | 59 (29.6%) | 143 (71.9%) |
| 65 to 74 Years | 102 (93.6%) | 74 (67.9%) |
| 75 Years and over | 152 (98.1%) | 109 (70.3%) |
| Total | 493 (45.6%) | 769 (71.1%) |
Disability Status by Sex by Age in Pigeon
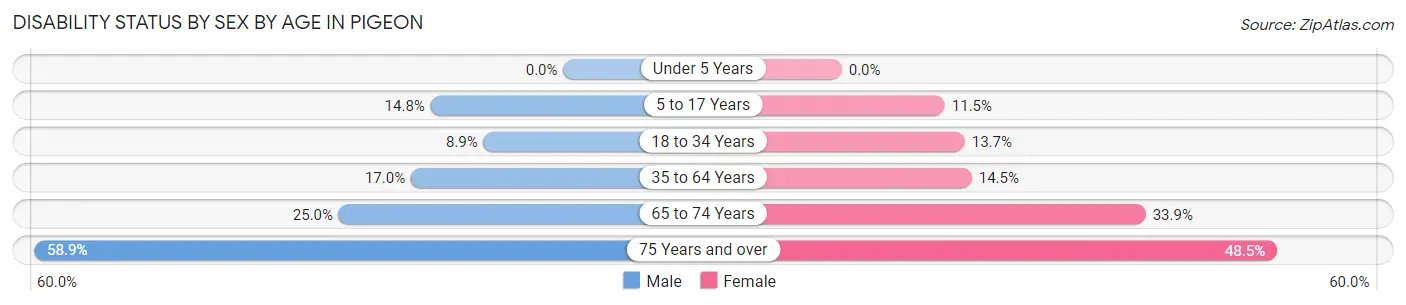
| Age Bracket | Male | Female |
| Under 5 Years | 0 (0.0%) | 0 (0.0%) |
| 5 to 17 Years | 17 (14.8%) | 7 (11.5%) |
| 18 to 34 Years | 8 (8.9%) | 10 (13.7%) |
| 35 to 64 Years | 28 (17.0%) | 32 (14.5%) |
| 65 to 74 Years | 11 (25.0%) | 22 (33.9%) |
| 75 Years and over | 33 (58.9%) | 48 (48.5%) |
Disability Class by Sex by Age in Pigeon
Disability Class: Hearing Difficulty
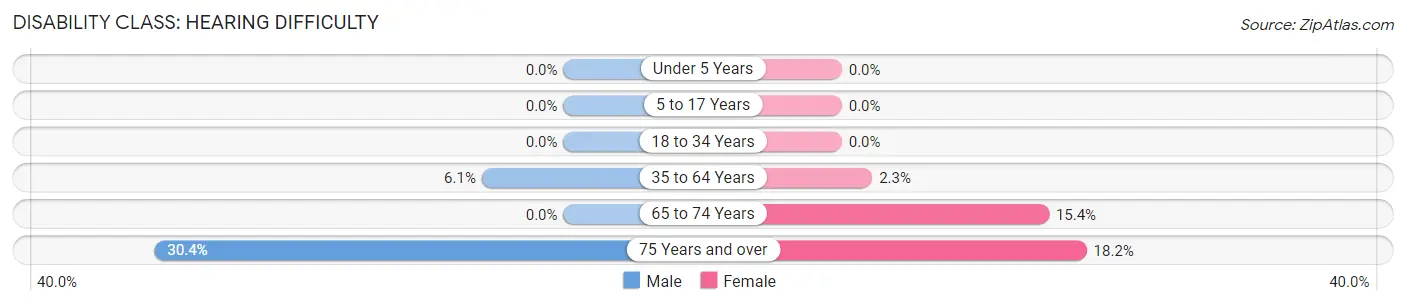
| Age Bracket | Male | Female |
| Under 5 Years | 0 (0.0%) | 0 (0.0%) |
| 5 to 17 Years | 0 (0.0%) | 0 (0.0%) |
| 18 to 34 Years | 0 (0.0%) | 0 (0.0%) |
| 35 to 64 Years | 10 (6.1%) | 5 (2.3%) |
| 65 to 74 Years | 0 (0.0%) | 10 (15.4%) |
| 75 Years and over | 17 (30.4%) | 18 (18.2%) |
Disability Class: Vision Difficulty
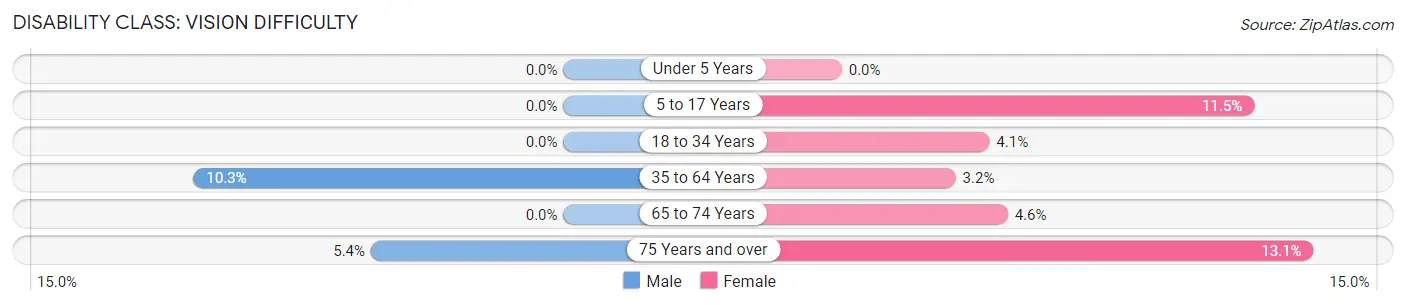
| Age Bracket | Male | Female |
| Under 5 Years | 0 (0.0%) | 0 (0.0%) |
| 5 to 17 Years | 0 (0.0%) | 7 (11.5%) |
| 18 to 34 Years | 0 (0.0%) | 3 (4.1%) |
| 35 to 64 Years | 17 (10.3%) | 7 (3.2%) |
| 65 to 74 Years | 0 (0.0%) | 3 (4.6%) |
| 75 Years and over | 3 (5.4%) | 13 (13.1%) |
Disability Class: Cognitive Difficulty
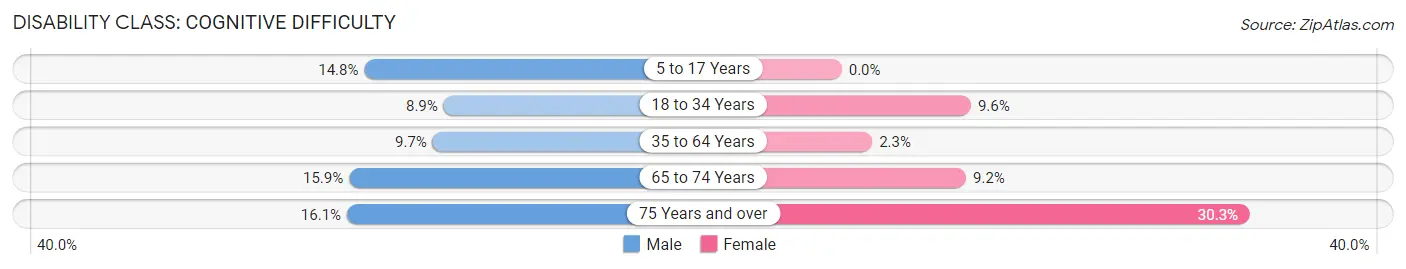
| Age Bracket | Male | Female |
| 5 to 17 Years | 17 (14.8%) | 0 (0.0%) |
| 18 to 34 Years | 8 (8.9%) | 7 (9.6%) |
| 35 to 64 Years | 16 (9.7%) | 5 (2.3%) |
| 65 to 74 Years | 7 (15.9%) | 6 (9.2%) |
| 75 Years and over | 9 (16.1%) | 30 (30.3%) |
Disability Class: Ambulatory Difficulty
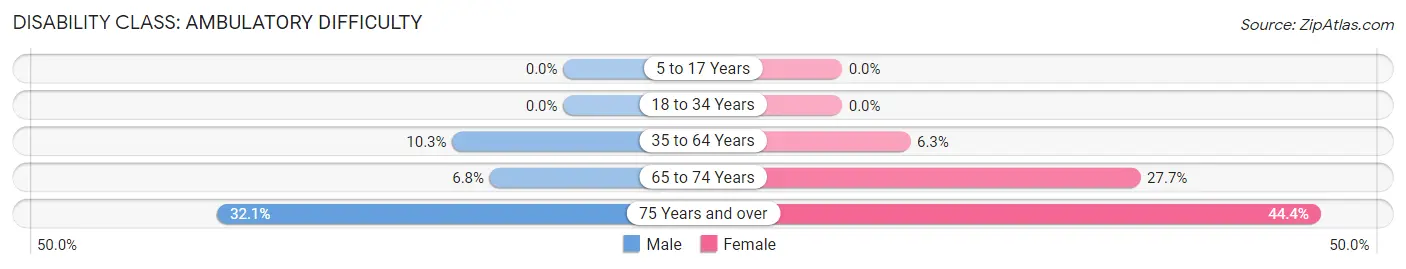
| Age Bracket | Male | Female |
| 5 to 17 Years | 0 (0.0%) | 0 (0.0%) |
| 18 to 34 Years | 0 (0.0%) | 0 (0.0%) |
| 35 to 64 Years | 17 (10.3%) | 14 (6.3%) |
| 65 to 74 Years | 3 (6.8%) | 18 (27.7%) |
| 75 Years and over | 18 (32.1%) | 44 (44.4%) |
Disability Class: Self-Care Difficulty
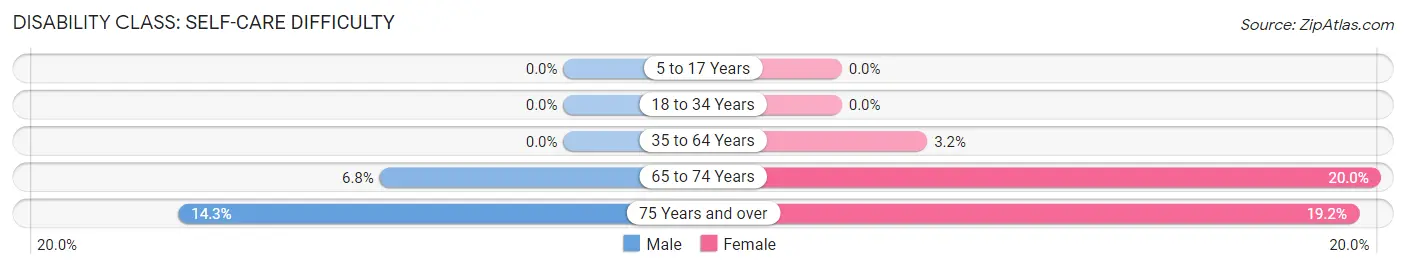
| Age Bracket | Male | Female |
| 5 to 17 Years | 0 (0.0%) | 0 (0.0%) |
| 18 to 34 Years | 0 (0.0%) | 0 (0.0%) |
| 35 to 64 Years | 0 (0.0%) | 7 (3.2%) |
| 65 to 74 Years | 3 (6.8%) | 13 (20.0%) |
| 75 Years and over | 8 (14.3%) | 19 (19.2%) |
Technology Access in Pigeon
Computing Device Access in Pigeon
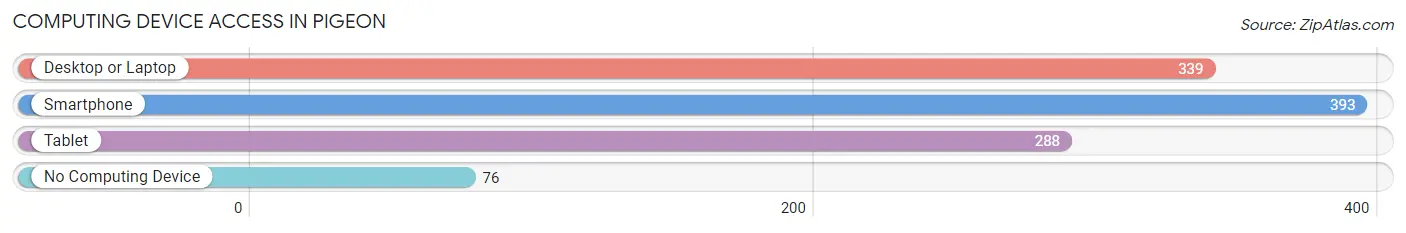
| Device Type | # Households | % Households |
| Desktop or Laptop | 339 | 64.7% |
| Smartphone | 393 | 75.0% |
| Tablet | 288 | 55.0% |
| No Computing Device | 76 | 14.5% |
| Total | 524 | 100.0% |
Internet Access in Pigeon
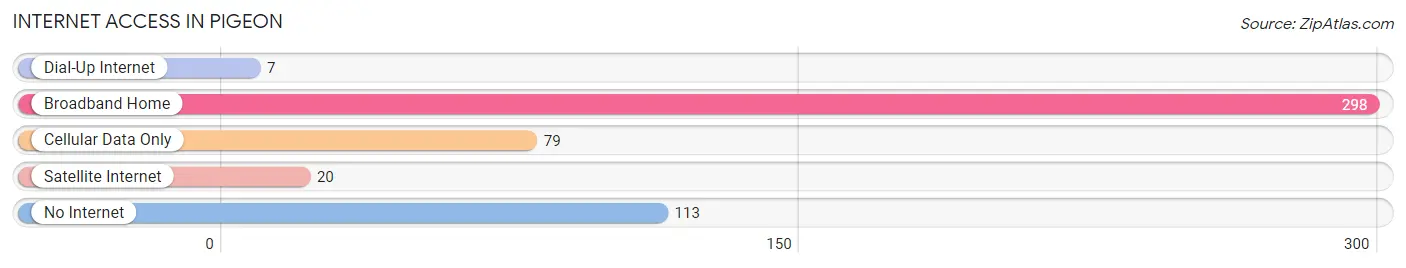
| Internet Type | # Households | % Households |
| Dial-Up Internet | 7 | 1.3% |
| Broadband Home | 298 | 56.9% |
| Cellular Data Only | 79 | 15.1% |
| Satellite Internet | 20 | 3.8% |
| No Internet | 113 | 21.6% |
| Total | 524 | 100.0% |
Pigeon Summary
Pigeon, Michigan is a small village located in Huron County in the state of Michigan. It is situated on the banks of the Pigeon River, which is a tributary of Lake Huron. The village has a population of approximately 1,000 people and is located about 25 miles south of the city of Bad Axe.
History
The area that is now Pigeon was first settled in the early 1800s by a group of French-Canadian fur traders. The village was originally known as “Pigeon’s Landing” and was a popular stop for travelers and traders. In 1837, the village was officially incorporated as the Village of Pigeon.
The village grew slowly over the years, but it was not until the late 1800s that it began to experience significant growth. This was due to the construction of the Pigeon River Lumber Company, which was the first major industry in the area. The lumber company provided employment for many of the local residents and helped to spur the growth of the village.
In the early 1900s, the village experienced a period of rapid growth. This was due to the construction of the Pigeon River Railroad, which connected the village to the larger cities of Bad Axe and Port Austin. The railroad also helped to bring in new businesses and industries to the area, which further increased the population of the village.
Geography
Pigeon is located in the southeastern corner of Huron County in the state of Michigan. It is situated on the banks of the Pigeon River, which is a tributary of Lake Huron. The village is surrounded by rolling hills and farmland, and is located about 25 miles south of the city of Bad Axe.
The climate in Pigeon is typical of the Great Lakes region, with cold winters and warm summers. The average temperature in the winter is around 20 degrees Fahrenheit, while the average temperature in the summer is around 70 degrees Fahrenheit. The village receives an average of 35 inches of precipitation each year.
Economy
The economy of Pigeon is largely based on agriculture and tourism. The village is home to several farms, which produce a variety of crops such as corn, soybeans, and wheat. The village also has several small businesses, including a grocery store, a hardware store, and a few restaurants.
Tourism is also an important part of the local economy. The village is home to several attractions, including the Pigeon River Lumber Company Museum, the Pigeon River Railroad Museum, and the Pigeon River Nature Center. These attractions draw visitors from all over the state and beyond.
Demographics
As of the 2010 census, the population of Pigeon was 1,000 people. The racial makeup of the village was 97.2% White, 0.7% African American, 0.2% Native American, 0.2% Asian, 0.2% from other races, and 1.7% from two or more races. The median household income in the village was $37,500.
Pigeon is a small, rural village with a close-knit community. The village is home to several churches, a library, and a post office. The village also has a volunteer fire department and a volunteer ambulance service. The village is served by the Huron County School District, which provides education for the local children.
Common Questions
What is Per Capita Income in Pigeon?
Per Capita income in Pigeon is $29,453.
What is the Median Family Income in Pigeon?
Median Family Income in Pigeon is $77,361.
What is the Median Household income in Pigeon?
Median Household Income in Pigeon is $53,750.
What is Income or Wage Gap in Pigeon?
Income or Wage Gap in Pigeon is 33.1%.
Women in Pigeon earn 66.9 cents for every dollar earned by a man.
What is Inequality or Gini Index in Pigeon?
Inequality or Gini Index in Pigeon is 0.39.
What is the Total Population of Pigeon?
Total Population of Pigeon is 1,100.
What is the Total Male Population of Pigeon?
Total Male Population of Pigeon is 544.
What is the Total Female Population of Pigeon?
Total Female Population of Pigeon is 556.
What is the Ratio of Males per 100 Females in Pigeon?
There are 97.84 Males per 100 Females in Pigeon.
What is the Ratio of Females per 100 Males in Pigeon?
There are 102.21 Females per 100 Males in Pigeon.
What is the Median Population Age in Pigeon?
Median Population Age in Pigeon is 48.6 Years.
What is the Average Family Size in Pigeon
Average Family Size in Pigeon is 3.0 People.
What is the Average Household Size in Pigeon
Average Household Size in Pigeon is 2.1 People.
How Large is the Labor Force in Pigeon?
There are 448 People in the Labor Forcein in Pigeon.
What is the Percentage of People in the Labor Force in Pigeon?
53.3% of People are in the Labor Force in Pigeon.
What is the Unemployment Rate in Pigeon?
Unemployment Rate in Pigeon is 1.3%.