Belleville, MI Map & Demographics
Belleville Map
Belleville Overview
$35,437
PER CAPITA INCOME
$79,722
AVG FAMILY INCOME
$55,979
AVG HOUSEHOLD INCOME
39.6%
WAGE / INCOME GAP [ % ]
60.4¢/ $1
WAGE / INCOME GAP [ $ ]
0.46
INEQUALITY / GINI INDEX
3,979
TOTAL POPULATION
1,767
MALE POPULATION
2,212
FEMALE POPULATION
79.88
MALES / 100 FEMALES
125.18
FEMALES / 100 MALES
40.2
MEDIAN AGE
3.2
AVG FAMILY SIZE
2.1
AVG HOUSEHOLD SIZE
1,965
LABOR FORCE [ PEOPLE ]
57.7%
PERCENT IN LABOR FORCE
8.5%
UNEMPLOYMENT RATE
Belleville Zip Codes
Belleville Area Codes
Income in Belleville
Income Overview in Belleville
Per Capita Income in Belleville is $35,437, while median incomes of families and households are $79,722 and $55,979 respectively.
| Characteristic | Number | Measure |
| Per Capita Income | 3,979 | $35,437 |
| Median Family Income | 902 | $79,722 |
| Mean Family Income | 902 | $109,279 |
| Median Household Income | 1,847 | $55,979 |
| Mean Household Income | 1,847 | $75,185 |
| Income Deficit | 902 | $0 |
| Wage / Income Gap (%) | 3,979 | 39.63% |
| Wage / Income Gap ($) | 3,979 | 60.37¢ per $1 |
| Gini / Inequality Index | 3,979 | 0.46 |
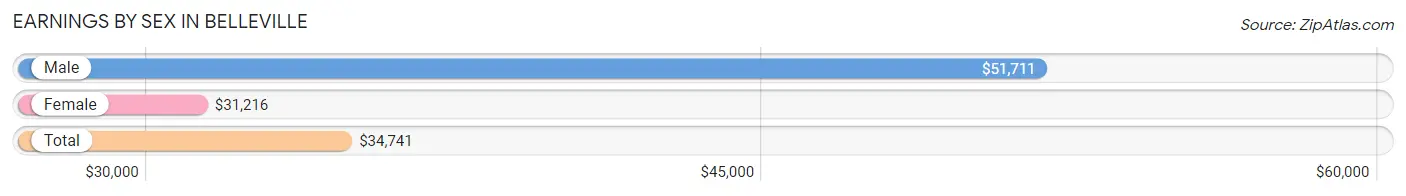
Earnings by Sex in Belleville
Average Earnings in Belleville are $34,741, $51,711 for men and $31,216 for women, a difference of 39.6%.
| Sex | Number | Average Earnings |
| Male | 866 (42.2%) | $51,711 |
| Female | 1,184 (57.8%) | $31,216 |
| Total | 2,050 (100.0%) | $34,741 |
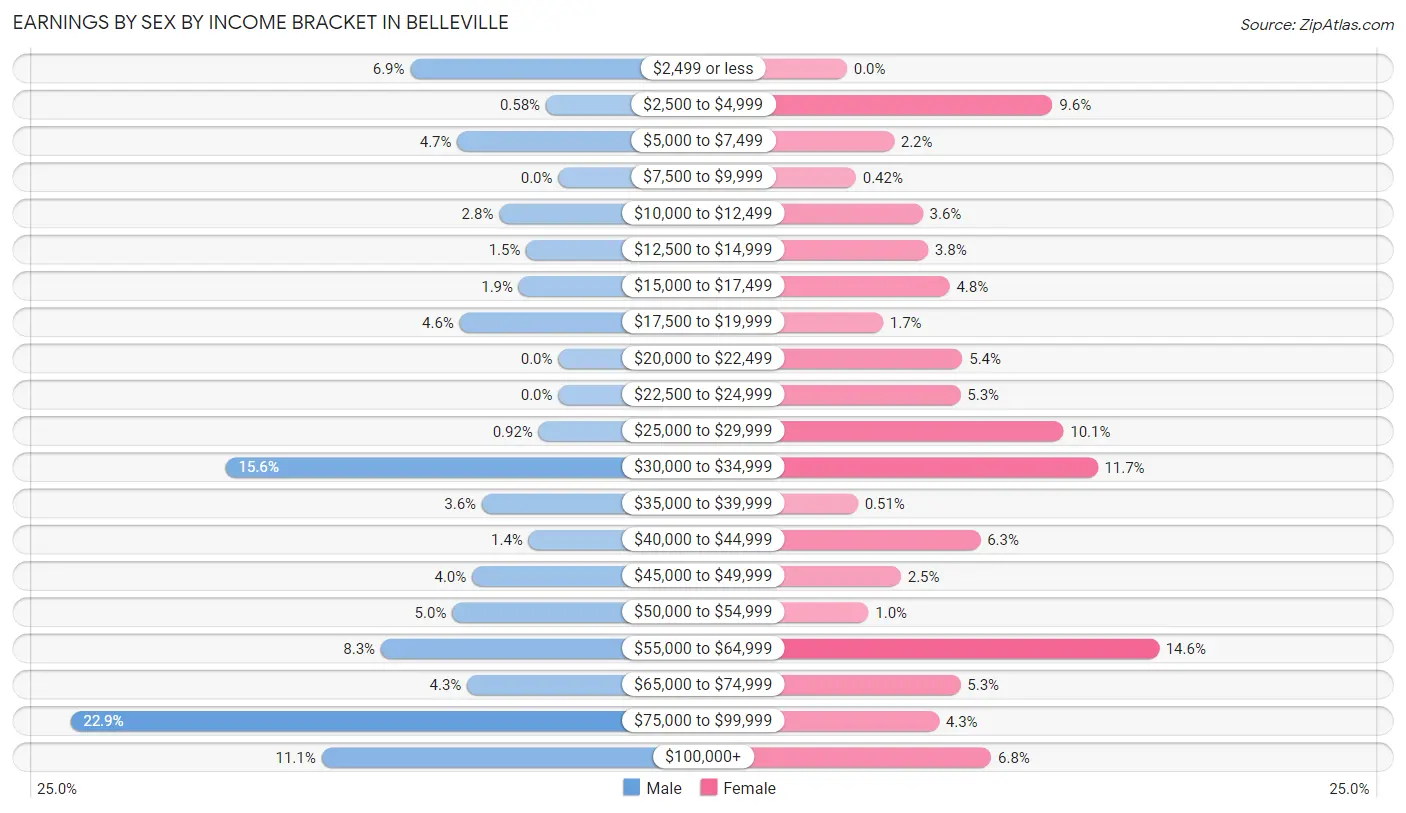
Earnings by Sex by Income Bracket in Belleville
The most common earnings brackets in Belleville are $75,000 to $99,999 for men (198 | 22.9%) and $55,000 to $64,999 for women (173 | 14.6%).
| Income | Male | Female |
| $2,499 or less | 60 (6.9%) | 0 (0.0%) |
| $2,500 to $4,999 | 5 (0.6%) | 114 (9.6%) |
| $5,000 to $7,499 | 41 (4.7%) | 26 (2.2%) |
| $7,500 to $9,999 | 0 (0.0%) | 5 (0.4%) |
| $10,000 to $12,499 | 24 (2.8%) | 42 (3.5%) |
| $12,500 to $14,999 | 13 (1.5%) | 45 (3.8%) |
| $15,000 to $17,499 | 16 (1.8%) | 57 (4.8%) |
| $17,500 to $19,999 | 40 (4.6%) | 20 (1.7%) |
| $20,000 to $22,499 | 0 (0.0%) | 64 (5.4%) |
| $22,500 to $24,999 | 0 (0.0%) | 63 (5.3%) |
| $25,000 to $29,999 | 8 (0.9%) | 120 (10.1%) |
| $30,000 to $34,999 | 135 (15.6%) | 139 (11.7%) |
| $35,000 to $39,999 | 31 (3.6%) | 6 (0.5%) |
| $40,000 to $44,999 | 12 (1.4%) | 74 (6.2%) |
| $45,000 to $49,999 | 35 (4.0%) | 30 (2.5%) |
| $50,000 to $54,999 | 43 (5.0%) | 12 (1.0%) |
| $55,000 to $64,999 | 72 (8.3%) | 173 (14.6%) |
| $65,000 to $74,999 | 37 (4.3%) | 63 (5.3%) |
| $75,000 to $99,999 | 198 (22.9%) | 51 (4.3%) |
| $100,000+ | 96 (11.1%) | 80 (6.8%) |
| Total | 866 (100.0%) | 1,184 (100.0%) |
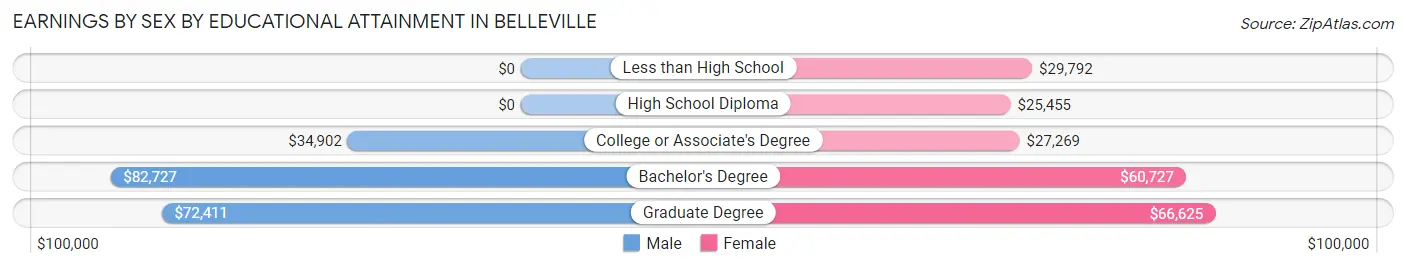
Earnings by Sex by Educational Attainment in Belleville
Average earnings in Belleville are $54,271 for men and $34,923 for women, a difference of 35.6%. Men with an educational attainment of bachelor's degree enjoy the highest average annual earnings of $82,727, while those with college or associate's degree education earn the least with $34,902. Women with an educational attainment of graduate degree earn the most with the average annual earnings of $66,625, while those with high school diploma education have the smallest earnings of $25,455.
| Educational Attainment | Male Income | Female Income |
| Less than High School | - | - |
| High School Diploma | - | - |
| College or Associate's Degree | $34,902 | $27,269 |
| Bachelor's Degree | $82,727 | $60,727 |
| Graduate Degree | $72,411 | $66,625 |
| Total | $54,271 | $34,923 |
Family Income in Belleville
Family Income Brackets in Belleville
According to the Belleville family income data, there are 178 families falling into the $50,000 to $74,999 income range, which is the most common income bracket and makes up 19.7% of all families.
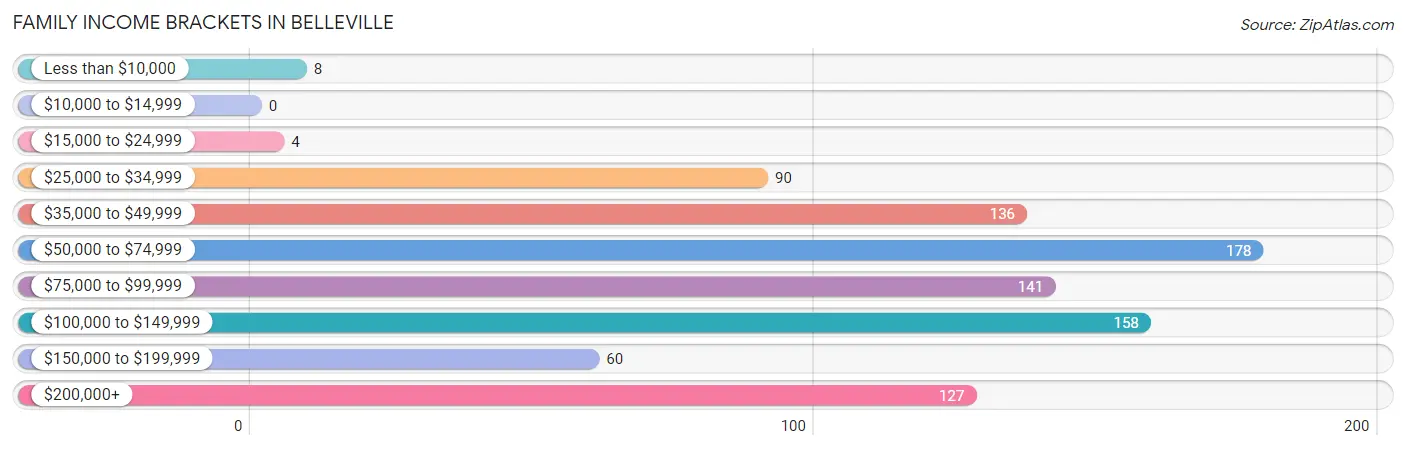
| Income Bracket | # Families | % Families |
| Less than $10,000 | 8 | 0.9% |
| $10,000 to $14,999 | 0 | 0.0% |
| $15,000 to $24,999 | 4 | 0.4% |
| $25,000 to $34,999 | 90 | 10.0% |
| $35,000 to $49,999 | 136 | 15.1% |
| $50,000 to $74,999 | 178 | 19.7% |
| $75,000 to $99,999 | 141 | 15.6% |
| $100,000 to $149,999 | 158 | 17.5% |
| $150,000 to $199,999 | 60 | 6.7% |
| $200,000+ | 127 | 14.1% |
Family Income by Famaliy Size in Belleville
5-person families (104 | 11.5%) account for the highest median family income in Belleville with $120,437 per family, while 3-person families (273 | 30.3%) have the highest median income of $30,729 per family member.
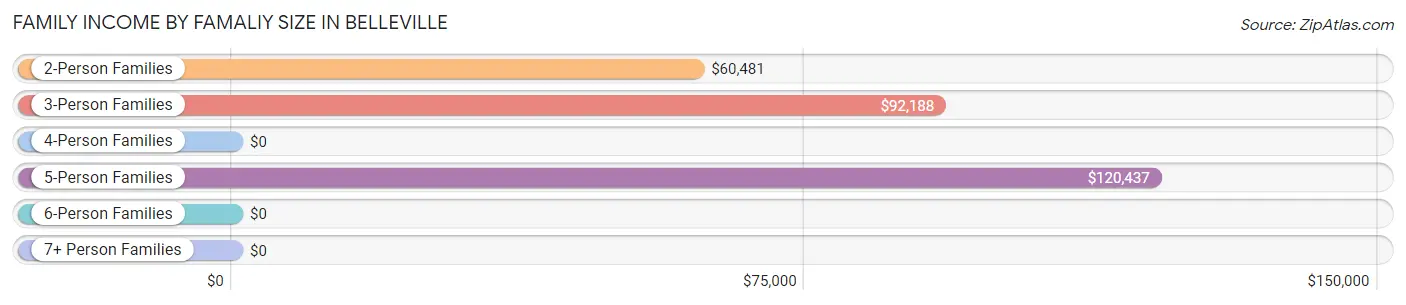
| Income Bracket | # Families | Median Income |
| 2-Person Families | 325 (36.0%) | $60,481 |
| 3-Person Families | 273 (30.3%) | $92,188 |
| 4-Person Families | 184 (20.4%) | $0 |
| 5-Person Families | 104 (11.5%) | $120,437 |
| 6-Person Families | 16 (1.8%) | $0 |
| 7+ Person Families | 0 (0.0%) | $0 |
| Total | 902 (100.0%) | $79,722 |
Family Income by Number of Earners in Belleville
The median family income in Belleville is $79,722, with families comprising 3+ earners (59) having the highest median family income of $250,001, while families with no earners (122) have the lowest median family income of $48,571, accounting for 6.5% and 13.5% of families, respectively.
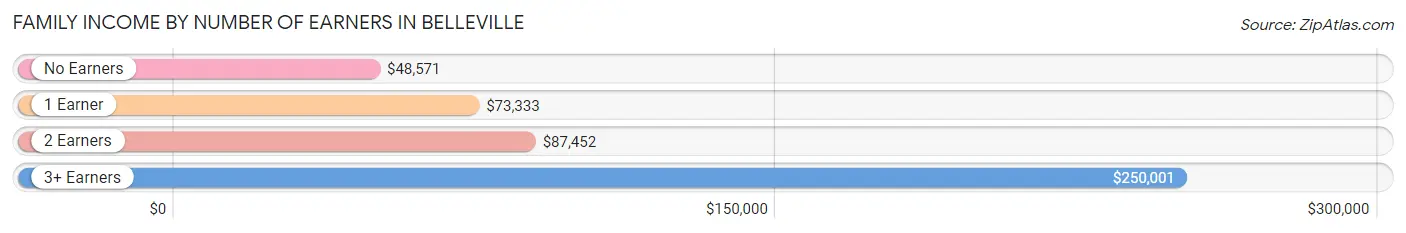
| Number of Earners | # Families | Median Income |
| No Earners | 122 (13.5%) | $48,571 |
| 1 Earner | 262 (29.0%) | $73,333 |
| 2 Earners | 459 (50.9%) | $87,452 |
| 3+ Earners | 59 (6.5%) | $250,001 |
| Total | 902 (100.0%) | $79,722 |
Household Income in Belleville
Household Income Brackets in Belleville
With 416 households falling in the category, the $50,000 to $74,999 income range is the most frequent in Belleville, accounting for 22.5% of all households. In contrast, only 13 households (0.7%) fall into the $10,000 to $14,999 income bracket, making it the least populous group.
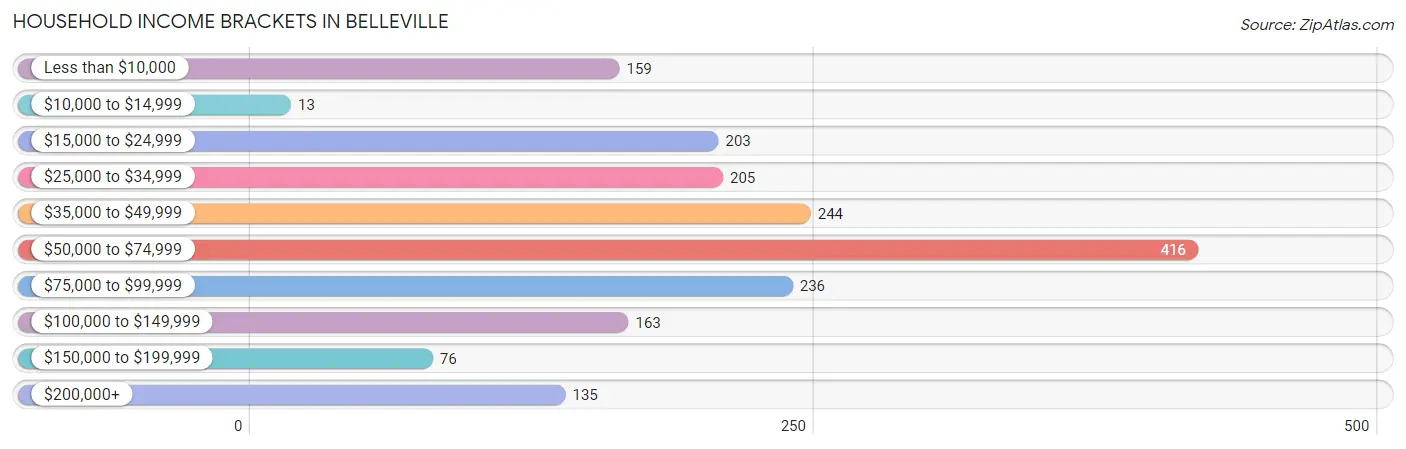
| Income Bracket | # Households | % Households |
| Less than $10,000 | 159 | 8.6% |
| $10,000 to $14,999 | 13 | 0.7% |
| $15,000 to $24,999 | 203 | 11.0% |
| $25,000 to $34,999 | 205 | 11.1% |
| $35,000 to $49,999 | 244 | 13.2% |
| $50,000 to $74,999 | 416 | 22.5% |
| $75,000 to $99,999 | 236 | 12.8% |
| $100,000 to $149,999 | 163 | 8.8% |
| $150,000 to $199,999 | 76 | 4.1% |
| $200,000+ | 135 | 7.3% |
Household Income by Householder Age in Belleville
The median household income in Belleville is $55,979, with the highest median household income of $71,118 found in the 45 to 64 years age bracket for the primary householder. A total of 577 households (31.2%) fall into this category. Meanwhile, the 15 to 24 years age bracket for the primary householder has the lowest median household income of $0, with 9 households (0.5%) in this group.
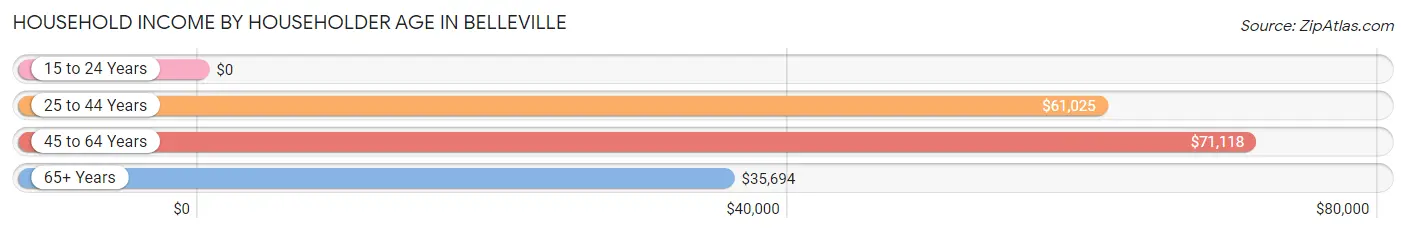
| Income Bracket | # Households | Median Income |
| 15 to 24 Years | 9 (0.5%) | $0 |
| 25 to 44 Years | 688 (37.2%) | $61,025 |
| 45 to 64 Years | 577 (31.2%) | $71,118 |
| 65+ Years | 573 (31.0%) | $35,694 |
| Total | 1,847 (100.0%) | $55,979 |
Poverty in Belleville
Income Below Poverty by Sex and Age in Belleville
With 5.8% poverty level for males and 7.2% for females among the residents of Belleville, 55 to 64 year old males and 75 year old and over females are the most vulnerable to poverty, with 44 males (21.1%) and 48 females (33.6%) in their respective age groups living below the poverty level.
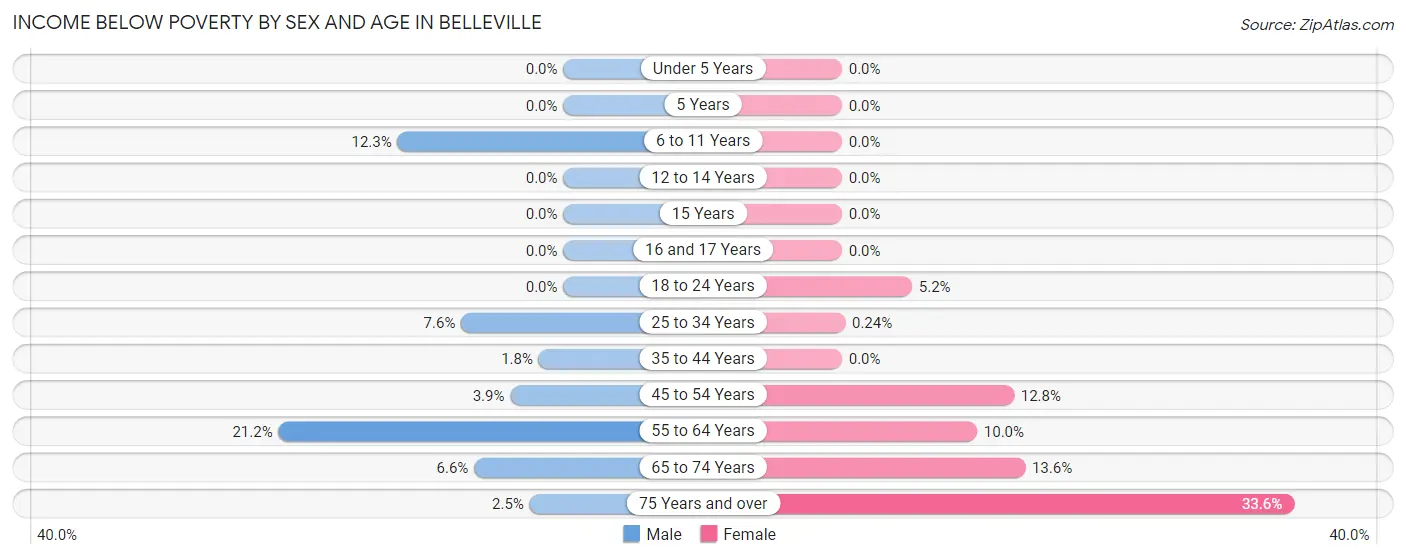
| Age Bracket | Male | Female |
| Under 5 Years | 0 (0.0%) | 0 (0.0%) |
| 5 Years | 0 (0.0%) | 0 (0.0%) |
| 6 to 11 Years | 8 (12.3%) | 0 (0.0%) |
| 12 to 14 Years | 0 (0.0%) | 0 (0.0%) |
| 15 Years | 0 (0.0%) | 0 (0.0%) |
| 16 and 17 Years | 0 (0.0%) | 0 (0.0%) |
| 18 to 24 Years | 0 (0.0%) | 9 (5.2%) |
| 25 to 34 Years | 20 (7.6%) | 1 (0.2%) |
| 35 to 44 Years | 5 (1.8%) | 0 (0.0%) |
| 45 to 54 Years | 5 (3.9%) | 36 (12.8%) |
| 55 to 64 Years | 44 (21.1%) | 31 (10.0%) |
| 65 to 74 Years | 19 (6.6%) | 34 (13.6%) |
| 75 Years and over | 2 (2.5%) | 48 (33.6%) |
| Total | 103 (5.8%) | 159 (7.2%) |
Income Above Poverty by Sex and Age in Belleville
According to the poverty statistics in Belleville, males aged under 5 years and females aged under 5 years are the age groups that are most secure financially, with 100.0% of males and 100.0% of females in these age groups living above the poverty line.
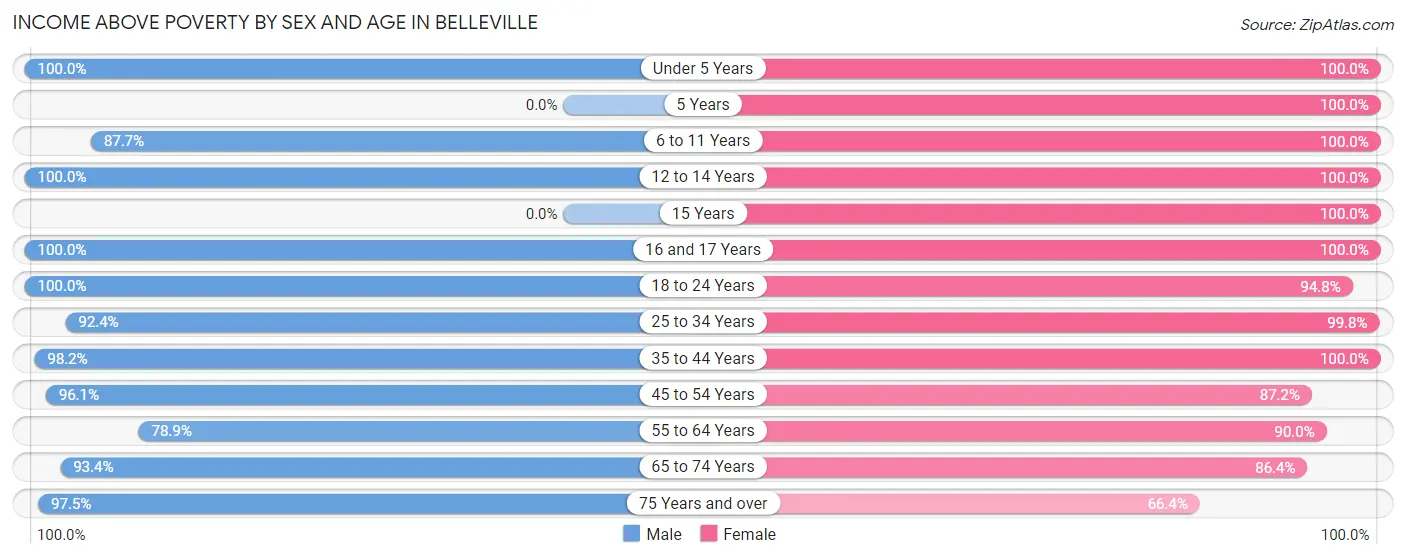
| Age Bracket | Male | Female |
| Under 5 Years | 202 (100.0%) | 149 (100.0%) |
| 5 Years | 0 (0.0%) | 40 (100.0%) |
| 6 to 11 Years | 57 (87.7%) | 49 (100.0%) |
| 12 to 14 Years | 22 (100.0%) | 44 (100.0%) |
| 15 Years | 0 (0.0%) | 2 (100.0%) |
| 16 and 17 Years | 189 (100.0%) | 44 (100.0%) |
| 18 to 24 Years | 49 (100.0%) | 164 (94.8%) |
| 25 to 34 Years | 244 (92.4%) | 423 (99.8%) |
| 35 to 44 Years | 269 (98.2%) | 303 (100.0%) |
| 45 to 54 Years | 122 (96.1%) | 246 (87.2%) |
| 55 to 64 Years | 164 (78.8%) | 278 (90.0%) |
| 65 to 74 Years | 268 (93.4%) | 216 (86.4%) |
| 75 Years and over | 78 (97.5%) | 95 (66.4%) |
| Total | 1,664 (94.2%) | 2,053 (92.8%) |
Income Below Poverty Among Married-Couple Families in Belleville
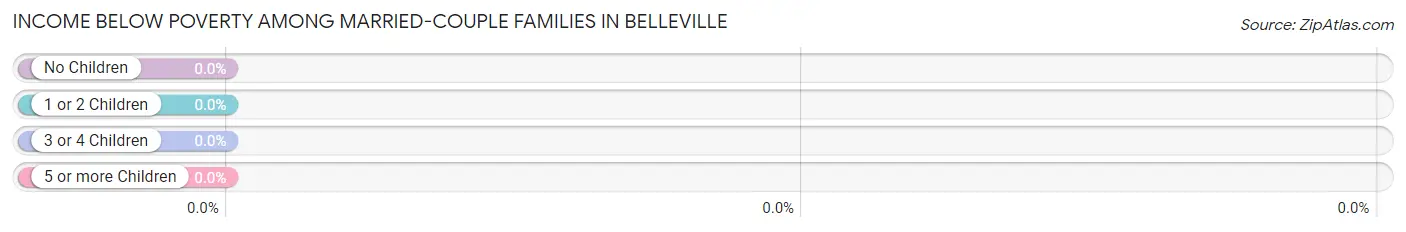
| Children | Above Poverty | Below Poverty |
| No Children | 287 (100.0%) | 0 (0.0%) |
| 1 or 2 Children | 310 (100.0%) | 0 (0.0%) |
| 3 or 4 Children | 79 (100.0%) | 0 (0.0%) |
| 5 or more Children | 0 (0.0%) | 0 (0.0%) |
| Total | 676 (100.0%) | 0 (0.0%) |
Income Below Poverty Among Single-Parent Households in Belleville
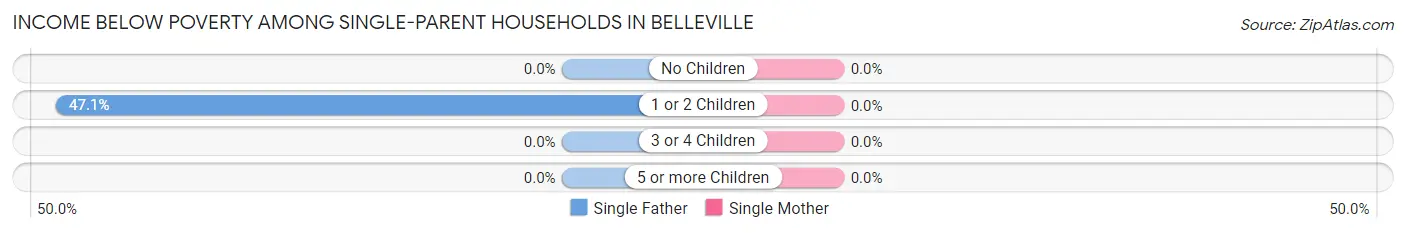
| Children | Single Father | Single Mother |
| No Children | 0 (0.0%) | 0 (0.0%) |
| 1 or 2 Children | 8 (47.1%) | 0 (0.0%) |
| 3 or 4 Children | 0 (0.0%) | 0 (0.0%) |
| 5 or more Children | 0 (0.0%) | 0 (0.0%) |
| Total | 8 (24.2%) | 0 (0.0%) |
Income Below Poverty Among Married-Couple vs Single-Parent Households in Belleville
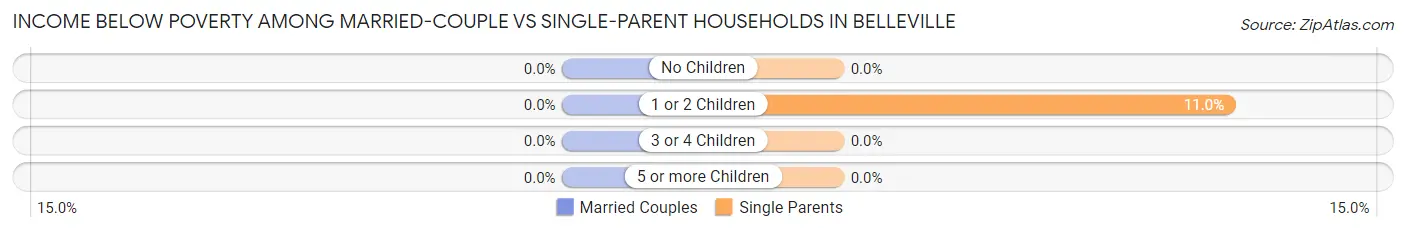
| Children | Married-Couple Families | Single-Parent Households |
| No Children | 0 (0.0%) | 0 (0.0%) |
| 1 or 2 Children | 0 (0.0%) | 8 (11.0%) |
| 3 or 4 Children | 0 (0.0%) | 0 (0.0%) |
| 5 or more Children | 0 (0.0%) | 0 (0.0%) |
| Total | 0 (0.0%) | 8 (3.5%) |
Race in Belleville
The most populous races in Belleville are White / Caucasian (2,783 | 69.9%), Black / African American (731 | 18.4%), and Two or more Races (418 | 10.5%).
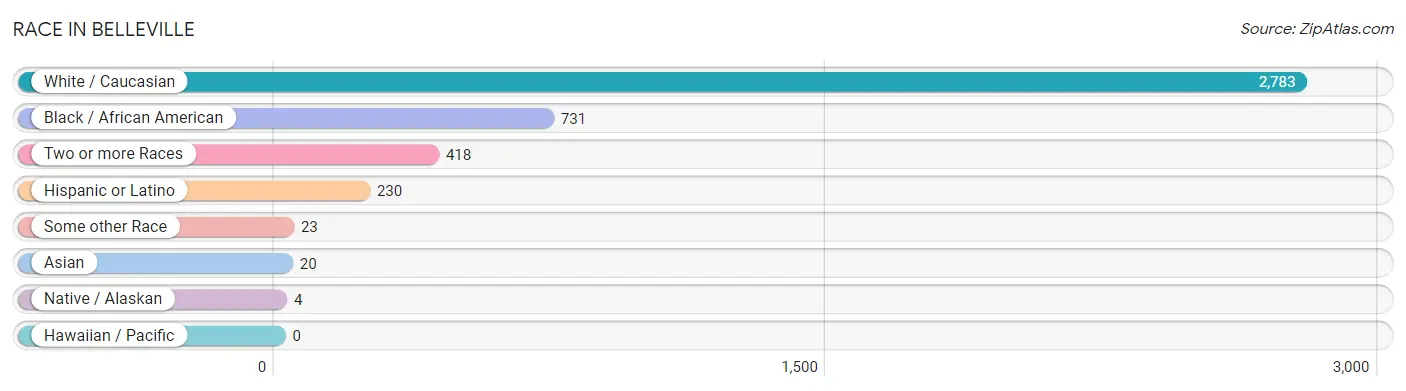
| Race | # Population | % Population |
| Asian | 20 | 0.5% |
| Black / African American | 731 | 18.4% |
| Hawaiian / Pacific | 0 | 0.0% |
| Hispanic or Latino | 230 | 5.8% |
| Native / Alaskan | 4 | 0.1% |
| White / Caucasian | 2,783 | 69.9% |
| Two or more Races | 418 | 10.5% |
| Some other Race | 23 | 0.6% |
| Total | 3,979 | 100.0% |
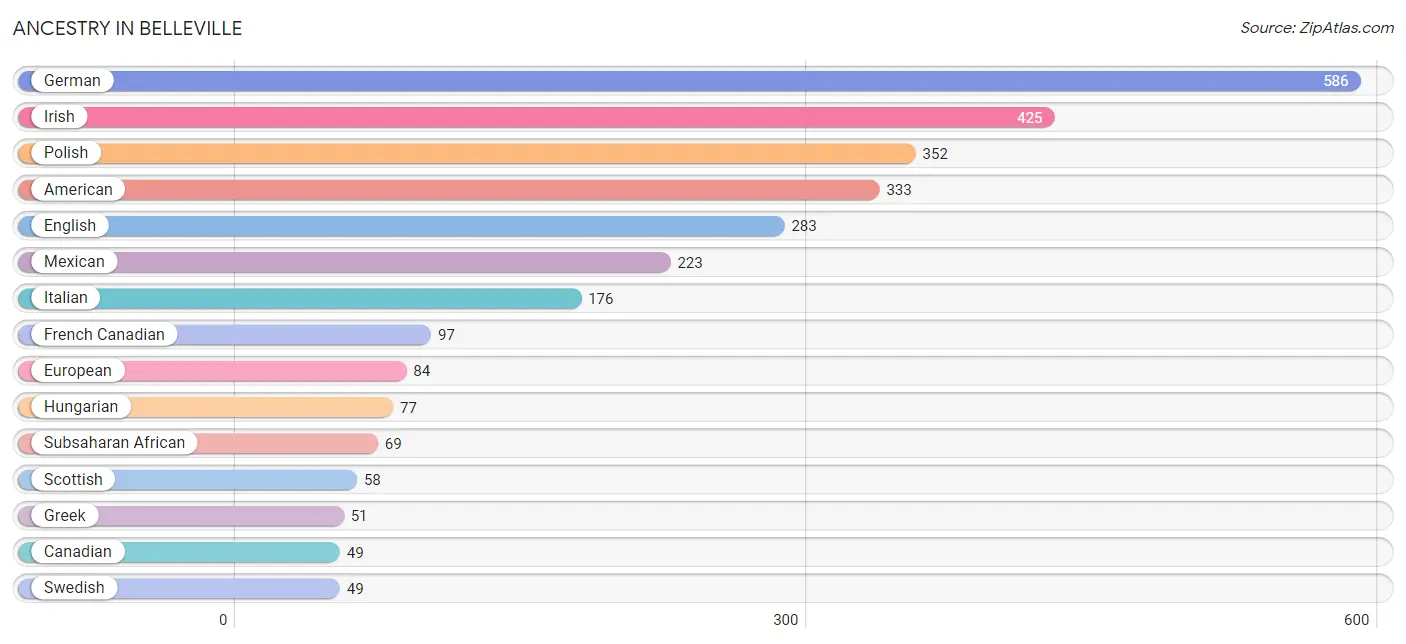
Ancestry in Belleville
The most populous ancestries reported in Belleville are German (586 | 14.7%), Irish (425 | 10.7%), Polish (352 | 8.8%), American (333 | 8.4%), and English (283 | 7.1%), together accounting for 49.7% of all Belleville residents.
| Ancestry | # Population | % Population |
| African | 17 | 0.4% |
| American | 333 | 8.4% |
| Arab | 23 | 0.6% |
| Belgian | 12 | 0.3% |
| Bhutanese | 18 | 0.4% |
| Blackfeet | 9 | 0.2% |
| Canadian | 49 | 1.2% |
| Cherokee | 7 | 0.2% |
| Choctaw | 12 | 0.3% |
| Czech | 40 | 1.0% |
| Czechoslovakian | 23 | 0.6% |
| Dutch | 28 | 0.7% |
| English | 283 | 7.1% |
| Ethiopian | 17 | 0.4% |
| European | 84 | 2.1% |
| Finnish | 4 | 0.1% |
| French | 26 | 0.6% |
| French American Indian | 11 | 0.3% |
| French Canadian | 97 | 2.4% |
| German | 586 | 14.7% |
| Greek | 51 | 1.3% |
| Haitian | 43 | 1.1% |
| Hungarian | 77 | 1.9% |
| Irish | 425 | 10.7% |
| Italian | 176 | 4.4% |
| Jordanian | 4 | 0.1% |
| Korean | 35 | 0.9% |
| Latvian | 25 | 0.6% |
| Maltese | 12 | 0.3% |
| Mexican | 223 | 5.6% |
| Nigerian | 35 | 0.9% |
| Northern European | 43 | 1.1% |
| Norwegian | 27 | 0.7% |
| Polish | 352 | 8.8% |
| Puerto Rican | 7 | 0.2% |
| Russian | 40 | 1.0% |
| Scandinavian | 14 | 0.4% |
| Scotch-Irish | 38 | 1.0% |
| Scottish | 58 | 1.5% |
| Slovak | 23 | 0.6% |
| Subsaharan African | 69 | 1.7% |
| Swedish | 49 | 1.2% |
| Syrian | 5 | 0.1% |
| Welsh | 31 | 0.8% | View All 44 Rows |
Immigrants in Belleville
The most numerous immigrant groups reported in Belleville came from Canada (34 | 0.9%), Africa (27 | 0.7%), Nigeria (27 | 0.7%), Western Africa (27 | 0.7%), and Asia (18 | 0.4%), together accounting for 3.3% of all Belleville residents.
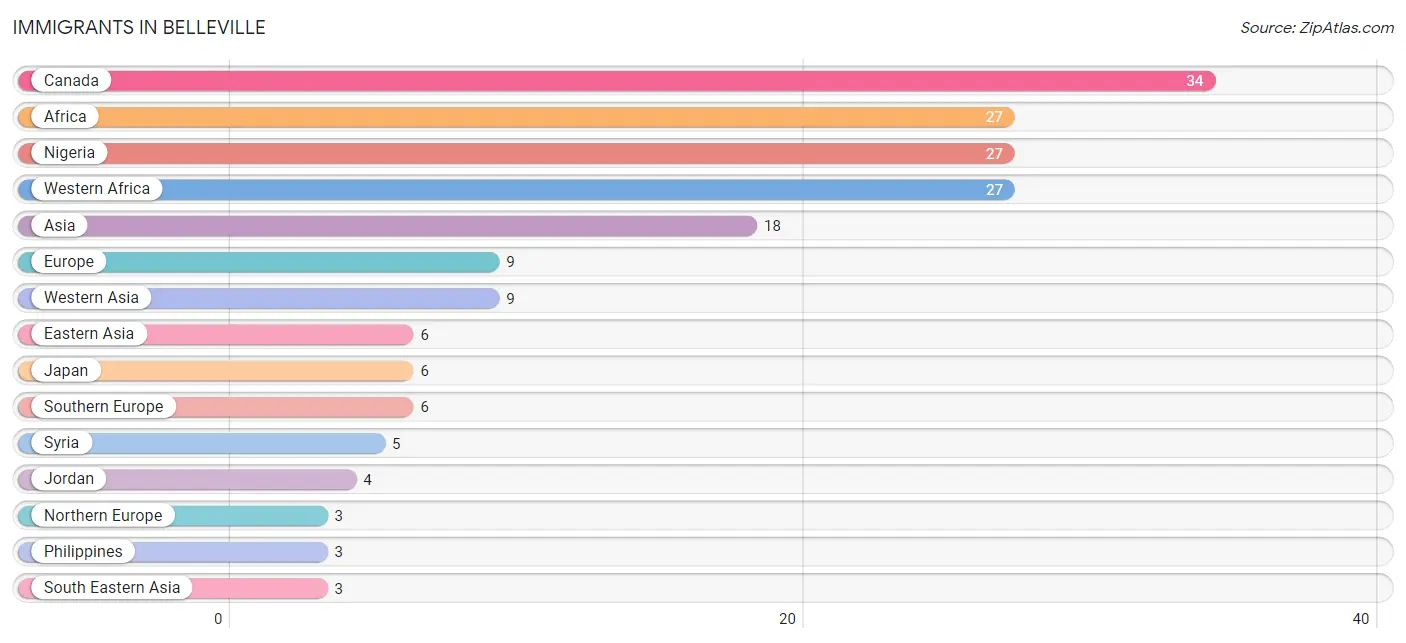
| Immigration Origin | # Population | % Population |
| Africa | 27 | 0.7% |
| Asia | 18 | 0.4% |
| Canada | 34 | 0.9% |
| Eastern Asia | 6 | 0.2% |
| England | 2 | 0.1% |
| Europe | 9 | 0.2% |
| Ireland | 1 | 0.0% |
| Japan | 6 | 0.2% |
| Jordan | 4 | 0.1% |
| Nigeria | 27 | 0.7% |
| Northern Europe | 3 | 0.1% |
| Philippines | 3 | 0.1% |
| South Eastern Asia | 3 | 0.1% |
| Southern Europe | 6 | 0.2% |
| Syria | 5 | 0.1% |
| Western Africa | 27 | 0.7% |
| Western Asia | 9 | 0.2% | View All 17 Rows |
Sex and Age in Belleville
Sex and Age in Belleville
The most populous age groups in Belleville are 40 to 44 Years (220 | 12.4%) for men and 25 to 29 Years (240 | 10.8%) for women.
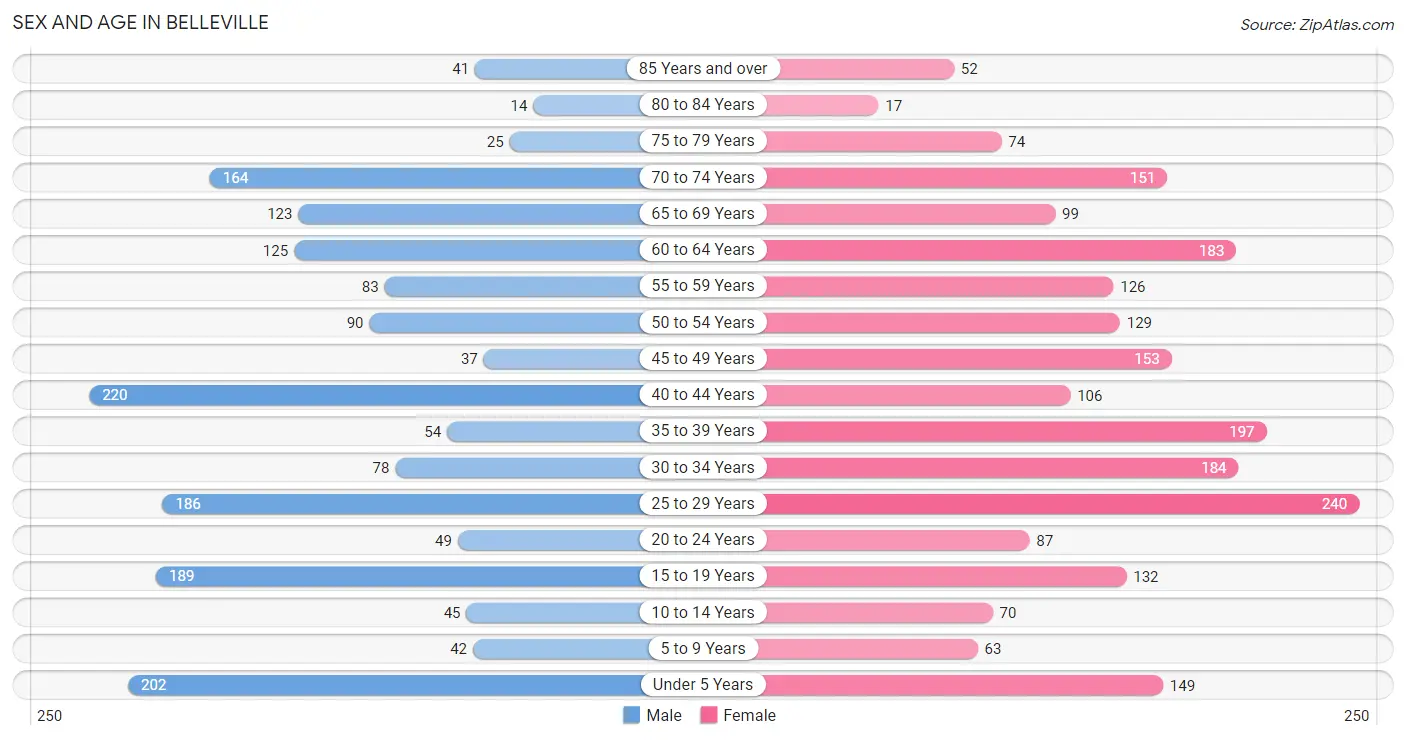
| Age Bracket | Male | Female |
| Under 5 Years | 202 (11.4%) | 149 (6.7%) |
| 5 to 9 Years | 42 (2.4%) | 63 (2.9%) |
| 10 to 14 Years | 45 (2.5%) | 70 (3.2%) |
| 15 to 19 Years | 189 (10.7%) | 132 (6.0%) |
| 20 to 24 Years | 49 (2.8%) | 87 (3.9%) |
| 25 to 29 Years | 186 (10.5%) | 240 (10.8%) |
| 30 to 34 Years | 78 (4.4%) | 184 (8.3%) |
| 35 to 39 Years | 54 (3.1%) | 197 (8.9%) |
| 40 to 44 Years | 220 (12.4%) | 106 (4.8%) |
| 45 to 49 Years | 37 (2.1%) | 153 (6.9%) |
| 50 to 54 Years | 90 (5.1%) | 129 (5.8%) |
| 55 to 59 Years | 83 (4.7%) | 126 (5.7%) |
| 60 to 64 Years | 125 (7.1%) | 183 (8.3%) |
| 65 to 69 Years | 123 (7.0%) | 99 (4.5%) |
| 70 to 74 Years | 164 (9.3%) | 151 (6.8%) |
| 75 to 79 Years | 25 (1.4%) | 74 (3.4%) |
| 80 to 84 Years | 14 (0.8%) | 17 (0.8%) |
| 85 Years and over | 41 (2.3%) | 52 (2.4%) |
| Total | 1,767 (100.0%) | 2,212 (100.0%) |
Families and Households in Belleville
Median Family Size in Belleville
The median family size in Belleville is 3.17 persons per family, with married-couple families (676 | 74.9%) accounting for the largest median family size of 3.2 persons per family. On the other hand, single male/father families (33 | 3.7%) represent the smallest median family size with 3.00 persons per family.
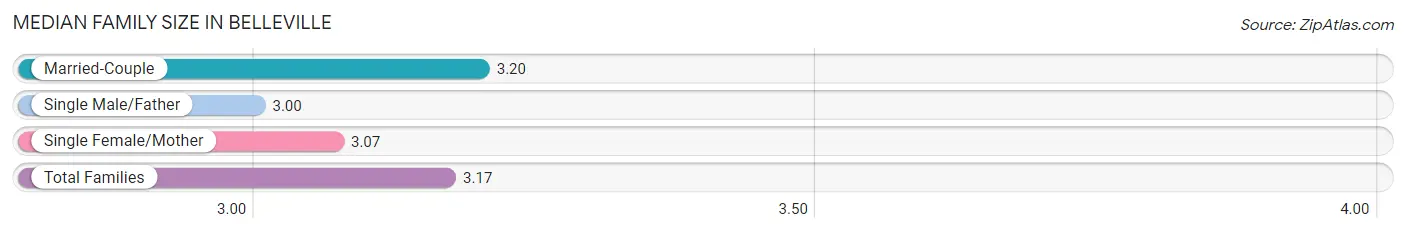
| Family Type | # Families | Family Size |
| Married-Couple | 676 (74.9%) | 3.20 |
| Single Male/Father | 33 (3.7%) | 3.00 |
| Single Female/Mother | 193 (21.4%) | 3.07 |
| Total Families | 902 (100.0%) | 3.17 |
Median Household Size in Belleville
The median household size in Belleville is 2.15 persons per household, with single female/mother households (193 | 10.4%) accounting for the largest median household size of 3.23 persons per household. non-family households (945 | 51.2%) represent the smallest median household size with 1.14 persons per household.
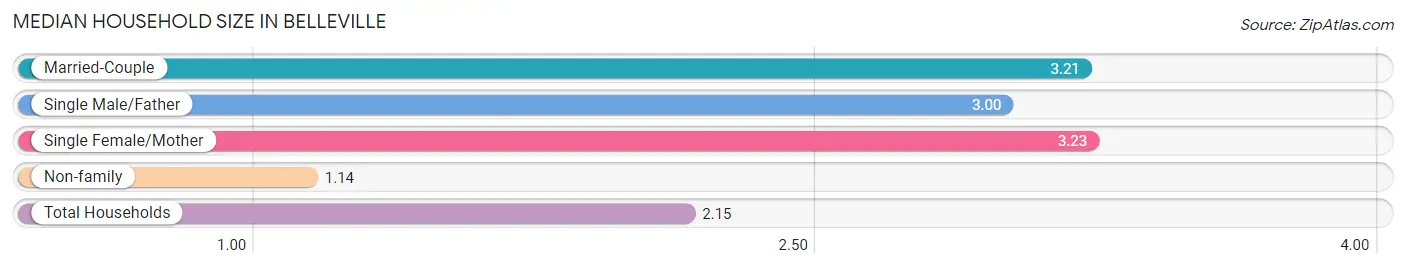
| Household Type | # Households | Household Size |
| Married-Couple | 676 (36.6%) | 3.21 |
| Single Male/Father | 33 (1.8%) | 3.00 |
| Single Female/Mother | 193 (10.4%) | 3.23 |
| Non-family | 945 (51.2%) | 1.14 |
| Total Households | 1,847 (100.0%) | 2.15 |
Household Size by Marriage Status in Belleville
Out of a total of 1,847 households in Belleville, 902 (48.8%) are family households, while 945 (51.2%) are nonfamily households. The most numerous type of family households are 2-person households, comprising 319, and the most common type of nonfamily households are 1-person households, comprising 844.
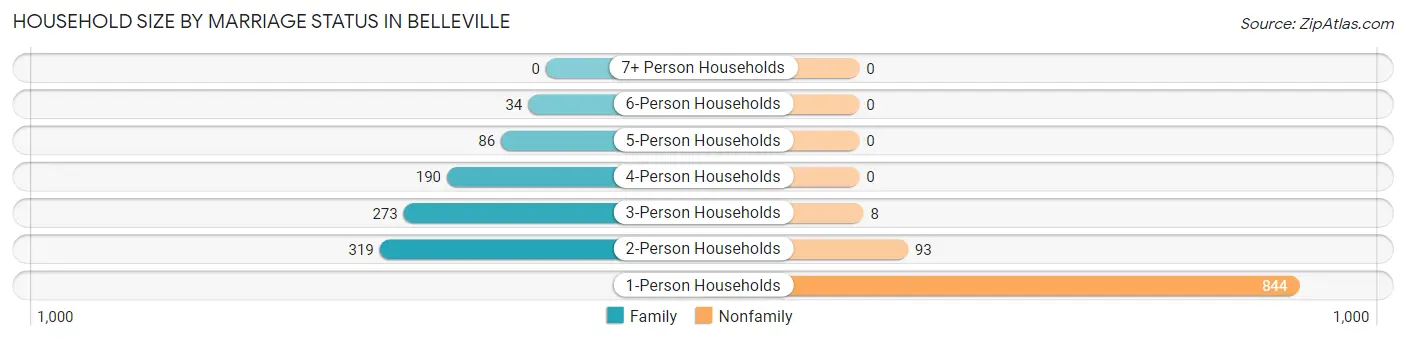
| Household Size | Family Households | Nonfamily Households |
| 1-Person Households | - | 844 (45.7%) |
| 2-Person Households | 319 (17.3%) | 93 (5.0%) |
| 3-Person Households | 273 (14.8%) | 8 (0.4%) |
| 4-Person Households | 190 (10.3%) | 0 (0.0%) |
| 5-Person Households | 86 (4.7%) | 0 (0.0%) |
| 6-Person Households | 34 (1.8%) | 0 (0.0%) |
| 7+ Person Households | 0 (0.0%) | 0 (0.0%) |
| Total | 902 (48.8%) | 945 (51.2%) |
Female Fertility in Belleville
Fertility by Age in Belleville
Average fertility rate in Belleville is 99.0 births per 1,000 women. Women in the age bracket of 20 to 34 years have the highest fertility rate with 176.0 births per 1,000 women. Women in the age bracket of 20 to 34 years acount for 81.1% of all women with births.
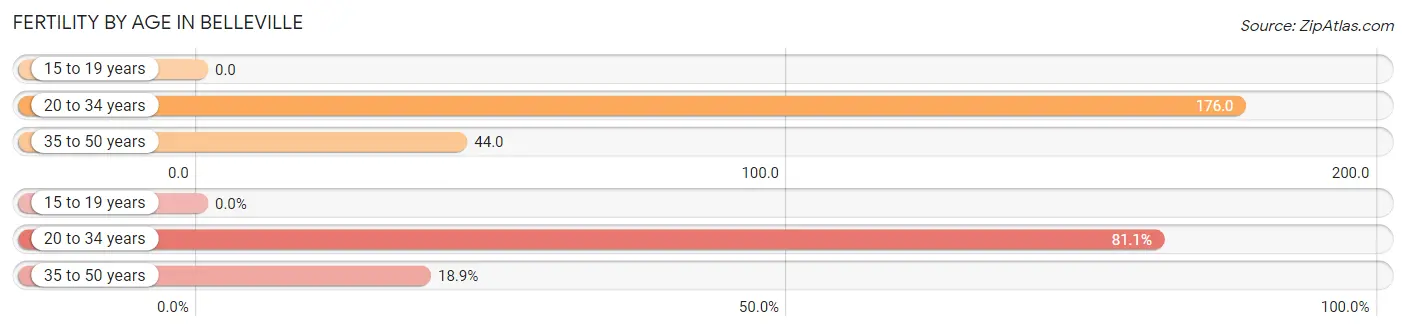
| Age Bracket | Women with Births | Births / 1,000 Women |
| 15 to 19 years | 0 (0.0%) | 0.0 |
| 20 to 34 years | 90 (81.1%) | 176.0 |
| 35 to 50 years | 21 (18.9%) | 44.0 |
| Total | 111 (100.0%) | 99.0 |
Fertility by Age by Marriage Status in Belleville
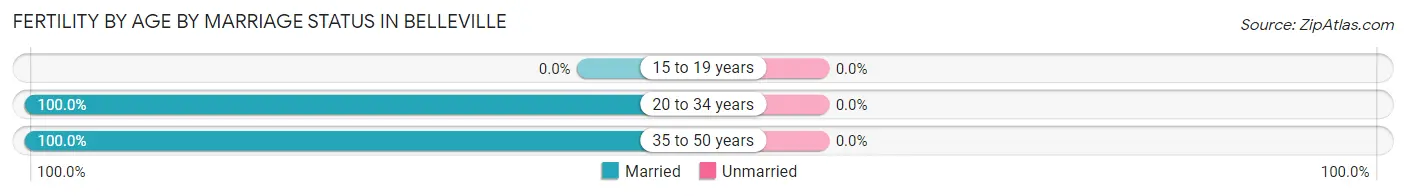
| Age Bracket | Married | Unmarried |
| 15 to 19 years | 0 (0.0%) | 0 (0.0%) |
| 20 to 34 years | 90 (100.0%) | 0 (0.0%) |
| 35 to 50 years | 21 (100.0%) | 0 (0.0%) |
| Total | 111 (100.0%) | 0 (0.0%) |
Fertility by Education in Belleville
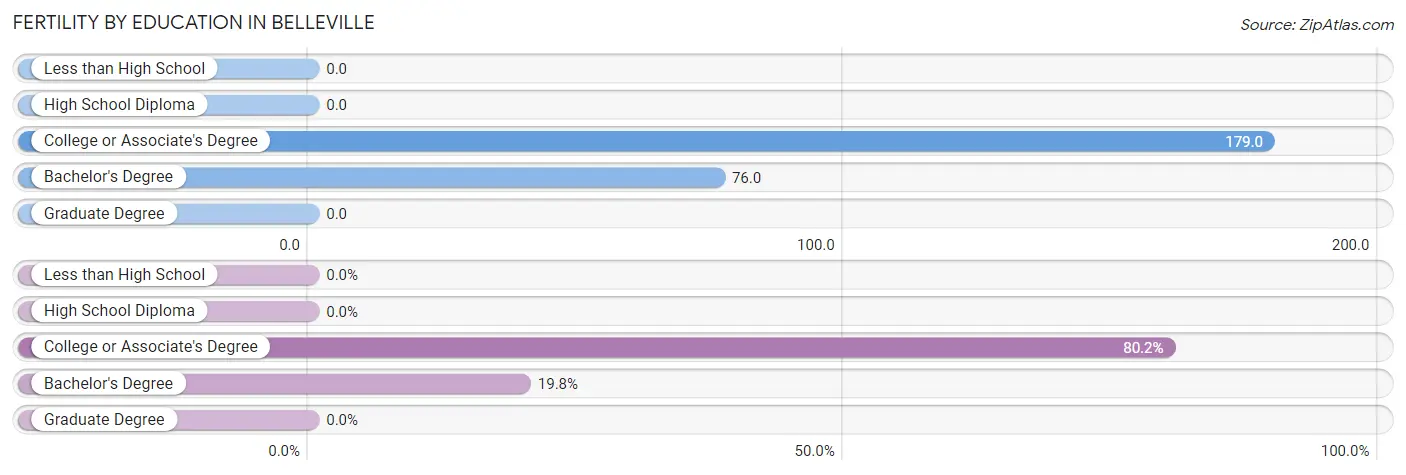
| Educational Attainment | Women with Births | Births / 1,000 Women |
| Less than High School | 0 (0.0%) | 0.0 |
| High School Diploma | 0 (0.0%) | 0.0 |
| College or Associate's Degree | 89 (80.2%) | 179.0 |
| Bachelor's Degree | 22 (19.8%) | 76.0 |
| Graduate Degree | 0 (0.0%) | 0.0 |
| Total | 111 (100.0%) | 99.0 |
Fertility by Education by Marriage Status in Belleville
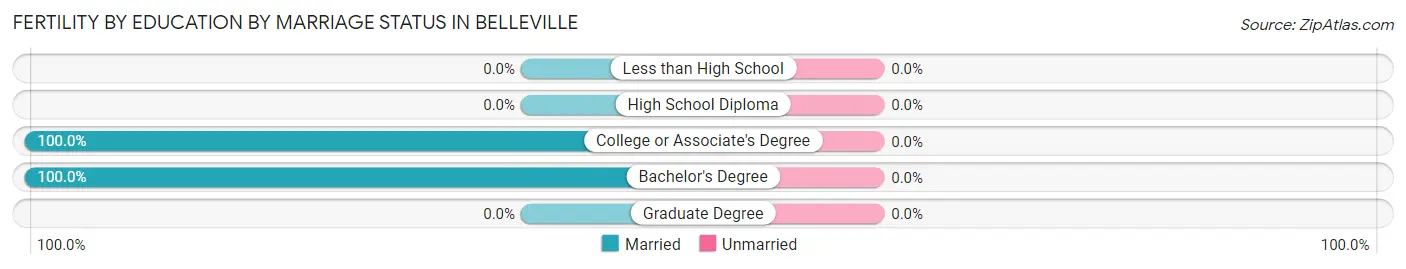
| Educational Attainment | Married | Unmarried |
| Less than High School | 0 (0.0%) | 0 (0.0%) |
| High School Diploma | 0 (0.0%) | 0 (0.0%) |
| College or Associate's Degree | 89 (100.0%) | 0 (0.0%) |
| Bachelor's Degree | 22 (100.0%) | 0 (0.0%) |
| Graduate Degree | 0 (0.0%) | 0 (0.0%) |
| Total | 111 (100.0%) | 0 (0.0%) |
Employment Characteristics in Belleville
Employment by Class of Employer in Belleville
Among the 1,747 employed individuals in Belleville, private company employees (1,351 | 77.3%), not-for-profit organizations (181 | 10.4%), and state government employees (85 | 4.9%) make up the most common classes of employment.
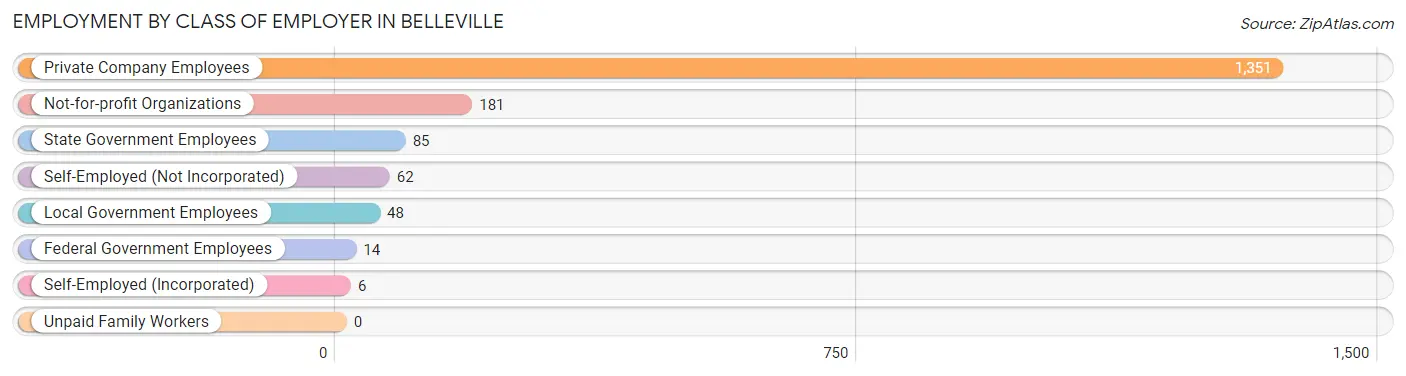
| Employer Class | # Employees | % Employees |
| Private Company Employees | 1,351 | 77.3% |
| Self-Employed (Incorporated) | 6 | 0.3% |
| Self-Employed (Not Incorporated) | 62 | 3.5% |
| Not-for-profit Organizations | 181 | 10.4% |
| Local Government Employees | 48 | 2.8% |
| State Government Employees | 85 | 4.9% |
| Federal Government Employees | 14 | 0.8% |
| Unpaid Family Workers | 0 | 0.0% |
| Total | 1,747 | 100.0% |
Employment Status by Age in Belleville
According to the labor force statistics for Belleville, out of the total population over 16 years of age (3,406), 57.7% or 1,965 individuals are in the labor force, with 8.5% or 167 of them unemployed. The age group with the highest labor force participation rate is 20 to 24 years, with 88.2% or 120 individuals in the labor force. Within the labor force, the 25 to 29 years age range has the highest percentage of unemployed individuals, with 19.1% or 70 of them being unemployed.
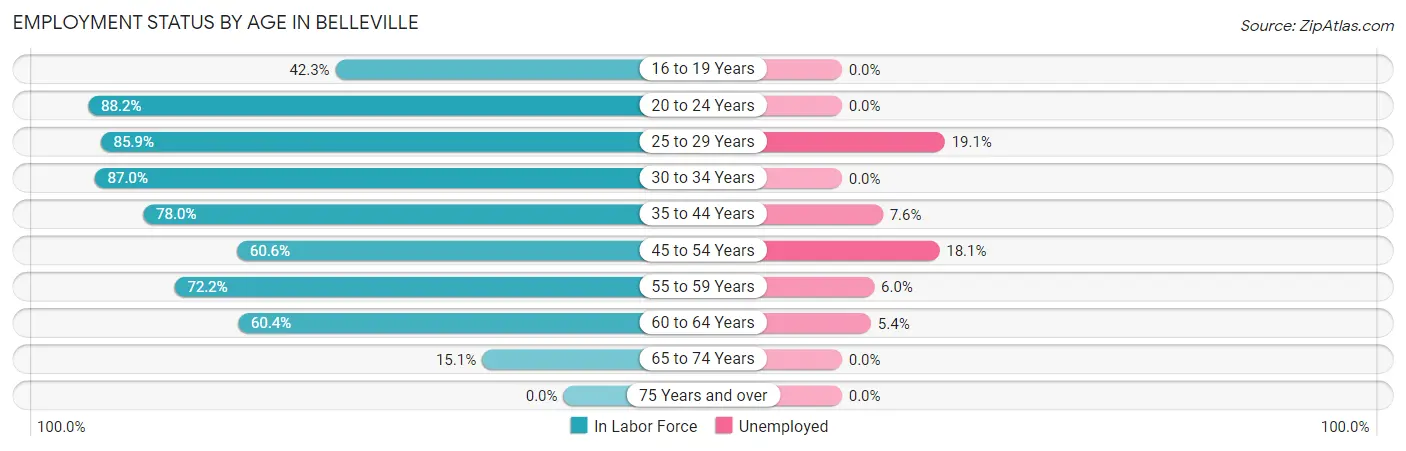
| Age Bracket | In Labor Force | Unemployed |
| 16 to 19 Years | 135 (42.3%) | 0 (0.0%) |
| 20 to 24 Years | 120 (88.2%) | 0 (0.0%) |
| 25 to 29 Years | 366 (85.9%) | 70 (19.1%) |
| 30 to 34 Years | 228 (87.0%) | 0 (0.0%) |
| 35 to 44 Years | 450 (78.0%) | 34 (7.6%) |
| 45 to 54 Years | 248 (60.6%) | 45 (18.1%) |
| 55 to 59 Years | 151 (72.2%) | 9 (6.0%) |
| 60 to 64 Years | 186 (60.4%) | 10 (5.4%) |
| 65 to 74 Years | 81 (15.1%) | 0 (0.0%) |
| 75 Years and over | 0 (0.0%) | 0 (0.0%) |
| Total | 1,965 (57.7%) | 167 (8.5%) |
Employment Status by Educational Attainment in Belleville
According to labor force statistics for Belleville, 74.3% of individuals (1,628) out of the total population between 25 and 64 years of age (2,191) are in the labor force, with 10.3% or 168 of them being unemployed. The group with the highest labor force participation rate are those with the educational attainment of bachelor's degree or higher, with 90.7% or 686 individuals in the labor force. Within the labor force, individuals with less than high school education have the highest percentage of unemployment, with 23.7% or 22 of them being unemployed.
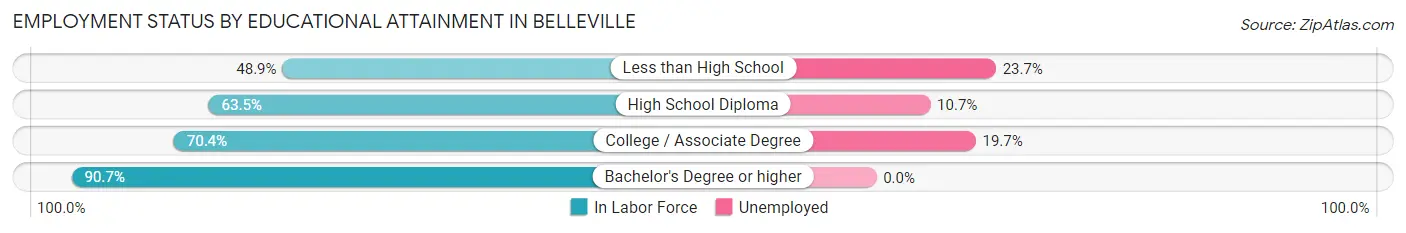
| Educational Attainment | In Labor Force | Unemployed |
| Less than High School | 93 (48.9%) | 45 (23.7%) |
| High School Diploma | 242 (63.5%) | 41 (10.7%) |
| College / Associate Degree | 608 (70.4%) | 170 (19.7%) |
| Bachelor's Degree or higher | 686 (90.7%) | 0 (0.0%) |
| Total | 1,628 (74.3%) | 226 (10.3%) |
Employment Occupations by Sex in Belleville
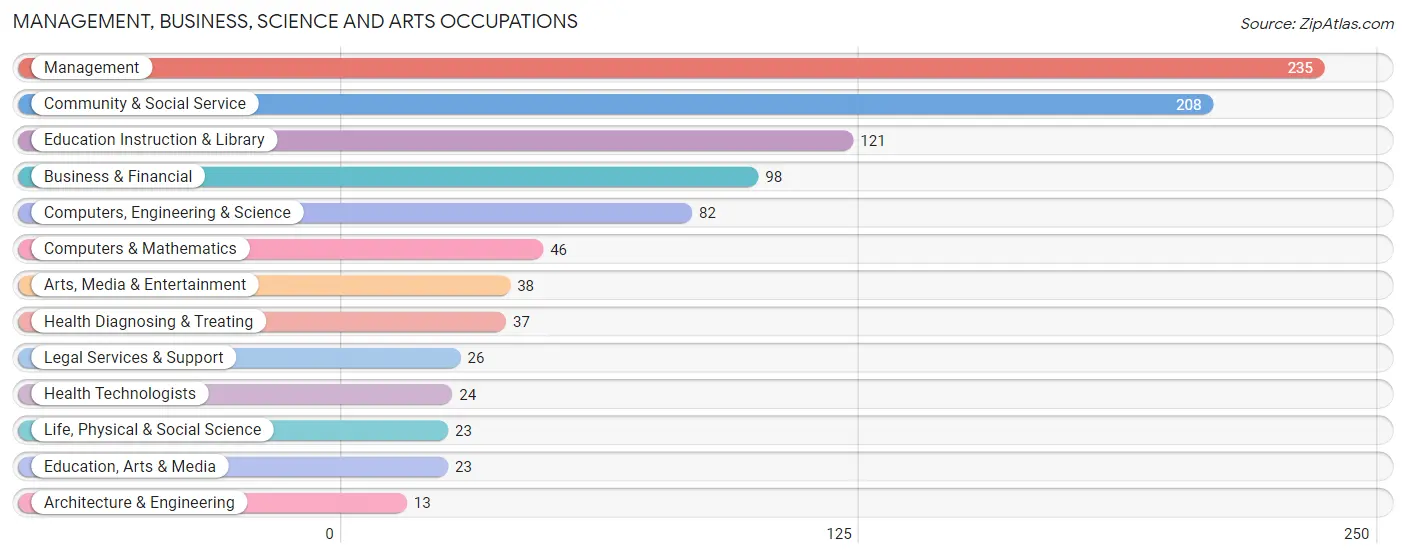
Management, Business, Science and Arts Occupations
The most common Management, Business, Science and Arts occupations in Belleville are Management (235 | 13.1%), Community & Social Service (208 | 11.6%), Education Instruction & Library (121 | 6.7%), Business & Financial (98 | 5.4%), and Computers, Engineering & Science (82 | 4.6%).
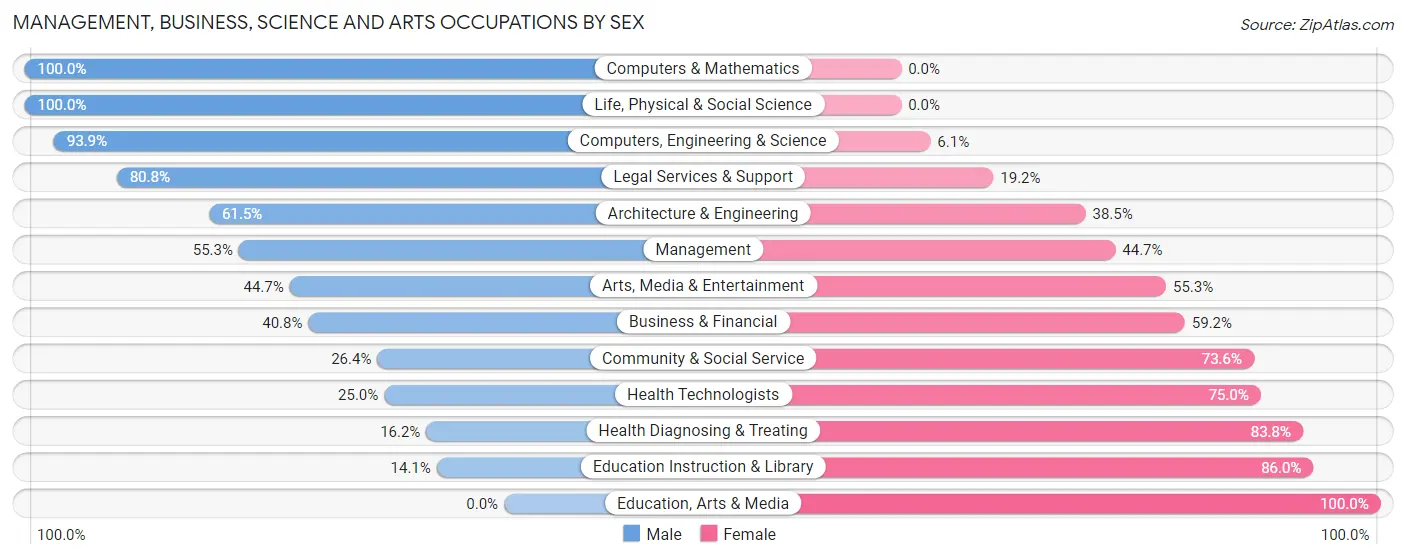
Management, Business, Science and Arts Occupations by Sex
Within the Management, Business, Science and Arts occupations in Belleville, the most male-oriented occupations are Computers & Mathematics (100.0%), Life, Physical & Social Science (100.0%), and Computers, Engineering & Science (93.9%), while the most female-oriented occupations are Education, Arts & Media (100.0%), Education Instruction & Library (86.0%), and Health Diagnosing & Treating (83.8%).
| Occupation | Male | Female |
| Management | 130 (55.3%) | 105 (44.7%) |
| Business & Financial | 40 (40.8%) | 58 (59.2%) |
| Computers, Engineering & Science | 77 (93.9%) | 5 (6.1%) |
| Computers & Mathematics | 46 (100.0%) | 0 (0.0%) |
| Architecture & Engineering | 8 (61.5%) | 5 (38.5%) |
| Life, Physical & Social Science | 23 (100.0%) | 0 (0.0%) |
| Community & Social Service | 55 (26.4%) | 153 (73.6%) |
| Education, Arts & Media | 0 (0.0%) | 23 (100.0%) |
| Legal Services & Support | 21 (80.8%) | 5 (19.2%) |
| Education Instruction & Library | 17 (14.1%) | 104 (86.0%) |
| Arts, Media & Entertainment | 17 (44.7%) | 21 (55.3%) |
| Health Diagnosing & Treating | 6 (16.2%) | 31 (83.8%) |
| Health Technologists | 6 (25.0%) | 18 (75.0%) |
| Total (Category) | 308 (46.7%) | 352 (53.3%) |
| Total (Overall) | 728 (40.5%) | 1,069 (59.5%) |
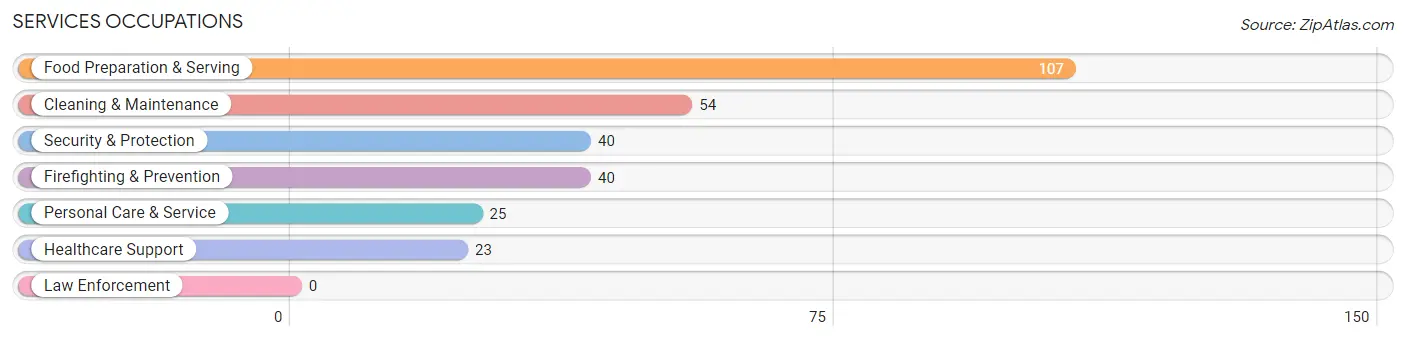
Services Occupations
The most common Services occupations in Belleville are Food Preparation & Serving (107 | 5.9%), Cleaning & Maintenance (54 | 3.0%), Security & Protection (40 | 2.2%), Firefighting & Prevention (40 | 2.2%), and Personal Care & Service (25 | 1.4%).
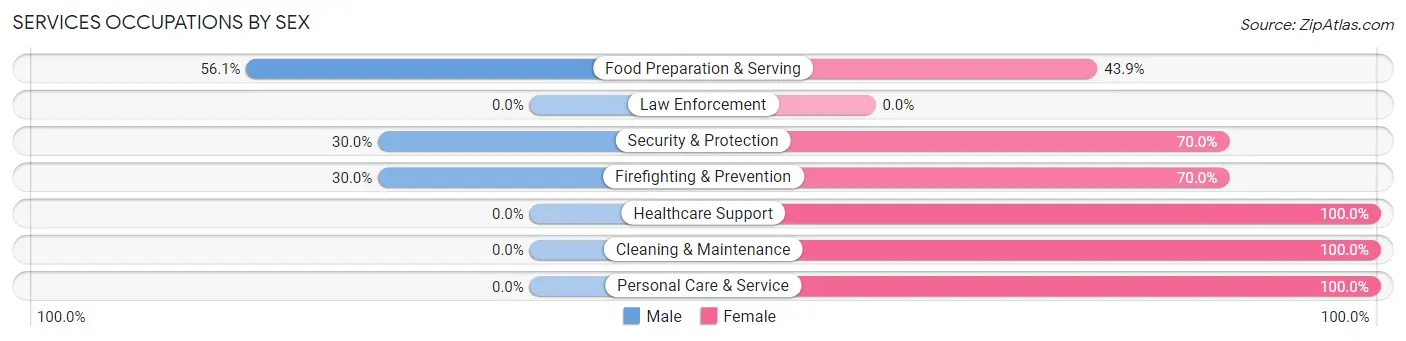
Services Occupations by Sex
Within the Services occupations in Belleville, the most male-oriented occupations are Food Preparation & Serving (56.1%), Security & Protection (30.0%), and Firefighting & Prevention (30.0%), while the most female-oriented occupations are Healthcare Support (100.0%), Cleaning & Maintenance (100.0%), and Personal Care & Service (100.0%).
| Occupation | Male | Female |
| Healthcare Support | 0 (0.0%) | 23 (100.0%) |
| Security & Protection | 12 (30.0%) | 28 (70.0%) |
| Firefighting & Prevention | 12 (30.0%) | 28 (70.0%) |
| Law Enforcement | 0 (0.0%) | 0 (0.0%) |
| Food Preparation & Serving | 60 (56.1%) | 47 (43.9%) |
| Cleaning & Maintenance | 0 (0.0%) | 54 (100.0%) |
| Personal Care & Service | 0 (0.0%) | 25 (100.0%) |
| Total (Category) | 72 (28.9%) | 177 (71.1%) |
| Total (Overall) | 728 (40.5%) | 1,069 (59.5%) |
Sales and Office Occupations
The most common Sales and Office occupations in Belleville are Office & Administration (262 | 14.6%), and Sales & Related (201 | 11.2%).

Sales and Office Occupations by Sex
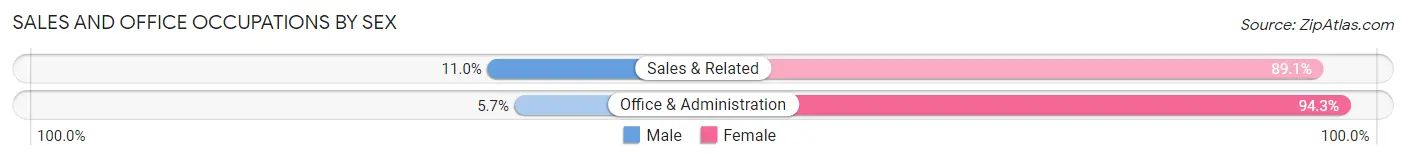
| Occupation | Male | Female |
| Sales & Related | 22 (11.0%) | 179 (89.0%) |
| Office & Administration | 15 (5.7%) | 247 (94.3%) |
| Total (Category) | 37 (8.0%) | 426 (92.0%) |
| Total (Overall) | 728 (40.5%) | 1,069 (59.5%) |
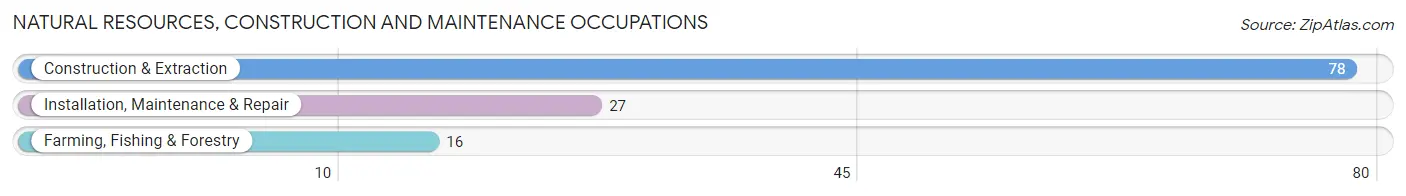
Natural Resources, Construction and Maintenance Occupations
The most common Natural Resources, Construction and Maintenance occupations in Belleville are Construction & Extraction (78 | 4.3%), Installation, Maintenance & Repair (27 | 1.5%), and Farming, Fishing & Forestry (16 | 0.9%).
Natural Resources, Construction and Maintenance Occupations by Sex
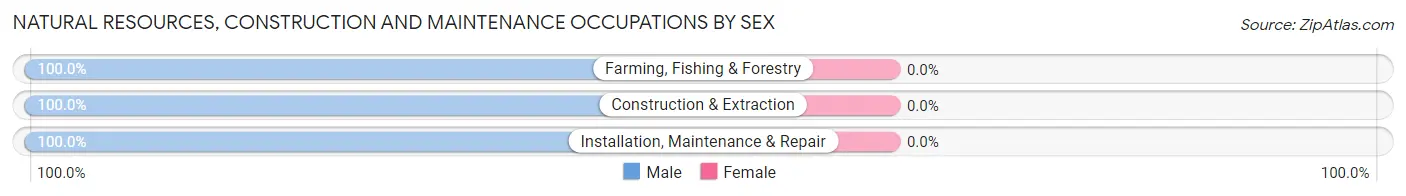
| Occupation | Male | Female |
| Farming, Fishing & Forestry | 16 (100.0%) | 0 (0.0%) |
| Construction & Extraction | 78 (100.0%) | 0 (0.0%) |
| Installation, Maintenance & Repair | 27 (100.0%) | 0 (0.0%) |
| Total (Category) | 121 (100.0%) | 0 (0.0%) |
| Total (Overall) | 728 (40.5%) | 1,069 (59.5%) |
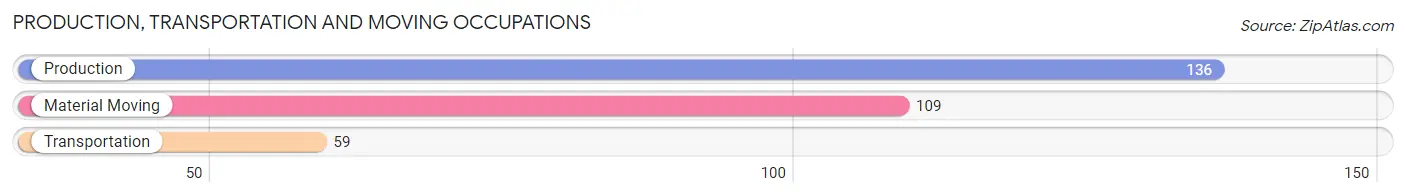
Production, Transportation and Moving Occupations
The most common Production, Transportation and Moving occupations in Belleville are Production (136 | 7.6%), Material Moving (109 | 6.1%), and Transportation (59 | 3.3%).
Production, Transportation and Moving Occupations by Sex
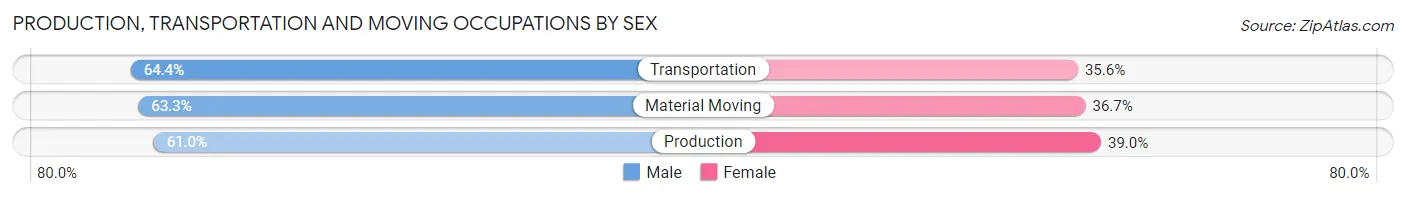
| Occupation | Male | Female |
| Production | 83 (61.0%) | 53 (39.0%) |
| Transportation | 38 (64.4%) | 21 (35.6%) |
| Material Moving | 69 (63.3%) | 40 (36.7%) |
| Total (Category) | 190 (62.5%) | 114 (37.5%) |
| Total (Overall) | 728 (40.5%) | 1,069 (59.5%) |
Employment Industries by Sex in Belleville
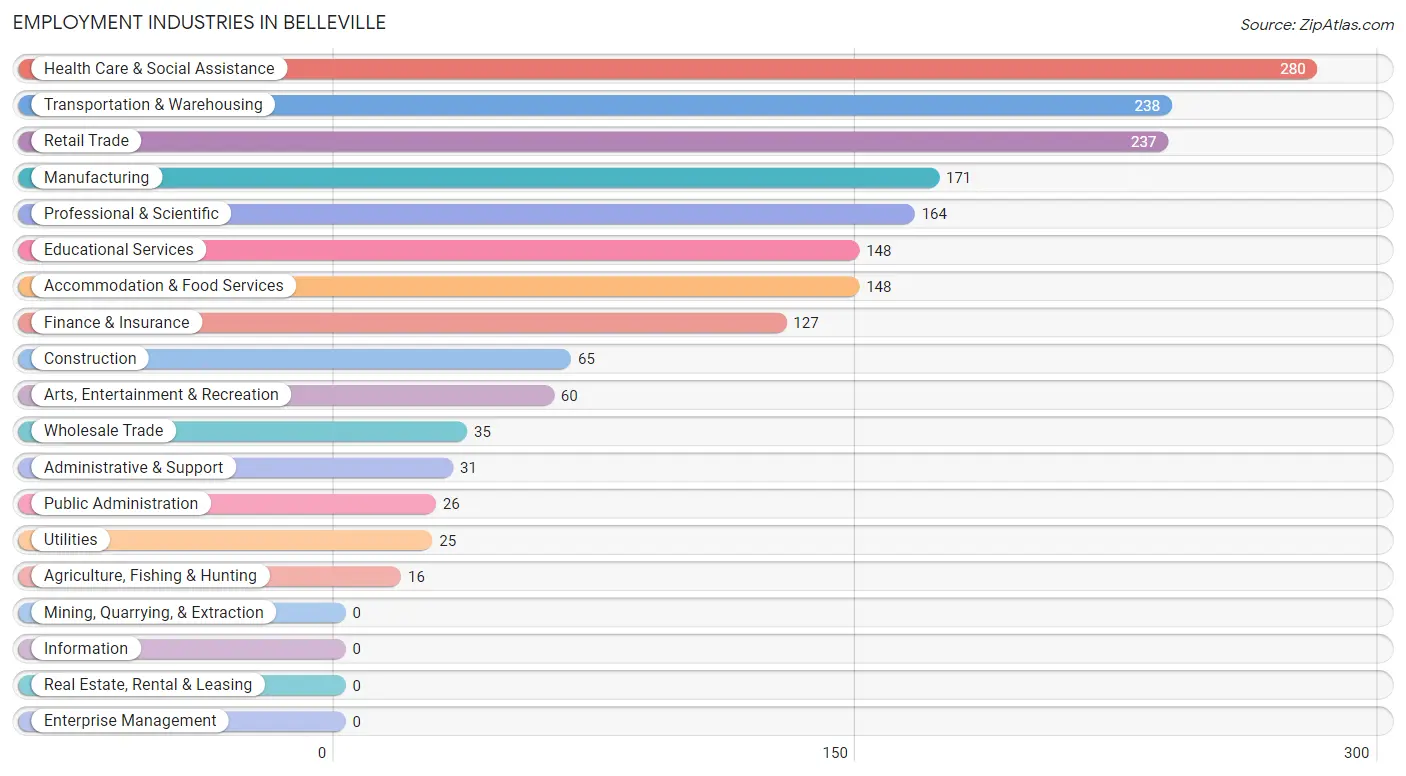
Employment Industries in Belleville
The major employment industries in Belleville include Health Care & Social Assistance (280 | 15.6%), Transportation & Warehousing (238 | 13.2%), Retail Trade (237 | 13.2%), Manufacturing (171 | 9.5%), and Professional & Scientific (164 | 9.1%).
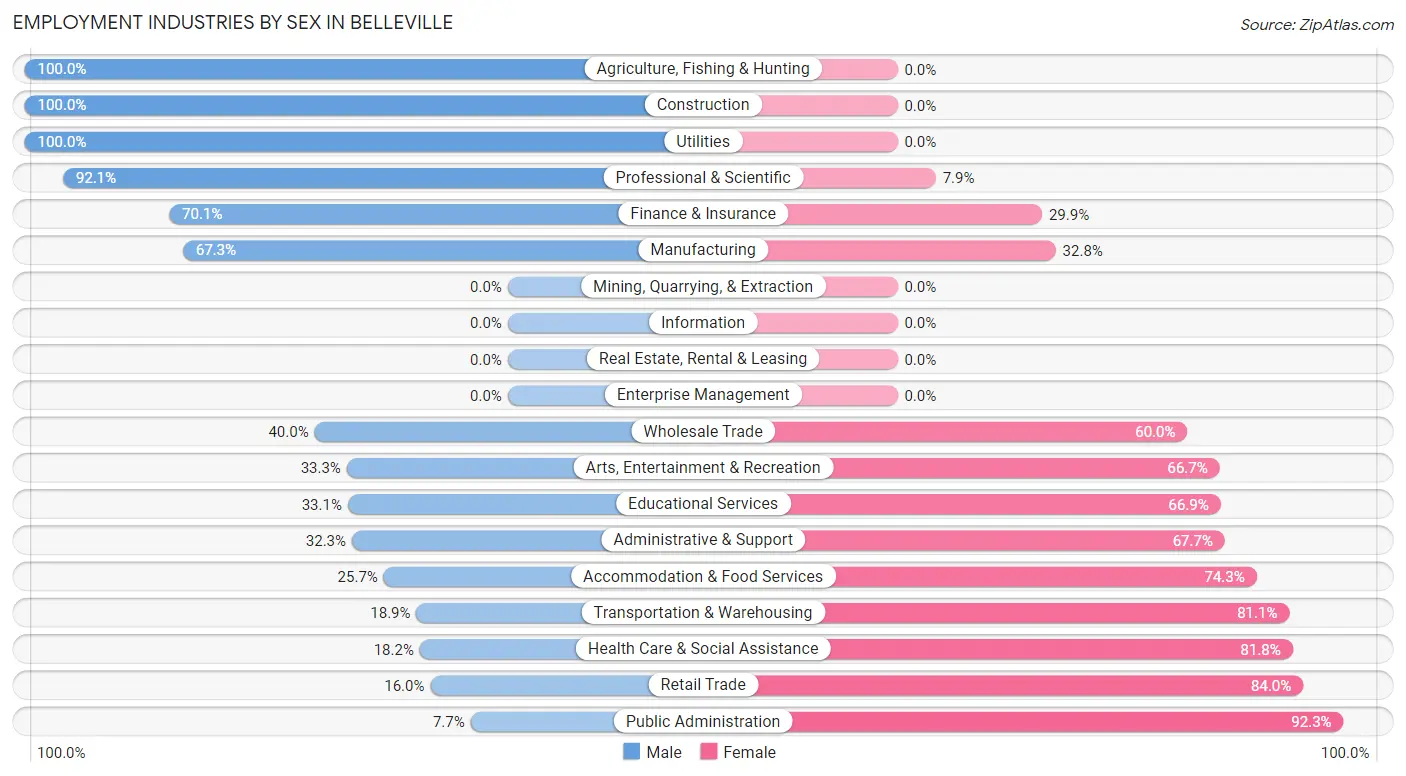
Employment Industries by Sex in Belleville
The Belleville industries that see more men than women are Agriculture, Fishing & Hunting (100.0%), Construction (100.0%), and Utilities (100.0%), whereas the industries that tend to have a higher number of women are Public Administration (92.3%), Retail Trade (84.0%), and Health Care & Social Assistance (81.8%).
| Industry | Male | Female |
| Agriculture, Fishing & Hunting | 16 (100.0%) | 0 (0.0%) |
| Mining, Quarrying, & Extraction | 0 (0.0%) | 0 (0.0%) |
| Construction | 65 (100.0%) | 0 (0.0%) |
| Manufacturing | 115 (67.2%) | 56 (32.8%) |
| Wholesale Trade | 14 (40.0%) | 21 (60.0%) |
| Retail Trade | 38 (16.0%) | 199 (84.0%) |
| Transportation & Warehousing | 45 (18.9%) | 193 (81.1%) |
| Utilities | 25 (100.0%) | 0 (0.0%) |
| Information | 0 (0.0%) | 0 (0.0%) |
| Finance & Insurance | 89 (70.1%) | 38 (29.9%) |
| Real Estate, Rental & Leasing | 0 (0.0%) | 0 (0.0%) |
| Professional & Scientific | 151 (92.1%) | 13 (7.9%) |
| Enterprise Management | 0 (0.0%) | 0 (0.0%) |
| Administrative & Support | 10 (32.3%) | 21 (67.7%) |
| Educational Services | 49 (33.1%) | 99 (66.9%) |
| Health Care & Social Assistance | 51 (18.2%) | 229 (81.8%) |
| Arts, Entertainment & Recreation | 20 (33.3%) | 40 (66.7%) |
| Accommodation & Food Services | 38 (25.7%) | 110 (74.3%) |
| Public Administration | 2 (7.7%) | 24 (92.3%) |
| Total | 728 (40.5%) | 1,069 (59.5%) |
Education in Belleville
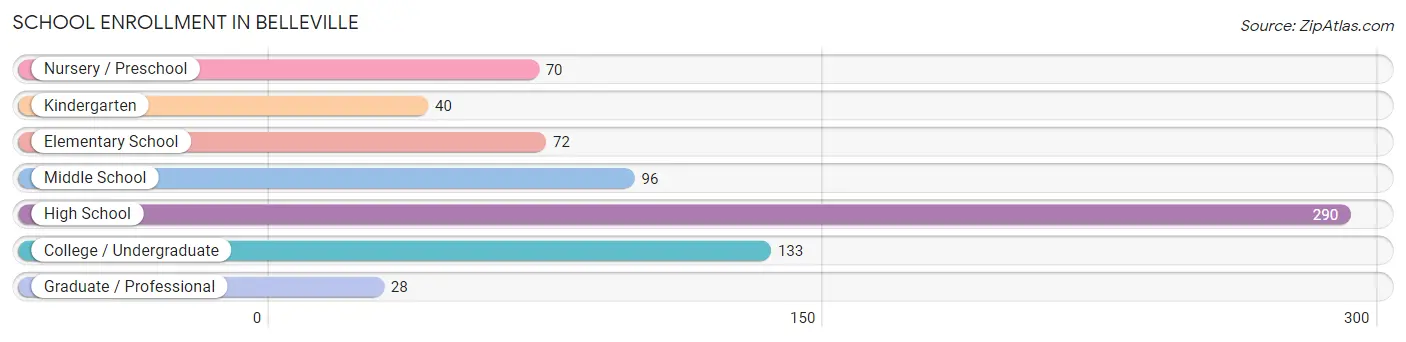
School Enrollment in Belleville
The most common levels of schooling among the 729 students in Belleville are high school (290 | 39.8%), college / undergraduate (133 | 18.2%), and middle school (96 | 13.2%).
| School Level | # Students | % Students |
| Nursery / Preschool | 70 | 9.6% |
| Kindergarten | 40 | 5.5% |
| Elementary School | 72 | 9.9% |
| Middle School | 96 | 13.2% |
| High School | 290 | 39.8% |
| College / Undergraduate | 133 | 18.2% |
| Graduate / Professional | 28 | 3.8% |
| Total | 729 | 100.0% |
School Enrollment by Age by Funding Source in Belleville
Out of a total of 729 students who are enrolled in schools in Belleville, 131 (18.0%) attend a private institution, while the remaining 598 (82.0%) are enrolled in public schools. The age group of 10 to 14 year olds has the highest likelihood of being enrolled in private schools, with 56 (48.7% in the age bracket) enrolled. Conversely, the age group of 18 to 19 year olds has the lowest likelihood of being enrolled in a private school, with 86 (100.0% in the age bracket) attending a public institution.
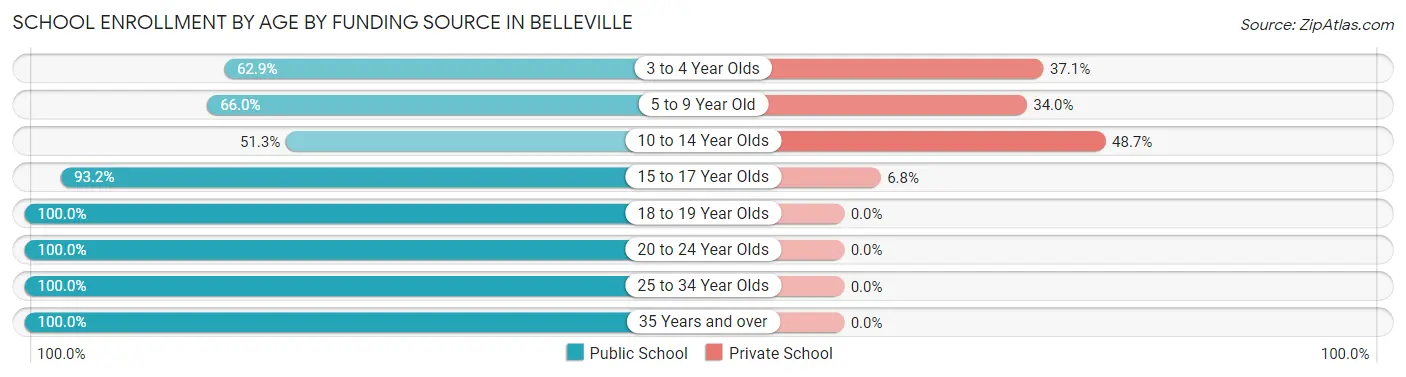
| Age Bracket | Public School | Private School |
| 3 to 4 Year Olds | 44 (62.9%) | 26 (37.1%) |
| 5 to 9 Year Old | 64 (66.0%) | 33 (34.0%) |
| 10 to 14 Year Olds | 59 (51.3%) | 56 (48.7%) |
| 15 to 17 Year Olds | 219 (93.2%) | 16 (6.8%) |
| 18 to 19 Year Olds | 86 (100.0%) | 0 (0.0%) |
| 20 to 24 Year Olds | 27 (100.0%) | 0 (0.0%) |
| 25 to 34 Year Olds | 84 (100.0%) | 0 (0.0%) |
| 35 Years and over | 15 (100.0%) | 0 (0.0%) |
| Total | 598 (82.0%) | 131 (18.0%) |
Educational Attainment by Field of Study in Belleville
Education (190 | 17.4%), psychology (180 | 16.5%), business (133 | 12.2%), social sciences (116 | 10.6%), and communications (110 | 10.1%) are the most common fields of study among 1,089 individuals in Belleville who have obtained a bachelor's degree or higher.
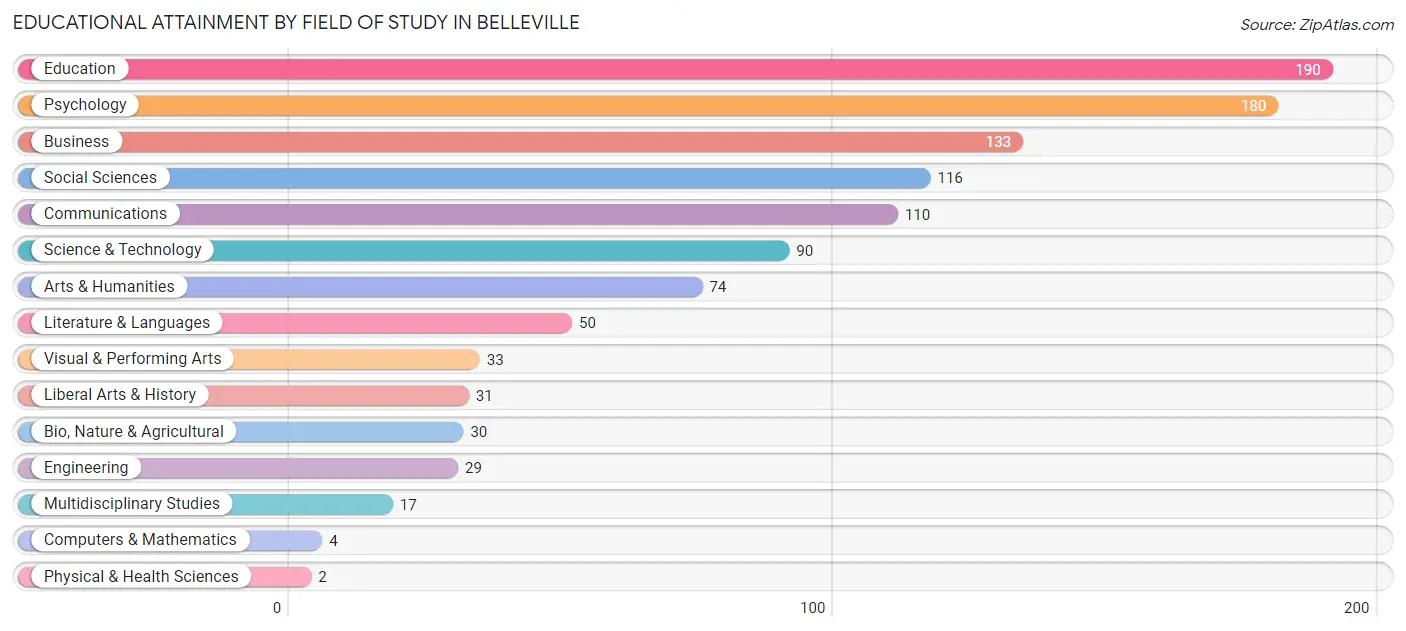
| Field of Study | # Graduates | % Graduates |
| Computers & Mathematics | 4 | 0.4% |
| Bio, Nature & Agricultural | 30 | 2.8% |
| Physical & Health Sciences | 2 | 0.2% |
| Psychology | 180 | 16.5% |
| Social Sciences | 116 | 10.6% |
| Engineering | 29 | 2.7% |
| Multidisciplinary Studies | 17 | 1.6% |
| Science & Technology | 90 | 8.3% |
| Business | 133 | 12.2% |
| Education | 190 | 17.4% |
| Literature & Languages | 50 | 4.6% |
| Liberal Arts & History | 31 | 2.9% |
| Visual & Performing Arts | 33 | 3.0% |
| Communications | 110 | 10.1% |
| Arts & Humanities | 74 | 6.8% |
| Total | 1,089 | 100.0% |
Transportation & Commute in Belleville
Vehicle Availability by Sex in Belleville
The most prevalent vehicle ownership categories in Belleville are males with 2 vehicles (414, accounting for 57.9%) and females with 2 vehicles (415, making up 40.3%).
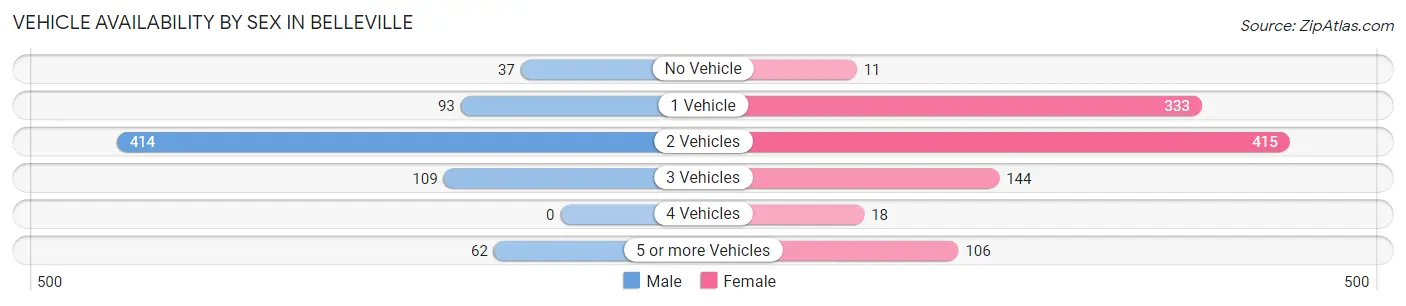
| Vehicles Available | Male | Female |
| No Vehicle | 37 (5.2%) | 11 (1.1%) |
| 1 Vehicle | 93 (13.0%) | 333 (32.4%) |
| 2 Vehicles | 414 (57.9%) | 415 (40.4%) |
| 3 Vehicles | 109 (15.2%) | 144 (14.0%) |
| 4 Vehicles | 0 (0.0%) | 18 (1.8%) |
| 5 or more Vehicles | 62 (8.7%) | 106 (10.3%) |
| Total | 715 (100.0%) | 1,027 (100.0%) |
Commute Time in Belleville
The most frequently occuring commute durations in Belleville are 20 to 24 minutes (281 commuters, 20.6%), 30 to 34 minutes (275 commuters, 20.2%), and 15 to 19 minutes (204 commuters, 14.9%).
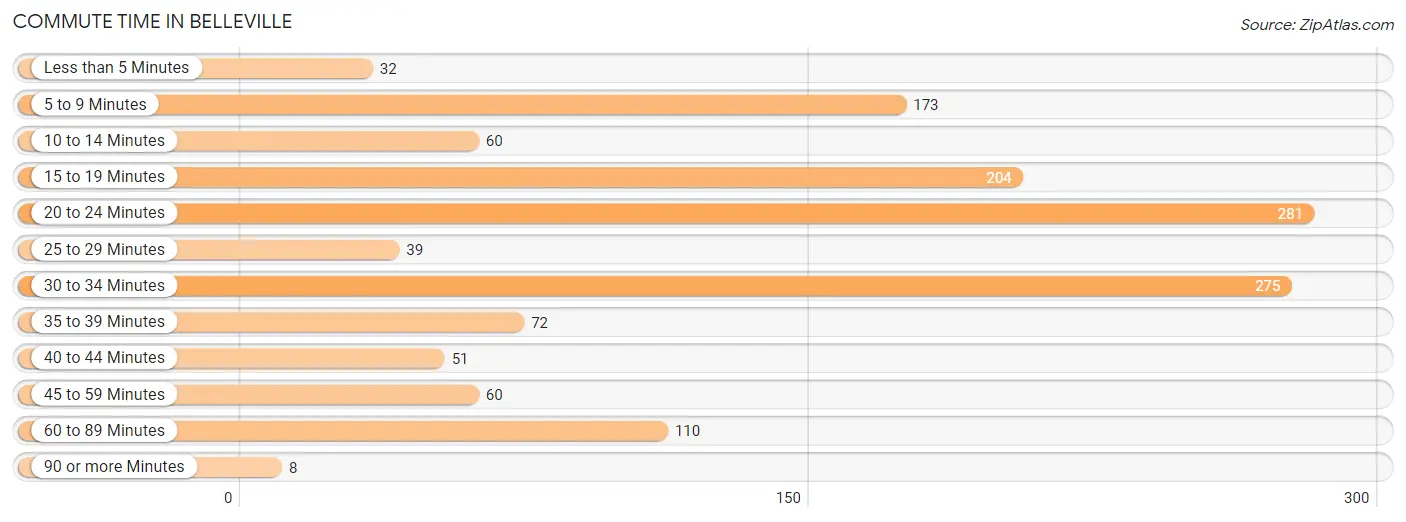
| Commute Time | # Commuters | % Commuters |
| Less than 5 Minutes | 32 | 2.3% |
| 5 to 9 Minutes | 173 | 12.7% |
| 10 to 14 Minutes | 60 | 4.4% |
| 15 to 19 Minutes | 204 | 14.9% |
| 20 to 24 Minutes | 281 | 20.6% |
| 25 to 29 Minutes | 39 | 2.9% |
| 30 to 34 Minutes | 275 | 20.2% |
| 35 to 39 Minutes | 72 | 5.3% |
| 40 to 44 Minutes | 51 | 3.7% |
| 45 to 59 Minutes | 60 | 4.4% |
| 60 to 89 Minutes | 110 | 8.1% |
| 90 or more Minutes | 8 | 0.6% |
Commute Time by Sex in Belleville
The most common commute times in Belleville are 20 to 24 minutes (151 commuters, 27.3%) for males and 30 to 34 minutes (197 commuters, 24.3%) for females.
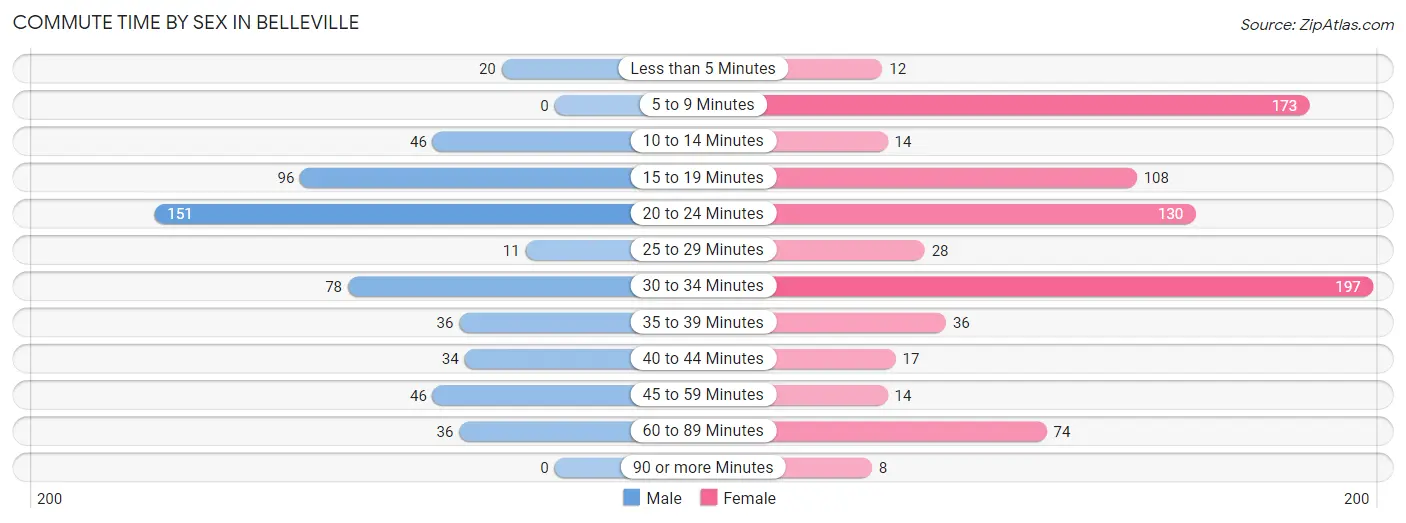
| Commute Time | Male | Female |
| Less than 5 Minutes | 20 (3.6%) | 12 (1.5%) |
| 5 to 9 Minutes | 0 (0.0%) | 173 (21.3%) |
| 10 to 14 Minutes | 46 (8.3%) | 14 (1.7%) |
| 15 to 19 Minutes | 96 (17.3%) | 108 (13.3%) |
| 20 to 24 Minutes | 151 (27.3%) | 130 (16.0%) |
| 25 to 29 Minutes | 11 (2.0%) | 28 (3.5%) |
| 30 to 34 Minutes | 78 (14.1%) | 197 (24.3%) |
| 35 to 39 Minutes | 36 (6.5%) | 36 (4.4%) |
| 40 to 44 Minutes | 34 (6.1%) | 17 (2.1%) |
| 45 to 59 Minutes | 46 (8.3%) | 14 (1.7%) |
| 60 to 89 Minutes | 36 (6.5%) | 74 (9.1%) |
| 90 or more Minutes | 0 (0.0%) | 8 (1.0%) |
Time of Departure to Work by Sex in Belleville
The most frequent times of departure to work in Belleville are 5:00 AM to 5:29 AM (77, 13.9%) for males and 4:00 PM to 11:59 PM (233, 28.7%) for females.
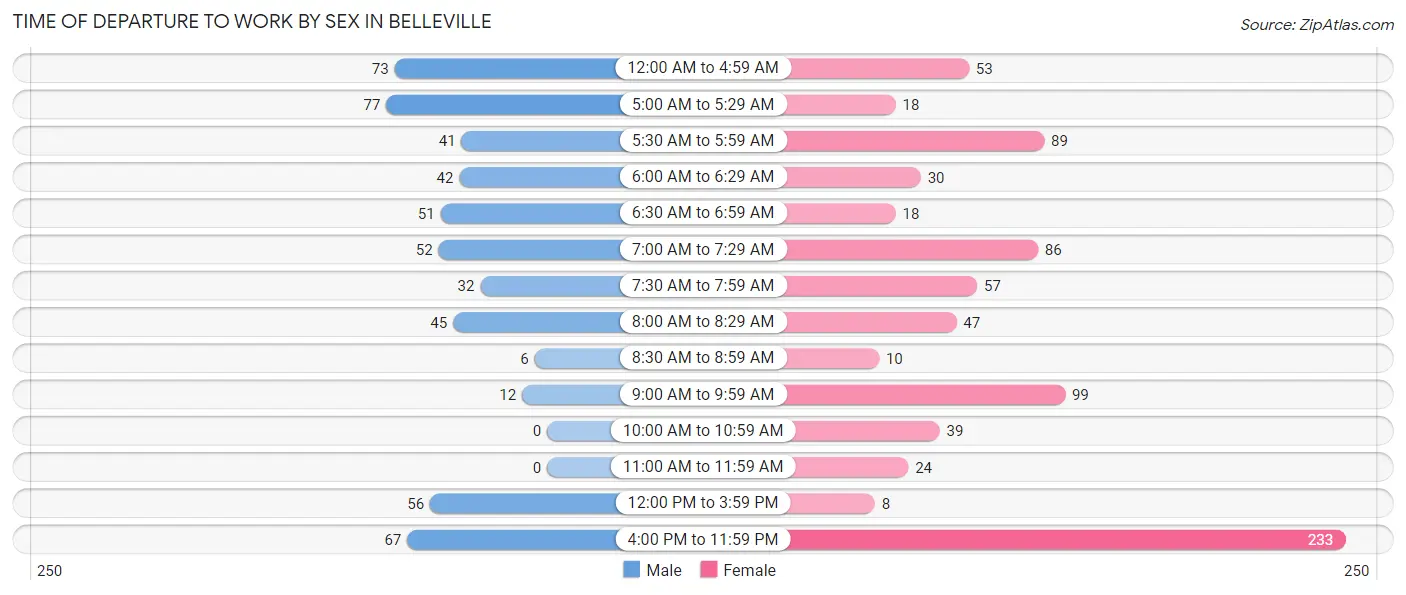
| Time of Departure | Male | Female |
| 12:00 AM to 4:59 AM | 73 (13.2%) | 53 (6.5%) |
| 5:00 AM to 5:29 AM | 77 (13.9%) | 18 (2.2%) |
| 5:30 AM to 5:59 AM | 41 (7.4%) | 89 (11.0%) |
| 6:00 AM to 6:29 AM | 42 (7.6%) | 30 (3.7%) |
| 6:30 AM to 6:59 AM | 51 (9.2%) | 18 (2.2%) |
| 7:00 AM to 7:29 AM | 52 (9.4%) | 86 (10.6%) |
| 7:30 AM to 7:59 AM | 32 (5.8%) | 57 (7.0%) |
| 8:00 AM to 8:29 AM | 45 (8.1%) | 47 (5.8%) |
| 8:30 AM to 8:59 AM | 6 (1.1%) | 10 (1.2%) |
| 9:00 AM to 9:59 AM | 12 (2.2%) | 99 (12.2%) |
| 10:00 AM to 10:59 AM | 0 (0.0%) | 39 (4.8%) |
| 11:00 AM to 11:59 AM | 0 (0.0%) | 24 (3.0%) |
| 12:00 PM to 3:59 PM | 56 (10.1%) | 8 (1.0%) |
| 4:00 PM to 11:59 PM | 67 (12.1%) | 233 (28.7%) |
| Total | 554 (100.0%) | 811 (100.0%) |
Housing Occupancy in Belleville
Occupancy by Ownership in Belleville
Of the total 1,847 dwellings in Belleville, owner-occupied units account for 916 (49.6%), while renter-occupied units make up 931 (50.4%).
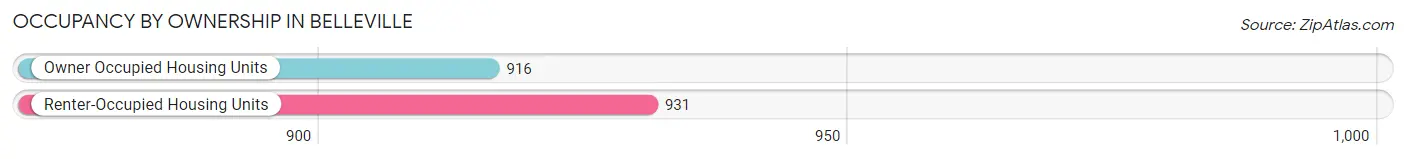
| Occupancy | # Housing Units | % Housing Units |
| Owner Occupied Housing Units | 916 | 49.6% |
| Renter-Occupied Housing Units | 931 | 50.4% |
| Total Occupied Housing Units | 1,847 | 100.0% |
Occupancy by Household Size in Belleville
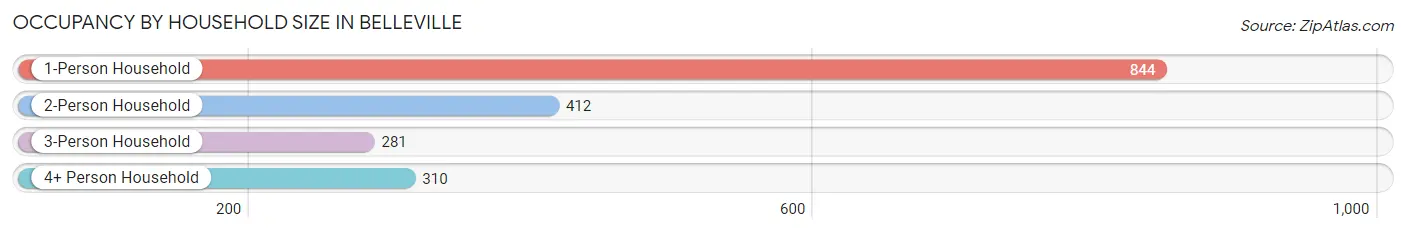
| Household Size | # Housing Units | % Housing Units |
| 1-Person Household | 844 | 45.7% |
| 2-Person Household | 412 | 22.3% |
| 3-Person Household | 281 | 15.2% |
| 4+ Person Household | 310 | 16.8% |
| Total Housing Units | 1,847 | 100.0% |
Occupancy by Ownership by Household Size in Belleville
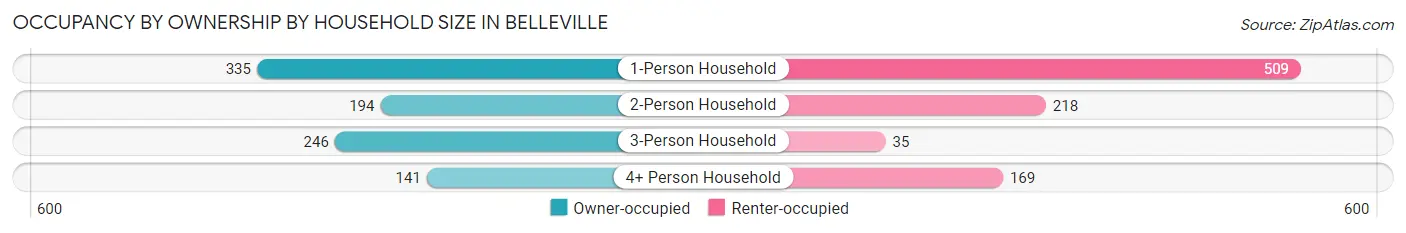
| Household Size | Owner-occupied | Renter-occupied |
| 1-Person Household | 335 (39.7%) | 509 (60.3%) |
| 2-Person Household | 194 (47.1%) | 218 (52.9%) |
| 3-Person Household | 246 (87.5%) | 35 (12.5%) |
| 4+ Person Household | 141 (45.5%) | 169 (54.5%) |
| Total Housing Units | 916 (49.6%) | 931 (50.4%) |
Occupancy by Educational Attainment in Belleville
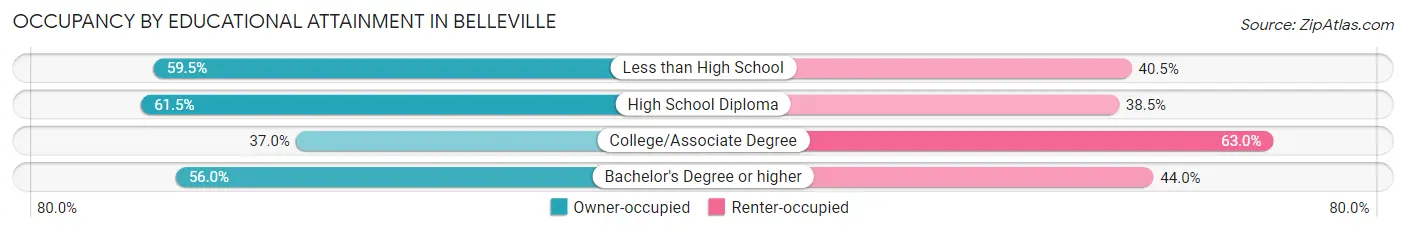
| Household Size | Owner-occupied | Renter-occupied |
| Less than High School | 72 (59.5%) | 49 (40.5%) |
| High School Diploma | 246 (61.5%) | 154 (38.5%) |
| College/Associate Degree | 282 (37.0%) | 480 (63.0%) |
| Bachelor's Degree or higher | 316 (56.0%) | 248 (44.0%) |
Occupancy by Age of Householder in Belleville
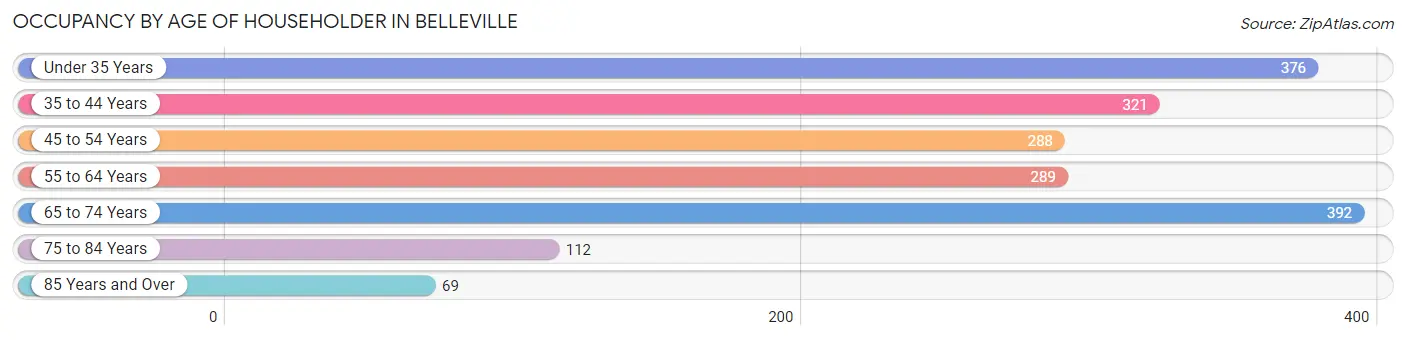
| Age Bracket | # Households | % Households |
| Under 35 Years | 376 | 20.4% |
| 35 to 44 Years | 321 | 17.4% |
| 45 to 54 Years | 288 | 15.6% |
| 55 to 64 Years | 289 | 15.7% |
| 65 to 74 Years | 392 | 21.2% |
| 75 to 84 Years | 112 | 6.1% |
| 85 Years and Over | 69 | 3.7% |
| Total | 1,847 | 100.0% |
Housing Finances in Belleville
Median Income by Occupancy in Belleville
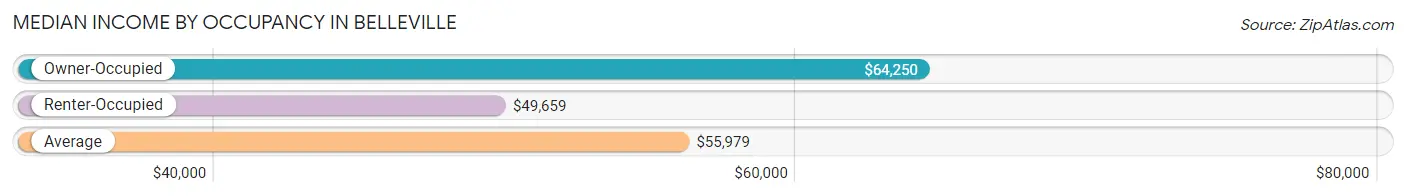
| Occupancy Type | # Households | Median Income |
| Owner-Occupied | 916 (49.6%) | $64,250 |
| Renter-Occupied | 931 (50.4%) | $49,659 |
| Average | 1,847 (100.0%) | $55,979 |
Occupancy by Householder Income Bracket in Belleville
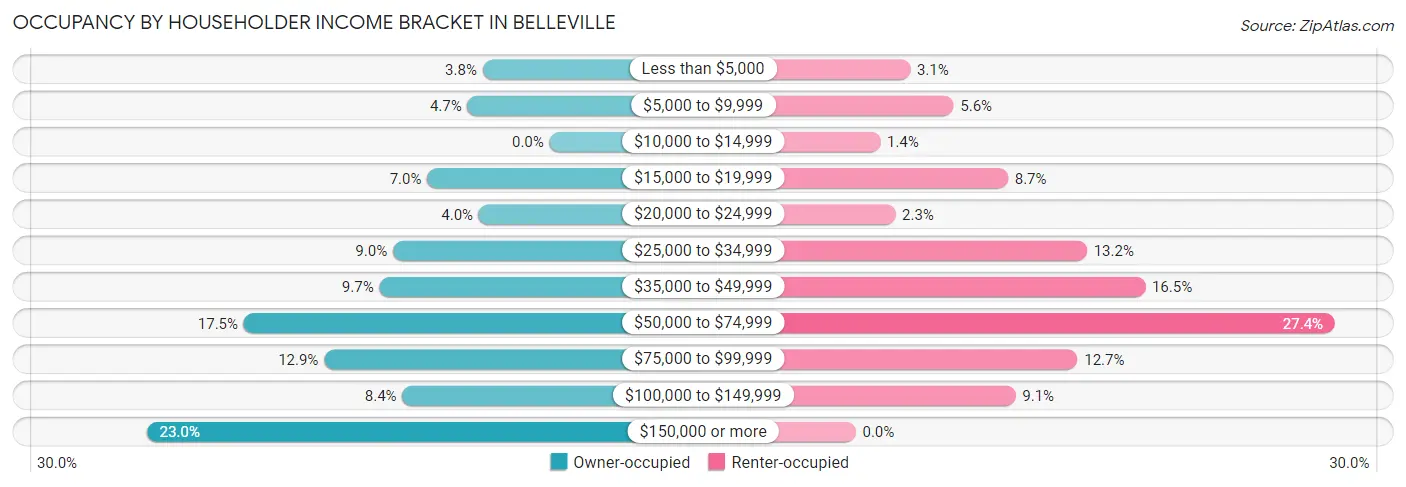
| Income Bracket | Owner-occupied | Renter-occupied |
| Less than $5,000 | 35 (3.8%) | 29 (3.1%) |
| $5,000 to $9,999 | 43 (4.7%) | 52 (5.6%) |
| $10,000 to $14,999 | 0 (0.0%) | 13 (1.4%) |
| $15,000 to $19,999 | 64 (7.0%) | 81 (8.7%) |
| $20,000 to $24,999 | 37 (4.0%) | 21 (2.3%) |
| $25,000 to $34,999 | 82 (8.9%) | 123 (13.2%) |
| $35,000 to $49,999 | 89 (9.7%) | 154 (16.5%) |
| $50,000 to $74,999 | 160 (17.5%) | 255 (27.4%) |
| $75,000 to $99,999 | 118 (12.9%) | 118 (12.7%) |
| $100,000 to $149,999 | 77 (8.4%) | 85 (9.1%) |
| $150,000 or more | 211 (23.0%) | 0 (0.0%) |
| Total | 916 (100.0%) | 931 (100.0%) |
Monthly Housing Cost Tiers in Belleville
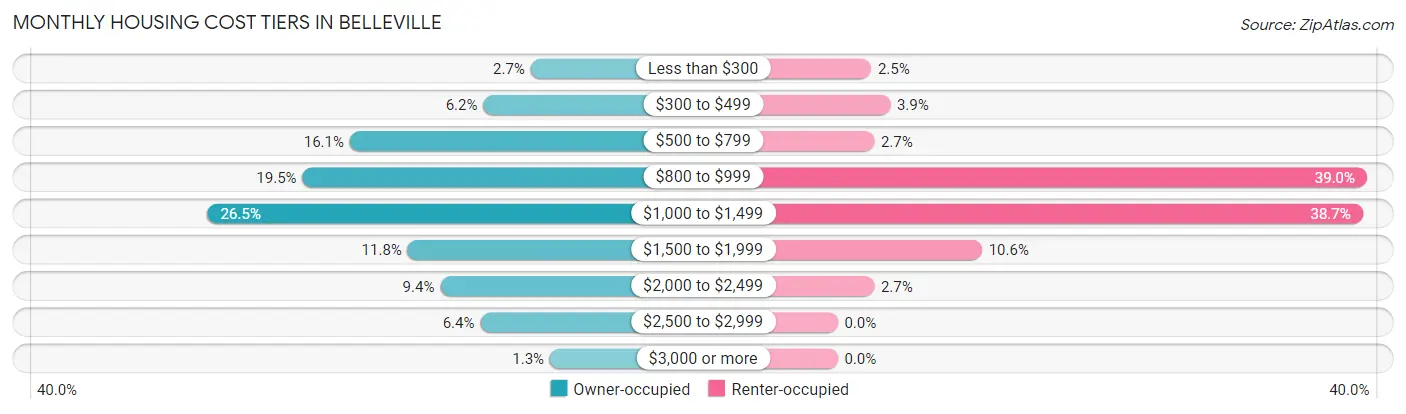
| Monthly Cost | Owner-occupied | Renter-occupied |
| Less than $300 | 25 (2.7%) | 23 (2.5%) |
| $300 to $499 | 57 (6.2%) | 36 (3.9%) |
| $500 to $799 | 147 (16.1%) | 25 (2.7%) |
| $800 to $999 | 179 (19.5%) | 363 (39.0%) |
| $1,000 to $1,499 | 243 (26.5%) | 360 (38.7%) |
| $1,500 to $1,999 | 108 (11.8%) | 99 (10.6%) |
| $2,000 to $2,499 | 86 (9.4%) | 25 (2.7%) |
| $2,500 to $2,999 | 59 (6.4%) | 0 (0.0%) |
| $3,000 or more | 12 (1.3%) | 0 (0.0%) |
| Total | 916 (100.0%) | 931 (100.0%) |
Physical Housing Characteristics in Belleville
Housing Structures in Belleville
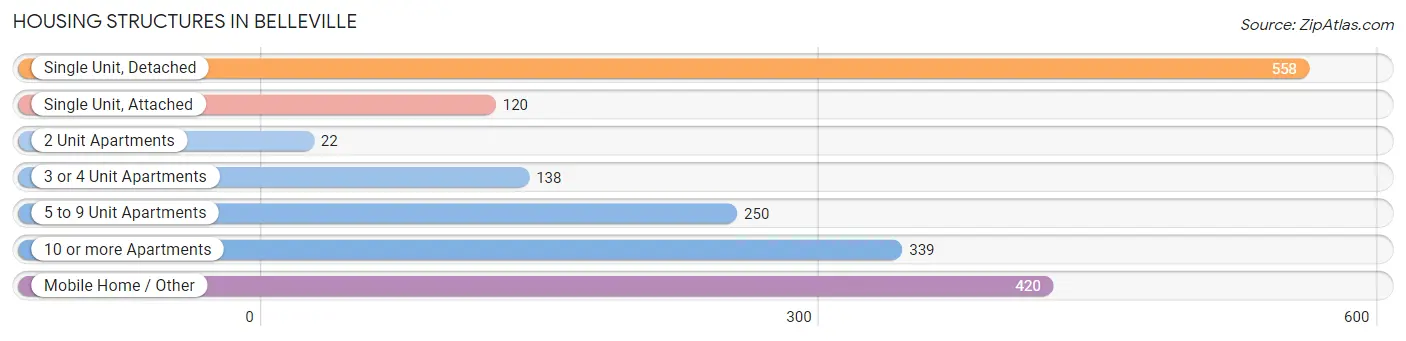
| Structure Type | # Housing Units | % Housing Units |
| Single Unit, Detached | 558 | 30.2% |
| Single Unit, Attached | 120 | 6.5% |
| 2 Unit Apartments | 22 | 1.2% |
| 3 or 4 Unit Apartments | 138 | 7.5% |
| 5 to 9 Unit Apartments | 250 | 13.5% |
| 10 or more Apartments | 339 | 18.3% |
| Mobile Home / Other | 420 | 22.7% |
| Total | 1,847 | 100.0% |
Housing Structures by Occupancy in Belleville
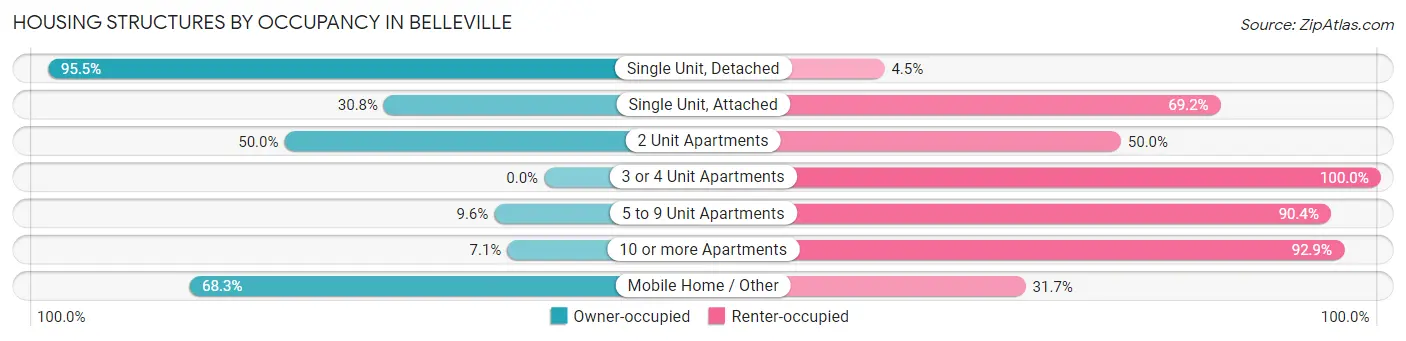
| Structure Type | Owner-occupied | Renter-occupied |
| Single Unit, Detached | 533 (95.5%) | 25 (4.5%) |
| Single Unit, Attached | 37 (30.8%) | 83 (69.2%) |
| 2 Unit Apartments | 11 (50.0%) | 11 (50.0%) |
| 3 or 4 Unit Apartments | 0 (0.0%) | 138 (100.0%) |
| 5 to 9 Unit Apartments | 24 (9.6%) | 226 (90.4%) |
| 10 or more Apartments | 24 (7.1%) | 315 (92.9%) |
| Mobile Home / Other | 287 (68.3%) | 133 (31.7%) |
| Total | 916 (49.6%) | 931 (50.4%) |
Housing Structures by Number of Rooms in Belleville
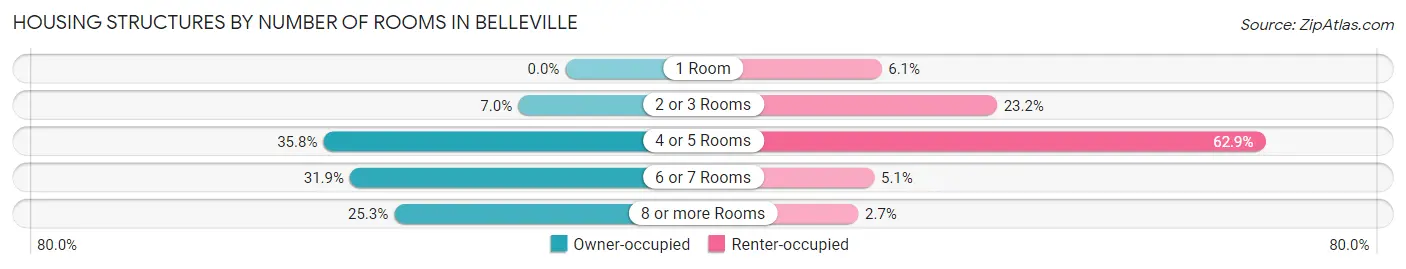
| Number of Rooms | Owner-occupied | Renter-occupied |
| 1 Room | 0 (0.0%) | 57 (6.1%) |
| 2 or 3 Rooms | 64 (7.0%) | 216 (23.2%) |
| 4 or 5 Rooms | 328 (35.8%) | 586 (62.9%) |
| 6 or 7 Rooms | 292 (31.9%) | 47 (5.1%) |
| 8 or more Rooms | 232 (25.3%) | 25 (2.7%) |
| Total | 916 (100.0%) | 931 (100.0%) |
Housing Structure by Heating Type in Belleville
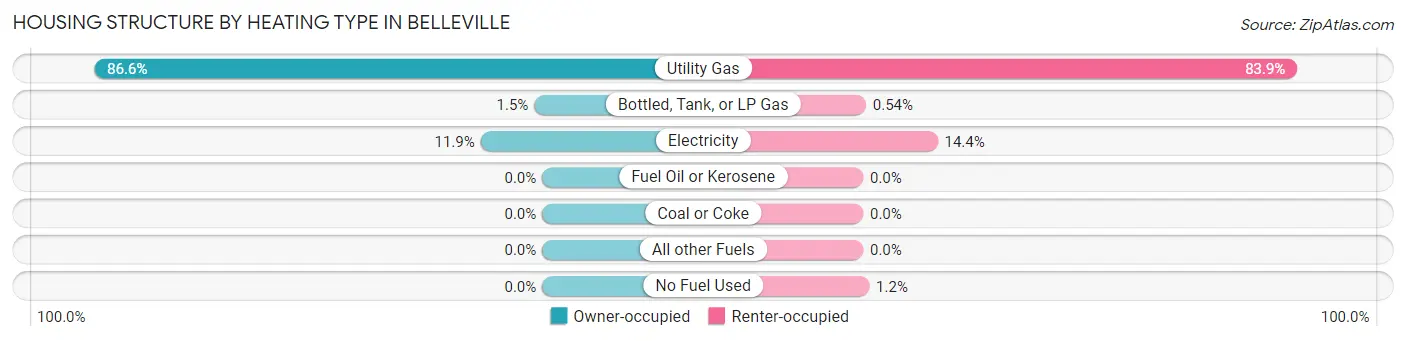
| Heating Type | Owner-occupied | Renter-occupied |
| Utility Gas | 793 (86.6%) | 781 (83.9%) |
| Bottled, Tank, or LP Gas | 14 (1.5%) | 5 (0.5%) |
| Electricity | 109 (11.9%) | 134 (14.4%) |
| Fuel Oil or Kerosene | 0 (0.0%) | 0 (0.0%) |
| Coal or Coke | 0 (0.0%) | 0 (0.0%) |
| All other Fuels | 0 (0.0%) | 0 (0.0%) |
| No Fuel Used | 0 (0.0%) | 11 (1.2%) |
| Total | 916 (100.0%) | 931 (100.0%) |
Household Vehicle Usage in Belleville
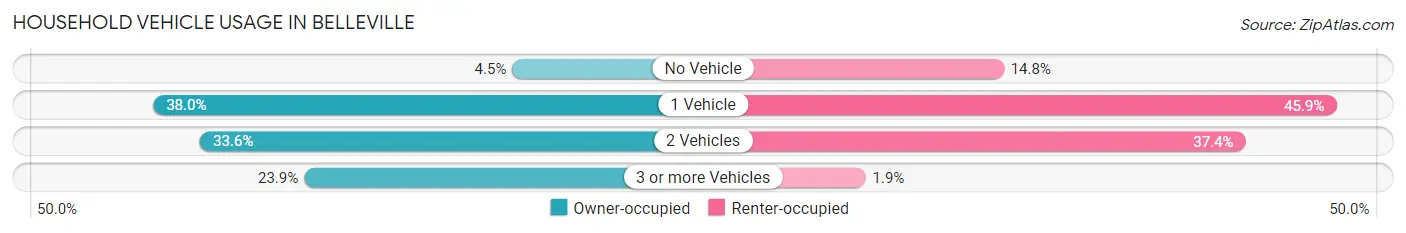
| Vehicles per Household | Owner-occupied | Renter-occupied |
| No Vehicle | 41 (4.5%) | 138 (14.8%) |
| 1 Vehicle | 348 (38.0%) | 427 (45.9%) |
| 2 Vehicles | 308 (33.6%) | 348 (37.4%) |
| 3 or more Vehicles | 219 (23.9%) | 18 (1.9%) |
| Total | 916 (100.0%) | 931 (100.0%) |
Real Estate & Mortgages in Belleville
Real Estate and Mortgage Overview in Belleville
| Characteristic | Without Mortgage | With Mortgage |
| Housing Units | 392 | 524 |
| Median Property Value | $61,900 | $197,100 |
| Median Household Income | $45,000 | $177 |
| Monthly Housing Costs | $814 | $12 |
| Real Estate Taxes | $3,188 | $107 |
Property Value by Mortgage Status in Belleville
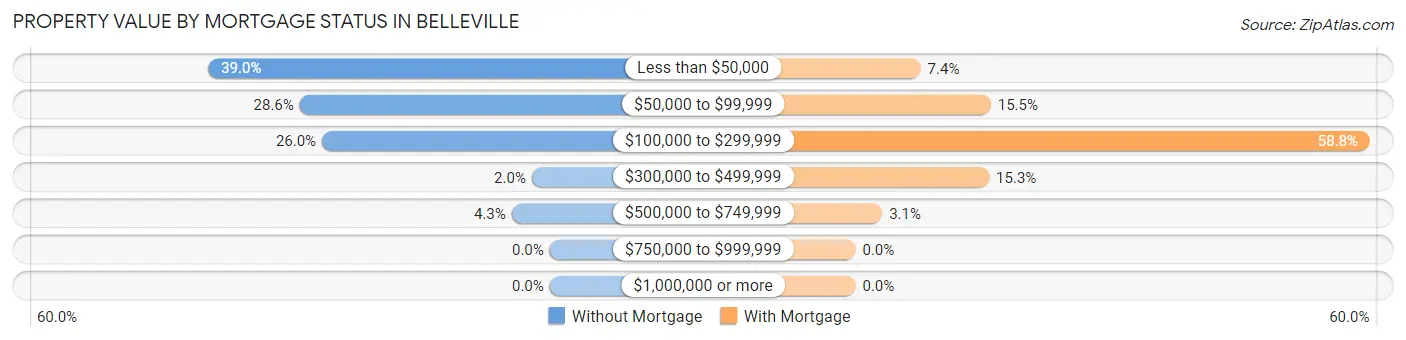
| Property Value | Without Mortgage | With Mortgage |
| Less than $50,000 | 153 (39.0%) | 39 (7.4%) |
| $50,000 to $99,999 | 112 (28.6%) | 81 (15.5%) |
| $100,000 to $299,999 | 102 (26.0%) | 308 (58.8%) |
| $300,000 to $499,999 | 8 (2.0%) | 80 (15.3%) |
| $500,000 to $749,999 | 17 (4.3%) | 16 (3.0%) |
| $750,000 to $999,999 | 0 (0.0%) | 0 (0.0%) |
| $1,000,000 or more | 0 (0.0%) | 0 (0.0%) |
| Total | 392 (100.0%) | 524 (100.0%) |
Household Income by Mortgage Status in Belleville
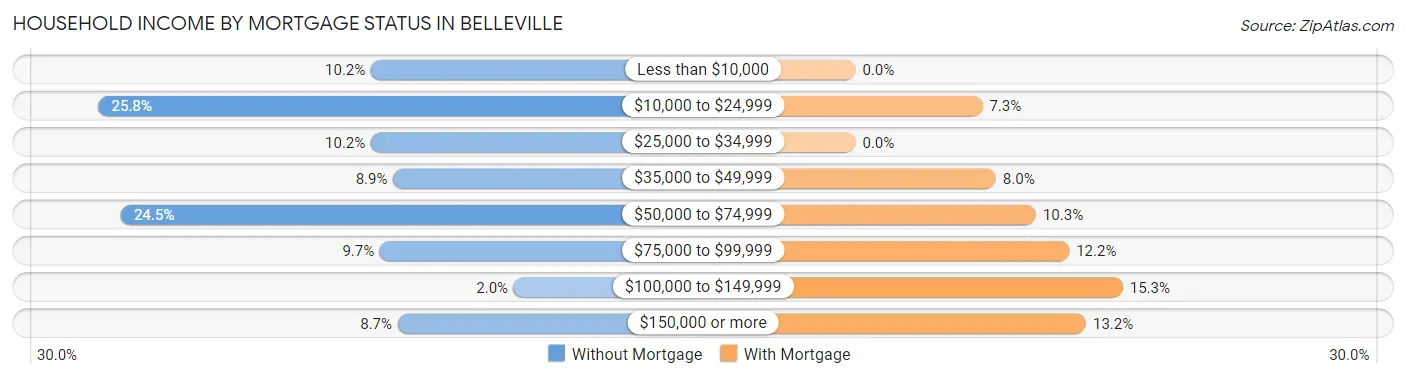
| Household Income | Without Mortgage | With Mortgage |
| Less than $10,000 | 40 (10.2%) | 0 (0.0%) |
| $10,000 to $24,999 | 101 (25.8%) | 38 (7.2%) |
| $25,000 to $34,999 | 40 (10.2%) | 0 (0.0%) |
| $35,000 to $49,999 | 35 (8.9%) | 42 (8.0%) |
| $50,000 to $74,999 | 96 (24.5%) | 54 (10.3%) |
| $75,000 to $99,999 | 38 (9.7%) | 64 (12.2%) |
| $100,000 to $149,999 | 8 (2.0%) | 80 (15.3%) |
| $150,000 or more | 34 (8.7%) | 69 (13.2%) |
| Total | 392 (100.0%) | 524 (100.0%) |
Property Value to Household Income Ratio in Belleville
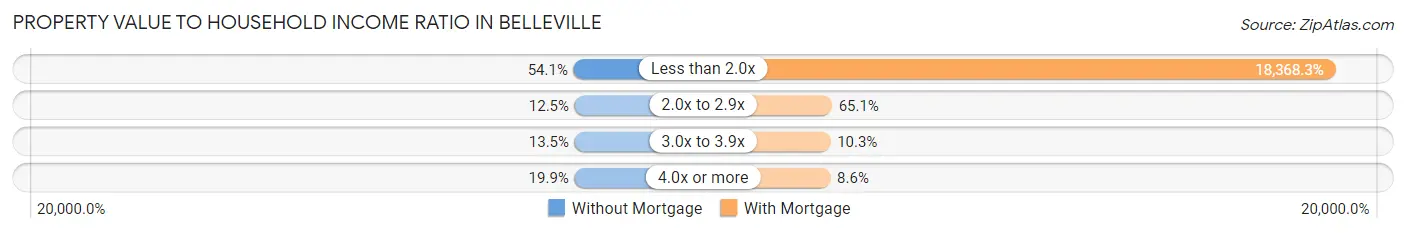
| Value-to-Income Ratio | Without Mortgage | With Mortgage |
| Less than 2.0x | 212 (54.1%) | 96,250 (18,368.3%) |
| 2.0x to 2.9x | 49 (12.5%) | 341 (65.1%) |
| 3.0x to 3.9x | 53 (13.5%) | 54 (10.3%) |
| 4.0x or more | 78 (19.9%) | 45 (8.6%) |
| Total | 392 (100.0%) | 524 (100.0%) |
Real Estate Taxes by Mortgage Status in Belleville
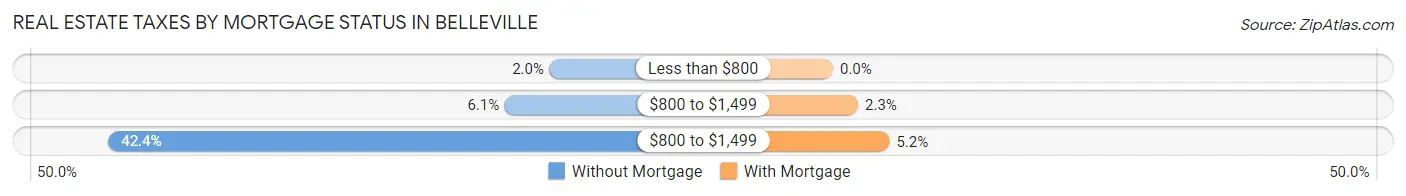
| Property Taxes | Without Mortgage | With Mortgage |
| Less than $800 | 8 (2.0%) | 0 (0.0%) |
| $800 to $1,499 | 24 (6.1%) | 12 (2.3%) |
| $800 to $1,499 | 166 (42.3%) | 27 (5.1%) |
| Total | 392 (100.0%) | 524 (100.0%) |
Health & Disability in Belleville
Health Insurance Coverage by Age in Belleville
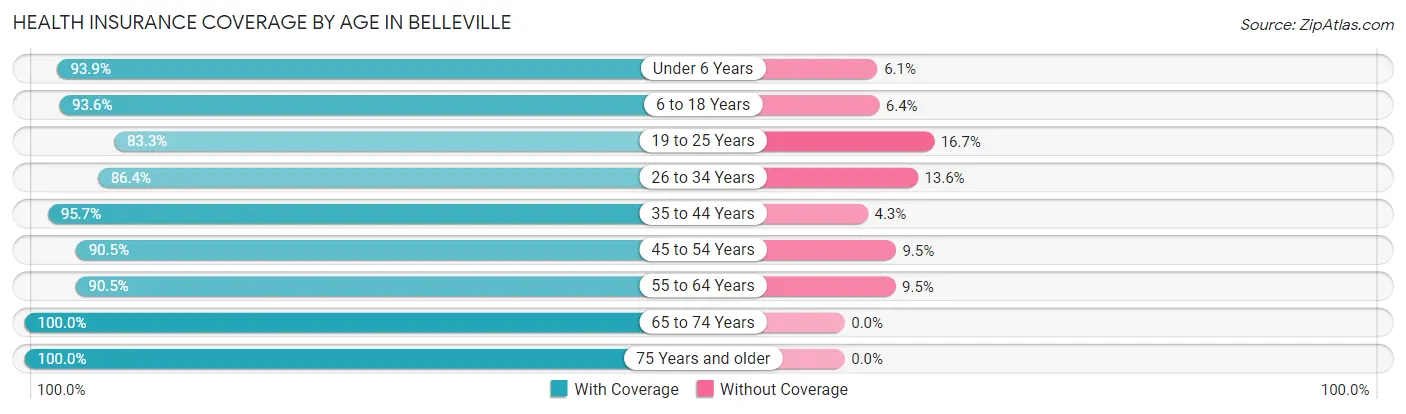
| Age Bracket | With Coverage | Without Coverage |
| Under 6 Years | 367 (93.9%) | 24 (6.1%) |
| 6 to 18 Years | 436 (93.6%) | 30 (6.4%) |
| 19 to 25 Years | 215 (83.3%) | 43 (16.7%) |
| 26 to 34 Years | 519 (86.4%) | 82 (13.6%) |
| 35 to 44 Years | 552 (95.7%) | 25 (4.3%) |
| 45 to 54 Years | 370 (90.5%) | 39 (9.5%) |
| 55 to 64 Years | 468 (90.5%) | 49 (9.5%) |
| 65 to 74 Years | 537 (100.0%) | 0 (0.0%) |
| 75 Years and older | 223 (100.0%) | 0 (0.0%) |
| Total | 3,687 (92.7%) | 292 (7.3%) |
Health Insurance Coverage by Citizenship Status in Belleville
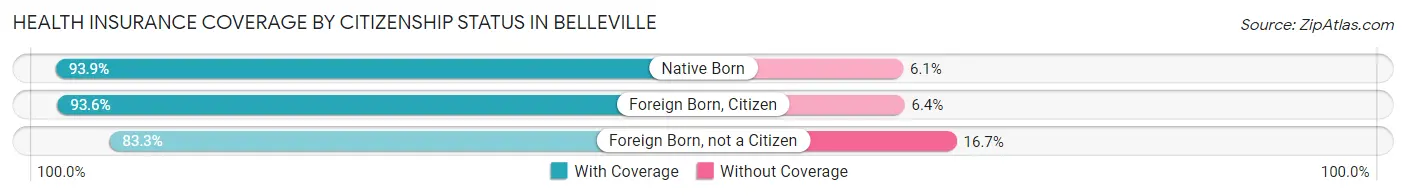
| Citizenship Status | With Coverage | Without Coverage |
| Native Born | 367 (93.9%) | 24 (6.1%) |
| Foreign Born, Citizen | 436 (93.6%) | 30 (6.4%) |
| Foreign Born, not a Citizen | 215 (83.3%) | 43 (16.7%) |
Health Insurance Coverage by Household Income in Belleville
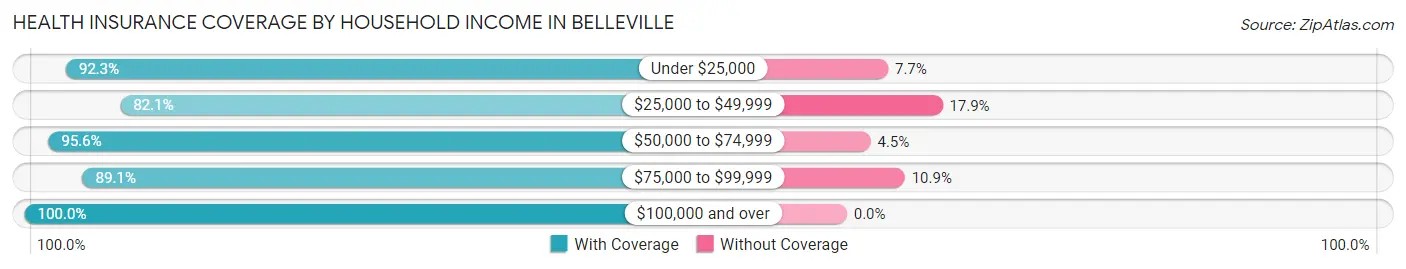
| Household Income | With Coverage | Without Coverage |
| Under $25,000 | 370 (92.3%) | 31 (7.7%) |
| $25,000 to $49,999 | 710 (82.1%) | 155 (17.9%) |
| $50,000 to $74,999 | 751 (95.6%) | 35 (4.4%) |
| $75,000 to $99,999 | 583 (89.1%) | 71 (10.9%) |
| $100,000 and over | 1,260 (100.0%) | 0 (0.0%) |
Public vs Private Health Insurance Coverage by Age in Belleville
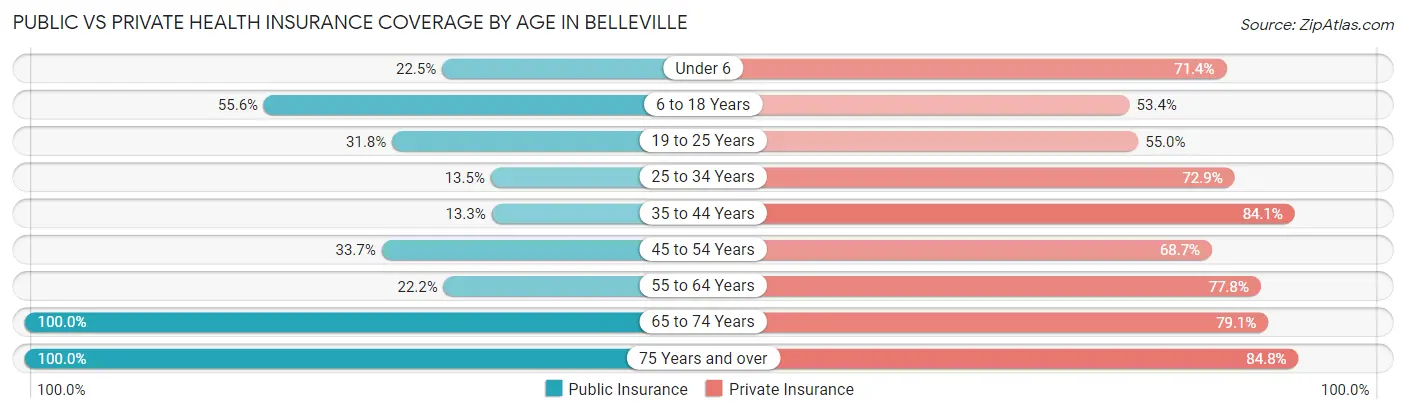
| Age Bracket | Public Insurance | Private Insurance |
| Under 6 | 88 (22.5%) | 279 (71.4%) |
| 6 to 18 Years | 259 (55.6%) | 249 (53.4%) |
| 19 to 25 Years | 82 (31.8%) | 142 (55.0%) |
| 25 to 34 Years | 81 (13.5%) | 438 (72.9%) |
| 35 to 44 Years | 77 (13.3%) | 485 (84.1%) |
| 45 to 54 Years | 138 (33.7%) | 281 (68.7%) |
| 55 to 64 Years | 115 (22.2%) | 402 (77.8%) |
| 65 to 74 Years | 537 (100.0%) | 425 (79.1%) |
| 75 Years and over | 223 (100.0%) | 189 (84.8%) |
| Total | 1,600 (40.2%) | 2,890 (72.6%) |
Disability Status by Sex by Age in Belleville
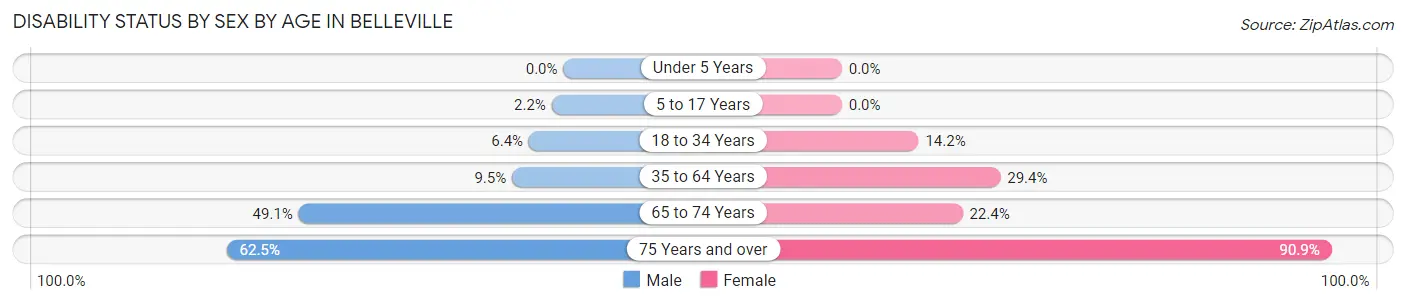
| Age Bracket | Male | Female |
| Under 5 Years | 0 (0.0%) | 0 (0.0%) |
| 5 to 17 Years | 6 (2.2%) | 0 (0.0%) |
| 18 to 34 Years | 20 (6.4%) | 85 (14.2%) |
| 35 to 64 Years | 58 (9.5%) | 263 (29.4%) |
| 65 to 74 Years | 141 (49.1%) | 56 (22.4%) |
| 75 Years and over | 50 (62.5%) | 130 (90.9%) |
Disability Class by Sex by Age in Belleville
Disability Class: Hearing Difficulty
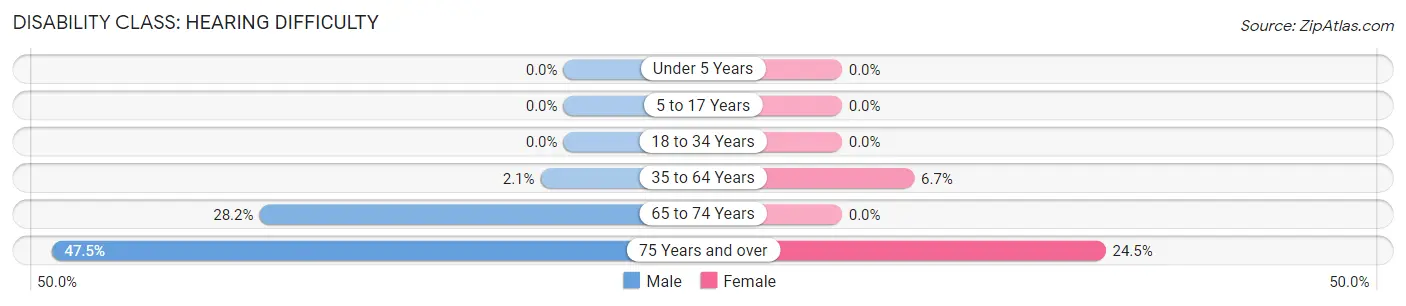
| Age Bracket | Male | Female |
| Under 5 Years | 0 (0.0%) | 0 (0.0%) |
| 5 to 17 Years | 0 (0.0%) | 0 (0.0%) |
| 18 to 34 Years | 0 (0.0%) | 0 (0.0%) |
| 35 to 64 Years | 13 (2.1%) | 60 (6.7%) |
| 65 to 74 Years | 81 (28.2%) | 0 (0.0%) |
| 75 Years and over | 38 (47.5%) | 35 (24.5%) |
Disability Class: Vision Difficulty
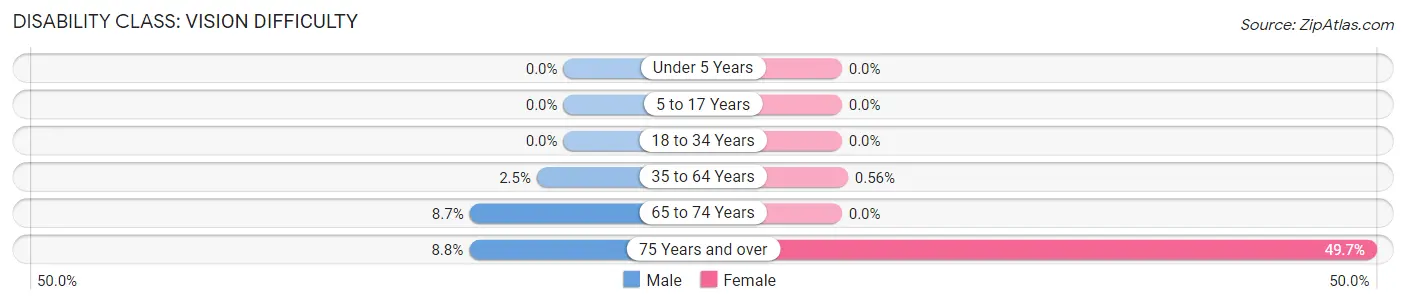
| Age Bracket | Male | Female |
| Under 5 Years | 0 (0.0%) | 0 (0.0%) |
| 5 to 17 Years | 0 (0.0%) | 0 (0.0%) |
| 18 to 34 Years | 0 (0.0%) | 0 (0.0%) |
| 35 to 64 Years | 15 (2.5%) | 5 (0.6%) |
| 65 to 74 Years | 25 (8.7%) | 0 (0.0%) |
| 75 Years and over | 7 (8.7%) | 71 (49.6%) |
Disability Class: Cognitive Difficulty
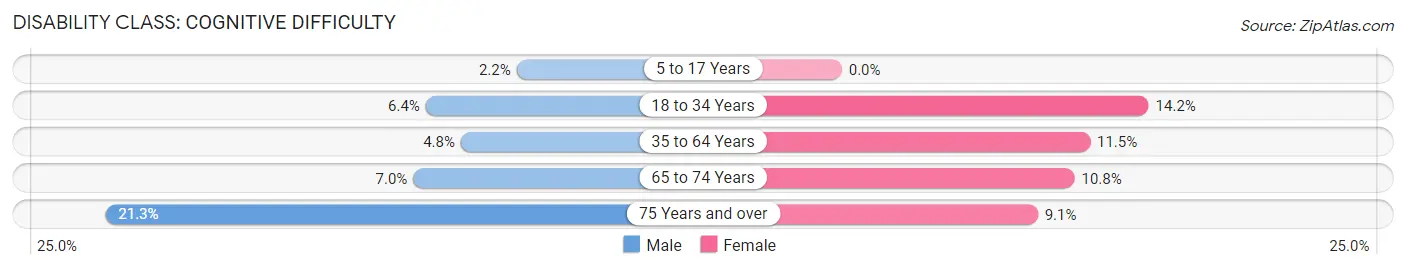
| Age Bracket | Male | Female |
| 5 to 17 Years | 6 (2.2%) | 0 (0.0%) |
| 18 to 34 Years | 20 (6.4%) | 85 (14.2%) |
| 35 to 64 Years | 29 (4.8%) | 103 (11.5%) |
| 65 to 74 Years | 20 (7.0%) | 27 (10.8%) |
| 75 Years and over | 17 (21.2%) | 13 (9.1%) |
Disability Class: Ambulatory Difficulty
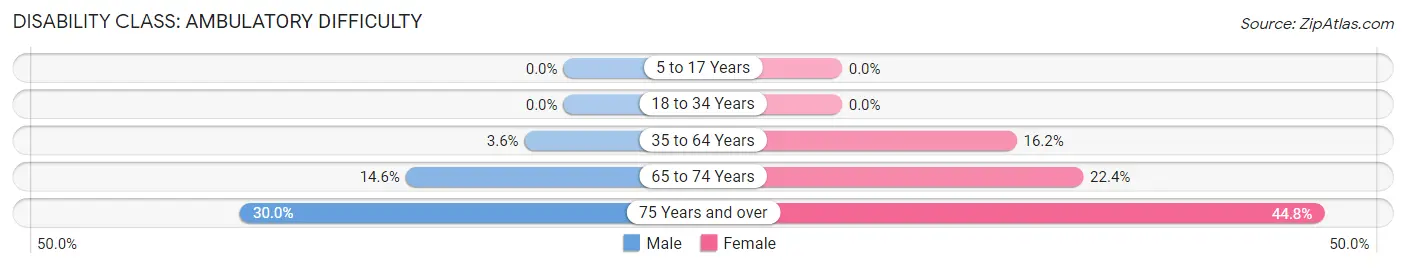
| Age Bracket | Male | Female |
| 5 to 17 Years | 0 (0.0%) | 0 (0.0%) |
| 18 to 34 Years | 0 (0.0%) | 0 (0.0%) |
| 35 to 64 Years | 22 (3.6%) | 145 (16.2%) |
| 65 to 74 Years | 42 (14.6%) | 56 (22.4%) |
| 75 Years and over | 24 (30.0%) | 64 (44.8%) |
Disability Class: Self-Care Difficulty
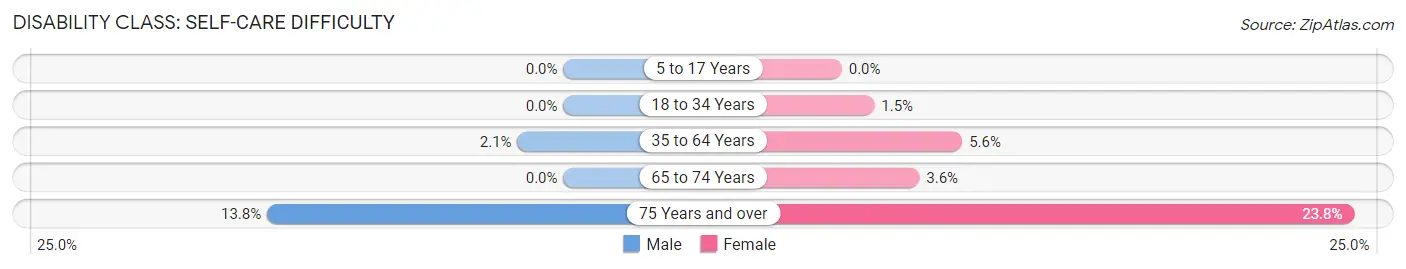
| Age Bracket | Male | Female |
| 5 to 17 Years | 0 (0.0%) | 0 (0.0%) |
| 18 to 34 Years | 0 (0.0%) | 9 (1.5%) |
| 35 to 64 Years | 13 (2.1%) | 50 (5.6%) |
| 65 to 74 Years | 0 (0.0%) | 9 (3.6%) |
| 75 Years and over | 11 (13.8%) | 34 (23.8%) |
Technology Access in Belleville
Computing Device Access in Belleville
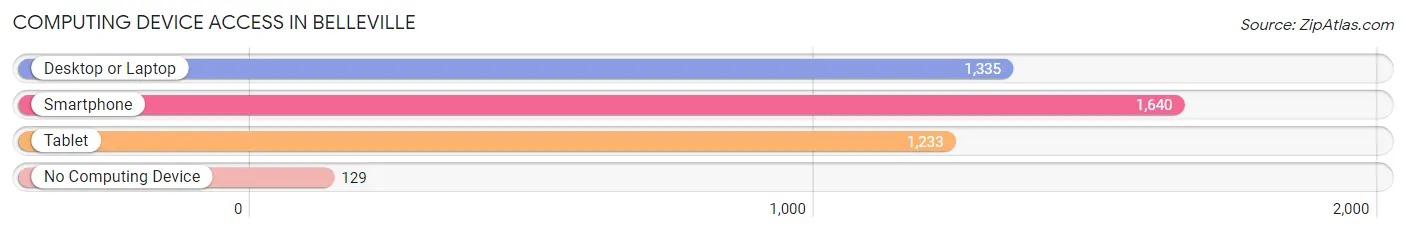
| Device Type | # Households | % Households |
| Desktop or Laptop | 1,335 | 72.3% |
| Smartphone | 1,640 | 88.8% |
| Tablet | 1,233 | 66.8% |
| No Computing Device | 129 | 7.0% |
| Total | 1,847 | 100.0% |
Internet Access in Belleville
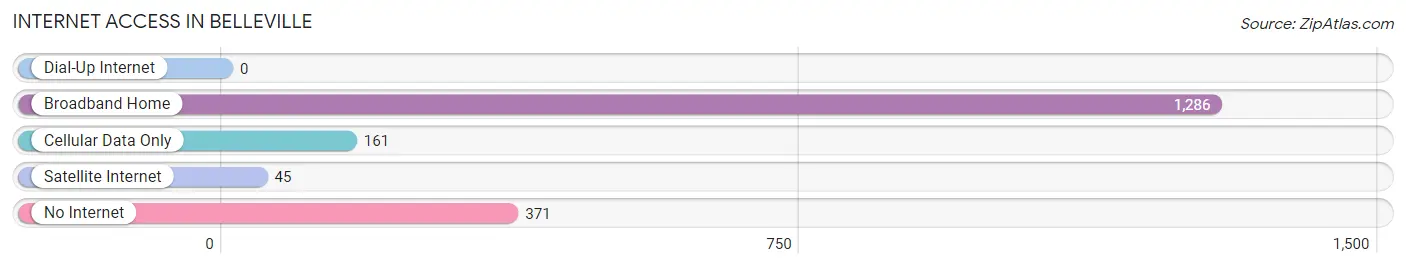
| Internet Type | # Households | % Households |
| Dial-Up Internet | 0 | 0.0% |
| Broadband Home | 1,286 | 69.6% |
| Cellular Data Only | 161 | 8.7% |
| Satellite Internet | 45 | 2.4% |
| No Internet | 371 | 20.1% |
| Total | 1,847 | 100.0% |
Belleville Summary
Belleville is a city located in Wayne County, Michigan, United States. It is part of the Detroit metropolitan area and is located about 20 miles southwest of Detroit. As of the 2010 census, the city had a population of 3,991.
History
Belleville was first settled in 1825 by a group of French-Canadian immigrants. The town was originally called Frenchtown, but was later changed to Belleville in 1837. The name is derived from the French word for “beautiful town”. The town was incorporated as a village in 1867 and as a city in 1929.
Belleville was an important stop on the Underground Railroad, with many slaves escaping to Canada via the Detroit River. The city was also home to the first public school in Michigan, which opened in 1827.
Geography
Belleville is located at 42°14′N 83°30′W (42.23, -83.50). According to the United States Census Bureau, the city has a total area of 3.2 square miles (8.3 km2), all land.
Economy
Belleville’s economy is largely based on manufacturing and retail. The city is home to several automotive parts suppliers, including the headquarters of the American Axle & Manufacturing Company. Other major employers include the Belleville Public Schools, the City of Belleville, and the Van Buren Public Schools.
Demographics
As of the 2010 census, there were 3,991 people, 1,541 households, and 1,039 families residing in the city. The population density was 1,243.3 people per square mile (479.2/km2). There were 1,717 housing units at an average density of 535.2 per square mile (206.7/km2). The racial makeup of the city was 87.2% White, 8.2% African American, 0.3% Native American, 0.7% Asian, 0.1% Pacific Islander, 1.2% from other races, and 2.3% from two or more races. Hispanic or Latino of any race were 3.7% of the population.
There were 1,541 households, out of which 33.2% had children under the age of 18 living with them, 44.2% were married couples living together, 17.2% had a female householder with no husband present, and 33.2% were non-families. 28.2% of all households were made up of individuals, and 10.2% had someone living alone who was 65 years of age or older. The average household size was 2.58 and the average family size was 3.17.
In the city, the population was spread out, with 27.2% under the age of 18, 8.7% from 18 to 24, 30.2% from 25 to 44, 21.3% from 45 to 64, and 12.6% who were 65 years of age or older. The median age was 35 years. For every 100 females, there were 91.2 males. For every 100 females age 18 and over, there were 87.2 males.
The median income for a household in the city was $41,944, and the median income for a family was $50,000. Males had a median income of $37,917 versus $27,917 for females. The per capita income for the city was $19,945. About 8.2% of families and 10.2% of the population were below the poverty line, including 14.2% of those under age 18 and 6.2% of those age 65 or over.
Common Questions
What is Per Capita Income in Belleville?
Per Capita income in Belleville is $35,437.
What is the Median Family Income in Belleville?
Median Family Income in Belleville is $79,722.
What is the Median Household income in Belleville?
Median Household Income in Belleville is $55,979.
What is Income or Wage Gap in Belleville?
Income or Wage Gap in Belleville is 39.6%.
Women in Belleville earn 60.4 cents for every dollar earned by a man.
What is Inequality or Gini Index in Belleville?
Inequality or Gini Index in Belleville is 0.46.
What is the Total Population of Belleville?
Total Population of Belleville is 3,979.
What is the Total Male Population of Belleville?
Total Male Population of Belleville is 1,767.
What is the Total Female Population of Belleville?
Total Female Population of Belleville is 2,212.
What is the Ratio of Males per 100 Females in Belleville?
There are 79.88 Males per 100 Females in Belleville.
What is the Ratio of Females per 100 Males in Belleville?
There are 125.18 Females per 100 Males in Belleville.
What is the Median Population Age in Belleville?
Median Population Age in Belleville is 40.2 Years.
What is the Average Family Size in Belleville
Average Family Size in Belleville is 3.2 People.
What is the Average Household Size in Belleville
Average Household Size in Belleville is 2.1 People.
How Large is the Labor Force in Belleville?
There are 1,965 People in the Labor Forcein in Belleville.
What is the Percentage of People in the Labor Force in Belleville?
57.7% of People are in the Labor Force in Belleville.
What is the Unemployment Rate in Belleville?
Unemployment Rate in Belleville is 8.5%.